Физические упражнения для лечения хронической венозной недостаточности без образования язв
Abstract
Background
Chronic venous insufficiency (CVI) is a common disease that causes discomfort and impairs the quality of life of affected persons. Treatments such as physical exercise that aim to increase the movement of the ankle joint and strengthen the muscle pump in the calf of the leg may be useful to reduce the symptoms of CVI.
Objectives
To assess and summarise the existing clinical evidence on the efficacy and safety of physical exercise programmes for the treatment of individuals with non‐ulcerated CVI.
Search methods
The Cochrane Vascular Information Specialist (CIS) searched the Cochrane Vascular Specialised Register (May 2016). In addition, the CIS searched the Cochrane Central Register of Controlled Trials (CENTRAL; 2016, Issue 4) and trial databases for details of ongoing or unpublished studies.
Selection criteria
Randomised controlled trials (RCTs) comparing exercise with no exercise programmes.
Data collection and analysis
Two review authors independently assessed the search results and selected eligible studies. We resolved disagreements by discussion. We summarised and double‐checked details from included studies. We attempted to contact trial authors for missing data, but obtained no further information.
Main results
We included two trials involving 54 participants with CVI. Many of our review outcomes were not reported or reported by only one of the two studies. The intensity of disease signs and symptoms was measured in both studies but using different scales; we were therefore unable to pool the data. One study reported no difference between the exercise and control groups whereas the second reported a reduction in symptoms in the exercise group. In one study, increases in change in ejection fraction compared with baseline (mean difference (MD) 4.88%, 95% confidence interval (CI) 3.16 to 6.60; 30 participants; P < 0.00001), half venous refilling time (MD 4.20 seconds, 95% CI 3.28 to 5.12; 23 participants; P < 0.00001) and total venous refilling time (MD 9.40 seconds, 95% CI 7.77 to 11.03; 23 participants; P < 0.00001) were observed in the exercise group compared with the control group. One study reported no difference between the exercise and control groups with regard to quality of life or ankle range of motion. Although muscle strength assessed by dynamometry at slow speed did not differ between the two groups in this study, variable peak torque at fast speed was lower in the control group than in the exercise group (2.8 ± 0.9 compared with ‐0.3 ± 0.6, P < 0.03). The incidence of venous leg ulcers, incidence of surgical intervention to treat symptoms related to CVI and exercise capacity were not assessed or reported in either of the included trials. We rated both included studies as at high risk of bias; hence, these data should be interpreted carefully. Due to the small number of studies and small sample size, we were not able to verify indirectness and publication bias. Therefore, we judged the overall quality of evidence as very low according to the GRADE approach.
Authors' conclusions
There is currently insufficient evidence available to assess the efficacy of physical exercise in people with CVI. Future research into the effect of physical exercise should consider types of exercise protocols (intensity, frequency and time), sample size, blinding and homogeneity according to the severity of disease.
PICO
Резюме на простом языке
Могут ли физические упражнения улучшить кровоток в венах?
Актуальность
Вены представляют собой тип кровеносных сосудов, которые несут кровь от всего организма обратно к сердцу (называется венозным возвратом крови). Этому процессу способствует сокращение ряда мышечных насосов (сокращение скелетной мускулатуры) на ногах. Проблемы с венами или мышечным насосом в ногах у некоторых людей могут привести к ухудшению этого процесса, что приводит к состоянию, известному как хроническая венозная недостаточность (ХВН). ХВН может вызывать боль, отек (задержка жидкости приводит к отечности) и развитие язв на ногах, а также может привести к ухудшению качества жизни человека. Исследования предполагают, что лечение, такое, как физические упражнения, которые направлены на увеличение движения голеностопного сустава и укрепление мышечного насоса в икроножных мышцах ноги, могут быть полезны для предотвращения обострения заболевания и его последствий. Мы рассмотрели доказательства в поддержку использования физических упражнений в качестве лечения ХВН.
Характеристика исследований и основные результаты
Этот обзор включал два клинических испытания с участием в общей сложности 54 участников, в которых непосредственно сравнивались эффекты физических упражнений и контрольного вмешательства (доказательства актуальны на май 2016 года). В одном исследовании сообщали об отсутствии различий между группой, в которых использовали упражнения, и контрольной группой, в то время как во втором сообщали об уменьшении симптомов в группе упражнений. В конце исследования наблюдалось улучшение венозного возврата крови в группе упражнений по сравнению с контрольной группой. Во включенных исследованиях не сообщали о новых случаях развития язв нижних конечностей. Не было различий между группой, в которой использовали упражнения, и контрольной группой в отношении качества жизни участников, диапазона движения голеностопного сустава или общей мышечной силы. Общий результат улучшения венозного возврата крови в группе упражнений поддерживает идею, что физические упражнения улучшают состояние кровотока у людей с ХВН, но мы обнаружили, что риск смещения, связанного с ослеплением и рандомизацией, был высоким для обоих исследований. Поэтому мы считаем, что в настоящее время имеется недостаточно информации, чтобы определить, являются ли физические упражнения эффективными в лечении ХВН.
Качество доказательств
Мы оценили общее качество доказательств как очень низкое: два включенных исследования были небольшими (54 участника в общей сложности) и имели высокий риск смещения, связанный с методами ослепления или рандомизации.
Authors' conclusions
Summary of findings
| Physical exercise compared with no treatment for non‐ulcerated chronic venous insufficiency | |||||
| Population: People with non‐ulcerated chronic venous insufficiency | |||||
| Outcomes | Anticipated absolute effects* (95% CI) | Relative effect | No. of participants | Quality of the evidence | |
| Risk with no exercise | Risk with physical exercise | ||||
| Intensity of disease signs and symptoms1 | see footnotes1 | ||||
| Ejection fraction Follow up: 24 weeks | The mean change in ejection fraction from baseline was ‐1.4% | The mean change in ejection fraction from baseline in the intervention group was 4.88% more (3.16 more to 6.6 more) | 30 | ⊕⊖⊖⊖ | |
| Half refilling time Follow up: 24 weeks | The mean half refilling time was 7.1 seconds | The mean half refilling time in the intervention group was 4.20 seconds more (3.28 more to 5.12 more) | 23 | ⊕⊖⊖⊖ | |
| Total refilling time Follow up: 24 weeks | The mean total refilling time was 16.3 seconds | The mean total refilling time in the intervention group was 9.40 seconds more (7.77 more to 11.03 more) | 23 | ⊕⊖⊖⊖ | |
| Incidence of venous leg ulcer3 | ‐ | ‐ | ‐ | see footnote3 | |
| *The risk in the intervention group (and its 95% confidence interval) is based on the assumed risk in the comparison group and the relative effect of the intervention (and its 95% CI) | |||||
| GRADE Working Group grades of evidence | |||||
| 1 unable to pool data because data were collected using different tools | |||||
Background
Description of the condition
Chronic venous disease is defined as long‐standing morphological and functional venous abnormalities that may or may not be symptomatic. This condition can be present in a less‐severe manifestation such as telangiectasia (small dilated blood vessels) or may progress to varicose veins and even skin ulceration (Beebe‐Dimmer 2005; Staffa 2002). Chronic venous insufficiency (CVI) is often clinically defined as functional abnormalities of the venous system resulting in changes in skin and subcutaneous tissue (Eklof 2004; Evans 1999). CVI is more common in the elderly than in younger individuals (De Araujo 2003; Wipke‐Tevis 2000) and is the main cause of venous ulceration (De Araujo 2003). The age‐adjusted prevalence of CVI is estimated to be around 9% in men and 7% in women (Evans 1999) and it constitutes an economic burden to public health, especially when venous ulceration is present (De Araujo 2003; Wipke‐Tevis 2000). Risk factors associated with CVI include family history, female gender, number of pregnancies, old age, lifestyle and occupational activities. Its development is thought to be related to sustaining an erect posture (Beebe‐Dimmer 2005; Staffa 2002).
Physical alterations related to CVI, such as oedema, hyperpigmentation, eczema and lipodermatosclerosis, occur mainly in the lower limbs. These alterations are the consequence of valvular insufficiency or venous obstruction, resulting in long‐term venous hypertension due to venous stasis in the lower limbs. Foot, calf and thigh muscle pump function may be impaired in people with CVI (Meissner 2005). Because these muscles are the strongest power source for venous return in the lower limbs, this contributes to progression of the disease (Goldman 1989).
The diagnosis of CVI is primarily based on clinical examination and history. There is a widely accepted international classification, the CEAP (Clinical, Etiology, Anatomy, Pathophysiology) classification, which was developed to assist with the reporting and diagnosing of chronic venous disease (Eklof 2004) (Table 1). Additional specific tests, such as venous duplex imaging, plethysmography, phlebography and the ankle‐brachial index (ABI) test, can be used to make differential diagnoses (Collins 2010; Eberhardt 2005). Common symptoms are itching and burning sensations in the lower limbs, and pain, which have a marked impact on the quality of life (QoL) of individuals with this disease (Duque 2005).
| Classification | Description/Definition |
| Clinical | |
| 0 | no visible or palpable signs of venous disease |
| 1 | telangiectases or reticular veins |
| 2 | varicose veins |
| 3 | oedema |
| 4a | pigmentation or eczema |
| 4b | lipodermatosclerosis or atrophie blanchie |
| 5 | healed venous ulcer |
| 6 | active venous ulcer |
| S | symptomatic, including ache, pain, tightness, skin irritation, heaviness, muscle cramp and other complaints attributable to venous dysfunction |
| A | asymptomatic |
| Etiologyl | |
| Ec | congenital (present since birth) |
| Ep | primary |
| Es | secondary (post‐thrombotic, traumatic) |
| En | no venous cause identified |
| Anatomy distribution | |
| As | superficial (great and short saphenous veins) |
| Ap | perforator (thigh and leg perforating veins) |
| Ad | deep (cava, iliac, gonadal, femoral, profunda, popliteal, tibial, and muscular veins) |
| An | no venous location identified |
| Pathophysiology | |
| Pr | reflux (axial and perforating veins) |
| Po | obstruction (acute and chronic) |
| Pr,o | combination of both reflux and obstruction (valvular dysfunction and thrombus) |
| Pn | no venous pathophysiology identified |
CEAP classification: classification of chronic venous disease according to clinical manifestation, etiologic factors, anatomic distribution of disease, and underlying pathophysiologic findings
See Eklof 2004 for further details about CEAP
Description of the intervention
Exercise modalities have been prescribed for the treatment of individuals with peripheral vascular disease (PVD) of different aetiologies. Data also support the use of exercise for the treatment of individuals with peripheral arterial disease (PAD) (Rooke 2011); however, the prescription of exercise for people with CVI is not well established (Davies 2008). Overall, physical activity has been associated with a marked decrease in cardiovascular mortality and all‐cause mortality (Nocon 2008). Prescribed exercise has been recommended for the primary prevention of cardiovascular disease and its effects include, but are not limited to, glycaemic control; an increase in high‐density lipoprotein (HDL) cholesterol; a reduction in blood pressure; weight loss; a reduction in depression, anxiety and psychological stress; and increases in cardiorespiratory fitness and muscle strength (Metkus 2010). In the clinical setting, exercises to increase ankle joint mobility or the flexibility and strength of the calf muscles have been recommended in individuals with CVI, with the aim of improving muscle pump function and, therefore, haemodynamics (Kan 2001; Yang 1999).
How the intervention might work
Studies have shown that the application of a physical exercise programme may have a number of benefits: reducing oedema of the lower limbs; improving the haemodynamic performance of the calf muscle through the strengthening of these muscles; and improving cardiorespiratory fitness, which in turn improves functional capacity and QoL (Padberg 2004; Quilici 2009). Exercise programmes usually consist of the stretching and strengthening of lower limb muscles together with aerobic exercises that aim to improve venous return, such as walking. Even very small movements of the lower limbs may promote the important pumping action of the venous blood (Bergan 2006). Researchers suggest that treatments which aim to increase the movement of the ankle joint, with consequent strengthening of the calf muscle pump, improve the calf muscle pump function through an increase in the ejection fraction and a decrease in the residual fraction in the early stages of CVI; this may be useful in the prevention of disease progression and its consequences (Yang 1999).
Why it is important to do this review
CVI is a highly prevalent PVD. The disease can progress to a phase where subcutaneous alterations become evident and develop into a venous leg ulcer, which is a chronic hard‐to‐heal wound. Interventions that can improve the disease or reduce its progress are desirable. Therapeutic exercise, especially when prescribed in association with therapeutic compression, is usually indicated for individuals with CVI. However, no up‐to‐date systematic review is available that has assessed the effects of exercise on non‐ulcerated CVI. Furthermore, although CVI is highly prevalent in the elderly (Brand 1988; Heit 2001) the effects and safety of exercise prescription on CVI have not been systematically reviewed in this population. This present review will help to determine the safety and possible benefits of exercise prescription in the treatment of individuals with non‐ulcerated CVI. If effective, physical exercise may be considered a low‐cost treatment regimen that can be adopted by healthcare providers for the treatment of people with CVI and the prevention of disease progression. We do not assess the effects of exercise on chronic venous leg ulcer healing in this review.
Objectives
To assess and summarise the existing clinical evidence on the efficacy and safety of physical exercise programmes for the treatment of individuals with non‐ulcerated CVI.
Methods
Criteria for considering studies for this review
Types of studies
We included randomised controlled trials (RCTs) in which an exercise programme was used as the main or adjunctive treatment in individuals non‐ulcerated CVI.
Types of participants
We included RCTs involving individuals with non‐ulcerated CVI regardless of sex and ethnicity.
We used the CVI diagnosis as given by trial authors because the classification of CVI could differ between studies: some may have included individuals with a CEAP C score of 3‐5, and others may have included individuals with less severe clinical manifestation, as designated by a CEAP C score of 2, and defined them as having CVI.
We included studies conducted in both non‐ulcerated and ulcerated CVI participants provided the outcomes for these two groups were reported separately. This is because the major outcomes for individuals with leg ulcers (for example, percentage reduction in ulcer area or percentage of fully healed ulcers) differ from those in people with non‐ulcerated CVI and it would be difficult to assess them within the same review. However, if data for the two groups were not analysed and presented separately and the exercise treatment was carried out in some individuals with CVI and leg ulcers, we included the study only if these participants comprised less than 25% of the total number of study participants.
We did not assess the effects of exercise on venous leg ulcer healing in this review.
We did not include studies in which the exercise treatment was investigated in individuals with PAD, unless the results were reported separately for the CVI subgroup.
Types of interventions
We compared supervised or unsupervised prescribed exercise programmes as the main or adjunctive treatment in individuals with non‐ulcerated CVI with either the same protocol without exercise or without treatment. We considered studies using compression stockings in the exercise or control group for inclusion.
Types of outcome measures
Primary outcomes
1) Intensity of disease signs and symptoms, measured using a validated instrument such as the Venous Clinical Severity Score (Rutherford 2000; Vasquez 2010) (see Table 2)
| Clinical descriptor | Absent (0) | Mild (1) | Moderate (2) | Severe (3) |
| Pain | None | Occasional | Daily not limiting | Daily limiting |
| Varicose veins | None | Few | Calf or thigh | Calf and thigh |
| Venous oedema | None | Foot and ankle | Below knee | Knee and above |
| Skin pigmentation | None | Limited perimalleolar | Diffuse lower 1/3 calf | Wider above lower 1/3 calf |
| Inflammation | None | Limited perimalleolar | Diffuse lower 1/3 calf | Wider above lower 1/3 calf |
| Induration | None | Limited perimalleolar | Diffuse lower 1/3 calf | Wider above lower 1/3 calf |
| Number of active ulcers | None | 1 | 2 | 3 or more |
| Ulcer duration | None | < 3 month | 3 ‐ 12 month | > 1 year |
| Active ulcer size | None | < 2 cm | 2 ‐ 6 cm | > 6 cm |
| Compression therapy | None | Intermittent | Most days | Fully comply |
2) Ejection fraction, measured using air plethysmography or duplex ultrasonography
3) Venous refilling time, measured using plethysmography
4) Incidence of venous leg ulcer
Secondary outcomes
1) QoL, measured using validated instruments (such as the Venous Insufficiency Epidemiological and Economic Study QoL and Symptoms (VEINES‐QOL/Sym) or the Short‐Form‐36 (SF‐36) questionnaires)
2) Exercise capacity, measured using an objective test, such as the six‐minute walk test or the maximum distance walked on a treadmill
3) Muscle strength, measured using dynamometry
4) Incidence of the use of surgical intervention to treat symptoms related to CVI
5) Ankle joint mobility
Search methods for identification of studies
Electronic searches
The Cochrane Vascular Information Specialist (CIS) searched the Cochrane Vascular Specialised Register (May 2016). In addition the CIS searched the Cochrane Central Register of Controlled Trials (CENTRAL); 2016, Issue 4) via the Cochrane Register of Studies (CRS) Online. See Appendix 1 for details of the search strategy used to search the CRS. The Cochrane Vascular Specialised Register is maintained by the CIS and is constructed from weekly electronic searches of MEDLINE, Embase, CINAHL, AMED, and through handsearching relevant journals. The full list of the databases, journals and conference proceedings which we searched, as well as the search strategies we used are described in the Specialised Register section of the Cochrane Vascular module in the Cochrane Library.
The CIS searched the following trial databases (May 2016) for details of ongoing and unpublished studies using the terms (incompetence and exercise) and (insufficiency and exercise):
-
World Health Organization International Clinical Trials Registry (http://apps.who.int/trialsearch/);
-
ClinicalTrials.gov (http://clinicaltrials.gov/);
-
ISRCTN Register (http://www.isrctn.com/).
Searching other resources
We searched the bibliographies of relevant publications identified through the above strategies for further studies. We attempted to contact trial authors to obtain unpublished data and information as required.
We imposed no restrictions on language or publication status for studies eligible for inclusion in the review.
Data collection and analysis
Selection of studies
Two review authors (DA and FD) independently screened the titles and abstracts of the studies identified by the search strategy against the inclusion criteria. We obtained full versions of articles that appeared to fulfil the inclusion criteria for further assessment. We intended to resolve any discrepancies by discussion with a third review author (GF), but this was not necessary. We recorded all reasons for study exclusion. We have presented our study selection process as a PRISMA (Preferred Reporting Items for Systematic Reviews and Meta‐Analyses) flow diagram (Liberati 2009) (see Results of the search).
Data extraction and management
Two review authors (DA and FD), working independently, extracted data, summarised details of trials using a standard data extraction sheet and entered data into Review Manager 5.3 (RevMan 2014). We then compared the data extractions and agreed a final version after discussion. We intended to resolve any discrepancies by discussion with a third review author (GF), but this was not necessary. If data were missing from reports we attempted to contact the trial authors to obtain the missing information. Where reported, we extracted the following information according to methods described in the Cochrane Handbook for Systematic Reviews of Interventions (Higgins 2011a):
-
country of origin;
-
study authors and year of publication;
-
publication type;
-
study design;
-
care setting;
-
type of participants;
-
method of recruitment of participants;
-
types of outcome measures;
-
unit of investigation (per participant, cluster);
-
number of participants randomised to each trial;
-
eligibility criteria and key baseline participant data (gender, age, ethnicity, disease duration, prevalence of comorbidities such as diabetes and PAD);
-
details of the treatment regimen received by each group;
-
type of exercise;
-
details of any cointerventions;
-
primary and secondary outcome(s) with definitions;
-
outcome data for primary and secondary outcomes (by group);
-
overall sample size and methods used to estimate statistical power (relates to the target number of participants to be recruited, the clinical difference to be detected and the ability of the trial to detect this difference);
-
duration of treatment period;
-
duration of follow‐up;
-
number of withdrawals (by group with reasons);
-
statistical methods used for data analysis;
-
'Risk of bias' criteria (sequence generation, allocation concealment, blinding, incomplete outcome data, selective outcome reporting);
-
adverse events;
-
source of funding.
Assessment of risk of bias in included studies
Two review authors (DA and FD) independently assessed each included study using the Cochrane Collaboration's tool for assessing risk of bias. This tool addresses six specific domains, namely random sequence generation, allocation concealment, blinding of participants and personnel, incomplete outcome data, selective outcome reporting and other sources of bias (see Appendix 2 for details of the criteria on which we based our judgements). We assessed blinding and completeness of outcome data for each outcome separately. We intended to search the protocols of all included RCTs in order to assess selective outcome reporting. When no protocol was identified, we made a judgement based on the congruence of information in the methods and results sections of the reports of RCTs. We completed a 'Risk of bias' table for each eligible study and classified them as being at high, low or unclear risk, according to the methods described in Chapter 8 of the Cochrane Handbook for Systematic Reviews of Interventions (Higgins 2011b).
We present our assessment using a 'Risk of bias' summary figure, which presents all of our judgements in a cross‐tabulation of study by entry. This display of internal validity indicates the weight the reader may give the results of each study.
We judged trials to have an overall high risk of bias if we rated them as high for any one of three key criteria (randomisation sequence, allocation concealment and blinded outcome assessment). We classified RCTs as being at overall unclear risk of bias if any one of the three key domains was rated as unclear. RCTs were judged to be at overall low risk of bias only if we rated all three key domains as low risk.
Measures of treatment effect
We performed data analysis according to Cochrane guidelines. One review author (DA) entered quantitative data into RevMan 5.3 (RevMan 2014); these were checked by another review author (FD) and analysed using Cochrane‐associated software. We present a narrative overview of all included RCTs, with results grouped according to the comparator intervention. We present the outcome results for each trial with 95% confidence intervals (CIs). We report estimates for continuous outcomes (such as ejection fraction and venous refilling time) as mean differences (MDs) and overall effect size (with 95% CIs). We planned to report dichotomous outcomes (such as ulcer incidence) as risk ratios (RRs) with associated 95% CIs.
Unit of analysis issues
We treated the number of individual participants as the unit of analysis in this review. When data were reported using the number of limbs instead of individual participants, we attempted to carry out the appropriate adjustments for data analysis. We planned to include cluster‐randomised trials in the analysis. If any cluster‐randomised trials had been identified, we would have adjusted the results when the unit of analysis in the trial was presented as the total number of individual participants instead of the number of clusters. We intended to adjust the results using the mean cluster size and intracluster correlation coefficient (Deeks 2011); however, no cluster size trials were included in this review. For meta‐analysis, we planned to pool data from individually randomised trials using the generic inverse‐variance method, as described in Chapter 16 of the Cochrane Handbook for Systematic Reviews of Interventions (Higgins 2011c).
Dealing with missing data
We contacted the original investigators to request any missing data whenever possible. No additional data were provided by study authors. If a trial did not specify participant group number prior to dropout, we present only complete case analyses for primary and secondary outcomes.
Assessment of heterogeneity
If, for future updates, we are able to include a sufficient number of studies, we will pool data for meta‐analysis using RevMan (RevMan 2014). We will consider clinical heterogeneity (that is the degree to which trials appear similar in terms of type of participants, type and duration of intervention, and type of outcome) and statistical heterogeneity. We will assess statistical heterogeneity using the Chi² test (a significance level of P < 0.10 will be considered to indicate significant heterogeneity) in conjunction with the I² statistic (Higgins 2003). The I² statistic examines the percentage of total variation across trials due to heterogeneity rather than variation due to chance (Higgins 2003). Heterogeneity will be categorised as follows: I² values ≤ 40% will indicate a low level of heterogeneity and ≥ 75% will represent very high heterogeneity (Deeks 2011).
Assessment of reporting biases
If, for future updates, we are able to include a sufficient number of studies (10 RCTs or more), we will attempt to assess publication bias using funnel plots as described in the Cochrane Handbook for Systematic Reviews of Interventions (Sterne 2011). If asymmetry is present, we will explore possible causes, including publication bias, poor methodological quality and true heterogeneity.
Data synthesis
We included insufficient studies to pool data for meta‐analysis and so present a narrative overview of the included RCTs. For future updates we plan to present a narrative overview of the combined studies with a meta‐analysis of outcome data using RevMan 2014 where appropriate. Our decision to include studies in a meta‐analysis will depend on the availability of treatment effect data and an assessment of heterogeneity. For comparisons where there is no apparent clinical heterogeneity and the I2 value is ≤ 40%, we will apply a fixed‐effect model. Where there is no apparent clinical heterogeneity and the I2 value is > 40%, we will apply a random‐effects model. However, we will not pool data where heterogeneity is very high (I2 values ≥ 75%).
Subgroup analysis and investigation of heterogeneity
If, for future updates, we are able to include sufficient data (10 RCTs or more) and identify substantial heterogeneity we will conduct subgroup analyses. We plan to carry out subgroup analyses according to differences in the following variables: studies that report the treatment in the presence or absence of compression therapy independent of type (elastic or non‐elastic) or level (moderate or high) of compression.
Sensitivity analysis
If, for future updates, we are able to include a sufficient number of studies, we plan to undertake sensitivity analyses according to risk of bias, excluding RCTs that we judged as being at overall high or unclear risk of bias.
Summary of findings table
Three review authors (DA, FD, CR) graded the quality of the evidence for each primary outcome using four levels of quality: high, moderate, low and very low (Schünemann 2011a). We present the main results of the review in a 'Summary of findings' table (summary of findings Table for the main comparison). The 'Summary of findings' table also includes an overall grading of the evidence related to each of the main outcomes using the GRADE approach as described in the Cochrane Handbook for Systematic Reviews of Interventions (Schünemann 2011b). We based the quality of the studies on the following factors.
1. Limitations in the design and implementation of available studies suggesting a high likelihood of bias.
2. Indirectness of evidence (indirect population, intervention, control, outcomes).
3. Unexplained heterogeneity or inconsistency of results (including problems with subgroup analyses).
4. Imprecision of results (wide CIs).
5. High probability of publication bias.
Results
Description of studies
Results of the search
See Figure 1
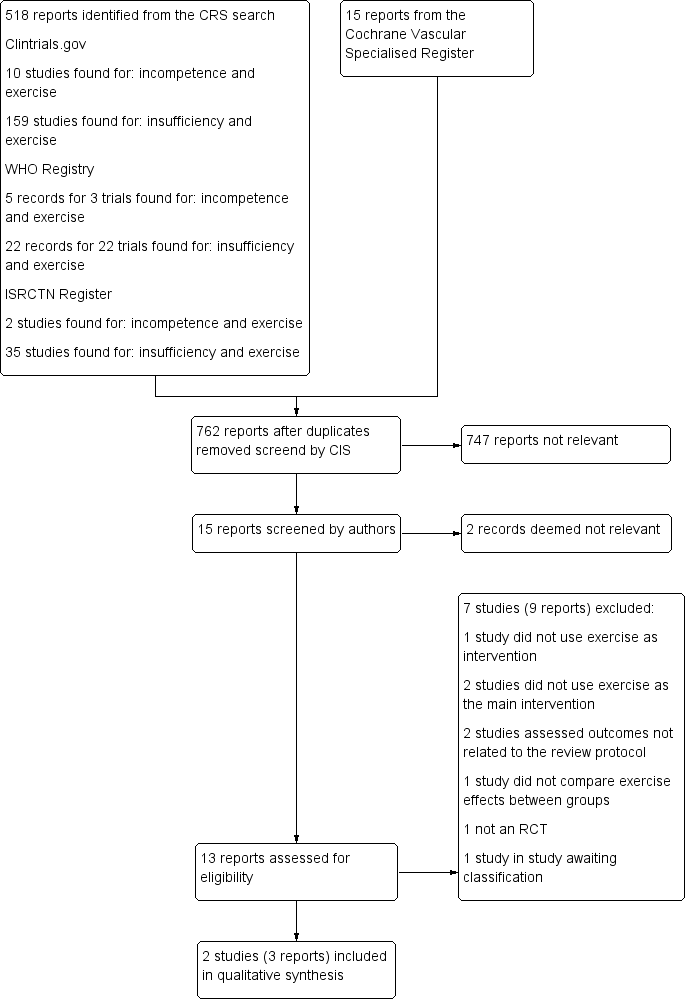
Study flow diagram.
Included studies
See Characteristics of included studies for more detail.
Two studies, one from Germany and one from the USA, were included (Hartmann 1997; Padberg 2004). Both studies reported the criteria by which a diagnosis of CVI was made and in both studies the intervention lasted 24 weeks. Padberg 2004 included 6/30 (20%) participants with a CEAP classification C6. Sample sizes were 24 and 30 participants, respectively. Mean age was 70 years in Padberg 2004 and 54.7 years (standard deviation 3.2 years) in Hartmann 1997. The intervention group in both included studies comprised exercise and compression stockings. The control group in Padberg 2004 did not perform exercise but did use compression stockings. In Hartmann 1997, the control group did not perform exercise but it is unclear whether they used compression stockings.
The intervention protocol in Hartmann 1997 was 60 minutes of exercise twice a week. First, participants completed 20 minutes in an exercise bath, then, following the dousing of the legs with cold water for 30 seconds, 25 minutes of floor exercises. In addition, participants performed unsupervised exercises for 15 minutes once a day. In Padberg 2004, participants performed 12 weeks of supervised therapy followed by 12 weeks of unsupervised therapy. The exercise programme consisted of 1 hour of individualised therapy focusing on leg strengthening (calf musculature) with progressed repetitions, sets and weights throughout the first 12 weeks, with uphill treadmill walking to further strengthen the calf. In addition, participants were taught the principles of exercise progression, and were asked to continue the progression during 12 weeks of unsupervised exercise. Participants were also encouraged to walk uphill while maintaining their exercise programme during the unsupervised component of the intervention.
Excluded studies
See Characteristics of excluded studies
Seven studies were excluded (Aguilar‐Ferrándiz 2013; Carpentier 2014; Forestier 2014; Hartmann 1991; Klonizakis 2009; Klyscz 1998; Ramos‐González 2012). One study did not use exercise as intervention (Aguilar‐Ferrándiz 2013), one study had exercise as the intervention, but the outcomes measured did not match with any of the outcomes specified in the available protocol (Klonizakis 2009). One study used exercises in both intervention and control groups, which did not allow for comparison between groups (Ramos‐González 2012). Two studies used balneotherapy as the main intervention (Carpentier 2014; Forestier 2014). Balneotherapy comprised water massage cycles in the whirlpool, bath with massaging jets, alternating warm (28°C) and cold (14°C) showers on the legs (Kneipp therapy), leg or ankle massage or mobilisation in the pool. We considered that any effects of the intervention could have been due not just to exercise, which encompassed only a small part of the whole therapy, but also to the other included steps; hence, we decided to exclude these studies. Hartmann 1991 and Klyscz 1998 are controlled clinical trials, not RCTs; we therefore excluded these studies.
Studies awaiting classification
See Characteristics of studies awaiting classification
We were unable to obtain publications from a clinical trial registered as completed but with no publication history (NCT00013273).
Risk of bias in included studies
Both included studies were deemed to be at overall high risk of bias because we judged at least one of the three key criteria (randomisation sequence, allocation concealment and blinded outcome assessment) to be at high risk of bias. Padberg 2004 was rated as at unclear risk of bias for random sequence generation, and at low risk of bias for allocation concealment (see Figure 2 and Figure 3).
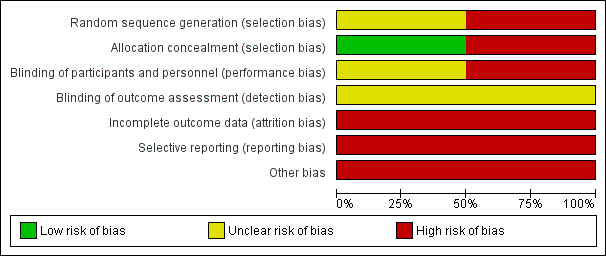
'Risk of bias' graph: review authors' judgements about each risk of bias item presented as percentages across all included studies.
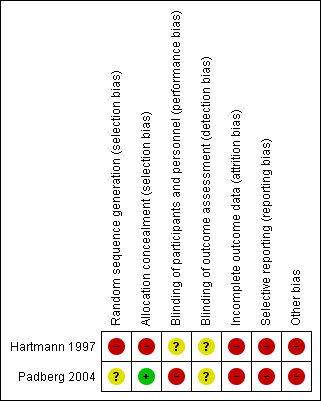
'Risk of bias' summary: review authors' judgements about each risk of bias item for each included study.
Allocation
In Padberg 2004 group assignment was revealed by the statistician only after the initial evaluation and consent (allocation concealment). However, as the authors did not describe how the random sequence generation was performed, we rated the study as at unclear risk of allocation bias. Hartmann 1997 formed two groups with matched pairs but did not mention the methodology used for matching. Because of this, we rated the study to be at high risk of both random sequence generation and allocation concealment bias.
Blinding
Padberg 2004 stated that all groups were unblinded but it is unclear whether there was blinding of outcome assessment; we therefore rated the study as at high risk of performance bias and unclear risk of detection bias. It is unclear whether Hartmann 1997 provided blinding for any of the groups or for outcome assessment. We therefore judged this study to be at unclear risk of bias.
Incomplete outcome data
We rated both studies to be at high risk of attrition bias because one participant dropped out in Hartmann 1997 for whom data were not included, and Padberg 2004 stated that some cases were deleted because of missing data or because values recorded differed from mean values by 5 or more standard deviations.
Selective reporting
We judged both studies to be at high risk of selective reporting. Hartmann 1997 presented no results for maximum venous outflow (despite this being mentioned as having been measured) and Padberg 2004 showed no data for ulcer healing and QoL although for the latter it was stated there was no difference between groups.
Other potential sources of bias
We judged both studies to be at high risk of other bias. In Hartmann 1997, the unit of analysis was extremities (legs) and not participants. Padberg 2004 presented no separate description of the results in participants with ulcerated CVI and non‐ulcerated CVI. The average data include 20% of ulcerated CVI.
Effects of interventions
See: Summary of findings for the main comparison Summary of findings for primary outcomes
Primary outcomes
1. Intensity of disease signs and symptoms
Hartmann 1997 reported a reduction in symptoms in the intervention group after treatment compared with the control group. Change in percentage of participants reporting each symptom between baseline and week 24 (intervention versus control group): pain ‐17% versus 56%, swelling ‐9% versus 64%, restlessness ‐16% versus 62%, cramps ‐19% versus 67%, itching ‐11% versus 52%, stasis oedema ‐23% versus 59%). However, these data were obtained using a non‐validated tool and standard deviations were not reported; we therefore do not consider this a reliable outcome measure.
Padberg 2004 used three tools to assess the intensity of signs and symptoms (Venous Clinical Severity Score, Cinical score and Disability score) at baseline. Only Venous Clinical Severity Scores were compared before and after intervention and showed no differences between the intervention and control groups (mean ± standard error of the mean: 0.8 ± 1.0 versus ‐0.3 ± 0.9; P = 0.51).
2. Ejection fraction
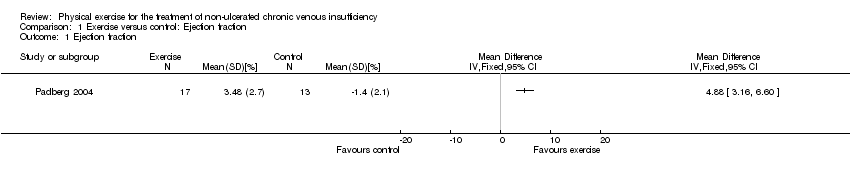
Padberg 2004 reported the mean change in ejection fraction from baseline, reporting an increase in ejection fraction in the intervention group compared with the control group (mean difference ± standard error of the mean: 3.48 ± 2.7 % versus ‐1.4 ± 2.1 % in the control group; MD 4.88%, 95% CI 3.16 to 6.60; participants = 30; studies = 1; P < 0.00001) (see Analysis 1.1; Figure 4). This finding would represent an improvement in calf pump function after physical exercise training. Hartmann 1997 did not investigate this outcome.
![Forest plot of comparison: 1 Ejection fraction, outcome: 1.1 Ejection fraction [%].](/cdsr/doi/10.1002/14651858.CD010637.pub2/media/CDSR/CD010637/rel0002/CD010637/image_n/nCD010637-AFig-FIG04.png)
Forest plot of comparison: 1 Ejection fraction, outcome: 1.1 Ejection fraction [%].
3. Venous refilling time
Hartmann 1997 reported an increase in half and total venous refilling time in participants in the intervention group versus the control group.
Half refilling time was 11.3 ± 0.9 seconds in the intervention group compared with 7.1 ± 1.3 seconds in the control group and total refilling time was 25.7 ± 2.1 seconds in the intervention group compared with 16.3 ± 1.9 seconds in the control group (MD 4.20 seconds, 95% CI 3.28 to 5.12; participants = 23; studies = 1; P < 0.00001; and MD 9.40 seconds, 95% CI 7.77 to 11.03; participants = 23; studies = 1; P < 0.00001 respectively, see Analysis 2.1; Analysis 2.2; Figure 5 and Figure 6). Padberg 2004 trial did not investigate this outcome.
![Forest plot of comparison: 2 Venous refilling time, outcome: 2.1 Half refilling time [seconds].](/cdsr/doi/10.1002/14651858.CD010637.pub2/media/CDSR/CD010637/rel0002/CD010637/image_n/nCD010637-AFig-FIG05.png)
Forest plot of comparison: 2 Venous refilling time, outcome: 2.1 Half refilling time [seconds].
![Forest plot of comparison: 2 Venous refilling time, outcome: 2.2 Total refilling time [seconds].](/cdsr/doi/10.1002/14651858.CD010637.pub2/media/CDSR/CD010637/rel0002/CD010637/image_n/nCD010637-AFig-FIG06.png)
Forest plot of comparison: 2 Venous refilling time, outcome: 2.2 Total refilling time [seconds].
4. Incidence of venous leg ulcer
Neither Hartmann 1997 nor Padberg 2004 reported the incidence of venous leg ulcers.
Secondary outcomes
1. Quality of life
Padberg 2004 stated that they observed no differences between groups with regard to QoL. However, the data were not presented. Hartmann 1997 did not investigate this outcome.
2. Exercise capacity
Neither Hartmann 1997 nor Padberg 2004 reported on exercise capacity.
3. Muscle strength
Padberg 2004 assessed muscle strength using dynamometry at two different speeds ‐ fast (120 rpm) and slow (60 rpm) ‐ and observed a difference between groups only in variable peak torque/body weight at fast speed. This was lower in the control group than in the intervention group (‐0.3 ± 0.6 versus 2.8 ± 0.9, P < 0.03). The study authors stated there was also a difference between groups in peak torque/body weight at low speed; however, we did not consider this difference to be statistically significant (P = 0.053). Hartmann 1997 did not report muscle strength.
4. Incidence of surgical intervention to treat symptoms related to CVI
Neither Hartmann 1997 nor Padberg 2004 reported the incidence of surgical intervention.
5. Ankle joint mobility
Ankle joint mobility, measured using dynamometry, remained unchanged between groups at the end of one study (Padberg 2004) (2.3 ± 1.4 ROM in the control group versus 0.9 ± 1.0 ROM in the intervention group, P = 0.48). Hartmann 1997 did not report ankle joint mobility.
Discussion
Summary of main results
We included two RCTs involving a total of 54 participants with CVI. Physical exercise increased venous refilling time and ejection fraction compared with controls, indicating an improvement in venous haemodynamics. However, conclusions regarding these results should be interpreted guardedly, because we considered the included studies to be at overall high risk of bias and the overall quality of the evidence to be very low. Reports on muscle strength showed an improvement in only one dynamometry variable in a single study (Padberg 2004). More data are needed to investigate the effects of physical exercise on muscle strength in individuals with CVI. Ankle joint mobility and QoL (both measured in a single study) and intensity of disease signs and symptoms, measured using validated tools, were unchanged between groups. Neither of the studies reported on the incidence of venous leg ulcer, surgical intervention to treat symptoms related to CVI or exercise capacity.
Overall completeness and applicability of evidence
This review addressed the efficacy and safety of physical exercise in the treatment of individuals with non‐ulcerated CVI. Included studies compared exercise protocols to no exercise and showed an improvement in venous haemodynamics with exercise. However, due to the high risk of bias in both included studies, we are not able to state that the evidence available supports physical exercise as an effective intervention for CVI. A major outcome such as the incidence of venous ulcers was not reported by either of the studies included, and other important outcomes, such as ejection fraction and venous refilling time, were each reported by one study only. These limitations weaken the applicability of the evidence and should be considered when interpreting the findings.
Quality of the evidence
We judged the overall quality of evidence as very low according to the GRADE approach, as described in the Cochrane Handbook for Systematic Reviews of Interventions (Schünemann 2011b). Risk of bias was high in both included studies; hence, due to the small number of studies and small sample sizes, we were unable to verify indirectness and publication bias.
Potential biases in the review process
Padberg 2004 investigated the intervention in participants with venous ulcers but did not provide data separately for participants with non‐ulcerated CVI. We included this study because fewer than 25% of all participants had venous ulcers. In Hartmann 1997 the unit of analysis was extremities (legs) and not participants; hence, the study which included 23 participants accounted for 46 extremities, but we were unable to obtain raw data in order to calculate the appropriate adjustments.
We were unable to obtain publications from one investigation that we could have considered for inclusion (NCT00013273); therefore we have classified this study as 'awaiting classification'.
Agreements and disagreements with other studies or reviews
There are no previous reviews that allow us to compare data.

Study flow diagram.

'Risk of bias' graph: review authors' judgements about each risk of bias item presented as percentages across all included studies.

'Risk of bias' summary: review authors' judgements about each risk of bias item for each included study.
![Forest plot of comparison: 1 Ejection fraction, outcome: 1.1 Ejection fraction [%].](/es/cdsr/doi/10.1002/14651858.CD010637.pub2/media/CDSR/CD010637/rel0002/CD010637/image_n/nCD010637-AFig-FIG04.png)
Forest plot of comparison: 1 Ejection fraction, outcome: 1.1 Ejection fraction [%].
![Forest plot of comparison: 2 Venous refilling time, outcome: 2.1 Half refilling time [seconds].](/es/cdsr/doi/10.1002/14651858.CD010637.pub2/media/CDSR/CD010637/rel0002/CD010637/image_n/nCD010637-AFig-FIG05.png)
Forest plot of comparison: 2 Venous refilling time, outcome: 2.1 Half refilling time [seconds].
![Forest plot of comparison: 2 Venous refilling time, outcome: 2.2 Total refilling time [seconds].](/es/cdsr/doi/10.1002/14651858.CD010637.pub2/media/CDSR/CD010637/rel0002/CD010637/image_n/nCD010637-AFig-FIG06.png)
Forest plot of comparison: 2 Venous refilling time, outcome: 2.2 Total refilling time [seconds].
Comparison 1 Exercise versus control: Ejection fraction, Outcome 1 Ejection fraction.
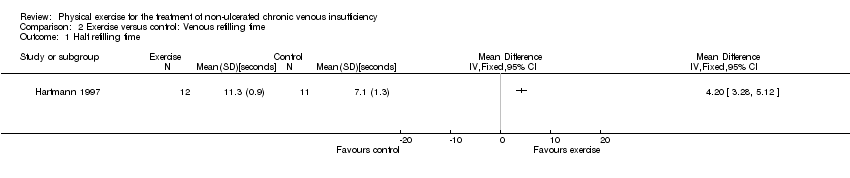
Comparison 2 Exercise versus control: Venous refilling time, Outcome 1 Half refilling time.

Comparison 2 Exercise versus control: Venous refilling time, Outcome 2 Total refilling time.
| Physical exercise compared with no treatment for non‐ulcerated chronic venous insufficiency | |||||
| Population: People with non‐ulcerated chronic venous insufficiency | |||||
| Outcomes | Anticipated absolute effects* (95% CI) | Relative effect | No. of participants | Quality of the evidence | |
| Risk with no exercise | Risk with physical exercise | ||||
| Intensity of disease signs and symptoms1 | see footnotes1 | ||||
| Ejection fraction Follow up: 24 weeks | The mean change in ejection fraction from baseline was ‐1.4% | The mean change in ejection fraction from baseline in the intervention group was 4.88% more (3.16 more to 6.6 more) | 30 | ⊕⊖⊖⊖ | |
| Half refilling time Follow up: 24 weeks | The mean half refilling time was 7.1 seconds | The mean half refilling time in the intervention group was 4.20 seconds more (3.28 more to 5.12 more) | 23 | ⊕⊖⊖⊖ | |
| Total refilling time Follow up: 24 weeks | The mean total refilling time was 16.3 seconds | The mean total refilling time in the intervention group was 9.40 seconds more (7.77 more to 11.03 more) | 23 | ⊕⊖⊖⊖ | |
| Incidence of venous leg ulcer3 | ‐ | ‐ | ‐ | see footnote3 | |
| *The risk in the intervention group (and its 95% confidence interval) is based on the assumed risk in the comparison group and the relative effect of the intervention (and its 95% CI) | |||||
| GRADE Working Group grades of evidence | |||||
| 1 unable to pool data because data were collected using different tools | |||||
| Classification | Description/Definition |
| Clinical | |
| 0 | no visible or palpable signs of venous disease |
| 1 | telangiectases or reticular veins |
| 2 | varicose veins |
| 3 | oedema |
| 4a | pigmentation or eczema |
| 4b | lipodermatosclerosis or atrophie blanchie |
| 5 | healed venous ulcer |
| 6 | active venous ulcer |
| S | symptomatic, including ache, pain, tightness, skin irritation, heaviness, muscle cramp and other complaints attributable to venous dysfunction |
| A | asymptomatic |
| Etiologyl | |
| Ec | congenital (present since birth) |
| Ep | primary |
| Es | secondary (post‐thrombotic, traumatic) |
| En | no venous cause identified |
| Anatomy distribution | |
| As | superficial (great and short saphenous veins) |
| Ap | perforator (thigh and leg perforating veins) |
| Ad | deep (cava, iliac, gonadal, femoral, profunda, popliteal, tibial, and muscular veins) |
| An | no venous location identified |
| Pathophysiology | |
| Pr | reflux (axial and perforating veins) |
| Po | obstruction (acute and chronic) |
| Pr,o | combination of both reflux and obstruction (valvular dysfunction and thrombus) |
| Pn | no venous pathophysiology identified |
| CEAP classification: classification of chronic venous disease according to clinical manifestation, etiologic factors, anatomic distribution of disease, and underlying pathophysiologic findings See Eklof 2004 for further details about CEAP | |
| Clinical descriptor | Absent (0) | Mild (1) | Moderate (2) | Severe (3) |
| Pain | None | Occasional | Daily not limiting | Daily limiting |
| Varicose veins | None | Few | Calf or thigh | Calf and thigh |
| Venous oedema | None | Foot and ankle | Below knee | Knee and above |
| Skin pigmentation | None | Limited perimalleolar | Diffuse lower 1/3 calf | Wider above lower 1/3 calf |
| Inflammation | None | Limited perimalleolar | Diffuse lower 1/3 calf | Wider above lower 1/3 calf |
| Induration | None | Limited perimalleolar | Diffuse lower 1/3 calf | Wider above lower 1/3 calf |
| Number of active ulcers | None | 1 | 2 | 3 or more |
| Ulcer duration | None | < 3 month | 3 ‐ 12 month | > 1 year |
| Active ulcer size | None | < 2 cm | 2 ‐ 6 cm | > 6 cm |
| Compression therapy | None | Intermittent | Most days | Fully comply |
| Outcome or subgroup title | No. of studies | No. of participants | Statistical method | Effect size |
| 1 Ejection fraction Show forest plot | 1 | Mean Difference (IV, Fixed, 95% CI) | Totals not selected | |
| Outcome or subgroup title | No. of studies | No. of participants | Statistical method | Effect size |
| 1 Half refilling time Show forest plot | 1 | Mean Difference (IV, Fixed, 95% CI) | Totals not selected | |
| 2 Total refilling time Show forest plot | 1 | Mean Difference (IV, Fixed, 95% CI) | Totals not selected | |