Topiramato para la profilaxis de la migraña episódica en adultos
Información
- DOI:
- https://doi.org/10.1002/14651858.CD010610Copiar DOI

- Base de datos:
-
- Cochrane Database of Systematic Reviews
- Versión publicada:
-
- 24 junio 2013see what's new
- Tipo:
-
- Intervention
- Etapa:
-
- Review
- Grupo Editorial Cochrane:
-
Grupo Cochrane de Dolor y cuidados paliativos
- Copyright:
-
- Copyright © 2016 The Cochrane Collaboration. Published by John Wiley & Sons, Ltd.
Cifras del artículo
Altmetric:
Citado por:
Autores
Contributions of authors
Prof Linde: Designing the review. Co‐ordinating the review. Data collection for the review. Screening search results. Organising retrieval of papers. Screening retrieved papers against eligibility criteria. Appraising quality of papers. Extracting data from papers. Writing to authors of papers for additional information. Providing additional data about papers. Data management for the review. Entering data into RevMan. Analysis of data. Interpretation of data. Providing a clinical perspective. Writing the review.
Dr Mulleners: Conceiving the review. Designing the review. Data collection for the review. Screening search results. Organising retrieval of papers. Screening retrieved papers against eligibility criteria. Appraising quality of papers. Extracting data from papers. Interpretation of data. Providing a clinical perspective.
Prof Chronicle: Performing previous work that was the foundation of the current review.
Assoc Prof McCrory: Analysis of data. Interpretation of data. Providing a methodological perspective. Providing general advice on the review.
Sources of support
Internal sources
-
No sources of support supplied
External sources
-
International Headache Society, UK.
Funding for administrative costs associated with editorial and peer review of the original and updated reviews
-
Lifting The Burden: the Global Campaign against Headache, UK.
Funding for administrative costs associated with editorial and peer review of the updated review
Declarations of interest
Prof Linde: During the process of preparing this review the author received a travel grant from Allergan in Sweden and was involved as an investigator in a clinical trial in Norway sponsored by AstraZeneca and comparing candesartan, propranolol, and placebo in the prophylaxis of migraine. He was senior investigator in one of the included studies (Varkey 2011).
Dr Mulleners: The author was a paid consultant for the Merck Dutch Migraine Advisory Board and received a speaker's fee from Merck Sharp & Dohme Corp.
Prof Chronicle: Author deceased. During the process of preparing the original review the author was a paid consultant for Johnson & Johnson and NPS Pharmaceuticals in the USA.
Assoc Prof McCrory: During 2008, the author was a paid expert witness for the plaintiffs in a legal action against the manufacturer of Neurontin (gabapentin). In this capacity, he prepared a systematic review examining previously confidential research reports obtained from the manufacturer (through discovery), along with published trial reports of gabapentin for migraine prophylaxis, and testified at trial.
Acknowledgements
Professor EP Chronicle, PhD, sadly passed away on 9 February 2007. We wish to acknowledge Professor Chronicle's major contribution and tremendous effort in compiling all statistical analyses and much of the text of the original review on antiepileptics (Chronicle 2004; Mulleners 2008). Without his relentless dedication it would have never seen the light of day.
The protocol for the original review was developed while Dr Chronicle was a Visiting Scholar at the University of California, Berkeley. Dr Sally Hollis, Lancaster University, and Dr Kentaro Hayashi, University of Hawaii at Manoa, provided helpful advice on statistical matters. Several pharmaceutical companies kindly provided information about trials in progress.
We thank Ruth Foxlee, Jane Hayes, and Joanne Abbott for assistance in designing search strategies and running searches; Prof Timothy Steiner for editorial guidance; and Dr Rebecca Gray for editorial assistance and technical support.
Lifting The Burden: the Global Campaign against Headache and the International Headache Society provided financial support for the editorial process (see Sources of support).
Version history
| Published | Title | Stage | Authors | Version |
| 2013 Jun 24 | Topiramate for the prophylaxis of episodic migraine in adults | Review | Mattias Linde, Wim M Mulleners, Edward P Chronicle, Douglas C McCrory | |
Differences between protocol and review
After reviewing the variety of methods used for calculating headache index, it was decided that no systematic analysis of headache index data would be undertaken, for two principal reasons. First, rarely was sufficient information given to allow a clear understanding of how the index was calculated, and second, even when indexes were clearly described, they were not always useful — for example, because they confounded severity scores with frequency scores. Avoiding the use of headache index measures is consistent with the recommendations of the International Headache Society (Tfelt‐Hansen 2012).
After publication of the protocol, we decided not to extract trial data on pain intensity, duration of attacks, or associated symptoms of migraine (nausea, vomiting, photophobia, phonophobia). The reasons were that such information was rarely given, and that the methods used were not standardised.
Our methods for assessing and dealing with heterogeneity have evolved over time in line with changing Cochrane methods. The protocol for the original review specified that we would test estimates of efficacy for homogeneity, use a fixed‐effect model to combine homogenous estimates, and use a random‐effects model to combine estimates when a group of studies with statistically heterogeneous results appeared to be clinically similar. In the original review itself, and in the 2007 update (Chronicle 2004; Mulleners 2008), we in fact used a random‐effects model throughout for pooled analyses. In the present review, we again use a random‐effects model for pooling, but we have added a possible fixed‐effect sensitivity analysis in select cases; see Assessment of heterogeneity for details.
Notes
An updated search in May 2016 only identified one relevant study (Cady 2012). However, we did not identify any potentially relevant studies likely to change the conclusions. Therefore, this review has now been stabilised following discussion with the authors and editors. If appropriate, we will update the review if new evidence likely to change the conclusions is published, or if standards change substantially which necessitate major revisions.
Cady, R. K., J. Voirin, et al. (2012). "Two center, randomized pilot study of migraine prophylaxis comparing paradigms using pre‐emptive frovatriptan or daily topiramate: research and clinical implications." Headache 52(5): 749‐764.
Keywords
MeSH
Medical Subject Headings (MeSH) Keywords
Medical Subject Headings Check Words
Adult; Humans;

'Risk of bias' graph: review authors' judgements about each risk of bias item presented as percentages across all included studies.

'Risk of bias' summary: review authors' judgements about each risk of bias item for each included study.
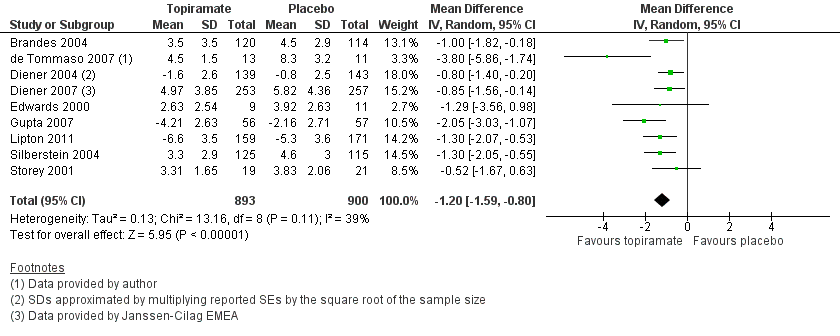
Forest plot of comparison: 1 Topiramate (combined analyses based on most relevant dose in each study) versus placebo, outcome: 1.1 Headache frequency (change from baseline to post‐treatment, or post‐treatment alone).

Forest plot of comparison: 2 Topiramate (separate analyses of various doses) versus placebo, outcome: 2.1 Headache frequency (change from baseline to post‐treatment, or post‐treatment alone).

Forest plot of comparison: 1 Topiramate (combined analyses based on most relevant dose in each study) versus placebo, outcome: 1.3 RRs for responders (patients with ≥ 50% reduction in headache frequency).

Comparison 1 Topiramate (combined analyses based on most relevant dose in each study) versus placebo, Outcome 1 Headache frequency (change from baseline to post‐treatment, or post‐treatment alone).

Comparison 1 Topiramate (combined analyses based on most relevant dose in each study) versus placebo, Outcome 2 ORs for responders (patients with ≥ 50% reduction in headache frequency).
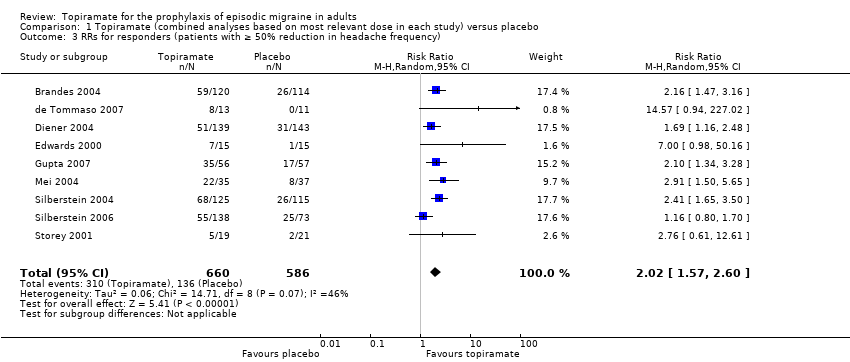
Comparison 1 Topiramate (combined analyses based on most relevant dose in each study) versus placebo, Outcome 3 RRs for responders (patients with ≥ 50% reduction in headache frequency).

Comparison 2 Topiramate (separate analyses of various doses) versus placebo, Outcome 1 Headache frequency (change from baseline to post‐treatment, or post‐treatment alone).
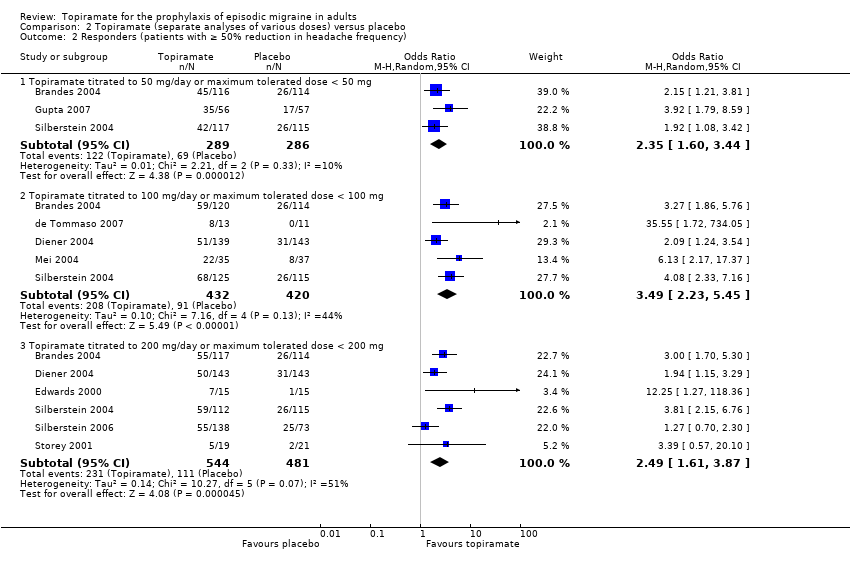
Comparison 2 Topiramate (separate analyses of various doses) versus placebo, Outcome 2 Responders (patients with ≥ 50% reduction in headache frequency).
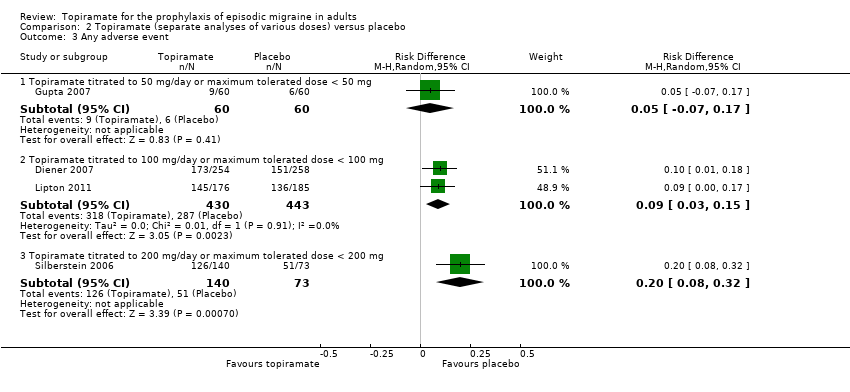
Comparison 2 Topiramate (separate analyses of various doses) versus placebo, Outcome 3 Any adverse event.

Comparison 2 Topiramate (separate analyses of various doses) versus placebo, Outcome 4 Anorexia.

Comparison 2 Topiramate (separate analyses of various doses) versus placebo, Outcome 5 Fatigue.
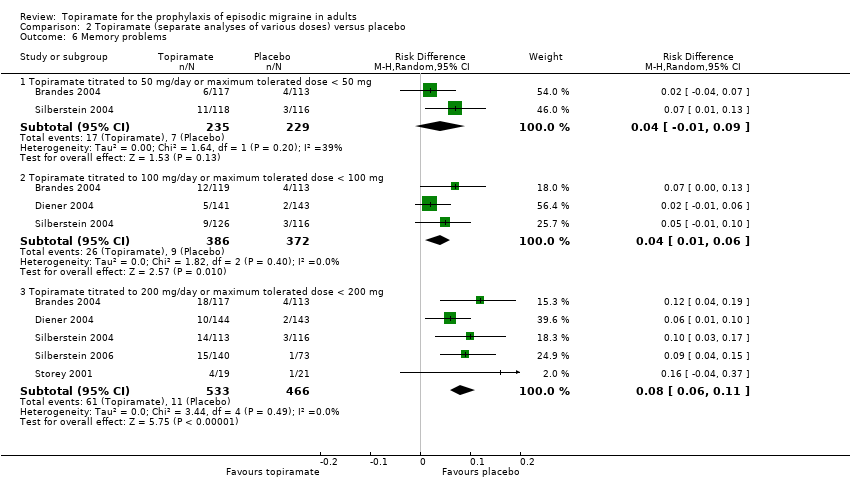
Comparison 2 Topiramate (separate analyses of various doses) versus placebo, Outcome 6 Memory problems.
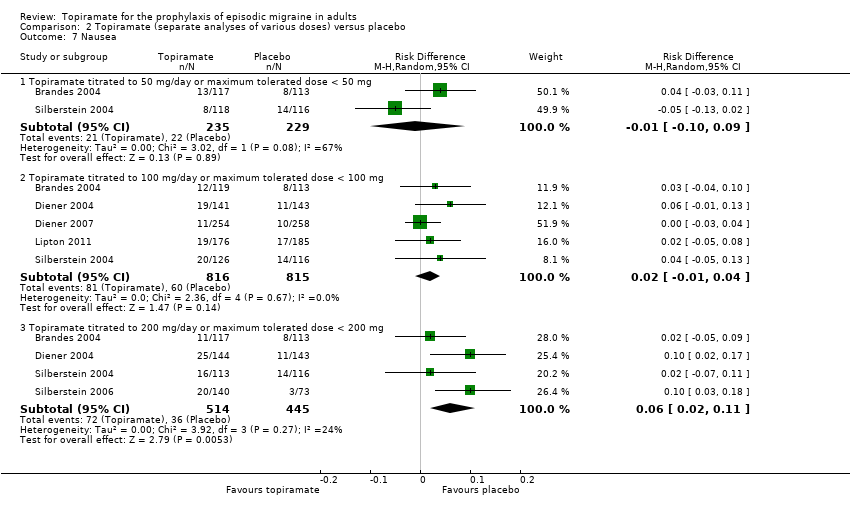
Comparison 2 Topiramate (separate analyses of various doses) versus placebo, Outcome 7 Nausea.
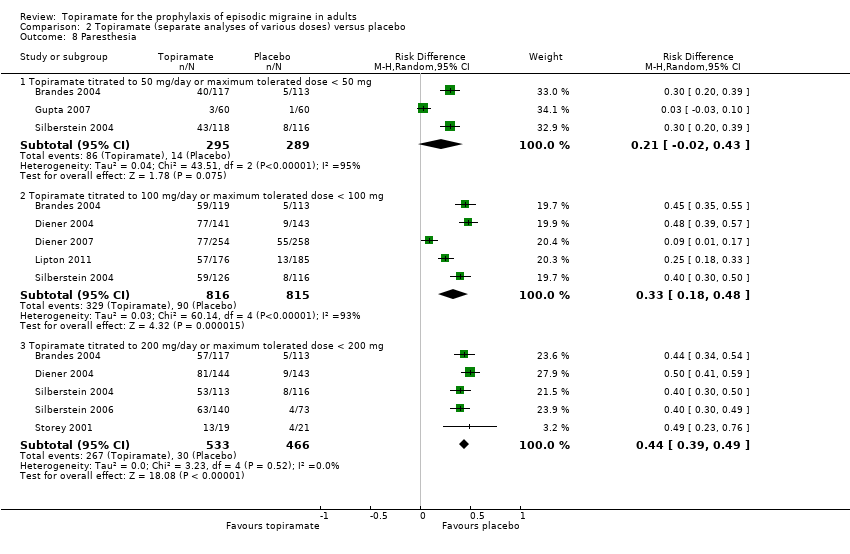
Comparison 2 Topiramate (separate analyses of various doses) versus placebo, Outcome 8 Paresthesia.
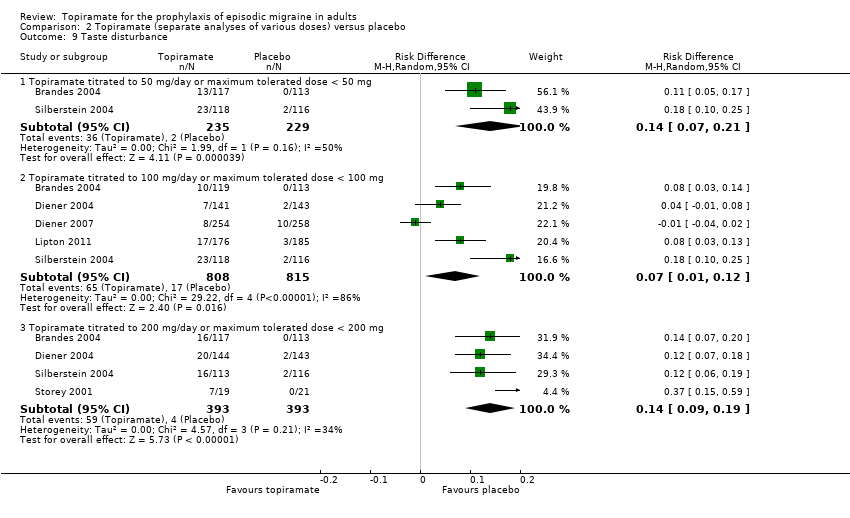
Comparison 2 Topiramate (separate analyses of various doses) versus placebo, Outcome 9 Taste disturbance.
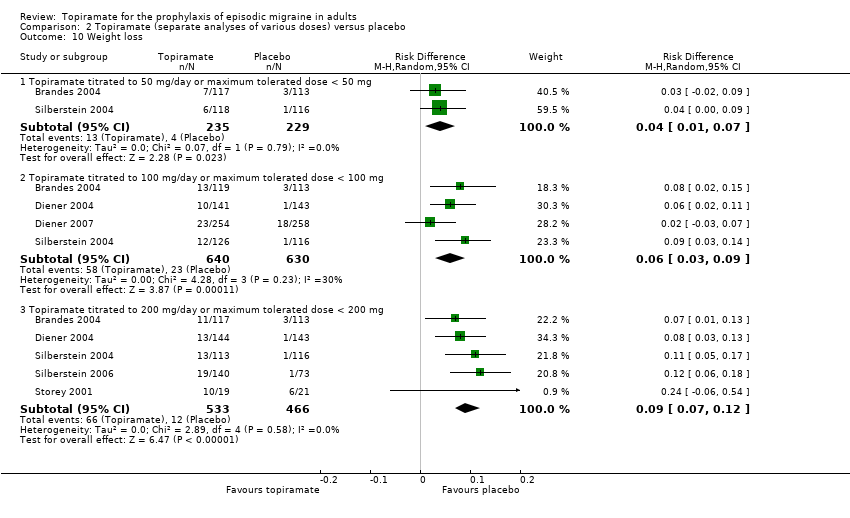
Comparison 2 Topiramate (separate analyses of various doses) versus placebo, Outcome 10 Weight loss.
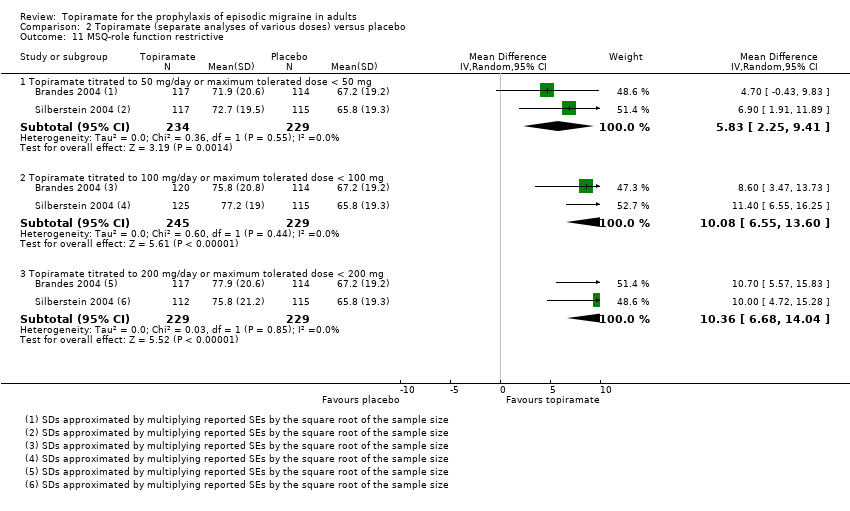
Comparison 2 Topiramate (separate analyses of various doses) versus placebo, Outcome 11 MSQ‐role function restrictive.

Comparison 2 Topiramate (separate analyses of various doses) versus placebo, Outcome 12 MSQ‐role function prevention.

Comparison 2 Topiramate (separate analyses of various doses) versus placebo, Outcome 13 MSQ‐emotional function.
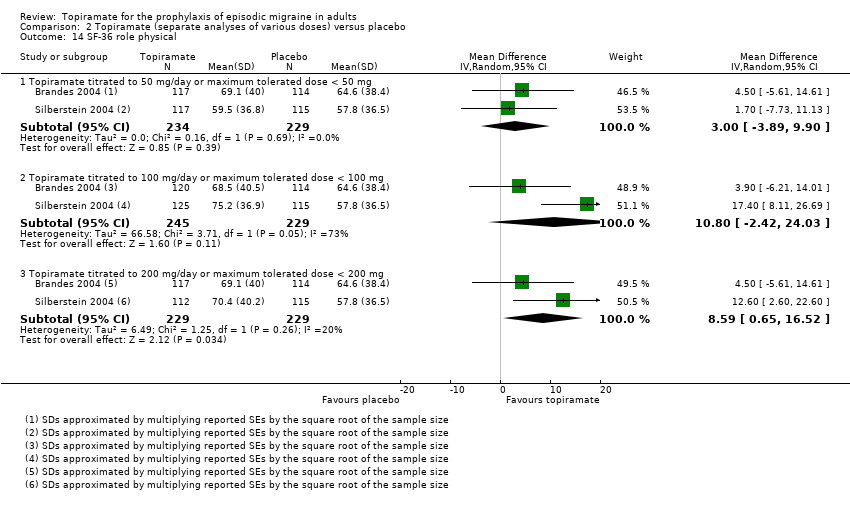
Comparison 2 Topiramate (separate analyses of various doses) versus placebo, Outcome 14 SF‐36 role physical.
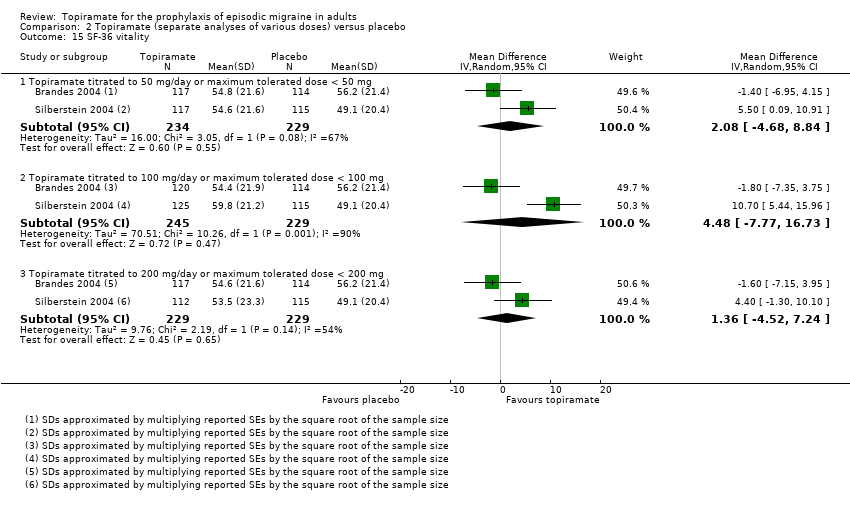
Comparison 2 Topiramate (separate analyses of various doses) versus placebo, Outcome 15 SF‐36 vitality.

Comparison 2 Topiramate (separate analyses of various doses) versus placebo, Outcome 16 SF‐36 physical functioning.

Comparison 2 Topiramate (separate analyses of various doses) versus placebo, Outcome 17 SF‐36 bodily pain.
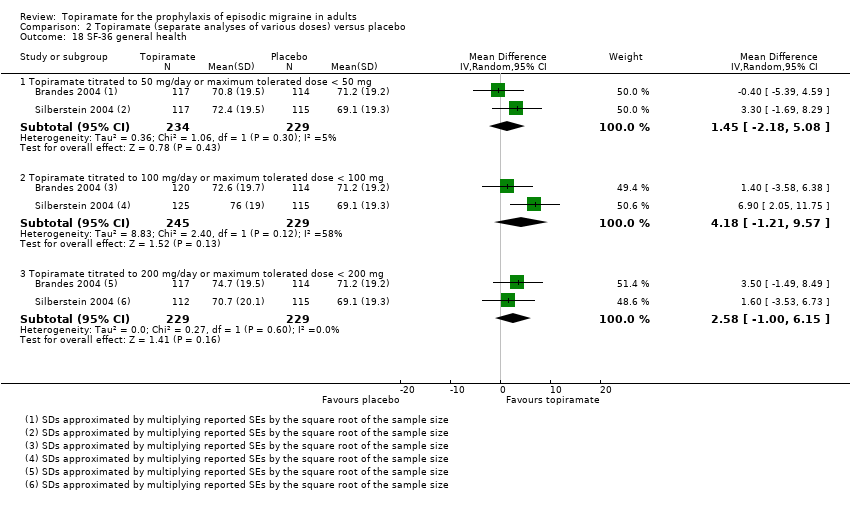
Comparison 2 Topiramate (separate analyses of various doses) versus placebo, Outcome 18 SF‐36 general health.
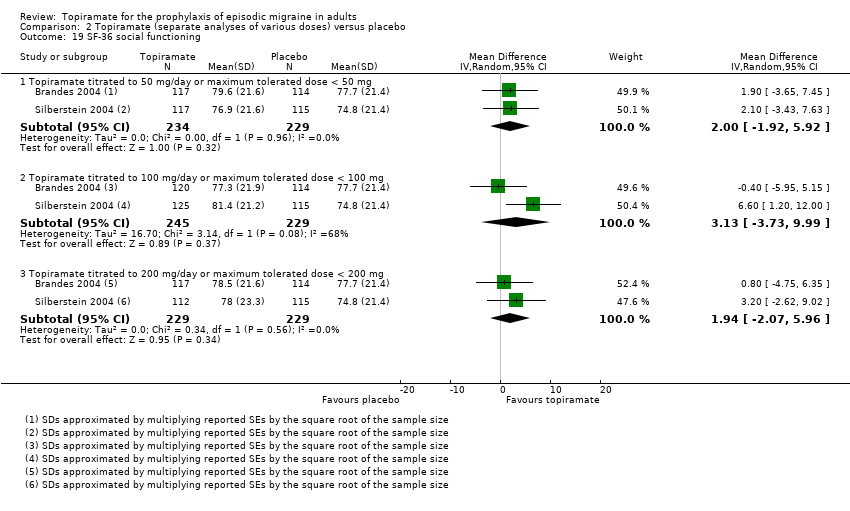
Comparison 2 Topiramate (separate analyses of various doses) versus placebo, Outcome 19 SF‐36 social functioning.
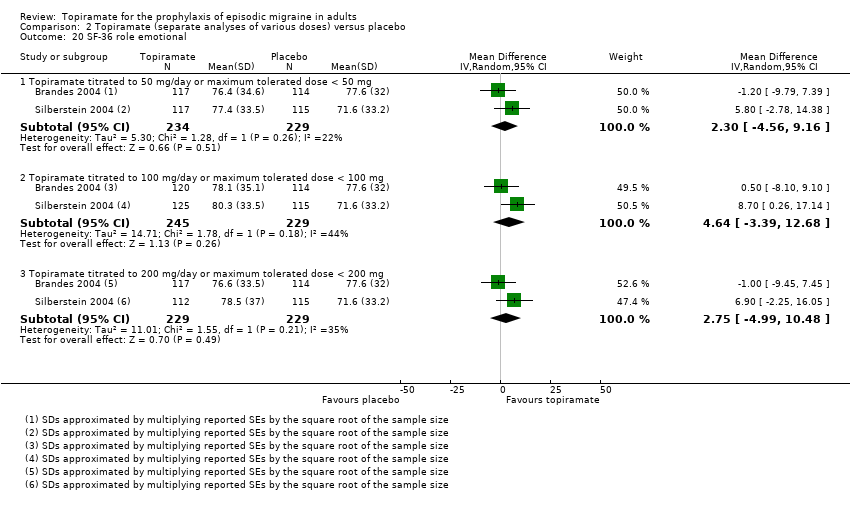
Comparison 2 Topiramate (separate analyses of various doses) versus placebo, Outcome 20 SF‐36 role emotional.

Comparison 2 Topiramate (separate analyses of various doses) versus placebo, Outcome 21 SF‐36 mental health.

Comparison 3 Topiramate direct dose comparisons, Outcome 1 Headache frequency (change from baseline to post‐treatment, or post‐treatment alone).

Comparison 3 Topiramate direct dose comparisons, Outcome 2 Responders (patients with ≥ 50% reduction in headache frequency).

Comparison 3 Topiramate direct dose comparisons, Outcome 3 MSQ‐role function restrictive.

Comparison 3 Topiramate direct dose comparisons, Outcome 4 MSQ‐role function prevention.

Comparison 3 Topiramate direct dose comparisons, Outcome 5 MSQ‐emotional function.

Comparison 3 Topiramate direct dose comparisons, Outcome 6 SF‐36 role physical.

Comparison 3 Topiramate direct dose comparisons, Outcome 7 SF‐36 vitality.

Comparison 3 Topiramate direct dose comparisons, Outcome 8 SF‐36 physical functioning.
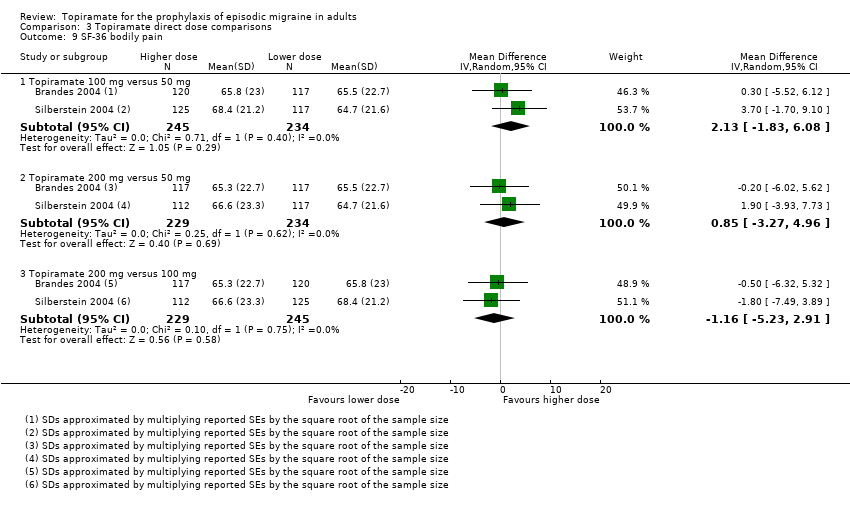
Comparison 3 Topiramate direct dose comparisons, Outcome 9 SF‐36 bodily pain.

Comparison 3 Topiramate direct dose comparisons, Outcome 10 SF‐36 general health.
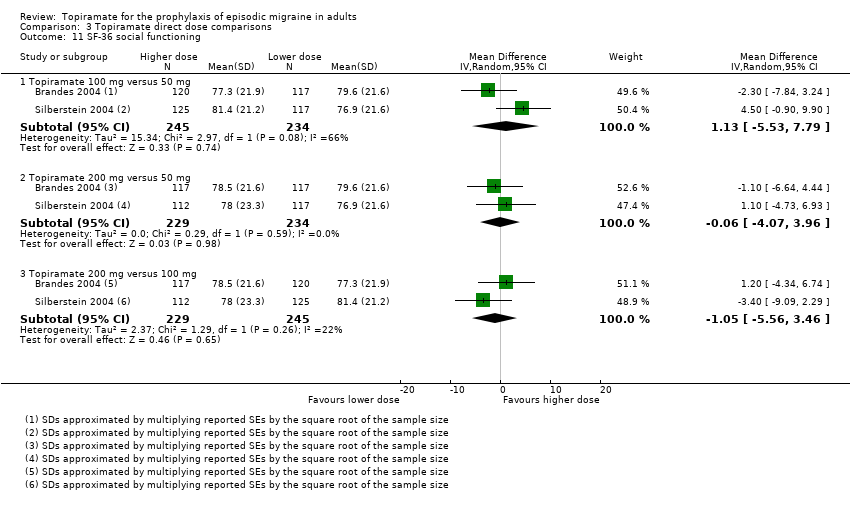
Comparison 3 Topiramate direct dose comparisons, Outcome 11 SF‐36 social functioning.

Comparison 3 Topiramate direct dose comparisons, Outcome 12 SF‐36 role emotional.

Comparison 3 Topiramate direct dose comparisons, Outcome 13 SF‐36 mental health.

Comparison 4 Topiramate versus amitriptyline, Outcome 1 Responders (patients with ≥ 50% reduction in headache frequency).
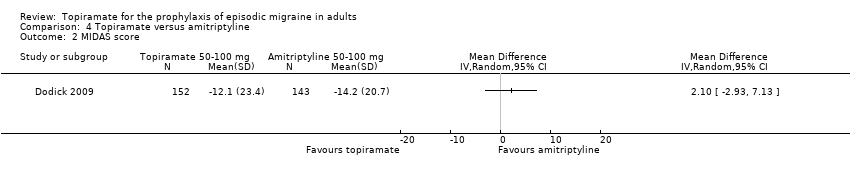
Comparison 4 Topiramate versus amitriptyline, Outcome 2 MIDAS score.
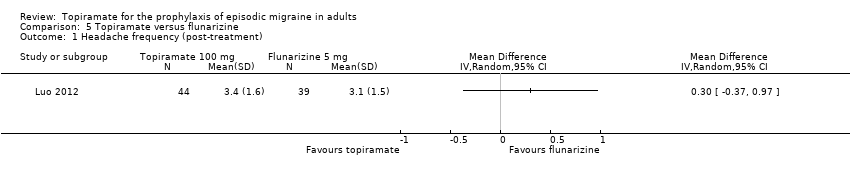
Comparison 5 Topiramate versus flunarizine, Outcome 1 Headache frequency (post‐treatment).

Comparison 5 Topiramate versus flunarizine, Outcome 2 Responders (patients with ≥ 50% reduction in headache frequency).

Comparison 6 Topiramate versus propranolol, Outcome 1 Headache frequency (change from baseline to post‐treatment, or post‐treatment alone).
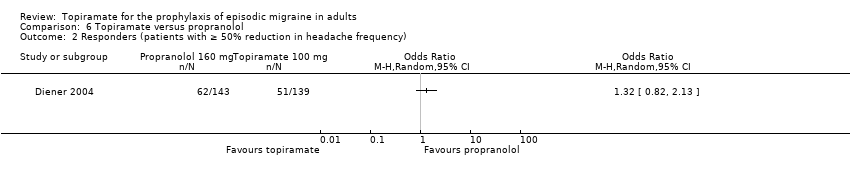
Comparison 6 Topiramate versus propranolol, Outcome 2 Responders (patients with ≥ 50% reduction in headache frequency).

Comparison 7 Topiramate versus sodium valproate, Outcome 1 Headache frequency (post‐treatment).
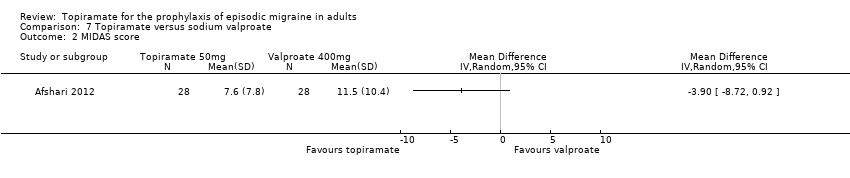
Comparison 7 Topiramate versus sodium valproate, Outcome 2 MIDAS score.

Comparison 8 Topiramate versus relaxation, Outcome 1 Headache frequency (change from baseline to post‐treatment).

Comparison 8 Topiramate versus relaxation, Outcome 2 Responders (patients with ≥ 50% reduction in headache frequency).
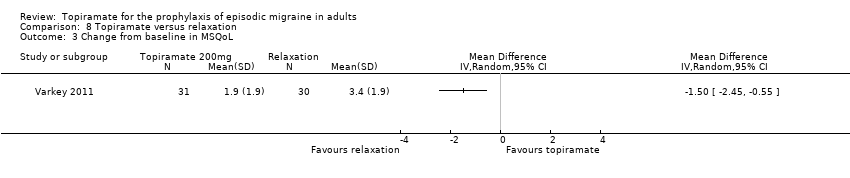
Comparison 8 Topiramate versus relaxation, Outcome 3 Change from baseline in MSQoL.
| Type of AE | 50 mg/day | 100 mg/day | 200 mg/day |
| Any AE | NNH not defined* | 11 (7 to 33) | 5 (3 to 12) |
| Anorexia | NNH not defined* | 17 (10 to 50) | 12 (8 to 20) |
| Fatigue | NNH not defined* | 25 (17 to 100) | 12 (8 to 25) |
| Memory problems | NNH not defined* | 25 (17 to 100) | 12 (9 to 17) |
| Nausea | NNH not defined* | NNH not defined* | 17 (9 to 50) |
| Paresthesia | NNH not defined* | 3 (2 to 6) | 2 (2 to 3) |
| Taste disturbance | 7 (5 to 14) | 14 (8 to 100) | 7 (5 to 11) |
| Weight loss | 25 (14 to 100) | 17 (11 to 33) | 11 (8 to 14) |
| Percentage of patients in active group withdrawing because of AEs | Afshari 2012: 5%; Ashtari 2008: 3%; Brandes 2004: 17%; Gupta 2007: 2%; Silberstein 2004: 17% | Brandes 2004: 26%; de Tommaso 2007: 8%; Diener 2004: 28%; Dodick 2009: 20%; Lipton 2011: 12%; Mei 2004: 29%; Silberstein 2004: 19% | Brandes 2004: 21%; Diener 2004: 44%; Edwards 2000: 27%; Silberstein 2004: 32%; Silberstein 2006: 15%; Storey 2001: 11%; Varkey 2011: 12% |
| * The 95% CI of the difference in AE rates between treatment and placebo arms (the risk difference, RD) crosses zero. Abbreviations: AE = adverse event; CI = confidence interval; NNH = number needed to harm | |||
| Outcome or subgroup title | No. of studies | No. of participants | Statistical method | Effect size |
| 1 Headache frequency (change from baseline to post‐treatment, or post‐treatment alone) Show forest plot | 9 | 1793 | Mean Difference (IV, Random, 95% CI) | ‐1.20 [‐1.59, ‐0.80] |
| 2 ORs for responders (patients with ≥ 50% reduction in headache frequency) Show forest plot | 9 | 1246 | Odds Ratio (M‐H, Random, 95% CI) | 3.18 [2.10, 4.82] |
| 3 RRs for responders (patients with ≥ 50% reduction in headache frequency) Show forest plot | 9 | 1246 | Risk Ratio (M‐H, Random, 95% CI) | 2.02 [1.57, 2.60] |
| Outcome or subgroup title | No. of studies | No. of participants | Statistical method | Effect size |
| 1 Headache frequency (change from baseline to post‐treatment, or post‐treatment alone) Show forest plot | 9 | Mean Difference (IV, Random, 95% CI) | Subtotals only | |
| 1.1 Topiramate titrated to 50 mg/day or maximum tolerated dose < 50 mg | 3 | 576 | Mean Difference (IV, Random, 95% CI) | ‐0.95 [‐1.95, 0.04] |
| 1.2 Topiramate titrated to 100 mg/day or maximum tolerated dose < 100 mg | 6 | 1620 | Mean Difference (IV, Random, 95% CI) | ‐1.15 [‐1.58, ‐0.71] |
| 1.3 Topiramate titrated to 200 mg/day or maximum tolerated dose < 200 mg | 5 | 804 | Mean Difference (IV, Random, 95% CI) | ‐0.94 [‐1.53, ‐0.36] |
| 2 Responders (patients with ≥ 50% reduction in headache frequency) Show forest plot | 9 | Odds Ratio (M‐H, Random, 95% CI) | Subtotals only | |
| 2.1 Topiramate titrated to 50 mg/day or maximum tolerated dose < 50 mg | 3 | 575 | Odds Ratio (M‐H, Random, 95% CI) | 2.35 [1.60, 3.44] |
| 2.2 Topiramate titrated to 100 mg/day or maximum tolerated dose < 100 mg | 5 | 852 | Odds Ratio (M‐H, Random, 95% CI) | 3.49 [2.23, 5.45] |
| 2.3 Topiramate titrated to 200 mg/day or maximum tolerated dose < 200 mg | 6 | 1025 | Odds Ratio (M‐H, Random, 95% CI) | 2.49 [1.61, 3.87] |
| 3 Any adverse event Show forest plot | 4 | Risk Difference (M‐H, Random, 95% CI) | Subtotals only | |
| 3.1 Topiramate titrated to 50 mg/day or maximum tolerated dose < 50 mg | 1 | 120 | Risk Difference (M‐H, Random, 95% CI) | 0.05 [‐0.07, 0.17] |
| 3.2 Topiramate titrated to 100 mg/day or maximum tolerated dose < 100 mg | 2 | 873 | Risk Difference (M‐H, Random, 95% CI) | 0.09 [0.03, 0.15] |
| 3.3 Topiramate titrated to 200 mg/day or maximum tolerated dose < 200 mg | 1 | 213 | Risk Difference (M‐H, Random, 95% CI) | 0.20 [0.08, 0.32] |
| 4 Anorexia Show forest plot | 8 | Risk Difference (M‐H, Random, 95% CI) | Subtotals only | |
| 4.1 Topiramate titrated to 50 mg/day or maximum tolerated dose < 50 mg | 3 | 584 | Risk Difference (M‐H, Random, 95% CI) | 0.01 [‐0.04, 0.07] |
| 4.2 Topiramate titrated to 100 mg/day or maximum tolerated dose < 100 mg | 5 | 1631 | Risk Difference (M‐H, Random, 95% CI) | 0.06 [0.02, 0.10] |
| 4.3 Topiramate titrated to 200 mg/day or maximum tolerated dose < 200 mg | 5 | 999 | Risk Difference (M‐H, Random, 95% CI) | 0.08 [0.05, 0.12] |
| 5 Fatigue Show forest plot | 6 | Risk Difference (M‐H, Random, 95% CI) | Subtotals only | |
| 5.1 Topiramate titrated to 50 mg/day or maximum tolerated dose < 50 mg | 2 | 464 | Risk Difference (M‐H, Random, 95% CI) | 0.04 [‐0.07, 0.15] |
| 5.2 Topiramate titrated to 100 mg/day or maximum tolerated dose < 100 mg | 5 | 1631 | Risk Difference (M‐H, Random, 95% CI) | 0.04 [0.01, 0.06] |
| 5.3 Topiramate titrated to 200 mg/day or maximum tolerated dose < 200 mg | 4 | 959 | Risk Difference (M‐H, Random, 95% CI) | 0.08 [0.04, 0.13] |
| 6 Memory problems Show forest plot | 5 | Risk Difference (M‐H, Random, 95% CI) | Subtotals only | |
| 6.1 Topiramate titrated to 50 mg/day or maximum tolerated dose < 50 mg | 2 | 464 | Risk Difference (M‐H, Random, 95% CI) | 0.04 [‐0.01, 0.09] |
| 6.2 Topiramate titrated to 100 mg/day or maximum tolerated dose < 100 mg | 3 | 758 | Risk Difference (M‐H, Random, 95% CI) | 0.04 [0.01, 0.06] |
| 6.3 Topiramate titrated to 200 mg/day or maximum tolerated dose < 200 mg | 5 | 999 | Risk Difference (M‐H, Random, 95% CI) | 0.08 [0.06, 0.11] |
| 7 Nausea Show forest plot | 6 | Risk Difference (M‐H, Random, 95% CI) | Subtotals only | |
| 7.1 Topiramate titrated to 50 mg/day or maximum tolerated dose < 50 mg | 2 | 464 | Risk Difference (M‐H, Random, 95% CI) | ‐0.01 [‐0.10, 0.09] |
| 7.2 Topiramate titrated to 100 mg/day or maximum tolerated dose < 100 mg | 5 | 1631 | Risk Difference (M‐H, Random, 95% CI) | 0.02 [‐0.01, 0.04] |
| 7.3 Topiramate titrated to 200 mg/day or maximum tolerated dose < 200 mg | 4 | 959 | Risk Difference (M‐H, Random, 95% CI) | 0.06 [0.02, 0.11] |
| 8 Paresthesia Show forest plot | 8 | Risk Difference (M‐H, Random, 95% CI) | Subtotals only | |
| 8.1 Topiramate titrated to 50 mg/day or maximum tolerated dose < 50 mg | 3 | 584 | Risk Difference (M‐H, Random, 95% CI) | 0.21 [‐0.02, 0.43] |
| 8.2 Topiramate titrated to 100 mg/day or maximum tolerated dose < 100 mg | 5 | 1631 | Risk Difference (M‐H, Random, 95% CI) | 0.33 [0.18, 0.48] |
| 8.3 Topiramate titrated to 200 mg/day or maximum tolerated dose < 200 mg | 5 | 999 | Risk Difference (M‐H, Random, 95% CI) | 0.44 [0.39, 0.49] |
| 9 Taste disturbance Show forest plot | 6 | Risk Difference (M‐H, Random, 95% CI) | Subtotals only | |
| 9.1 Topiramate titrated to 50 mg/day or maximum tolerated dose < 50 mg | 2 | 464 | Risk Difference (M‐H, Random, 95% CI) | 0.14 [0.07, 0.21] |
| 9.2 Topiramate titrated to 100 mg/day or maximum tolerated dose < 100 mg | 5 | 1623 | Risk Difference (M‐H, Random, 95% CI) | 0.07 [0.01, 0.12] |
| 9.3 Topiramate titrated to 200 mg/day or maximum tolerated dose < 200 mg | 4 | 786 | Risk Difference (M‐H, Random, 95% CI) | 0.14 [0.09, 0.19] |
| 10 Weight loss Show forest plot | 6 | Risk Difference (M‐H, Random, 95% CI) | Subtotals only | |
| 10.1 Topiramate titrated to 50 mg/day or maximum tolerated dose < 50 mg | 2 | 464 | Risk Difference (M‐H, Random, 95% CI) | 0.04 [0.01, 0.07] |
| 10.2 Topiramate titrated to 100 mg/day or maximum tolerated dose < 100 mg | 4 | 1270 | Risk Difference (M‐H, Random, 95% CI) | 0.06 [0.03, 0.09] |
| 10.3 Topiramate titrated to 200 mg/day or maximum tolerated dose < 200 mg | 5 | 999 | Risk Difference (M‐H, Random, 95% CI) | 0.09 [0.07, 0.12] |
| 11 MSQ‐role function restrictive Show forest plot | 2 | Mean Difference (IV, Random, 95% CI) | Subtotals only | |
| 11.1 Topiramate titrated to 50 mg/day or maximum tolerated dose < 50 mg | 2 | 463 | Mean Difference (IV, Random, 95% CI) | 5.83 [2.25, 9.41] |
| 11.2 Topiramate titrated to 100 mg/day or maximum tolerated dose < 100 mg | 2 | 474 | Mean Difference (IV, Random, 95% CI) | 10.08 [6.55, 13.60] |
| 11.3 Topiramate titrated to 200 mg/day or maximum tolerated dose < 200 mg | 2 | 458 | Mean Difference (IV, Random, 95% CI) | 10.36 [6.68, 14.04] |
| 12 MSQ‐role function prevention Show forest plot | 2 | Mean Difference (IV, Random, 95% CI) | Subtotals only | |
| 12.1 Topiramate titrated to 50 mg/day or maximum tolerated dose < 50 mg | 2 | 463 | Mean Difference (IV, Random, 95% CI) | 2.84 [‐0.24, 5.92] |
| 12.2 Topiramate titrated to 100 mg/day or maximum tolerated dose < 100 mg | 2 | 474 | Mean Difference (IV, Random, 95% CI) | 6.39 [3.37, 9.41] |
| 12.3 Topiramate titrated to 200 mg/day or maximum tolerated dose < 200 mg | 2 | 458 | Mean Difference (IV, Random, 95% CI) | 5.06 [1.87, 8.25] |
| 13 MSQ‐emotional function Show forest plot | 2 | Mean Difference (IV, Random, 95% CI) | Subtotals only | |
| 13.1 Topiramate titrated to 50 mg/day or maximum tolerated dose < 50 mg | 2 | 463 | Mean Difference (IV, Random, 95% CI) | 4.58 [0.61, 8.54] |
| 13.2 Topiramate titrated to 100 mg/day or maximum tolerated dose < 100 mg | 2 | 474 | Mean Difference (IV, Random, 95% CI) | 10.22 [6.31, 14.14] |
| 13.3 Topiramate titrated to 200 mg/day or maximum tolerated dose < 200 mg | 2 | 458 | Mean Difference (IV, Random, 95% CI) | 8.45 [4.38, 12.52] |
| 14 SF‐36 role physical Show forest plot | 2 | Mean Difference (IV, Random, 95% CI) | Subtotals only | |
| 14.1 Topiramate titrated to 50 mg/day or maximum tolerated dose < 50 mg | 2 | 463 | Mean Difference (IV, Random, 95% CI) | 3.00 [‐3.89, 9.90] |
| 14.2 Topiramate titrated to 100 mg/day or maximum tolerated dose < 100 mg | 2 | 474 | Mean Difference (IV, Random, 95% CI) | 10.80 [‐2.42, 24.03] |
| 14.3 Topiramate titrated to 200 mg/day or maximum tolerated dose < 200 mg | 2 | 458 | Mean Difference (IV, Random, 95% CI) | 8.59 [0.65, 16.52] |
| 15 SF‐36 vitality Show forest plot | 2 | Mean Difference (IV, Random, 95% CI) | Subtotals only | |
| 15.1 Topiramate titrated to 50 mg/day or maximum tolerated dose < 50 mg | 2 | 463 | Mean Difference (IV, Random, 95% CI) | 2.08 [‐4.68, 8.84] |
| 15.2 Topiramate titrated to 100 mg/day or maximum tolerated dose < 100 mg | 2 | 474 | Mean Difference (IV, Random, 95% CI) | 4.48 [‐7.77, 16.73] |
| 15.3 Topiramate titrated to 200 mg/day or maximum tolerated dose < 200 mg | 2 | 458 | Mean Difference (IV, Random, 95% CI) | 1.36 [‐4.52, 7.24] |
| 16 SF‐36 physical functioning Show forest plot | 2 | Mean Difference (IV, Random, 95% CI) | Subtotals only | |
| 16.1 Topiramate titrated to 50 mg/day or maximum tolerated dose < 50 mg | 2 | 463 | Mean Difference (IV, Random, 95% CI) | 0.54 [‐3.28, 4.36] |
| 16.2 Topiramate titrated to 100 mg/day or maximum tolerated dose < 100 mg | 2 | 474 | Mean Difference (IV, Random, 95% CI) | 2.78 [‐3.29, 8.86] |
| 16.3 Topiramate titrated to 200 mg/day or maximum tolerated dose < 200 mg | 2 | 458 | Mean Difference (IV, Random, 95% CI) | ‐0.96 [‐5.27, 3.35] |
| 17 SF‐36 bodily pain Show forest plot | 2 | Mean Difference (IV, Random, 95% CI) | Subtotals only | |
| 17.1 Topiramate titrated to 50 mg/day or maximum tolerated dose < 50 mg | 2 | 463 | Mean Difference (IV, Random, 95% CI) | 4.35 [0.04, 8.66] |
| 17.2 Topiramate titrated to 100 mg/day or maximum tolerated dose < 100 mg | 2 | 474 | Mean Difference (IV, Random, 95% CI) | 6.35 [‐1.29, 14.00] |
| 17.3 Topiramate titrated to 200 mg/day or maximum tolerated dose < 200 mg | 2 | 458 | Mean Difference (IV, Random, 95% CI) | 5.12 [‐1.25, 11.49] |
| 18 SF‐36 general health Show forest plot | 2 | Mean Difference (IV, Random, 95% CI) | Subtotals only | |
| 18.1 Topiramate titrated to 50 mg/day or maximum tolerated dose < 50 mg | 2 | 463 | Mean Difference (IV, Random, 95% CI) | 1.45 [‐2.18, 5.08] |
| 18.2 Topiramate titrated to 100 mg/day or maximum tolerated dose < 100 mg | 2 | 474 | Mean Difference (IV, Random, 95% CI) | 4.18 [‐1.21, 9.57] |
| 18.3 Topiramate titrated to 200 mg/day or maximum tolerated dose < 200 mg | 2 | 458 | Mean Difference (IV, Random, 95% CI) | 2.58 [‐1.00, 6.15] |
| 19 SF‐36 social functioning Show forest plot | 2 | Mean Difference (IV, Random, 95% CI) | Subtotals only | |
| 19.1 Topiramate titrated to 50 mg/day or maximum tolerated dose < 50 mg | 2 | 463 | Mean Difference (IV, Random, 95% CI) | 2.00 [‐1.92, 5.92] |
| 19.2 Topiramate titrated to 100 mg/day or maximum tolerated dose < 100 mg | 2 | 474 | Mean Difference (IV, Random, 95% CI) | 3.13 [‐3.73, 9.99] |
| 19.3 Topiramate titrated to 200 mg/day or maximum tolerated dose < 200 mg | 2 | 458 | Mean Difference (IV, Random, 95% CI) | 1.94 [‐2.07, 5.96] |
| 20 SF‐36 role emotional Show forest plot | 2 | Mean Difference (IV, Random, 95% CI) | Subtotals only | |
| 20.1 Topiramate titrated to 50 mg/day or maximum tolerated dose < 50 mg | 2 | 463 | Mean Difference (IV, Random, 95% CI) | 2.30 [‐4.56, 9.16] |
| 20.2 Topiramate titrated to 100 mg/day or maximum tolerated dose < 100 mg | 2 | 474 | Mean Difference (IV, Random, 95% CI) | 4.64 [‐3.39, 12.68] |
| 20.3 Topiramate titrated to 200 mg/day or maximum tolerated dose < 200 mg | 2 | 458 | Mean Difference (IV, Random, 95% CI) | 2.75 [‐4.99, 10.48] |
| 21 SF‐36 mental health Show forest plot | 2 | Mean Difference (IV, Random, 95% CI) | Subtotals only | |
| 21.1 Topiramate titrated to 50 mg/day or maximum tolerated dose < 50 mg | 2 | 463 | Mean Difference (IV, Random, 95% CI) | 1.19 [‐4.59, 6.98] |
| 21.2 Topiramate titrated to 100 mg/day or maximum tolerated dose < 100 mg | 2 | 474 | Mean Difference (IV, Random, 95% CI) | 2.58 [‐5.65, 10.81] |
| 21.3 Topiramate titrated to 200 mg/day or maximum tolerated dose < 200 mg | 2 | 458 | Mean Difference (IV, Random, 95% CI) | 1.57 [‐4.21, 7.35] |
| Outcome or subgroup title | No. of studies | No. of participants | Statistical method | Effect size |
| 1 Headache frequency (change from baseline to post‐treatment, or post‐treatment alone) Show forest plot | 3 | Mean Difference (IV, Random, 95% CI) | Subtotals only | |
| 1.1 Topiramate 100 mg versus 50 mg | 2 | 479 | Mean Difference (IV, Random, 95% CI) | ‐0.71 [‐1.32, ‐0.10] |
| 1.2 Topiramate 200 mg versus 50 mg | 2 | 463 | Mean Difference (IV, Random, 95% CI) | ‐0.96 [‐1.53, ‐0.40] |
| 1.3 Topiramate 200 mg versus 100 mg | 3 | 756 | Mean Difference (IV, Random, 95% CI) | 0.03 [‐0.55, 0.61] |
| 2 Responders (patients with ≥ 50% reduction in headache frequency) Show forest plot | 3 | Odds Ratio (M‐H, Random, 95% CI) | Subtotals only | |
| 2.1 Topiramate 100 mg versus 50 mg | 2 | 478 | Odds Ratio (M‐H, Random, 95% CI) | 1.80 [1.25, 2.60] |
| 2.2 Topiramate 200 mg versus 50 mg | 2 | 462 | Odds Ratio (M‐H, Random, 95% CI) | 1.66 [1.15, 2.41] |
| 2.3 Topiramate 200 mg versus 100 mg | 3 | 756 | Odds Ratio (M‐H, Random, 95% CI) | 0.93 [0.69, 1.24] |
| 3 MSQ‐role function restrictive Show forest plot | 2 | Mean Difference (IV, Random, 95% CI) | Subtotals only | |
| 3.1 Topiramate 100 mg versus 50 mg | 2 | 479 | Mean Difference (IV, Random, 95% CI) | 4.22 [0.65, 7.80] |
| 3.2 Topiramate 200 mg versus 50 mg | 2 | 463 | Mean Difference (IV, Random, 95% CI) | 4.55 [0.82, 8.28] |
| 3.3 Topiramate 200 mg versus 100 mg | 2 | 474 | Mean Difference (IV, Random, 95% CI) | 0.31 [‐3.37, 3.99] |
| 4 MSQ‐role function prevention Show forest plot | 2 | Mean Difference (IV, Random, 95% CI) | Subtotals only | |
| 4.1 Topiramate 100 mg versus 50 mg | 2 | 479 | Mean Difference (IV, Random, 95% CI) | 3.54 [0.48, 6.60] |
| 4.2 Topiramate 200 mg versus 50 mg | 2 | 463 | Mean Difference (IV, Random, 95% CI) | 2.28 [‐2.13, 6.69] |
| 4.3 Topiramate 200 mg versus 100 mg | 2 | 474 | Mean Difference (IV, Random, 95% CI) | ‐1.18 [‐6.67, 4.30] |
| 5 MSQ‐emotional function Show forest plot | 2 | Mean Difference (IV, Random, 95% CI) | Subtotals only | |
| 5.1 Topiramate 100 mg versus 50 mg | 2 | 479 | Mean Difference (IV, Random, 95% CI) | 5.62 [1.67, 9.58] |
| 5.2 Topiramate 200 mg versus 50 mg | 2 | 463 | Mean Difference (IV, Random, 95% CI) | 3.90 [‐0.21, 8.02] |
| 5.3 Topiramate 200 mg versus 100 mg | 2 | 474 | Mean Difference (IV, Random, 95% CI) | ‐1.73 [‐5.80, 2.34] |
| 6 SF‐36 role physical Show forest plot | 2 | Mean Difference (IV, Random, 95% CI) | Subtotals only | |
| 6.1 Topiramate 100 mg versus 50 mg | 2 | 479 | Mean Difference (IV, Random, 95% CI) | 7.70 [‐8.27, 23.67] |
| 6.2 Topiramate 200 mg versus 50 mg | 2 | 463 | Mean Difference (IV, Random, 95% CI) | 5.51 [‐5.17, 16.19] |
| 6.3 Topiramate 200 mg versus 100 mg | 2 | 474 | Mean Difference (IV, Random, 95% CI) | ‐2.20 [‐9.31, 4.90] |
| 7 SF‐36 vitality Show forest plot | 2 | Mean Difference (IV, Random, 95% CI) | Subtotals only | |
| 7.1 Topiramate 100 mg versus 50 mg | 2 | 479 | Mean Difference (IV, Random, 95% CI) | 2.44 [‐3.05, 7.92] |
| 7.2 Topiramate 200 mg versus 50 mg | 2 | 463 | Mean Difference (IV, Random, 95% CI) | ‐0.63 [‐4.64, 3.39] |
| 7.3 Topiramate 200 mg versus 100 mg | 2 | 474 | Mean Difference (IV, Random, 95% CI) | ‐3.01 [‐9.38, 3.35] |
| 8 SF‐36 physical functioning Show forest plot | 2 | Mean Difference (IV, Random, 95% CI) | Subtotals only | |
| 8.1 Topiramate 100 mg versus 50 mg | 2 | 479 | Mean Difference (IV, Random, 95% CI) | 2.35 [‐1.02, 5.72] |
| 8.2 Topiramate 200 mg versus 50 mg | 2 | 463 | Mean Difference (IV, Random, 95% CI) | ‐1.44 [‐4.92, 2.04] |
| 8.3 Topiramate 200 mg versus 100 mg | 2 | 474 | Mean Difference (IV, Random, 95% CI) | ‐3.75 [‐7.18, ‐0.32] |
| 9 SF‐36 bodily pain Show forest plot | 2 | Mean Difference (IV, Random, 95% CI) | Subtotals only | |
| 9.1 Topiramate 100 mg versus 50 mg | 2 | 479 | Mean Difference (IV, Random, 95% CI) | 2.13 [‐1.83, 6.08] |
| 9.2 Topiramate 200 mg versus 50 mg | 2 | 463 | Mean Difference (IV, Random, 95% CI) | 0.85 [‐3.27, 4.96] |
| 9.3 Topiramate 200 mg versus 100 mg | 2 | 474 | Mean Difference (IV, Random, 95% CI) | ‐1.16 [‐5.23, 2.91] |
| 10 SF‐36 general health Show forest plot | 2 | Mean Difference (IV, Random, 95% CI) | Subtotals only | |
| 10.1 Topiramate 100 mg versus 50 mg | 2 | 479 | Mean Difference (IV, Random, 95% CI) | 2.72 [‐0.76, 6.21] |
| 10.2 Topiramate 200 mg versus 50 mg | 2 | 463 | Mean Difference (IV, Random, 95% CI) | 1.13 [‐4.36, 6.62] |
| 10.3 Topiramate 200 mg versus 100 mg | 2 | 474 | Mean Difference (IV, Random, 95% CI) | ‐1.60 [‐8.85, 5.65] |
| 11 SF‐36 social functioning Show forest plot | 2 | Mean Difference (IV, Random, 95% CI) | Subtotals only | |
| 11.1 Topiramate 100 mg versus 50 mg | 2 | 479 | Mean Difference (IV, Random, 95% CI) | 1.13 [‐5.53, 7.79] |
| 11.2 Topiramate 200 mg versus 50 mg | 2 | 463 | Mean Difference (IV, Random, 95% CI) | ‐0.06 [‐4.07, 3.96] |
| 11.3 Topiramate 200 mg versus 100 mg | 2 | 474 | Mean Difference (IV, Random, 95% CI) | ‐1.05 [‐5.56, 3.46] |
| 12 SF‐36 role emotional Show forest plot | 2 | Mean Difference (IV, Random, 95% CI) | Subtotals only | |
| 12.1 Topiramate 100 mg versus 50 mg | 2 | 479 | Mean Difference (IV, Random, 95% CI) | 2.33 [‐3.79, 8.45] |
| 12.2 Topiramate 200 mg versus 50 mg | 2 | 463 | Mean Difference (IV, Random, 95% CI) | 0.63 [‐5.69, 6.94] |
| 12.3 Topiramate 200 mg versus 100 mg | 2 | 474 | Mean Difference (IV, Random, 95% CI) | ‐1.65 [‐7.92, 4.63] |
| 13 SF‐36 mental health Show forest plot | 2 | Mean Difference (IV, Random, 95% CI) | Subtotals only | |
| 13.1 Topiramate 100 mg versus 50 mg | 2 | 479 | Mean Difference (IV, Random, 95% CI) | 1.31 [‐1.87, 4.49] |
| 13.2 Topiramate 200 mg versus 50 mg | 2 | 463 | Mean Difference (IV, Random, 95% CI) | 0.40 [‐2.87, 3.67] |
| 13.3 Topiramate 200 mg versus 100 mg | 2 | 474 | Mean Difference (IV, Random, 95% CI) | ‐0.87 [‐4.10, 2.36] |
| Outcome or subgroup title | No. of studies | No. of participants | Statistical method | Effect size |
| 1 Responders (patients with ≥ 50% reduction in headache frequency) Show forest plot | 1 | Odds Ratio (M‐H, Random, 95% CI) | Totals not selected | |
| 2 MIDAS score Show forest plot | 1 | Mean Difference (IV, Random, 95% CI) | Totals not selected | |
| Outcome or subgroup title | No. of studies | No. of participants | Statistical method | Effect size |
| 1 Headache frequency (post‐treatment) Show forest plot | 1 | Mean Difference (IV, Random, 95% CI) | Totals not selected | |
| 2 Responders (patients with ≥ 50% reduction in headache frequency) Show forest plot | 1 | Odds Ratio (M‐H, Random, 95% CI) | Totals not selected | |
| Outcome or subgroup title | No. of studies | No. of participants | Statistical method | Effect size |
| 1 Headache frequency (change from baseline to post‐treatment, or post‐treatment alone) Show forest plot | 2 | 342 | Mean Difference (IV, Random, 95% CI) | ‐0.14 [‐0.61, 0.34] |
| 1.1 Topiramate 50 mg versus propranolol 80 mg | 1 | 60 | Mean Difference (IV, Random, 95% CI) | ‐0.37 [‐1.15, 0.41] |
| 1.2 Topiramate 100 mg versus propranolol 160 mg | 1 | 282 | Mean Difference (IV, Random, 95% CI) | 0.0 [‐0.60, 0.60] |
| 2 Responders (patients with ≥ 50% reduction in headache frequency) Show forest plot | 1 | Odds Ratio (M‐H, Random, 95% CI) | Totals not selected | |
| Outcome or subgroup title | No. of studies | No. of participants | Statistical method | Effect size |
| 1 Headache frequency (post‐treatment) Show forest plot | 2 | 120 | Mean Difference (IV, Random, 95% CI) | ‐0.90 [‐1.58, ‐0.22] |
| 2 MIDAS score Show forest plot | 1 | Mean Difference (IV, Random, 95% CI) | Totals not selected | |
| Outcome or subgroup title | No. of studies | No. of participants | Statistical method | Effect size |
| 1 Headache frequency (change from baseline to post‐treatment) Show forest plot | 1 | Mean Difference (IV, Random, 95% CI) | Totals not selected | |
| 2 Responders (patients with ≥ 50% reduction in headache frequency) Show forest plot | 1 | Odds Ratio (M‐H, Random, 95% CI) | Totals not selected | |
| 3 Change from baseline in MSQoL Show forest plot | 1 | Mean Difference (IV, Random, 95% CI) | Totals not selected | |