Ciclo natural en la fecundación in vitro (FIV) para parejas subfértiles
Información
- DOI:
- https://doi.org/10.1002/14651858.CD010550.pub2Copiar DOI

- Base de datos:
-
- Cochrane Database of Systematic Reviews
- Versión publicada:
-
- 30 agosto 2013see what's new
- Tipo:
-
- Intervention
- Etapa:
-
- Review
- Grupo Editorial Cochrane:
-
Grupo Cochrane de Ginecología y fertilidad
- Copyright:
-
- Copyright © 2013 The Cochrane Collaboration. Published by John Wiley & Sons, Ltd.
Cifras del artículo
Altmetric:
Citado por:
Autores
Contributions of authors
Thomas Allersma and Astrid Cantineau extracted data. Thomas Allersma entered the data and wrote the review. Cindy Farquhar helped drafting the review, acted as a clinical expert and commented on the review. Astrid Cantineau acted as a clinical expert and commented on the review.
Sources of support
Internal sources
-
None, Not specified.
External sources
-
None, Not specified.
Declarations of interest
No declaration of interests.
Acknowledgements
We would like to thank the Cochrane Menstrual Disorders and Subfertility Group, in particular Marian Showell (Trials Search Co‐ordinator) for writing and running the search and Vanessa Jordan (New Zealand Cochrane Fellow) for answering questions.
We would also like to thank Dr Jane MacDougall and Dr Marco Sbracia for providing additional information, and Professor Hans Jakob Ingerslev for his response.
Version history
| Published | Title | Stage | Authors | Version |
| 2013 Aug 30 | Natural cycle in vitro fertilisation (IVF) for subfertile couples | Review | Thomas Allersma, Cindy Farquhar, Astrid EP Cantineau | |
| 2013 Jun 05 | Natural cycle IVF for subfertile couples | Protocol | Thomas Allersma, Cindy Farquhar, Astrid EP Cantineau | |
Differences between protocol and review
Because of the small amount of data, we were unable to subgroup the data as we stated in the protocol.
During the exclusion process, we realised we did not report important exclusion criteria in the protocol, so we added them in the review:
-
donor oocytes;
-
frozen embryo transfer;
-
animal studies.
Keywords
MeSH
Medical Subject Headings (MeSH) Keywords
- Fertilization in Vitro [*methods, statistics & numerical data];
- Infertility, Female [*therapy];
- Live Birth [epidemiology];
- Menstrual Cycle [*physiology];
- Ovarian Hyperstimulation Syndrome [epidemiology];
- Ovulation Induction [*methods];
- Patient Compliance [statistics & numerical data];
- *Pregnancy Rate;
- Randomized Controlled Trials as Topic;
Medical Subject Headings Check Words
Female; Humans; Pregnancy;

Study flow diagram.

Risk of bias summary: review authors' judgements about each risk of bias item for each included study.
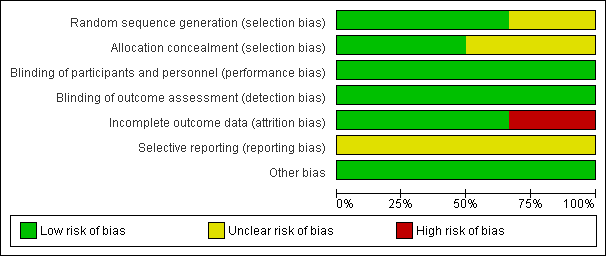
Risk of bias graph: review authors' judgements about each risk of bias item presented as percentages across all included studies.

Forest plot of comparison: 1 Natural cycle IVF versus standard IVF, outcome: 1.1 Live births.
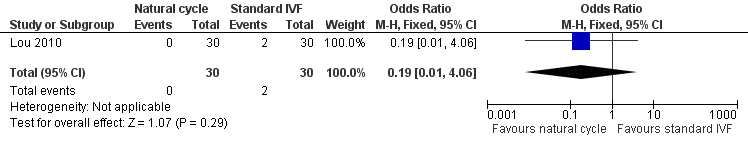
Forest plot of comparison: 1 Natural cycle IVF versus standard IVF, outcome: 1.2 OHSS.
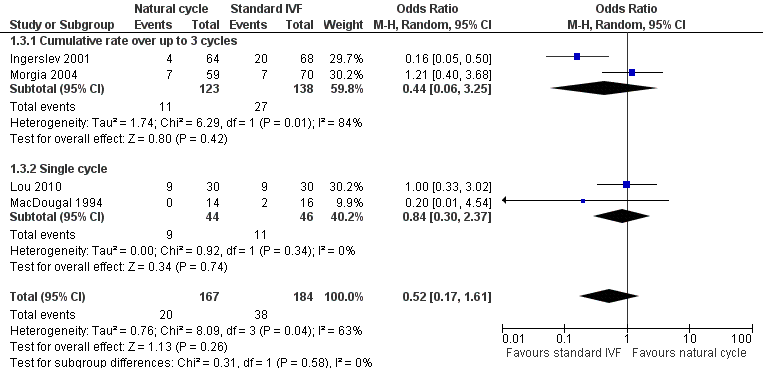
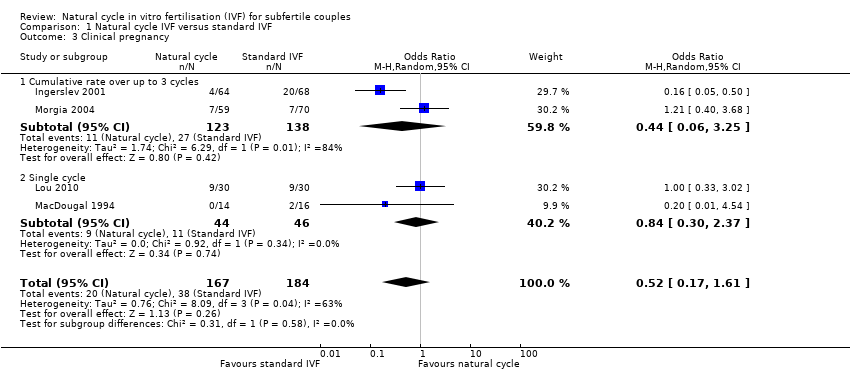
Forest plot of comparison: 1 Natural cycle IVF versus standard IVF, outcome: 1.3 Clinical pregnancy.

Forest plot of comparison: 1 Natural cycle IVF versus standard IVF, outcome: 1.4 Ongoing pregnancy.

Forest plot of comparison: 1 Natural cycle IVF versus standard IVF, outcome: 1.11 Cycle cancellations.
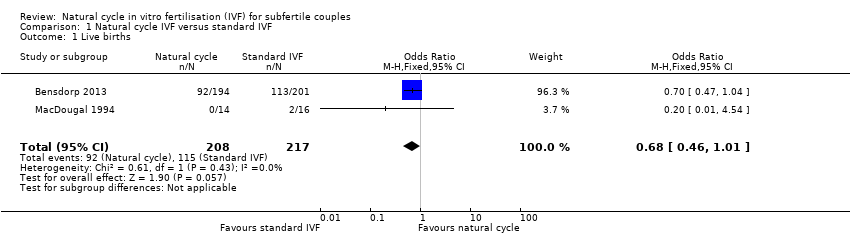
Comparison 1 Natural cycle IVF versus standard IVF, Outcome 1 Live births.

Comparison 1 Natural cycle IVF versus standard IVF, Outcome 2 OHSS.
Comparison 1 Natural cycle IVF versus standard IVF, Outcome 3 Clinical pregnancy.

Comparison 1 Natural cycle IVF versus standard IVF, Outcome 4 Ongoing pregnancy.
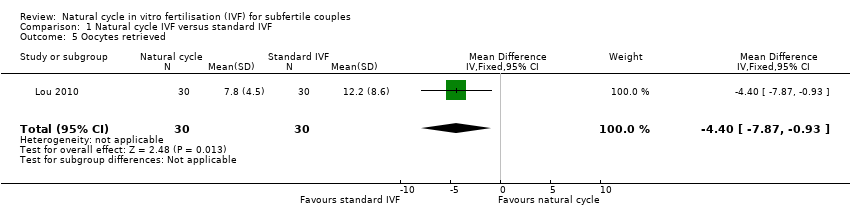
Comparison 1 Natural cycle IVF versus standard IVF, Outcome 5 Oocytes retrieved.

Comparison 1 Natural cycle IVF versus standard IVF, Outcome 8 Multiple pregnancies.
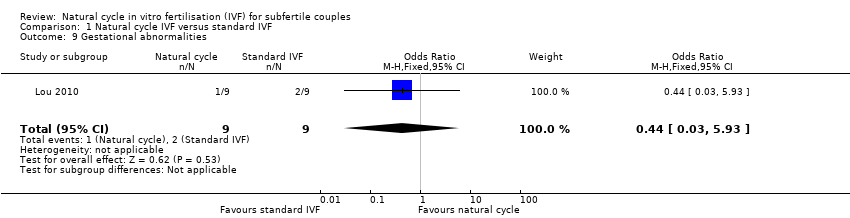
Comparison 1 Natural cycle IVF versus standard IVF, Outcome 9 Gestational abnormalities.

Comparison 1 Natural cycle IVF versus standard IVF, Outcome 11 Cycle cancellations.

Comparison 1 Natural cycle IVF versus standard IVF, Outcome 12 Costs.

Comparison 1 Natural cycle IVF versus standard IVF, Outcome 13 Subgroup analysis: Clinical pregnancy rate by intervention.
| DRAFT Natural cycle IVF versus standard IVF for subfertile couples | ||||||
| Patient or population: Subfertile couples | ||||||
| Outcomes | Illustrative comparative risks* (95% CI) | Relative effect | No of Participants | Quality of the evidence | Comments | |
| Assumed risk | Corresponding risk | |||||
| Standard IVF | Natural cycle IVF | |||||
| Live birth per woman | 530 per 1000 | 434 per 1000 | OR 0.68 | 425 | ⊕⊕⊕⊝ Moderate1 | |
| OHSS per woman | 67 per 1000 | 13 per 1000 | OR 0.19 | 60 | ⊕⊝⊝⊝ Very low2 | |
| Clinical pregnancy per woman | 207 per 1000 | 119 per 1000 | OR 0.52 | 351 | ⊕⊕⊝⊝ | |
| Ongoing pregnancy per woman | 494 per 1000 | 416 per 1000 | OR 0.72 | 485 | ⊕⊕⊕⊝ Moderate1,2 | |
| Multiple pregnancy per woman | 26 per 1000 | 20 per 1000 (7 to 58) | OR 0.76 (0.25 to 2.31) | 527 (2 studies) | ⊕⊝⊝⊝ Very low2 | |
| *The basis for the assumed risk is the median control group risk across studies. The corresponding risk (and its 95% confidence interval) is based on the assumed risk in the comparison group and the relative effect of the intervention (and its 95% CI). | ||||||
| GRADE Working Group grades of evidence | ||||||
| 1 Serious imprecision: confidence intervals compatible with no difference between the interventions or with substantial benefit from standard IVF 4 Substantial inconsistency (I2=63%), findings sensitive to choice of statistical model | ||||||
| Initial search result | After screening | |
| CENTRAL | 151 | 16 |
| EMBASE | 127 | 2 |
| MEDLINE | 110 | 3 |
| PsycINFO | 15 | 0 |
| MDSG | 28 | 3 |
| Clinicaltrials | 114 | 2 |
| CINAHL | 7 | 1 |
| WEBOFKN | 66 | 9 |
| TOTAL | 617 | 36 |
| Natural cycle | Stimulated cycle | Natural cycle | Stimulated cycle | |
| Cycles | 114 | 111 | 22 | 26 |
| Clinical pregnancy rate | 4 | 20 | 0 | 6 |
| Oocytes retrieved | 68 (0.92 ± 0.40) | 174 (1.83 ± 1.15) | ||
| Cycle cancellations | 40 | 16 | 6 | 1 |
| Outcome or subgroup title | No. of studies | No. of participants | Statistical method | Effect size |
| 1 Live births Show forest plot | 2 | 425 | Odds Ratio (M‐H, Fixed, 95% CI) | 0.68 [0.46, 1.01] |
| 2 OHSS Show forest plot | 1 | 60 | Odds Ratio (M‐H, Fixed, 95% CI) | 0.19 [0.01, 4.06] |
| 3 Clinical pregnancy Show forest plot | 4 | 351 | Odds Ratio (M‐H, Random, 95% CI) | 0.52 [0.17, 1.61] |
| 3.1 Cumulative rate over up to 3 cycles | 2 | 261 | Odds Ratio (M‐H, Random, 95% CI) | 0.44 [0.06, 3.25] |
| 3.2 Single cycle | 2 | 90 | Odds Ratio (M‐H, Random, 95% CI) | 0.84 [0.30, 2.37] |
| 4 Ongoing pregnancy Show forest plot | 3 | 485 | Odds Ratio (M‐H, Fixed, 95% CI) | 0.72 [0.50, 1.05] |
| 5 Oocytes retrieved Show forest plot | 1 | 60 | Mean Difference (IV, Fixed, 95% CI) | ‐4.40 [‐7.87, ‐0.93] |
| 8 Multiple pregnancies Show forest plot | 2 | 527 | Odds Ratio (M‐H, Fixed, 95% CI) | 0.76 [0.25, 2.31] |
| 9 Gestational abnormalities Show forest plot | 1 | 18 | Odds Ratio (M‐H, Fixed, 95% CI) | 0.44 [0.03, 5.93] |
| 11 Cycle cancellations Show forest plot | 2 | Odds Ratio (M‐H, Random, 95% CI) | Subtotals only | |
| 11.1 NC‐IVF versus stimulated cycle IVF | 2 | 159 | Odds Ratio (M‐H, Random, 95% CI) | 8.98 [0.20, 393.66] |
| 12 Costs Show forest plot | 1 | 60 | Std. Mean Difference (IV, Fixed, 95% CI) | ‐5.59 [‐6.75, ‐4.44] |
| 13 Subgroup analysis: Clinical pregnancy rate by intervention Show forest plot | 4 | 351 | Odds Ratio (M‐H, Random, 95% CI) | 0.52 [0.17, 1.61] |
| 13.1 NC IVF versus stimulated cycle IVF | 3 | 291 | Odds Ratio (M‐H, Random, 95% CI) | 0.39 [0.08, 1.89] |
| 13.2 MNC‐IVF versus stimulated cycle IVF | 1 | 60 | Odds Ratio (M‐H, Random, 95% CI) | 1.0 [0.33, 3.02] |