Revascularización endovascular versus tratamiento conservador para la claudicación intermitente
Información
- DOI:
- https://doi.org/10.1002/14651858.CD010512.pub2Copiar DOI

- Base de datos:
-
- Cochrane Database of Systematic Reviews
- Versión publicada:
-
- 08 marzo 2018see what's new
- Tipo:
-
- Intervention
- Etapa:
-
- Review
- Grupo Editorial Cochrane:
-
Grupo Cochrane de Vascular
- Copyright:
-
- Copyright © 2018 The Cochrane Collaboration. Published by John Wiley & Sons, Ltd.
Cifras del artículo
Altmetric:
Citado por:
Autores
Contributions of authors
FF: wrote the protocol; selected relevant studies, assessed methodological quality of included studies, extracted and analysed data, and wrote the review.
HF: contributed to the protocol; selected relevant studies, assessed methodological quality of included studies, extracted data, and contributed to the text of the review.
ER: contributed to the text of the review.
JT: contributed to the text of the review.
SS: contributed to the text of the review.
MH: resolved disagreements regarding inclusion of studies and contributed to the text of the review.
Sources of support
Internal sources
-
No sources of support supplied
External sources
-
Chief Scientist Office, Scottish Government Health Directorates, The Scottish Government, UK.
The Cochrane Vascular editorial base is supported by the Chief Scientist Office.
-
National Institute for Health Research (NIHR), UK.
This project was supported by the NIHR, via Cochrane Programme Grant funding to Cochrane Vascular (10/4001/14). The views and opinions expressed therein are those of the review authors and do not necessarily reflect those of the Systematic Reviews Programme, NIHR, NHS, or the Department. of Health.
Declarations of interest
FF: none known.
HF: none known.
ER: none known.
JT: none known: Chairman ClaudicatioNet: ClaudicatioNet (a not‐for‐profit organisation) is an integrated care network that brings together patients, physiotherapists, family physicians, and vascular surgeons. ClaudicatioNet aims for transparent and high‐quality care for all patients with peripheral vascular disease in the Netherlands.
SS: none known.
MH: MH's institution has received funding from ZonMW, Netherlands Organization for Scientific Research, National Institutes of Health, and Stichting Technische Wetenschappen for MH's research projects not related to this review. MH also reports receiving royalties from Cambridge University Press for the textbook, "Decision Making in Health and Medicine," and travel/meeting expenses from the 2010 and 2011 Clinical Update on Cardiac CT and MRI 2010 meetings, the 2011 International Society for Strategic Studies in Radiology (ISSSR) meeting, the 2012 ESR Referral Guidelines for Imaging Workshop, and the European Institute for Biomedical Imaging Research Scientific Advisory Board meetings.
To avoid potential bias regarding inclusion, one review author (HF) from this systematic review who was not involved in these studies independently performed study selection, data extraction and methodological quality assessment for two studies (Fakhry 2015; Spronk 2009).
Acknowledgements
We would like to acknowledge Dr. Karen Welch, who searched the Cochrane Vascular Specialised Register and the Cochrane Central Register of Controlled Trials.
Version history
| Published | Title | Stage | Authors | Version |
| 2018 Mar 08 | Endovascular revascularisation versus conservative management for intermittent claudication | Review | Farzin Fakhry, Hugo JP Fokkenrood, Sandra Spronk, Joep AW Teijink, Ellen V Rouwet, M G Myriam Hunink | |
| 2013 May 31 | Endovascular revascularisation versus conservative management for intermittent claudication | Protocol | Farzin Fakhry, Hugo JP Fokkenrood, Ellen V Rouwet, Joep AW Teijink, Sandra Spronk, M G Myriam Hunink | |
Differences between protocol and review
Since the time our protocol was published, we decided to use standardised mean difference (SMD) as treatment effect to account for the large variation in intensity of the treadmill protocols used to assess walking distances, instead of simulated metabolic equivalents (METS), as proposed in the protocol. We made this change because SMD could also be used to pool disease‐specific quality of life data (measured by different instruments) and because with SMD, no potential bias could be introduced through simulation of data, which would have been inevitable if we had used METS to assess treatment effect.
Keywords
MeSH
Medical Subject Headings (MeSH) Keywords
Medical Subject Headings Check Words
Humans;
PICO

Study flow diagram.
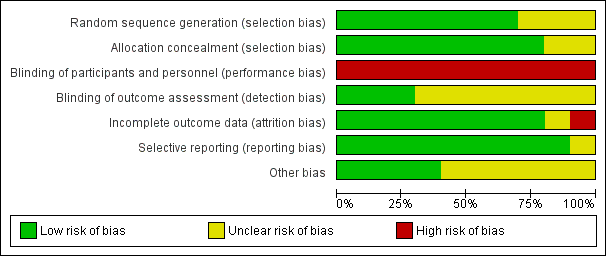
Risk of bias graph: review authors' judgements about each risk of bias item presented as percentages across all included studies.
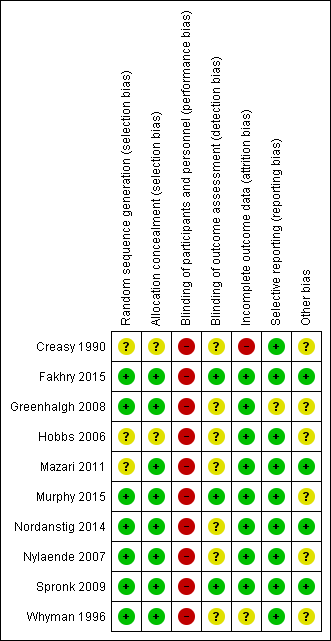
Risk of bias summary: review authors' judgements about each risk of bias item for each included study.
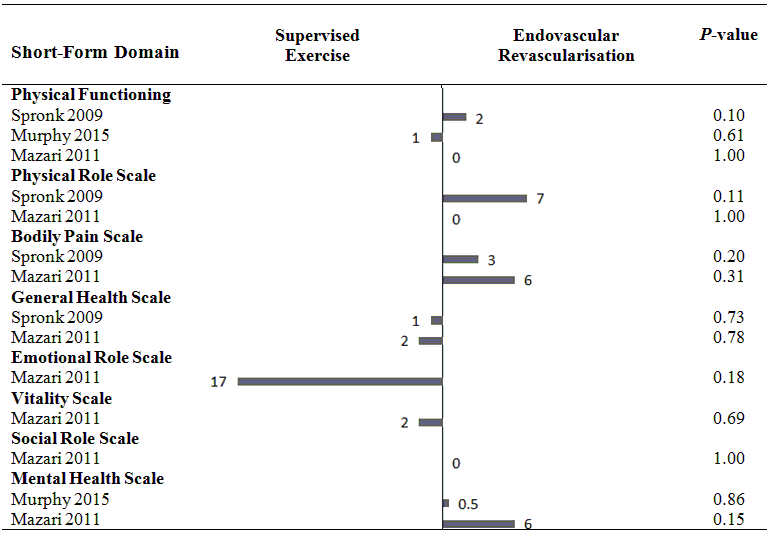
Health‐related quality of life (mean differences between groups).
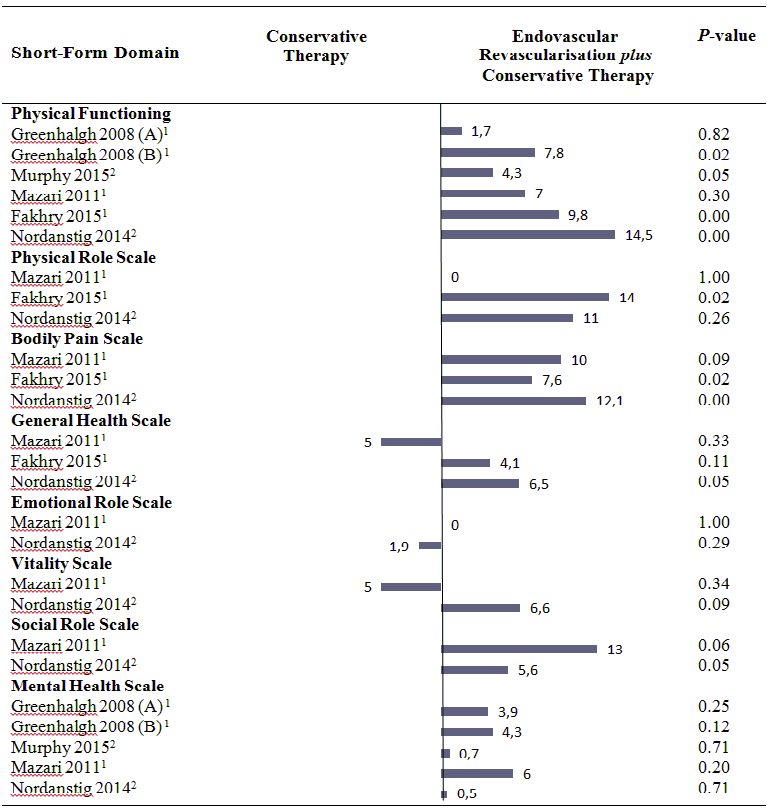
Health‐related quality of life (mean differences between groups).
A: Femoropoliteal trial.
B: Aortoiliac trial.
1 In this study, the comparison was endovascular revascularisation plus supervised exercise versus supervised exercise.
2 In this study, the comparison was endovascular revascularisation plus pharmacotherapy with cilostazol versus cilostazol.
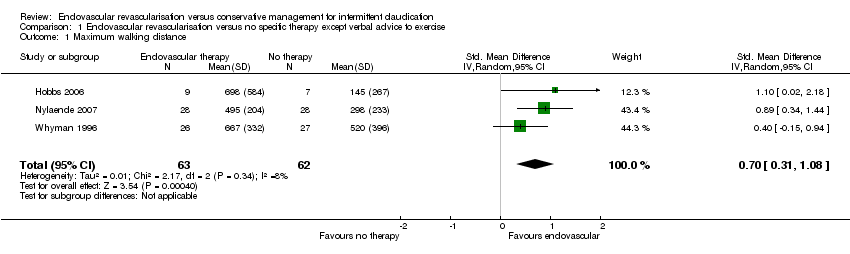
Comparison 1 Endovascular revascularisation versus no specific therapy except verbal advice to exercise, Outcome 1 Maximum walking distance.

Comparison 1 Endovascular revascularisation versus no specific therapy except verbal advice to exercise, Outcome 2 Maximum walking distance (long‐term).

Comparison 1 Endovascular revascularisation versus no specific therapy except verbal advice to exercise, Outcome 3 Pain‐free walking distance.

Comparison 1 Endovascular revascularisation versus no specific therapy except verbal advice to exercise, Outcome 4 Pain‐free walking distance (long‐term).

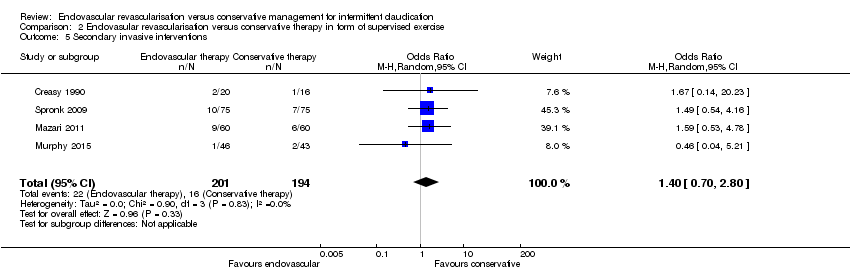
Comparison 1 Endovascular revascularisation versus no specific therapy except verbal advice to exercise, Outcome 5 Secondary invasive interventions.

Comparison 1 Endovascular revascularisation versus no specific therapy except verbal advice to exercise, Outcome 6 Mortality.

Comparison 2 Endovasular revascularisation versus conservative therapy in form of supervised exercise, Outcome 1 Maximum walking distance.

Comparison 2 Endovasular revascularisation versus conservative therapy in form of supervised exercise, Outcome 2 Maximum walking distance (long‐term).
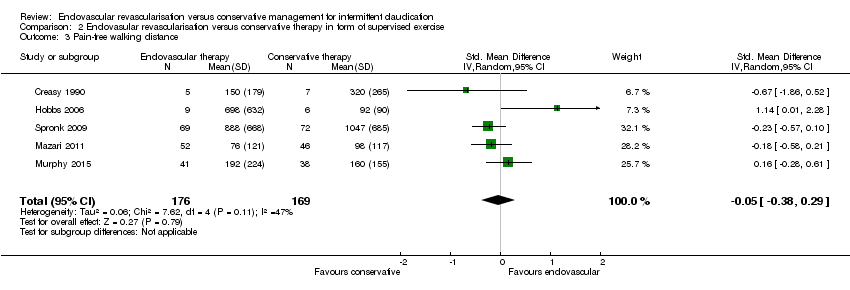
Comparison 2 Endovasular revascularisation versus conservative therapy in form of supervised exercise, Outcome 3 Pain‐free walking distance.

Comparison 2 Endovasular revascularisation versus conservative therapy in form of supervised exercise, Outcome 4 Pain‐free walking distance (long‐term).
Comparison 2 Endovasular revascularisation versus conservative therapy in form of supervised exercise, Outcome 5 Secondary invasive interventions.

Comparison 2 Endovasular revascularisation versus conservative therapy in form of supervised exercise, Outcome 6 Quality of life (disease‐specific).

Comparison 2 Endovasular revascularisation versus conservative therapy in form of supervised exercise, Outcome 7 Mortality.

Comparison 2 Endovasular revascularisation versus conservative therapy in form of supervised exercise, Outcome 8 Sensitivity analysis: maximum walking distance.

Comparison 2 Endovasular revascularisation versus conservative therapy in form of supervised exercise, Outcome 9 Sensitivity analysis: pain‐free walking distance.
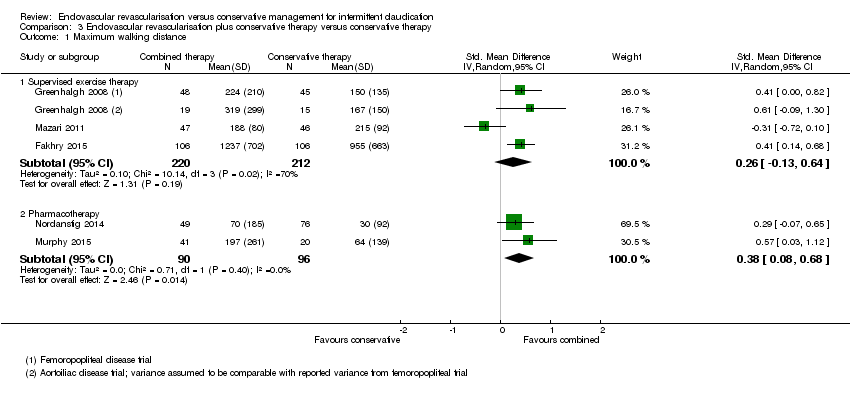
Comparison 3 Endovascular revascularisation plus conservative therapy versus conservative therapy, Outcome 1 Maximum walking distance.

Comparison 3 Endovascular revascularisation plus conservative therapy versus conservative therapy, Outcome 2 Maximum walking distance (long‐term).

Comparison 3 Endovascular revascularisation plus conservative therapy versus conservative therapy, Outcome 3 Pain‐free walking distance.
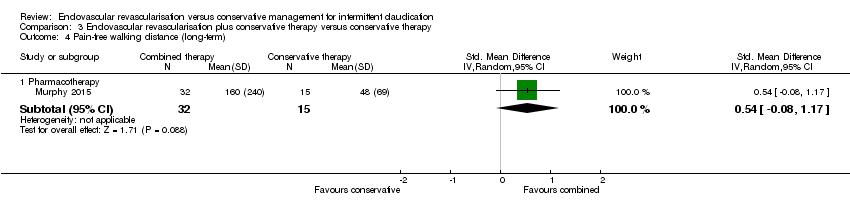
Comparison 3 Endovascular revascularisation plus conservative therapy versus conservative therapy, Outcome 4 Pain‐free walking distance (long‐term).

Comparison 3 Endovascular revascularisation plus conservative therapy versus conservative therapy, Outcome 5 Secondary invasive interventions.

Comparison 3 Endovascular revascularisation plus conservative therapy versus conservative therapy, Outcome 6 Quality of life (disease‐specific).

Comparison 3 Endovascular revascularisation plus conservative therapy versus conservative therapy, Outcome 7 Mortality.

Comparison 3 Endovascular revascularisation plus conservative therapy versus conservative therapy, Outcome 8 Sensitivity analysis: maximum walking distance.
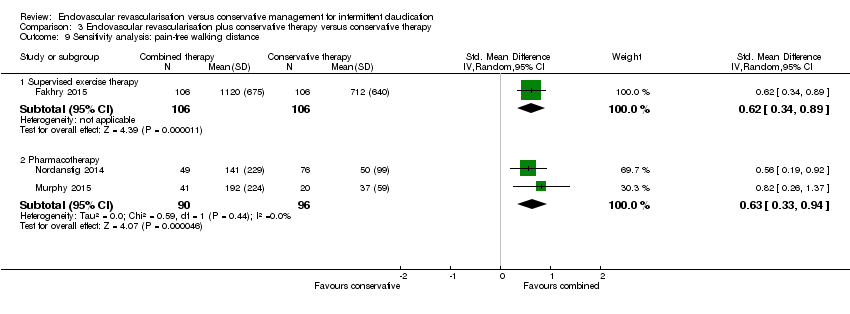
Comparison 3 Endovascular revascularisation plus conservative therapy versus conservative therapy, Outcome 9 Sensitivity analysis: pain‐free walking distance.
| Endovascular revascularisation compared with no specific therapy for intermittent claudication except verbal advice to exercise | ||||||
| Patient or population: intermittent claudication | ||||||
| Outcomes | Anticipated absolute effects* (95% CI) | Relative effect | No. of participants | Quality of the evidence | Comments | |
| Risk with no specific therapy | Risk with endovascular revascularisation | |||||
| Maximum walking distance | ‐ | Mean maximum walking distance in the intervention group was 0.70 standard deviations higher (0.31 higher to 1.08 higher). | ‐ | 125 | ⊕⊕⊕⊝ | |
| Maximum walking distance (long‐term) | ‐ | Mean maximum walking distance at long term in the intervention group was 0.67 standard deviations higher (0.30 lower to 1.63 higher). | ‐ | 103 | ⊕⊕⊝⊝ | |
| Pain‐free walking distance | ‐ | Mean pain‐free walking distance in the intervention group was 1.29 standard deviations higher (0.90 higher to 1.68 higher). | ‐ | 125 | ⊕⊕⊕⊝ | |
| Pain‐free walking distance (long‐term) | ‐ | Mean pain‐free walking distance at long term in the intervention group was 0.69 standard deviations higher (0.45 lower to 1.82 higher). | ‐ | 103 | ⊕⊕⊝⊝ | |
| Secondary invasive interventions | Study population | OR 0.81 | 118 | ⊕⊕⊕⊝ | ||
| 83 per 1000 | 69 per 1000 | |||||
| Quality of life (disease‐specific) | See comments. | See comments. | ‐ | ‐ | ‐ | One study reported no significant differences in disease‐specific QoL between study groups after 2 years without providing data |
| *The risk in the intervention group (and its 95% confidence interval) is based on the assumed risk in the comparison group and the relative effect of the intervention (and its 95% CI). Pooled standardised mean differences were interpreted using rules of thumb (< 0.40 = small, 0.40 to 0.70 = moderate, > 0.70 = large effect) as described in the Cochrane Handbook for Systematic Reviews of Interventions (Higgins 2011). | ||||||
| GRADE Working Group grades of evidence. | ||||||
| 1 Treatment consisted of cardiovascular risk factor management and only verbal exercise advice without any form of supervision. | ||||||
| Endovascular revascularisation compared with conservative therapy for intermittent claudication | ||||||
| Patient or population: intermittent claudication | ||||||
| Outcomes | Anticipated absolute effects* (95% CI) | Relative effect | No. of participants | Quality of the evidence | Comments | |
| Risk with conservative therapy | Risk with endovascular revascularisation | |||||
| Maximum walking distance | ‐ | Mean maximum walking distance in the intervention group was 0.42 standard deviations lower (0.87 lower to 0.04 higher). | ‐ | 345 | ⊕⊕⊕⊝ | |
| Maximum walking distance (long‐term) | ‐ | Mean maximum walking distance at long term in the intervention group was 0.02 standard deviations lower (0.36 lower to 0.32 higher). | ‐ | 184 | ⊕⊕⊕⊝ | |
| Pain‐free walking distance | ‐ | Mean pain‐free walking distance in the intervention group was 0.05 standard deviations lower (0.38 lower to 0.29 higher). | ‐ | 345 | ⊕⊕⊕⊝ | |
| Pain‐free walking distance (long‐term) | ‐ | Mean pain‐free walking distance at long term in the intervention group was 0.11 standard deviations higher (0.26 lower to 0.48 higher). | ‐ | 147 | ⊕⊕⊕⊝ | |
| Secondary invasive interventions | Study population | OR 1.40 | 395 | ⊕⊕⊕⊕ | ||
| 82 per 1000 | 112 per 1000 | |||||
| Quality of life (disease‐specific) | ‐ | Mean quality of life (disease‐specific) in the intervention group was 0.18 standard deviations higher (0.04 lower to 0.41 higher). | ‐ | 301 | ⊕⊕⊕⊕ | |
| *The risk in the intervention group (and its 95% confidence interval) is based on the assumed risk in the comparison group and the relative effect of the intervention (and its 95% CI). Pooled standardised mean differences were interpreted using rules of thumb (< 0.40 = small, 0.40 to 0.70 = moderate, > 0.70 = large effect), as described in the Cochrane Handbook for Systematic Reviews of Interventions (Higgins 2011). | ||||||
| GRADE Working Group grades of evidence. | ||||||
| 1 Supervised exercise consisted of only supervised exercise in four studies and a combination of supervised exercise and pharmacotherapy with cilostazol in one study. | ||||||
| Endovascular revascularisation plus conservative therapy compared with conservative therapy alone for intermittent claudication | ||||||
| Patient or population: intermittent claudication | ||||||
| Outcomes | Anticipated absolute effects* (95% CI) | Relative effect | No. of participants | Quality of the evidence | Comments | |
| Risk with conservative therapy | Risk with endovascular revascularisation plus conservative therapy | |||||
| Conservative therapy consists of supervised exercise | ||||||
| Maximum walking distance | ‐ | Mean maximum walking distance in the intervention group was 0.26 standard deviations higher (0.13 lower to 0.64 higher). | ‐ | 432 | ⊕⊕⊕⊝ | |
| Maximum walking distance (long‐term) | ‐ | Mean maximum walking distance at long term in the intervention group was 1.18 standard deviations higher (0.65 higher to 1.70 higher). | ‐ | 106 | ⊕⊕⊝⊝ | |
| Pain‐free walking distance | ‐ | Mean pain‐free walking distance in the intervention group was 0.33 standard deviations higher (0.26 lower to 0.93 higher). | ‐ | 305 | ⊕⊕⊕⊝ | |
| Pain‐free walking distance (long‐term) | See comments. | See comments. | ‐ | ‐ | ‐ | None of the studies reported any quantitative data on pain‐free walking distance at long term |
| Secondary invasive interventions | Study population | OR 0.27 | 457 | ⊕⊕⊕⊕ | ||
| 164 per 1000 | 50 per 1000 | |||||
| Quality of life (disease‐specific) | ‐ | Mean quality of life (disease‐specific) in the intervention group was 0.25 standard deviations higher (0.05 lower to 0.56 higher). | ‐ | 330 | ⊕⊕⊕⊝ | |
| Conservative therapy consists of pharmacotherapy (cilostazol) | ||||||
| Maximum walking distance | ‐ | Mean maximum walking distance in the intervention group was 0.38 standard deviations higher (0.08 higher to 0.68 higher). | ‐ | 186 | ⊕⊕⊕⊕ | |
| Maximum walking distance (long‐term) | ‐ | Mean maximum walking distance at long term in the intervention group was 0.72 standard deviations higher (0.09 higher to 1.36 higher). | ‐ | 47 | See comments. | Only 1 small RCT included in this analysis, no meaningful grading of quality of evidence possible |
| Pain‐free walking distance | ‐ | Mean pain‐free walking distance in the intervention group was 0.63 standard deviations higher (0.33 higher to 0.94 higher). | ‐ | 186 | ⊕⊕⊕⊕ | |
| Pain‐free walking distance (long‐term) | ‐ | Mean pain‐free walking distance at long‐term in the intervention group was 0.54 standard deviations higher (0.08 lower to 1.17 higher). | ‐ | 47 | See comments. | Only one small RCT included in this analysis, no meaningful grading of quality of evidence possible |
| Secondary invasive interventions | Study population | OR 1.83 | 199 | ⊕⊕⊕⊕ | ||
| 69 per 1000 | 120 per 1000 | |||||
| Quality of life (disease‐specific) | ‐ | Mean quality of life (disease‐specific) in the intervention group was 0.59 standard deviations higher (0.27 higher to 0.91 higher). | ‐ | 170 | ⊕⊕⊕⊕ | |
| *The risk in the intervention group (and its 95% confidence interval) is based on the assumed risk in the comparison group and the relative effect of the intervention (and its 95% CI). Pooled standardised mean differences were interpreted using rules of thumb (< 0.40 = small, 0.40 to 0.70 = moderate, > 0.70 = large effect), as described in the Cochrane Handbook for Systematic Reviews of Interventions (Higgins 2011). | ||||||
| GRADE Working Group grades of evidence. | ||||||
| 1 Conservative therapy consisted of supervised exercise in three studies and of pharmacotherapy with cilostazol and only advice to exercise in two studies. | ||||||
| Study | Groin haematoma | Artery dissection |
| 3/20 | 1/20 | |
| 5/106 | 2/106 | |
| 8/67 | 1/67 | |
| nr | 2/46 | |
| 1/52 | nr | |
| 6/75 | 1/75 | |
| nr: not reported. | ||
| Outcome or subgroup title | No. of studies | No. of participants | Statistical method | Effect size |
| 1 Maximum walking distance Show forest plot | 3 | 125 | Std. Mean Difference (IV, Random, 95% CI) | 0.70 [0.31, 1.08] |
| 2 Maximum walking distance (long‐term) Show forest plot | 2 | 103 | Std. Mean Difference (IV, Random, 95% CI) | 0.67 [‐0.30, 1.63] |
| 3 Pain‐free walking distance Show forest plot | 3 | 125 | Std. Mean Difference (IV, Random, 95% CI) | 1.29 [0.90, 1.68] |
| 4 Pain‐free walking distance (long‐term) Show forest plot | 2 | 103 | Std. Mean Difference (IV, Random, 95% CI) | 0.69 [‐0.45, 1.82] |
| 5 Secondary invasive interventions Show forest plot | 2 | 118 | Odds Ratio (M‐H, Random, 95% CI) | 0.81 [0.12, 5.28] |
| 6 Mortality Show forest plot | 3 | 136 | Odds Ratio (M‐H, Random, 95% CI) | 0.75 [0.13, 4.44] |
| Outcome or subgroup title | No. of studies | No. of participants | Statistical method | Effect size |
| 1 Maximum walking distance Show forest plot | 5 | 345 | Std. Mean Difference (IV, Random, 95% CI) | ‐0.42 [‐0.87, 0.04] |
| 2 Maximum walking distance (long‐term) Show forest plot | 3 | 184 | Std. Mean Difference (IV, Random, 95% CI) | ‐0.02 [‐0.36, 0.32] |
| 3 Pain‐free walking distance Show forest plot | 5 | 345 | Std. Mean Difference (IV, Random, 95% CI) | ‐0.05 [‐0.38, 0.29] |
| 4 Pain‐free walking distance (long‐term) Show forest plot | 2 | 147 | Std. Mean Difference (IV, Random, 95% CI) | 0.11 [‐0.26, 0.48] |
| 5 Secondary invasive interventions Show forest plot | 4 | 395 | Odds Ratio (M‐H, Random, 95% CI) | 1.40 [0.70, 2.80] |
| 6 Quality of life (disease‐specific) Show forest plot | 3 | 301 | Std. Mean Difference (IV, Random, 95% CI) | 0.18 [‐0.04, 0.41] |
| 7 Mortality Show forest plot | 5 | 435 | Odds Ratio (M‐H, Random, 95% CI) | 0.84 [0.35, 2.00] |
| 8 Sensitivity analysis: maximum walking distance Show forest plot | 3 | 232 | Std. Mean Difference (IV, Random, 95% CI) | ‐0.52 [‐0.98, ‐0.07] |
| 9 Sensitivity analysis: pain‐free walking distance Show forest plot | 3 | 232 | Std. Mean Difference (IV, Random, 95% CI) | ‐0.11 [‐0.46, 0.23] |
| Outcome or subgroup title | No. of studies | No. of participants | Statistical method | Effect size |
| 1 Maximum walking distance Show forest plot | 5 | Std. Mean Difference (IV, Random, 95% CI) | Subtotals only | |
| 1.1 Supervised exercise therapy | 3 | 432 | Std. Mean Difference (IV, Random, 95% CI) | 0.26 [‐0.13, 0.64] |
| 1.2 Pharmacotherapy | 2 | 186 | Std. Mean Difference (IV, Random, 95% CI) | 0.38 [0.08, 0.68] |
| 2 Maximum walking distance (long‐term) Show forest plot | 2 | Std. Mean Difference (IV, Random, 95% CI) | Subtotals only | |
| 2.1 Supervised exercise therapy | 1 | 106 | Std. Mean Difference (IV, Random, 95% CI) | 1.18 [0.65, 1.70] |
| 2.2 Pharmacotherapy | 1 | 47 | Std. Mean Difference (IV, Random, 95% CI) | 0.72 [0.09, 1.36] |
| 3 Pain‐free walking distance Show forest plot | 4 | Std. Mean Difference (IV, Random, 95% CI) | Subtotals only | |
| 3.1 Supervised exercise therapy | 2 | 305 | Std. Mean Difference (IV, Random, 95% CI) | 0.33 [‐0.26, 0.93] |
| 3.2 Pharmacotherapy | 2 | 186 | Std. Mean Difference (IV, Random, 95% CI) | 0.63 [0.33, 0.94] |
| 4 Pain‐free walking distance (long‐term) Show forest plot | 1 | Std. Mean Difference (IV, Random, 95% CI) | Subtotals only | |
| 4.1 Pharmacotherapy | 1 | 47 | Std. Mean Difference (IV, Random, 95% CI) | 0.54 [‐0.08, 1.17] |
| 5 Secondary invasive interventions Show forest plot | 5 | Odds Ratio (M‐H, Random, 95% CI) | Subtotals only | |
| 5.1 Supervised exercise therapy | 3 | 457 | Odds Ratio (M‐H, Random, 95% CI) | 0.27 [0.13, 0.55] |
| 5.2 Pharmacotherapy | 2 | 199 | Odds Ratio (M‐H, Random, 95% CI) | 1.83 [0.49, 6.83] |
| 6 Quality of life (disease‐specific) Show forest plot | 4 | Std. Mean Difference (IV, Random, 95% CI) | Subtotals only | |
| 6.1 Supervised exercise therapy | 2 | 330 | Std. Mean Difference (IV, Random, 95% CI) | 0.25 [‐0.05, 0.56] |
| 6.2 Pharmacotherapy | 2 | 170 | Std. Mean Difference (IV, Random, 95% CI) | 0.59 [0.27, 0.91] |
| 7 Mortality Show forest plot | 5 | Odds Ratio (M‐H, Random, 95% CI) | Subtotals only | |
| 7.1 Supervised exercise therapy | 3 | 457 | Odds Ratio (M‐H, Random, 95% CI) | 0.67 [0.20, 2.21] |
| 7.2 Pharmacotherapy | 2 | 201 | Odds Ratio (M‐H, Random, 95% CI) | 1.30 [0.14, 11.92] |
| 8 Sensitivity analysis: maximum walking distance Show forest plot | 4 | Std. Mean Difference (IV, Random, 95% CI) | Subtotals only | |
| 8.1 Supervised exercise therapy | 2 | 339 | Std. Mean Difference (IV, Random, 95% CI) | 0.43 [0.21, 0.65] |
| 8.2 Pharmacotherapy | 2 | 186 | Std. Mean Difference (IV, Random, 95% CI) | 0.38 [0.08, 0.68] |
| 9 Sensitivity analysis: pain‐free walking distance Show forest plot | 3 | Std. Mean Difference (IV, Random, 95% CI) | Subtotals only | |
| 9.1 Supervised exercise therapy | 1 | 212 | Std. Mean Difference (IV, Random, 95% CI) | 0.62 [0.34, 0.89] |
| 9.2 Pharmacotherapy | 2 | 186 | Std. Mean Difference (IV, Random, 95% CI) | 0.63 [0.33, 0.94] |