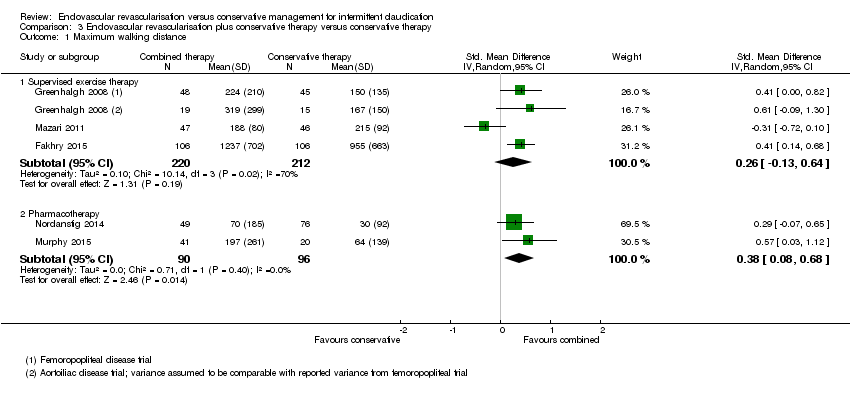
| 1 Maximum walking distance Show forest plot | 5 | | Std. Mean Difference (IV, Random, 95% CI) | Subtotals only |
|
| 1.1 Supervised exercise therapy | 3 | 432 | Std. Mean Difference (IV, Random, 95% CI) | 0.26 [‐0.13, 0.64] |
| 1.2 Pharmacotherapy | 2 | 186 | Std. Mean Difference (IV, Random, 95% CI) | 0.38 [0.08, 0.68] |
| 2 Maximum walking distance (long‐term) Show forest plot | 2 | | Std. Mean Difference (IV, Random, 95% CI) | Subtotals only |
|
| 2.1 Supervised exercise therapy | 1 | 106 | Std. Mean Difference (IV, Random, 95% CI) | 1.18 [0.65, 1.70] |
| 2.2 Pharmacotherapy | 1 | 47 | Std. Mean Difference (IV, Random, 95% CI) | 0.72 [0.09, 1.36] |
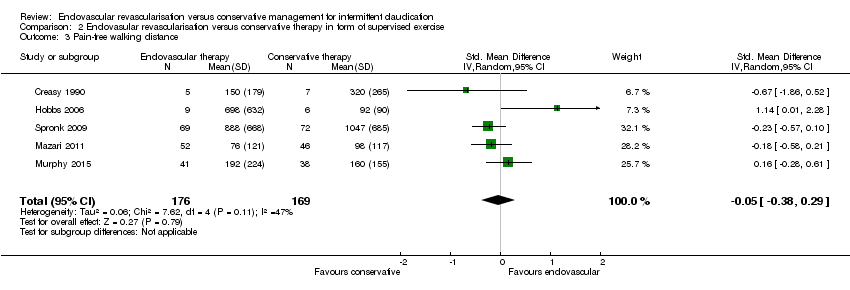
| 3 Pain‐free walking distance Show forest plot | 4 | | Std. Mean Difference (IV, Random, 95% CI) | Subtotals only |
|
| 3.1 Supervised exercise therapy | 2 | 305 | Std. Mean Difference (IV, Random, 95% CI) | 0.33 [‐0.26, 0.93] |
| 3.2 Pharmacotherapy | 2 | 186 | Std. Mean Difference (IV, Random, 95% CI) | 0.63 [0.33, 0.94] |
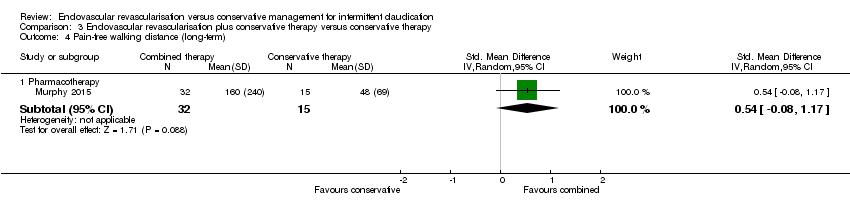
| 4 Pain‐free walking distance (long‐term) Show forest plot | 1 | | Std. Mean Difference (IV, Random, 95% CI) | Subtotals only |
|
| 4.1 Pharmacotherapy | 1 | 47 | Std. Mean Difference (IV, Random, 95% CI) | 0.54 [‐0.08, 1.17] |
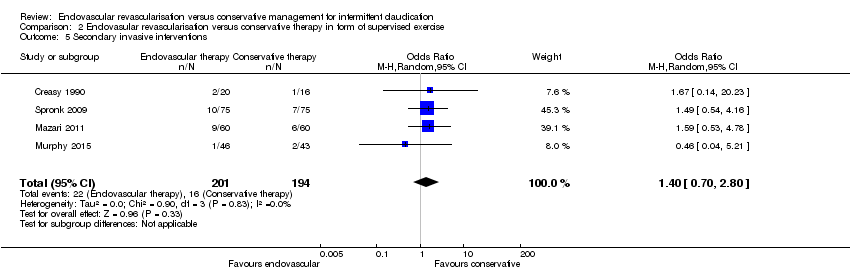
| 5 Secondary invasive interventions Show forest plot | 5 | | Odds Ratio (M‐H, Random, 95% CI) | Subtotals only |
|
| 5.1 Supervised exercise therapy | 3 | 457 | Odds Ratio (M‐H, Random, 95% CI) | 0.27 [0.13, 0.55] |
| 5.2 Pharmacotherapy | 2 | 199 | Odds Ratio (M‐H, Random, 95% CI) | 1.83 [0.49, 6.83] |
| 6 Quality of life (disease‐specific) Show forest plot | 4 | | Std. Mean Difference (IV, Random, 95% CI) | Subtotals only |
|
| 6.1 Supervised exercise therapy | 2 | 330 | Std. Mean Difference (IV, Random, 95% CI) | 0.25 [‐0.05, 0.56] |
| 6.2 Pharmacotherapy | 2 | 170 | Std. Mean Difference (IV, Random, 95% CI) | 0.59 [0.27, 0.91] |
| 7 Mortality Show forest plot | 5 | | Odds Ratio (M‐H, Random, 95% CI) | Subtotals only |
|
| 7.1 Supervised exercise therapy | 3 | 457 | Odds Ratio (M‐H, Random, 95% CI) | 0.67 [0.20, 2.21] |
| 7.2 Pharmacotherapy | 2 | 201 | Odds Ratio (M‐H, Random, 95% CI) | 1.30 [0.14, 11.92] |
| 8 Sensitivity analysis: maximum walking distance Show forest plot | 4 | | Std. Mean Difference (IV, Random, 95% CI) | Subtotals only |
|
| 8.1 Supervised exercise therapy | 2 | 339 | Std. Mean Difference (IV, Random, 95% CI) | 0.43 [0.21, 0.65] |
| 8.2 Pharmacotherapy | 2 | 186 | Std. Mean Difference (IV, Random, 95% CI) | 0.38 [0.08, 0.68] |
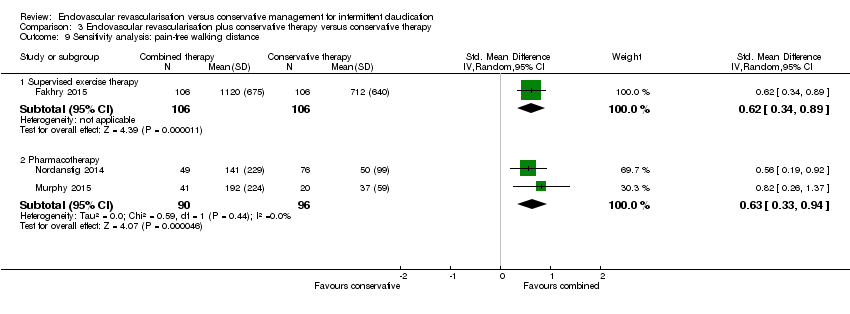
| 9 Sensitivity analysis: pain‐free walking distance Show forest plot | 3 | | Std. Mean Difference (IV, Random, 95% CI) | Subtotals only |
|
| 9.1 Supervised exercise therapy | 1 | 212 | Std. Mean Difference (IV, Random, 95% CI) | 0.62 [0.34, 0.89] |
| 9.2 Pharmacotherapy | 2 | 186 | Std. Mean Difference (IV, Random, 95% CI) | 0.63 [0.33, 0.94] |