Quimiorradioterapia versus quimiorradioterapia más cirugía para el cáncer esofágico
Información
- DOI:
- https://doi.org/10.1002/14651858.CD010511.pub2Copiar DOI

- Base de datos:
-
- Cochrane Database of Systematic Reviews
- Versión publicada:
-
- 22 agosto 2017see what's new
- Tipo:
-
- Intervention
- Etapa:
-
- Review
- Grupo Editorial Cochrane:
-
Grupo Cochrane de Salud digestiva
- Copyright:
-
- Copyright © 2017 The Cochrane Collaboration. Published by John Wiley & Sons, Ltd.
Cifras del artículo
Altmetric:
Citado por:
Autores
Contributions of authors
Conception and design: BAV, YYS, GYK, JCST.
Protocol writing: BAV, YYS.
Final approval of protocol: BAV, YYS, GYK, CNL, JJL, JCST.
Manuscript writing: BAV, YYS.
Final approval of manuscript: BAV, YYS, GYK, CNL, JJL, JCST.
Declarations of interest
BAV: none known.
YYS: none known.
GYK: none known.
CNL: none known.
JJL: none known.
JCST: none known.
Acknowledgements
We would like to thank the Cochrane Upper Gastrointestinal and Pancreatic Diseases Group for assisting us with the search strategy. We thank Ms Karin Dearness, Managing Editor, for providing administrative support. We would also like to thank our reviewers: Ms. Sarah Rhodes, Dr. Richard Malthaner, Dr. Rebecca Wong.
Version history
| Published | Title | Stage | Authors | Version |
| 2017 Aug 22 | Chemoradiotherapy versus chemoradiotherapy plus surgery for esophageal cancer | Review | Balamurugan A Vellayappan, Yu Yang Soon, Geoffrey Y Ku, Cheng Nang Leong, Jiade J Lu, Jeremy CS Tey | |
| 2013 May 31 | Chemoradiotherapy versus chemoradiotherapy plus surgery for esophageal cancer | Protocol | Balamurugan A Vellayappan, Yu Yang Soon, Geoffrey Y Ku, Cheng Nang Leong, Jiade J Lu, Jeremy CS Tey | |
Differences between protocol and review
In our protocol, we stated that we intended to perform subgroup and sensitivity analyses. However, this was not carried out, due to limited available information and the presence of only two RCTs.
Keywords
MeSH
Medical Subject Headings (MeSH) Keywords
- *Chemoradiotherapy [adverse effects, mortality];
- *Esophagectomy [mortality];
- Carcinoma [mortality, pathology, surgery, therapy];
- Carcinoma, Squamous Cell [mortality, pathology, surgery, *therapy];
- Cisplatin;
- Combined Modality Therapy [adverse effects, methods, mortality];
- Deglutition Disorders [therapy];
- Esophageal Neoplasms [mortality, pathology, surgery, *therapy];
- Fluorouracil [administration & dosage];
- Neoplasm Recurrence, Local;
- Quality of Life;
- Randomized Controlled Trials as Topic;
Medical Subject Headings Check Words
Humans;
PICO

Risk of bias summary: review authors' judgements about each risk of bias item for each included study.
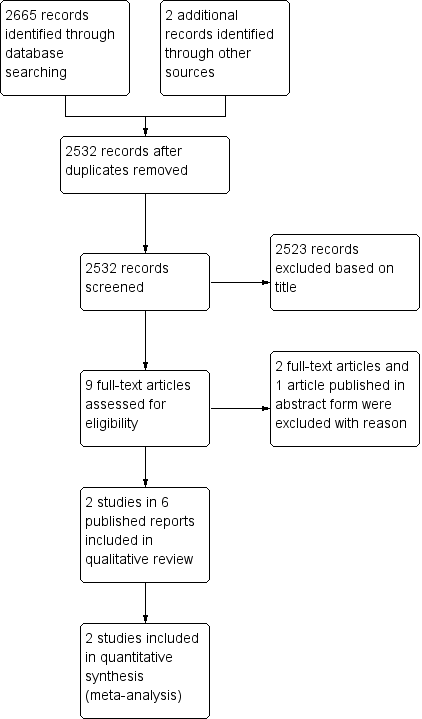
PRISMA flow diagram.
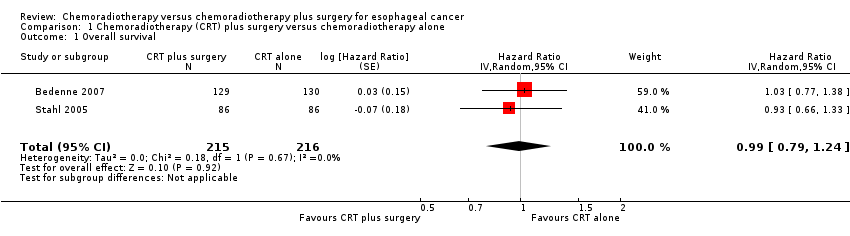
Comparison 1 Chemoradiotherapy (CRT) plus surgery versus chemoradiotherapy alone, Outcome 1 Overall survival.

Comparison 1 Chemoradiotherapy (CRT) plus surgery versus chemoradiotherapy alone, Outcome 2 Freedom from locoregional relapse.
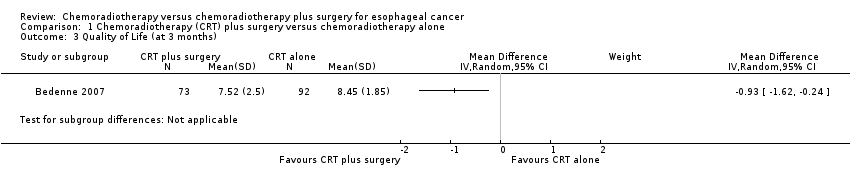
Comparison 1 Chemoradiotherapy (CRT) plus surgery versus chemoradiotherapy alone, Outcome 3 Quality of Life (at 3 months).

Comparison 1 Chemoradiotherapy (CRT) plus surgery versus chemoradiotherapy alone, Outcome 4 Treatment‐related mortality.

Comparison 1 Chemoradiotherapy (CRT) plus surgery versus chemoradiotherapy alone, Outcome 5 Use of salvage procedures for dysphagia.
| Chemoradiotherapy versus chemoradiotherapy plus surgery for esophageal cancer | |||||
| Patient or population: nonmetastatic esophageal cancer | |||||
| Outcomes | Anticipated absolute effects* (95% CI) | Relative effect (95% CI) | No of participants | Quality of the evidence | |
| Risk with chemoradiotherapy alone | Risk with chemoradiotherapy plus surgery | ||||
| Overall survival | 35.4% to 40.0% at 2 years | 34.0% to 39.9% at 2 years | HR 0.99 (95% CI 0.79 to 1.24) | 431 | ⊕⊕⊕⊕ |
| Freedom from locoregional relapse Follow‐up: median 4 to 6 years | 40.7% to 57.0% at 2 years | 64.3% to 66.4% at 2 years | HR 0.55 (95% CI 0.39 to 0.76) | 431 | ⊕⊕⊕⊝ |
| Quality of Life assessed with: Spitzer QoL index Scale: 0 to10 Follow‐up: 3 months | the mean Q0L score was 7.52 points in the chemoradiotherapy alone group | the mean QoL score in the chemoradiotherapy plus surgery group was 0.93 points worse (from ‐1.62 worse to ‐0.24 worse) | 165 (1 RCT) | ⊕⊝⊝⊝ | |
| Treatment‐related mortality Follow‐up: median 1 to 3 months | 1.9 per 100 | 9.5 per 100 (3.2 to 27.8) | RR 5.11 | 431 | ⊕⊕⊝⊝ |
| Use of salvage procedures for dysphagia Follow‐up: median 4 years | 46 per 100 | 24 per 100 | RR 0.52 (95% CI 0.36 to 0.75) | 259 (1 RCT) | ⊕⊕⊝⊝ |
| *The risk in the intervention group (and its 95% confidence interval) is based on the assumed risk in the comparison group and the relative effect of the intervention (and its 95% CI). | |||||
| GRADE Working Group grades of evidence | |||||
| 1 Downgraded one level due to risk of bias (detection bias as investigators were not blinded). | |||||
| Outcome or subgroup title | No. of studies | No. of participants | Statistical method | Effect size |
| 1 Overall survival Show forest plot | 2 | 431 | Hazard Ratio (Random, 95% CI) | 0.99 [0.79, 1.24] |
| 2 Freedom from locoregional relapse Show forest plot | 2 | 431 | Hazard Ratio (Random, 95% CI) | 0.55 [0.39, 0.76] |
| 3 Quality of Life (at 3 months) Show forest plot | 1 | Mean Difference (IV, Random, 95% CI) | Subtotals only | |
| 4 Treatment‐related mortality Show forest plot | 2 | 431 | Risk Ratio (M‐H, Random, 95% CI) | 5.11 [1.74, 15.02] |
| 5 Use of salvage procedures for dysphagia Show forest plot | 1 | Risk Ratio (M‐H, Random, 95% CI) | Subtotals only | |