Incisiones de diferente tamaño para la facoemulsificación en la catarata relacionada con la edad
Información
- DOI:
- https://doi.org/10.1002/14651858.CD010510.pub2Copiar DOI

- Base de datos:
-
- Cochrane Database of Systematic Reviews
- Versión publicada:
-
- 20 septiembre 2017see what's new
- Tipo:
-
- Intervention
- Etapa:
-
- Review
- Grupo Editorial Cochrane:
-
Grupo Cochrane de Salud ocular y de la visión
- Copyright:
-
- Copyright © 2017 The Cochrane Collaboration. Published by John Wiley & Sons, Ltd.
Cifras del artículo
Altmetric:
Citado por:
Autores
Contributions of authors
-
Co‐ordinating the review: CJ
-
Data collection for the review update
-
Designing search strategies: CEV Information Specialist
-
Undertaking searches: CEV Information Specialist
-
Screening search results: CJ, XC, XW, AL, Sarah Money (SM), Yuanxi Jia (YJ)
-
Organizing retrieval of papers: AL
-
Screening retrieved papers against inclusion criteria: CJ, XC, AL
-
Appraising quality of papers: CJ, XC, AL, YJ
-
Extracting data from papers: CJ, XC, AL, YJ, YK
-
Writing to authors of papers for additional information: CJ, XW
-
Obtaining and screening data on unpublished studies: CJ, AL
-
-
Data management for the review
-
Entering data into Review Manager 5: AL, XW
-
Analysis of data: CJ, XC, AL
-
-
Interpretation of data
-
Providing a methodological perspective: AL, XW
-
Providing a clinical perspective: CJ, XC, WX, KY
-
Providing a policy perspective: CJ, XC
-
Providing a consumer perspective: CJ, XC
-
-
Writing the review: CJ, XC, AL
-
Providing general advice on the review: CJ, XC, AL, WX, KY
-
Securing funding for the review: N/A
-
Performing previous work that was the foundation of the current study: N/A
-
Guarantor for review: CJ
Sources of support
Internal sources
-
No sources of support supplied
External sources
-
Chongfei Jin is funded by Specialized Research Fund for the Doctoral Program of Higher Education of China (20100101120127), China.
-
National Eye Institute, National Institutes of Health, USA.
Xue Wang is funded by the Cochrane Eyes and Vision ‐ US Project through the National Eye Institute Grant 1 U01 EY020522‐01
-
National Institute for Health Research (NIHR), UK.
-
Richard Wormald, Co‐ordinating Editor for Cochrane Eyes and Vision (CEV) acknowledges financial support for his CEV research sessions from the Department of Health through the award made by the National Institute for Health Research to Moorfields Eye Hospital NHS Foundation Trust and UCL Institute of Ophthalmology for a Specialist Biomedical Research Centre for Ophthalmology.
-
This review was supported by the NIHR, via Cochrane Infrastructure funding to the CEV UK editorial base.
The views and opinions expressed therein are those of the authors and do not necessarily reflect those of the Systematic Reviews Programme, NIHR, NHS or the Department of Health.
-
Declarations of interest
Chongfei Jin: is a coauthor of an included study (Yao 2011)
Xinyi Chen: no conflicts of interest
Andrew Law: no conflicts of interest
Yunhee Kang: no conflicts of interest
Xue Wang: no conflicts of interest
Wen Xu: no conflicts of interest
Ke Yao: is a coauthor of three included studies (Yao 2008; Yao 2011; Yu 2016)
Acknowledgements
We acknowledge the Cochrane Eyes and Vision (CEV) Information Specialist for developing the search strategy and executing the electronic searches. We also acknowledge Ann Ervin and the CEV editorial team, and the peer reviewers (Matt Wade and Milan C Mathew), for their support and comments during preparation of this review.
Version history
| Published | Title | Stage | Authors | Version |
| 2017 Sep 20 | Different‐sized incisions for phacoemulsification in age‐related cataract | Review | Chongfei Jin, Xinyi Chen, Andrew Law, Yunhee Kang, Xue Wang, Wen Xu, Ke Yao | |
| 2013 May 31 | Different sized incisions for phacoemulsification in age‐related cataract | Protocol | Chongfei Jin, Xue Wang, Wen Xu, Ke Yao | |
Differences between protocol and review
In the protocol, we planned to impute the missing data using statistical methods. We decided that with so little missing data in the included studies any imputation would not change the conclusions of the review.
In the protocol, we stated that "we will determine whether data synthesis can be done depending on the heterogeneity calculated. If the I2 statistic suggests substantial statistical heterogeneity, we will present results in a narrative summary. If the I2 statistic is less than 50% (not indicating substantial heterogeneity), we will combine study results." We decided that the I2 statistic alone should not be the basis for our model selection. We used both clinical and methodological heterogeneity of the included studies to determine the appropriate model for meta‐analysis.
In the protocol, we planned to study intraoperative parameters including use of cumulative dissipated energy, total use of balanced salt solution, and surgical time. However, we found that phacoemulsification time is also an important parameter of interest to surgery. We therefore added phacoemulsification time as a new outcome in the review.
In the protocol, our primary and secondary outcomes were to be reported at day one, days five to seven, one month, and six weeks to two months, as data were available. However, we decided to report the primary and secondary outcomes at three and 12 months to be consistent with other Cochrane Reviews on age‐related cataract (Ang 2014; de Silva 2014; Mathew 2012; Riaz 2006; Riaz 2013); these are also the most clinically relevant postoperative time points. As studies may not have reported outcomes at precisely these time points, we considered data collection within the following time periods: three months' (from four weeks to six months) and 12 months' (from six months to less than 18 months) postoperatively.
In the protocol, we did not specify use of the GRADE approach and presenting of 'Summary of findings' tables for four comparisons, as this was not the Cochrane standard at the time.
Keywords
MeSH
Medical Subject Headings (MeSH) Keywords
Medical Subject Headings Check Words
Humans;
PICO

Study flow diagram.

Risk of bias graph: review authors' judgements about each risk of bias item presented as percentages across all included studies.

Risk of bias summary: review authors' judgements about each risk of bias item for each included study.

Comparison 1 Larger coaxial microincision cataract surgery versus standard phacoemulsification, Outcome 1 Mean postoperative surgically induced astigmatism at 3 months.
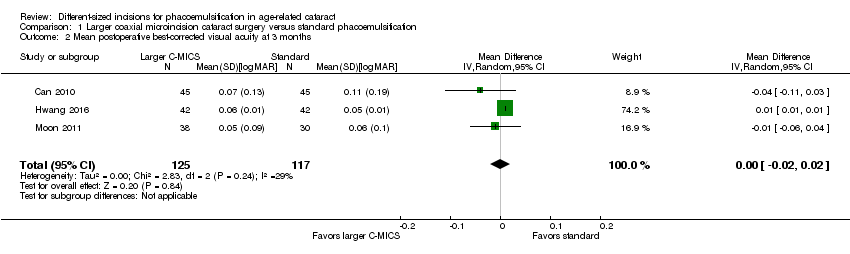
Comparison 1 Larger coaxial microincision cataract surgery versus standard phacoemulsification, Outcome 2 Mean postoperative best‐corrected visual acuity at 3 months.

Comparison 1 Larger coaxial microincision cataract surgery versus standard phacoemulsification, Outcome 3 Mean change of endothelial cell loss at 3 months.

Comparison 1 Larger coaxial microincision cataract surgery versus standard phacoemulsification, Outcome 4 Mean change of central corneal thickness at 3 months.

Comparison 1 Larger coaxial microincision cataract surgery versus standard phacoemulsification, Outcome 5 Intraoperative use of cumulative dissipated energy.
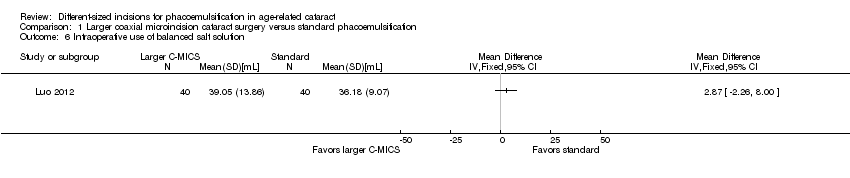
Comparison 1 Larger coaxial microincision cataract surgery versus standard phacoemulsification, Outcome 6 Intraoperative use of balanced salt solution.
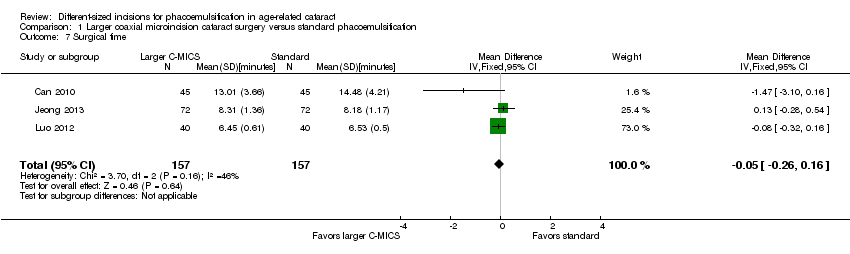
Comparison 1 Larger coaxial microincision cataract surgery versus standard phacoemulsification, Outcome 7 Surgical time.

Comparison 1 Larger coaxial microincision cataract surgery versus standard phacoemulsification, Outcome 8 Phacoemulsification time.

Comparison 1 Larger coaxial microincision cataract surgery versus standard phacoemulsification, Outcome 9 Corneal edema.

Comparison 2 Smaller coaxial microincision cataract surgery versus standard phacoemulsification, Outcome 1 Mean postoperative surgically induced astigmatism at 3 months.

Comparison 2 Smaller coaxial microincision cataract surgery versus standard phacoemulsification, Outcome 2 Mean postoperative best‐corrected visual acuity at 3 months.
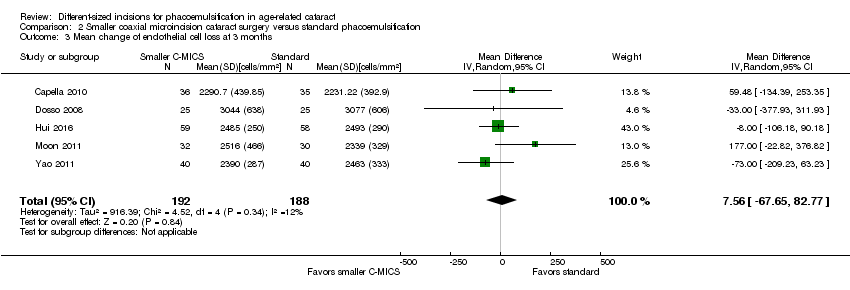
Comparison 2 Smaller coaxial microincision cataract surgery versus standard phacoemulsification, Outcome 3 Mean change of endothelial cell loss at 3 months.
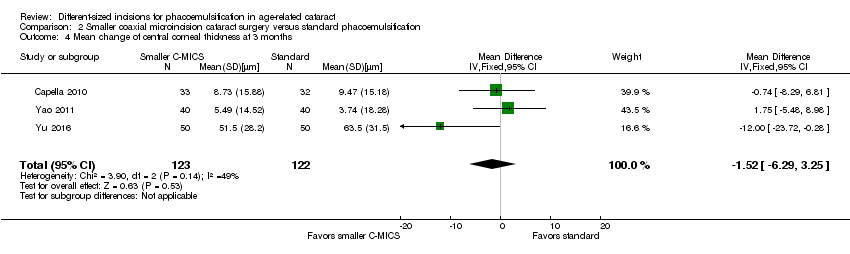
Comparison 2 Smaller coaxial microincision cataract surgery versus standard phacoemulsification, Outcome 4 Mean change of central corneal thickness at 3 months.

Comparison 2 Smaller coaxial microincision cataract surgery versus standard phacoemulsification, Outcome 5 Intraoperative use of cumulative dissipated energy.
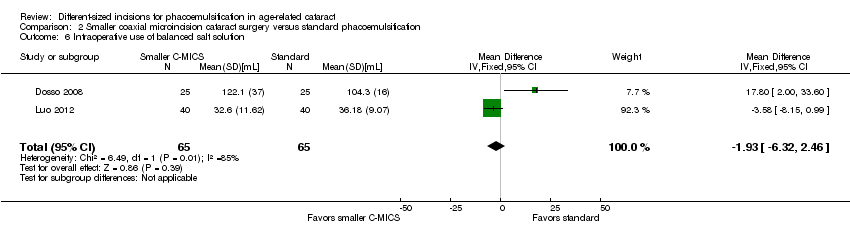
Comparison 2 Smaller coaxial microincision cataract surgery versus standard phacoemulsification, Outcome 6 Intraoperative use of balanced salt solution.

Comparison 2 Smaller coaxial microincision cataract surgery versus standard phacoemulsification, Outcome 7 Surgical time.

Comparison 2 Smaller coaxial microincision cataract surgery versus standard phacoemulsification, Outcome 8 Phacoemulsification time.

Comparison 3 Smaller versus larger coaxial microincision cataract surgery, Outcome 1 Mean postoperative surgically induced astigmatism at 3 months.
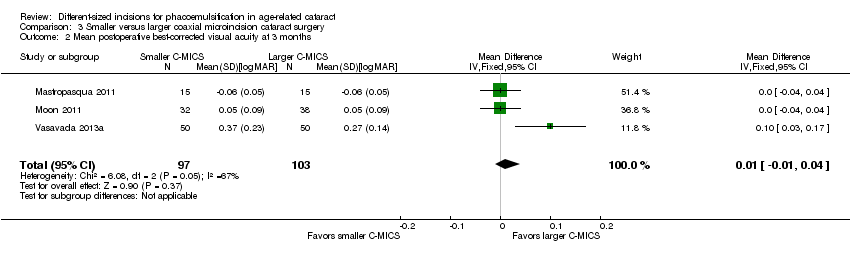
Comparison 3 Smaller versus larger coaxial microincision cataract surgery, Outcome 2 Mean postoperative best‐corrected visual acuity at 3 months.

Comparison 3 Smaller versus larger coaxial microincision cataract surgery, Outcome 3 Mean endothelial cell loss at 3 months.
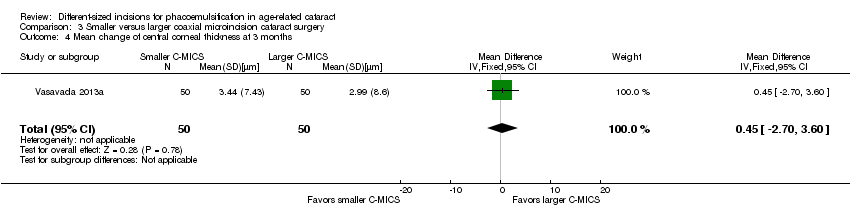
Comparison 3 Smaller versus larger coaxial microincision cataract surgery, Outcome 4 Mean change of central corneal thickness at 3 months.

Comparison 3 Smaller versus larger coaxial microincision cataract surgery, Outcome 5 Intraoperative use of cumulative dissipated energy.

Comparison 3 Smaller versus larger coaxial microincision cataract surgery, Outcome 6 Intraoperative use of balanced salt solution.
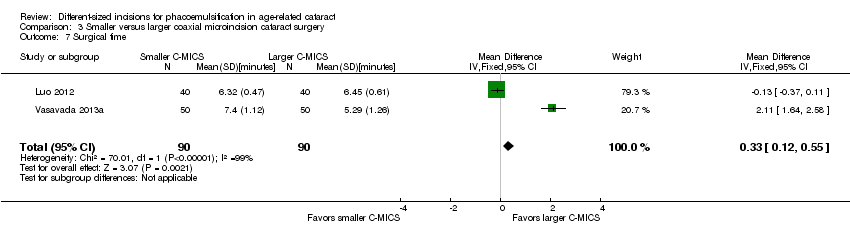
Comparison 3 Smaller versus larger coaxial microincision cataract surgery, Outcome 7 Surgical time.

Comparison 3 Smaller versus larger coaxial microincision cataract surgery, Outcome 8 Phacoemulsification time.

Comparison 4 Biaxial microincision cataract surgery versus standard phacoemulsification, Outcome 1 Mean postoperative surgically induced astigmatism at 3 months.
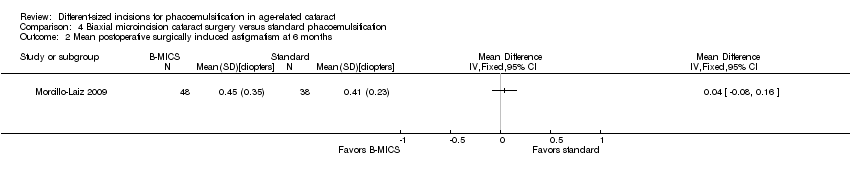
Comparison 4 Biaxial microincision cataract surgery versus standard phacoemulsification, Outcome 2 Mean postoperative surgically induced astigmatism at 6 months.

Comparison 4 Biaxial microincision cataract surgery versus standard phacoemulsification, Outcome 3 Mean postoperative best‐corrected visual acuity at 3 months.

Comparison 4 Biaxial microincision cataract surgery versus standard phacoemulsification, Outcome 4 Mean endothelial cell loss at 3 months.

Comparison 4 Biaxial microincision cataract surgery versus standard phacoemulsification, Outcome 5 Postoperative central corneal thickness at 3 months.
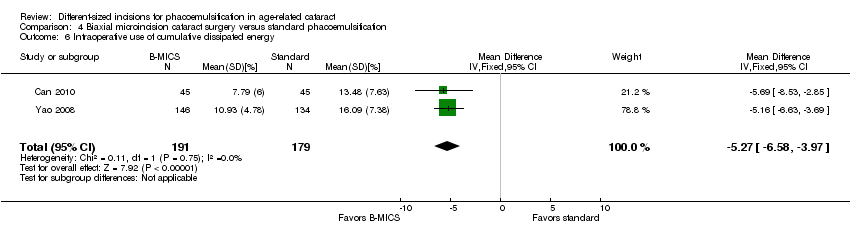
Comparison 4 Biaxial microincision cataract surgery versus standard phacoemulsification, Outcome 6 Intraoperative use of cumulative dissipated energy.

Comparison 4 Biaxial microincision cataract surgery versus standard phacoemulsification, Outcome 7 Surgical time.

Comparison 4 Biaxial microincision cataract surgery versus standard phacoemulsification, Outcome 8 Phacoemulsification time.
| Larger C‐MICS compared with standard phacoemulsification for age‐related cataract | ||||||
| Patient or population: adults with age‐related cataract Settings: eye clinics Intervention: larger C‐MICS with 2.2‐millimeter incision Comparison: standard phacoemulsification with about 3.0‐millimeter incision | ||||||
| Outcomes | Illustrative comparative risks* (95% CI) | Relative effect | No. of eyes | Certainty of the evidence | Comments | |
| Assumed risk | Corresponding risk | |||||
| Standard phacoemulsification | Larger C‐MICS | |||||
| Mean postoperative surgically induced astigmatism Follow‐up: 3 months | The mean surgically induced astigmatism was 0.7 to 1.34 diopters. | The mean surgically induced astigmatism in the intervention groups was 0.19 diopters lower (0.30 to 0.09 diopters lower). | ‐ | 996 | ⊕⊝⊝⊝ | A lower diopter value is a better clinical outcome. |
| Mean postoperative best‐corrected visual acuity Follow‐up: 3 months | The mean best‐corrected visual acuity was 0.05 to 0.11 logMAR. | The mean best‐corrected visual acuity in the intervention groups was 0.00 logMAR lower (0.02 logMAR lower to 0.02 logMAR higher). | ‐ | 242 | ⊕⊕⊝⊝ | |
| Mean endothelial cell loss Follow‐up: 3 months | The mean of endothelial cell loss ranged across control groups was 2054.0 to 2339.0 cells/mm2. | The mean change of endothelial cell loss in the intervention groups was 7.23 cells/mm2 lower (78.66 cells/mm2 lower to 64.20 cells/mm2 higher). | ‐ | 596 (4 RCTs) | ⊕⊕⊝⊝ | Little or no difference between groups is a clinically positive result. |
| Central corneal thickness Follow‐up: 3 months | The mean change of central corneal thickness was 9.24 μm. The mean central corneal thickness ranged across control groups from 546.0 to 580.0 μm. | The mean change of central corneal thickness in the intervention groups was 0.68 μm lower (3.26 μm lower to 1.90 μm higher). | ‐ | 487 (5 RCTs) | ⊕⊕⊝⊝ | Hwang 2016 did not report the standard deviation, but reported that the mean % decrease in central corneal thickness was 1.00 in the 2.2‐millimeter group and 0.31 in the 2.75‐millimeter group. Little or no difference between groups is a clinically positive result. |
| Adverse events (corneal edema) Follow‐up: 3 months | 46 per 1000 | 47 per 1000 (19 to 122) | RR 1.02 (0.40 to 2.63 | 362 (1 RCT) | Wang 2009 reported "no intraoperative complications." | |
| Quality of life | Not reported | |||||
| *The basis for the assumed risk (e.g. the median control group risk across studies) is provided in footnotes. The corresponding risk (and its 95% confidence interval) is based on the assumed risk in the comparison group and the relative effect of the intervention (and its 95% CI). | ||||||
| GRADE Working Group grades of evidence | ||||||
| aDowngraded two levels for risk of bias, as one study was at high risk of selection and attrition bias, while another study was at high risk of reporting bias. | ||||||
| Smaller C‐MICS compared with standard phacoemulsification for age‐related cataract | ||||||
| Patient or population: adults with age‐related cataract Settings: eye clinics Intervention: smaller C‐MICS with 1.8‐millimeter incision Comparison: standard phacoemulsification with about 3.0‐millimeter incision | ||||||
| Outcomes | Illustrative comparative risks* (95% CI) | Relative effect | No. of eyes | Certainty of the evidence | Comments | |
| Assumed risk | Corresponding risk | |||||
| Standard phacoemulsification | Smaller C‐MICS | |||||
| Mean postoperative surgically induced astigmatism Follow‐up: 3 months | The mean postoperative surgically induced astigmatism ranged across control groups from 0.03 to 0.94 diopters. | The mean postoperative surgically induced astigmatism in the intervention groups was 0.23 lower (0.34 diopters to 0.13 diopters lower). | ‐ | 561 | ⊕⊝⊝⊝ | A lower diopter value is a better clinical outcome. |
| Mean postoperative best‐corrected visual acuity Follow‐up: 2 to 3 months | The mean postoperative best‐corrected visual acuity ranged across control groups from | The mean postoperative best‐corrected visual acuity in the intervention groups was 0.02 logMAR units lower (0.03 logMAR units lower to 0.00 logMAR units). | ‐ | 192 | ⊕⊕⊝⊝ | |
| Mean change of endothelial cell loss Follow‐up: 3 months | The mean change of endothelial cell loss ranged across control groups from 2231.22 to 3077.0 cells/mm2. | The mean change of endothelial cell loss in the intervention groups was | ‐ | 380 | ⊕⊕⊝⊝ | |
| Mean change of central corneal thickness Follow‐up: 3 months | The mean change of central corneal thickness ranged across control groups from 3.74 to 63.5 μm. | The mean change of central corneal thickness in the intervention groups was 1.52 μm lower (6.29 μm lower to 3.25 μm higher). | ‐ | 245 | ⊕⊕⊝⊝ | |
| Adverse events Follow‐up: 3 months | None of the trials reported on adverse events. | |||||
| Quality of life | Not reported | |||||
| *The basis for the assumed risk (e.g. the median control group risk across studies) is provided in footnotes. The corresponding risk (and its 95% confidence interval) is based on the assumed risk in the comparison group and the relative effect of the intervention (and its 95% CI). | ||||||
| GRADE Working Group grades of evidence | ||||||
| aDowngraded two levels for high risk of selection, performance, and detection bias. | ||||||
| Smaller coaxial microincision cataract surgery (C‐MICS) compared with larger C‐MICS for age‐related cataract | ||||||
| Patient or population: adults with age‐related cataract Settings: eye clinics Intervention: smaller C‐MICS with 1.8‐millimeter incision Comparison: larger C‐MICS with 2.2‐millimeter incision | ||||||
| Outcomes | Illustrative comparative risks* (95% CI) | Relative effect | No. of eyes | Certainty of the evidence | Comments | |
| Assumed risk | Corresponding risk | |||||
| Larger C‐MICS | Smaller C‐MICS | |||||
| Mean postoperative surgically induced astigmatism Follow‐up: 3 months | The mean postoperative surgically induced astigmatism ranged across control groups from 0.48 to 1.08 diopters. | The mean postoperative surgically induced astigmatism in the intervention groups was | ‐ | 259 | ⊕⊕⊝⊝ | A lower diopter value is a better clinical outcome. |
| Mean postoperative best‐corrected visual acuity Follow‐up: 3 months | The mean postoperative best‐corrected visual acuity ranged across control groups from | The mean postoperative best‐corrected visual acuity in the intervention groups was 0.01 logMAR units higher (0.01 logMAR units lower to 0.04 logMAR units higher). | ‐ | 200 | ⊕⊕⊝⊝ | |
| Mean change of endothelial cell loss Follow‐up: 3 months | The mean change in endothelial cell loss was 2303.0 cells/mm2. | The mean change in endothelial cell loss was 213.00 cells/mm2 higher (11.15 to 414.85 cells/mm2 higher). | ‐ | 70 (1 RCT) | ⊕⊝⊝⊝ | |
| Mean central corneal thickness Follow‐up: 3 months | The mean change in central corneal thickness was 2.99 μm. | The mean change in central corneal thickness was 0.45 μm higher (2.70 μm lower to 3.60 μm higher). | ‐ | 100 | ⊕⊕⊝⊝ | |
| Adverse events Follow‐up: end of trial | None of the trials reported on adverse events. | |||||
| Quality of life | Not reported | |||||
| *The basis for the assumed risk (e.g. the median control group risk across studies) is provided in footnotes. The corresponding risk (and its 95% confidence interval) is based on the assumed risk in the comparison group and the relative effect of the intervention (and its 95% CI). | ||||||
| GRADE Working Group grades of evidence | ||||||
| aDowngraded two levels for unexplained statistical heterogeneity, as the I2 was greater than 70%. | ||||||
| B‐MICS compared with standard phacoemulsification for age‐related cataract | ||||||
| Patient or population: adults with age‐related cataract Settings: eye clinics Intervention: B‐MICS with equal to or smaller than 1.5‐millimeter incision Comparison: standard phacoemulsification with about 3.0‐millimeter incision | ||||||
| Outcomes | Illustrative comparative risks* (95% CI) | Relative effect | No. of eyes | Certainty of the evidence | Comments | |
| Assumed risk | Corresponding risk | |||||
| Standard phacoemulsification | B‐MICS | |||||
| Mean postoperative surgically induced astigmatism Follow‐up: 3 months | The mean postoperative surgically induced astigmatism ranged across control groups from 0.12 diopters to 0.44 diopters. | The mean postoperative surgically induced astigmatism in the intervention groups was | ‐ | 368 | ⊕⊕⊕⊝ | A lower diopter value is a better clinical outcome. |
| Mean postoperative best‐corrected visual acuity Follow‐up: 3 months | The mean postoperative best‐corrected visual acuity ranged across control groups from | The mean postoperative best‐corrected visual acuity in the intervention groups was 0.02 logMAR units lower (0.04 logMAR units lower to 0.00 LogMAR units). | ‐ | 464 | ⊕⊕⊝⊝ | |
| Mean endothelial cell loss Follow‐up: 3 months | The mean endothelial cell loss in the control groups was 2410 cells/mm2. | The mean endothelial cell loss in the intervention groups was (34.93 cells/mm2 lower to 146.59 cells/mm2 higher). | ‐ | 280 | ⊕⊕⊝⊝ | |
| Postoperative central corneal thickness Follow‐up: 3 months | The mean change in central corneal thickness in the control group was 546 μm. | The mean change of central corneal thickness in the intervention groups was 0.10 μm higher (14.04 μm lower to 14.24 μm higher). | ‐ | 90 | ⊕⊕⊝⊝ | |
| Adverse events Follow‐up: end of study | None of the trials reported on adverse events. | |||||
| Quality of life | Not reported | |||||
| *The basis for the assumed risk (e.g. the median control group risk across studies) is provided in footnotes. The corresponding risk (and its 95% confidence interval) is based on the assumed risk in the comparison group and the relative effect of the intervention (and its 95% CI). | ||||||
| GRADE Working Group grades of evidence | ||||||
| aDowngraded one level for risk of bias, as the trials were at unclear risk of selection and reporting bias. | ||||||
| Outcome or subgroup title | No. of studies | No. of participants | Statistical method | Effect size |
| 1 Mean postoperative surgically induced astigmatism at 3 months Show forest plot | 8 | 996 | Mean Difference (IV, Random, 95% CI) | ‐0.19 [‐0.30, ‐0.09] |
| 2 Mean postoperative best‐corrected visual acuity at 3 months Show forest plot | 3 | 242 | Mean Difference (IV, Random, 95% CI) | 0.00 [‐0.02, 0.02] |
| 3 Mean change of endothelial cell loss at 3 months Show forest plot | 4 | 596 | Mean Difference (IV, Random, 95% CI) | ‐7.23 [‐78.66, 64.20] |
| 4 Mean change of central corneal thickness at 3 months Show forest plot | 5 | 487 | Mean Difference (IV, Random, 95% CI) | ‐0.68 [‐3.26, 1.90] |
| 5 Intraoperative use of cumulative dissipated energy Show forest plot | 6 | 784 | Mean Difference (IV, Random, 95% CI) | ‐0.30 [‐1.33, 0.72] |
| 6 Intraoperative use of balanced salt solution Show forest plot | 1 | Mean Difference (IV, Fixed, 95% CI) | Totals not selected | |
| 7 Surgical time Show forest plot | 3 | 314 | Mean Difference (IV, Fixed, 95% CI) | ‐0.05 [‐0.26, 0.16] |
| 8 Phacoemulsification time Show forest plot | 4 | 608 | Mean Difference (IV, Random, 95% CI) | ‐0.96 [‐3.48, 1.56] |
| 9 Corneal edema Show forest plot | 1 | Risk Ratio (M‐H, Fixed, 95% CI) | Totals not selected | |
| Outcome or subgroup title | No. of studies | No. of participants | Statistical method | Effect size |
| 1 Mean postoperative surgically induced astigmatism at 3 months Show forest plot | 5 | 561 | Mean Difference (IV, Random, 95% CI) | ‐0.23 [‐0.34, ‐0.13] |
| 2 Mean postoperative best‐corrected visual acuity at 3 months Show forest plot | 3 | 192 | Mean Difference (IV, Fixed, 95% CI) | ‐0.02 [‐0.03, ‐0.00] |
| 3 Mean change of endothelial cell loss at 3 months Show forest plot | 5 | 380 | Mean Difference (IV, Random, 95% CI) | 7.56 [‐67.65, 82.77] |
| 4 Mean change of central corneal thickness at 3 months Show forest plot | 3 | 245 | Mean Difference (IV, Fixed, 95% CI) | ‐1.52 [‐6.29, 3.25] |
| 5 Intraoperative use of cumulative dissipated energy Show forest plot | 2 | 360 | Mean Difference (IV, Fixed, 95% CI) | ‐4.25 [‐5.43, ‐3.07] |
| 6 Intraoperative use of balanced salt solution Show forest plot | 2 | 130 | Mean Difference (IV, Fixed, 95% CI) | ‐1.93 [‐6.32, 2.46] |
| 7 Surgical time Show forest plot | 2 | 130 | Mean Difference (IV, Fixed, 95% CI) | ‐0.14 [‐0.35, 0.07] |
| 8 Phacoemulsification time Show forest plot | 2 | 130 | Mean Difference (IV, Fixed, 95% CI) | 8.20 [2.88, 13.52] |
| Outcome or subgroup title | No. of studies | No. of participants | Statistical method | Effect size |
| 1 Mean postoperative surgically induced astigmatism at 3 months Show forest plot | 3 | 259 | Mean Difference (IV, Fixed, 95% CI) | 0.04 [‐0.09, 0.16] |
| 2 Mean postoperative best‐corrected visual acuity at 3 months Show forest plot | 3 | 200 | Mean Difference (IV, Fixed, 95% CI) | 0.01 [‐0.01, 0.04] |
| 3 Mean endothelial cell loss at 3 months Show forest plot | 1 | 70 | Mean Difference (IV, Fixed, 95% CI) | 213.00 [11.15, 414.85] |
| 4 Mean change of central corneal thickness at 3 months Show forest plot | 1 | 100 | Mean Difference (IV, Fixed, 95% CI) | 0.45 [‐2.70, 3.60] |
| 5 Intraoperative use of cumulative dissipated energy Show forest plot | 4 | 300 | Mean Difference (IV, Random, 95% CI) | ‐0.33 [‐3.72, 3.07] |
| 6 Intraoperative use of balanced salt solution Show forest plot | 3 | 210 | Mean Difference (IV, Fixed, 95% CI) | 1.04 [‐2.45, 4.53] |
| 7 Surgical time Show forest plot | 2 | 180 | Mean Difference (IV, Fixed, 95% CI) | 0.33 [0.12, 0.55] |
| 8 Phacoemulsification time Show forest plot | 1 | Mean Difference (IV, Fixed, 95% CI) | Totals not selected | |
| Outcome or subgroup title | No. of studies | No. of participants | Statistical method | Effect size |
| 1 Mean postoperative surgically induced astigmatism at 3 months Show forest plot | 2 | 368 | Mean Difference (IV, Fixed, 95% CI) | ‐0.01 [‐0.03, 0.01] |
| 2 Mean postoperative surgically induced astigmatism at 6 months Show forest plot | 1 | Mean Difference (IV, Fixed, 95% CI) | Totals not selected | |
| 3 Mean postoperative best‐corrected visual acuity at 3 months Show forest plot | 3 | 464 | Mean Difference (IV, Fixed, 95% CI) | ‐0.02 [‐0.04, ‐0.00] |
| 4 Mean endothelial cell loss at 3 months Show forest plot | 1 | 280 | Mean Difference (IV, Fixed, 95% CI) | 55.83 [‐34.93, 146.59] |
| 5 Postoperative central corneal thickness at 3 months Show forest plot | 1 | 90 | Mean Difference (IV, Fixed, 95% CI) | 0.10 [‐14.04, 14.24] |
| 6 Intraoperative use of cumulative dissipated energy Show forest plot | 2 | 370 | Mean Difference (IV, Fixed, 95% CI) | ‐5.27 [‐6.58, ‐3.97] |
| 7 Surgical time Show forest plot | 1 | Mean Difference (IV, Fixed, 95% CI) | Totals not selected | |
| 8 Phacoemulsification time Show forest plot | 2 | 370 | Mean Difference (IV, Fixed, 95% CI) | ‐5.58 [‐9.52, ‐1.63] |