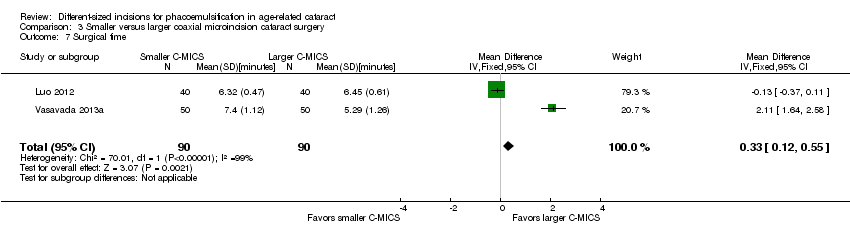
| Larger C‐MICS compared with standard phacoemulsification for age‐related cataract |
| Patient or population: adults with age‐related cataract Settings: eye clinics Intervention: larger C‐MICS with 2.2‐millimeter incision Comparison: standard phacoemulsification with about 3.0‐millimeter incision |
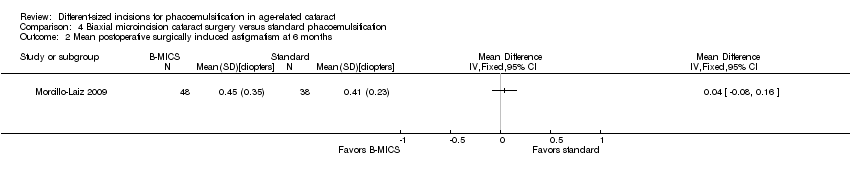
| Mean postoperative surgically induced astigmatism Follow‐up: 3 months | The mean surgically induced astigmatism was 0.7 to 1.34 diopters. | The mean surgically induced astigmatism in the intervention groups was 0.19 diopters lower (0.30 to 0.09 diopters lower). | ‐ | 996
(8 RCTs) | ⊕⊝⊝⊝
very lowa,b | A lower diopter value is a better clinical outcome. |
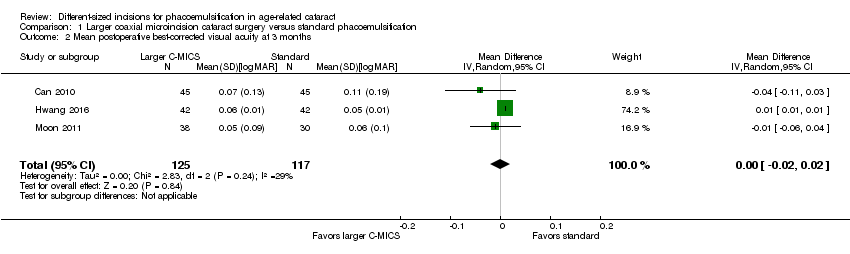
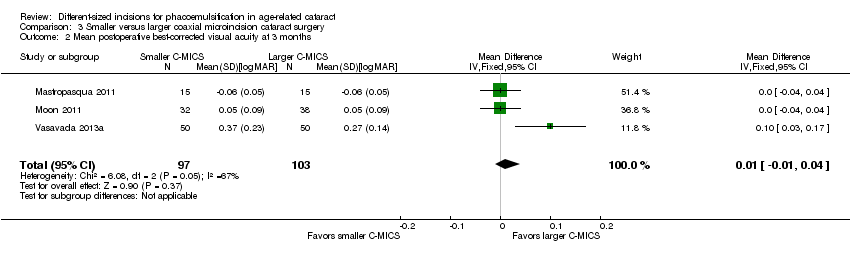
| Mean postoperative best‐corrected visual acuity Follow‐up: 3 months | The mean best‐corrected visual acuity was 0.05 to 0.11 logMAR. | The mean best‐corrected visual acuity in the intervention groups was 0.00 logMAR lower (0.02 logMAR lower to 0.02 logMAR higher). | ‐ | 242
(3 RCTs) | ⊕⊕⊝⊝
lowc | |
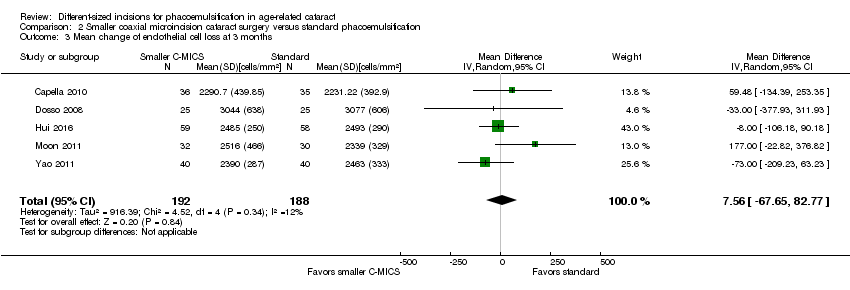
| Mean endothelial cell loss Follow‐up: 3 months | The mean of endothelial cell loss ranged across control groups was 2054.0 to 2339.0 cells/mm2. | The mean change of endothelial cell loss in the intervention groups was 7.23 cells/mm2 lower (78.66 cells/mm2 lower to 64.20 cells/mm2 higher). | ‐ | 596 (4 RCTs) | ⊕⊕⊝⊝
lowd | Little or no difference between groups is a clinically positive result. |
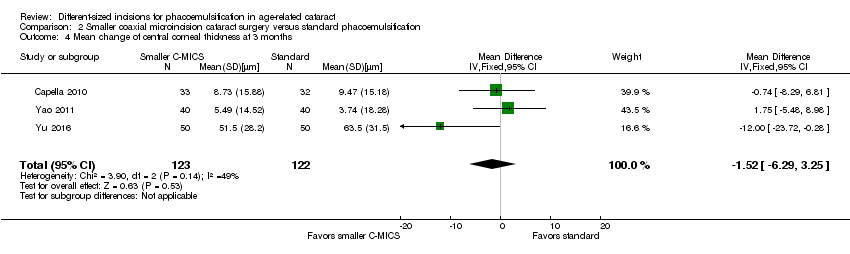
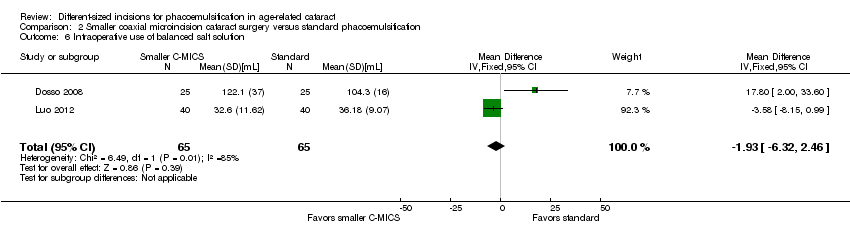
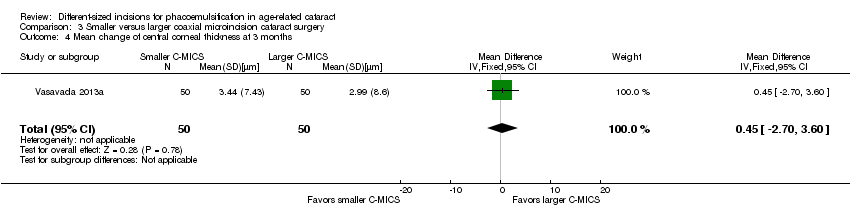
| Central corneal thickness Follow‐up: 3 months | The mean change of central corneal thickness was 9.24 μm. The mean central corneal thickness ranged across control groups from 546.0 to 580.0 μm. | The mean change of central corneal thickness in the intervention groups was 0.68 μm lower (3.26 μm lower to 1.90 μm higher). | ‐ | 487 (5 RCTs) | ⊕⊕⊝⊝
lowd | Hwang 2016 did not report the standard deviation, but reported that the mean % decrease in central corneal thickness was 1.00 in the 2.2‐millimeter group and 0.31 in the 2.75‐millimeter group. Little or no difference between groups is a clinically positive result. |
| Adverse events (corneal edema) Follow‐up: 3 months | 46 per 1000 | 47 per 1000 (19 to 122) | RR 1.02 (0.40 to 2.63 | 362 (1 RCT) | | Wang 2009 reported "no intraoperative complications." |
| Quality of life | Not reported |
| *The basis for the assumed risk (e.g. the median control group risk across studies) is provided in footnotes. The corresponding risk (and its 95% confidence interval) is based on the assumed risk in the comparison group and the relative effect of the intervention (and its 95% CI).
CI: confidence interval; RCT: randomized controlled trial; RR: risk ratio |
| GRADE Working Group grades of evidence
High‐certainty: Further research is very unlikely to change our confidence in the estimate of effect.
Moderate‐certainty: Further research is likely to have an important impact on our confidence in the estimate of effect and may change the estimate.
Low‐certainty: Further research is very likely to have an important impact on our confidence in the estimate of effect and is likely to change the estimate.
Very low‐certainty: We are very uncertain about the estimate. |