Intervencije za liječenje poremećaja osjeta okusa
Abstract
Background
The sense of taste is very much essential to the overall health of the individual. It is a necessary component to enjoying one’s food, which in turn provides nutrition to an individual. Any disturbance in taste perception can hamper the quality of life in such patients by influencing their appetite, body weight and psychological well‐being. Taste disorders have been treated using different modalities of treatment and there is no consensus for the best intervention. Hence this Cochrane systematic review was undertaken.
Objectives
To assess the effects of interventions for the management of patients with taste disturbances.
Search methods
We searched the Cochrane Oral Health Group Trials Register (to 5 March 2014), the Cochrane Central Register of Controlled Trials (CENTRAL) (The Cochrane Library Issue 1, 2014), MEDLINE via OVID (1948 to 5 March 2014), EMBASE via OVID (1980 to 5 March 2014), CINAHL via EBSCO (1980 to 5 March 2014) and AMED via OVID (1985 to 5 March 2014). We also searched the relevant clinical trial registries and conference proceedings from the International Association of Dental Research/American Association of Dental Research (to 5 March 2014), Association for Research in Otolaryngology (to 5 March 2014), the US National Institutes of Health Trials Register (to 5 March 2014), metaRegister of Controlled Trials (mRCT) (to 5 March 2014), World Health Organization's International Clinical Trials Registry Platform (WHO ICTRP) (to 5 March 2014) and International Federation of Pharmaceutical Manufacturers and Associations (IFPMA) Clinical Trials Portal (to 5 March 2014).
Selection criteria
We included all randomised controlled trials (RCTs) comparing any pharmacological agent with a control intervention or any non‐pharmacological agent with a control intervention. We also included cross‐over trials in the review.
Data collection and analysis
Two authors independently, and in duplicate, assessed the quality of trials and extracted data. Wherever possible, we contacted study authors for additional information. We collected adverse events information from the trials.
Main results
We included nine trials (seven parallel and two cross‐over RCTs) with 566 participants. We assessed three trials (33.3%) as having a low risk of bias, four trials (44.5%) at high risk of bias and two trials (22.2%) as having an unclear risk of bias. We only included studies on taste disorders in this review that were either idiopathic, or resulting from zinc deficiency or chronic renal failure.
Of these, eight trials with 529 people compared zinc supplements to placebo for patients with taste disorders. The participants in two trials were children and adolescents with respective mean ages of 10 and 11.2 years and the other six trials had adult participants. Out of these eight, two trials assessed the patient reported outcome for improvement in taste acuity using zinc supplements (RR 1.45, 95% CI 1.0 to 2.1; very low quality evidence). We included three trials in the meta‐analysis for overall taste improvement (effect size 0.44, 95% CI 0.23 to 0.65; moderate quality evidence). Two other trials described the results as taste acuity improvement and we conducted subgroup analyses due to clinical heterogeneity. One trial described the results as taste recognition improvement for each taste sensation and we analysed this separately. We also analysed one cross‐over trial separately using the first half of the results. None of the zinc trials tested taste discrimination. Only one trial tested taste discrimination using acupuncture (effect size 2.80, 95% CI ‐1.18 to 6.78; low quality evidence).
Out of the eight trials using zinc supplementation, four reported adverse events like eczema, nausea, abdominal pain, diarrhoea, constipation, decrease in blood iron, increase in blood alkaline phosphatase, and minor increase in blood triglycerides. No adverse events were reported in the acupuncture trial.
None of the included trials could be included in the meta‐analysis for health‐related quality of life in taste disorder patients.
Authors' conclusions
We found very low quality evidence that was insufficient to conclude on the role of zinc supplements to improve taste perception by patients, however we found moderate quality evidence that zinc supplements improve overall taste improvement in patients with zinc deficiency/idiopathic taste disorders. We also found low quality evidence that zinc supplements improve taste acuity in zinc deficient/idiopathic taste disorders and very low quality evidence for taste recognition improvement in children with taste disorders secondary to chronic renal failure. We did not find any evidence to conclude the role of zinc supplements for improving taste discrimination, or any evidence addressing health‐related quality of life due to taste disorders.
We found low quality evidence that is not sufficient to conclude on the role of acupuncture for improving taste discrimination in cases of idiopathic dysgeusia (distortion of taste) and hypogeusia (reduced ability to taste). We were unable to draw any conclusions regarding the superiority of zinc supplements or acupuncture as none of the trials compared these interventions.
PICO
Laički sažetak
Intervencije za liječenje poremećaja osjeta okusa
Istraživačko pitanje
Glavno pitanje ovog Cochrane sustavnog pregleda jest koja je najbolja metoda za liječenje poremećaja osjeta okusa.
Dosadašnje spoznaje
Osjet okusa ključan je za zdravlje i phihološki osjećaj kvalitete života svake osobe. Poremećaji osjeta okusa mogu varirati od potpunog izostanka osjeta okusa, poremećenog osjeta i do umanjenog osjeta okusa. Svaki poremećaj osjeta okusa potencijalno može dovesti do stanja poput pothranjenosti ili unosa toksičnih tvari. Poremećaji osjeta okusa mogu nastati zbog bolesti, lijekova, liječenja zračenjem, a mogu nastati i iz nepoznatih razloga.
Do sada su se u svrhu poboljšanja osjeta okusa koristile različite metode. Spomenute metode uključivale su uporabu cinka, pilokarpin, alfa lipoličku kiselinu (ALA) transkranijalnu magnetsku stimulaciju, ginko bilobu te akupunkturu.
Obilježja studija
Cochrane urednička skupina za oralno zdravlje sažela je zaključke postojećih studija koje uključuju dokaze iz literature dostupne do 5. ožujka 2014. Sustavni pregled uključuje devet studija u kojima je sveukupno 566 osoba primalo različita liječenja. Osam je istraživanja procjenjivalo koristi dodavanja prehrani (suplementacije) cinka, a jedno je procjenilo učinke akupunkture. Sedam istraživanja su imala paralelni ustroj, a dva su bila kontrolirana randomizirana s ukriženim ustrojem. U ovom sustavnom pregledu uključile su se samo studije poremećaja osjeta okusa nepoznatog (idiopatskog) uzroka te one koje su uzrokovane pomanjkanjem cinka ili zbog kroničnog zatajenja bubrega.
Ključni rezultati
Dokazi o uporabi suplementacije cinkom za liječenje poremećaja okusa koji su povezani s manjkom cinka, idiopatskih ili povezanih s zatajenjem bubrega, nisu bili potpuni. Istraživanje koje je primjenjivalo akupunkturu pri liječenju idiopatskog poremećaja okusa pokazalo je nešto učinka na razlikovanje okusa. Ipak, malen broj pacijenata uključenih u to istraživanje ne dopušta donošenje zaključaka o djelotvornosti.
Ovaj sustavni pregled literature zaključuje kako suplementacija cinkom može imati određenu korist pri liječenju poremećaja osjeta okusa. No ipak su potrebna daljnja istraživanja kako bi se pomoglo u donošenju odluke o odabiru načina liječenja.
Liječenje cinkom uzrokovalo je i određene nuspojave poput ekcema, mučnine, abdominalne boli, proljeva, zatvora, smanjenja razine željeza u krvi, povećanje alkalne fosfataze u krvi, ali i malena povećanja krvnih triglicerida u četiri istraživanja od osam. Kod liječenja akupunkturom nisu primjećene nikakve nuspojave.
Nema dovoljno dokaza da bi se moglo utvrditi da ili suplementacija cinkom ili akupunktura mogu doprinjeti povećanju kvalitete života u pacijenata s poremećajima osjeta okusa.
Kvaliteta dokaza
Kvaliteta dokaza u provedenim istraživanjima bila je od vrlo niske do one umjerene kvalitete. Procjena kvalitete temelji se na problemima u načinu provođenja nekih od istraživanih studija.
Authors' conclusions
Summary of findings
| Zinc compared to placebo for the management of taste disturbances | ||||||
| Patient or population: patients with taste disturbances | ||||||
| Outcomes | Illustrative comparative risks* (95% CI) | Relative effect | No of Participants | Quality of the evidence | Comments | |
| Assumed risk | Corresponding risk | |||||
| Placebo | Zinc | |||||
| Taste acuity improvement ‐ Patient reported outcome | Study population | RR 1.45 | 119 | ⊕⊝⊝⊝ | ─ | |
| ˗407 per 1000 | 590 per 1000 | |||||
| Moderate | ||||||
| 382 per 1000 | 554 per 1000 | |||||
| Taste acuity improvement ‐ Objective outcome ‐ Continuous ‐ Overall taste improvement | ─ | The mean taste acuity improvement ‐ objective outcome ‐ continuous ‐ overall taste improvement in the intervention groups was | ─ | 366 | ⊕⊕⊕⊝ | SMD 0.44 (0.23 to 0.65) |
| Taste acuity improvement ‐ Objective outcome ‐ Continuous ‐ Taste recognition | — | The mean taste acuity improvement ‐ objective outcome ‐ continuous ‐ taste recognition in the intervention groups was | ─ | 14 | ⊕⊝⊝⊝ | Standardised mean difference (SMD) 1.26 (0.07 to 2.44) |
| Taste acuity improvement ‐ Objective outcome ‐ Dichotomous ‐ Idiopathic and zinc deficient taste disorders | Study population | RR 1.7 | 73 | ⊕⊕⊝⊝ | ─ | |
| ─444 per 1000 | 756 per 1000 | |||||
| Moderate | ||||||
| 444 per 1000 | 755 per 1000 | |||||
| Adverse events | Study population7 | RR 6.21 | 335 | ─ | ─ | |
| 1 per 1000 | 6 per 1000 | |||||
| Moderate | ||||||
| *The basis for the assumed risk (e.g. the median control group risk across studies) is provided in footnotes. The corresponding risk (and its 95% confidence interval) is based on the assumed risk in the comparison group and the relative effect of the intervention (and its 95% CI). | ||||||
| GRADE Working Group grades of evidence | ||||||
| 1 Risk of bias: unclear randomisation and blinding and high risk of bias due to attrition in Sakai 2002. Downgraded by 1 level. 7Risk of one per 1000 assumed in placebo group (as it was zero). 8Sakagami 2009 was not included in the grading of evidence as the number of patients reporting adverse events was not reported. | ||||||
| Acupuncture compared to sham control for patients with taste disturbances | ||||||
| Patient or population: patients with taste disturbances | ||||||
| Outcomes | Illustrative comparative risks* (95% CI) | Relative effect | No of Participants | Quality of the evidence | Comments | |
| Assumed risk | Corresponding risk | |||||
| Sham control | Acupuncture | |||||
| Taste discrimination | ─ | The mean taste discrimination in the intervention groups was | ─ | 37 | ⊕⊕⊝⊝ | ─ |
| *The basis for the assumed risk (e.g. the median control group risk across studies) is provided in footnotes. The corresponding risk (and its 95% confidence interval) is based on the assumed risk in the comparison group and the relative effect of the intervention (and its 95% CI). | ||||||
| GRADE Working Group grades of evidence | ||||||
| 1 Single‐blinded study. | ||||||
Background
The sense of taste is important for health and quality of life, yet it is often taken for granted. More than 200,000 people/year visit a physician for chemosensory problems such as taste disorders. Many more taste disorders go unreported (NIDCD 2010). Approximately 240,000 people in Japan have an altered taste sensation and present to health professionals for evaluation (Ikeda 2005). Alterations in taste can lead to loss of appetite, resulting in malnutrition, affecting both physical and psychological well‐being (NIDCD 2009).
The basic tastes are salty, sour, bitter, sweet and umami (found in glutamates). It has also been suggested that fatty taste may be recognised as another basic taste quality (Mattes 2009). In humans, there are approximately 5000 taste buds in the oral cavity, situated on the superior surface of the tongue, on the palate, and on the epiglottis (Miller 1995). Taste receptor signalling is not limited to taste buds, but occurs in a variety of tissues like chemosensory cells of the alimentary tract, pancreas, brain and airway epithelium (Kinnamon 2012).
It is important to understand how our taste buds function, both as an organ and in conjunction with other factors, especially our sense of smell. Taste buds are onion‐shaped aggregates of approximately 50 to 100 elongated cells, with a life span of 10 to 11 days (Porter 2010). Due to such a fast turnover rate, the taste cells used for breakfast may be different from those used for lunch (Spielman 1992). They extend from the basal lamina to the surface of the tongue, where their apical microvilli extend through an opening in the epithelium to contact sapid chemicals in the oral cavity. Salts and acids utilise apically located ion channels for transduction, while bitter, sweet and umami stimuli utilise G‐protein‐coupled receptors (GPCRs) and second‐messenger signalling mechanisms (Kinnamon 2012). These taste cells receive tastant from the apical pore and transduce the signal to gustatory nerves that innervate taste buds (Iwatsuki 2012). Taste‐related impulses are then transmitted via the facial, glossopharyngeal and vagus nerves to the nucleus of the solitary tract, and thereafter to the thalamus and upwards to the post‐central gyrus‐facial area and olfactory area of the cortex (Porter 2010). However, there are super tasters who experience the sense of taste with far greater intensity than average due to an increased number of fungiform papillae, and have extreme sensitivity to n‐propylthiouracil (Bartoshuk 1994).
As important as taste is to food enjoyment, flavour is even more important. It is the distinctive quality of a particular food or drink. Flavour tells us whether we are eating a pear or an apple. In order to perceive flavour, the brain interprets not only taste stimuli, but also olfactory, thermal and tactile sensations. With spicy food, the brain will perceive pain as one aspect of flavour. When one cannot 'taste' food due to the common cold, in reality it is the inability to smell that is affecting the 'flavour' of the food and not the basic tastes of the food. It is important to understand the mechanism by which taste and smell work together. When one chews food, aromas are released that enter the nose through a retronasal passage connecting the roof of the mouth with the nose. Nerve endings in the olfactory bulb in the nose send these smell stimuli to the brain. It is the aroma, when combined with the stimuli of taste, temperature and texture that give the food a 'flavour'. It is the integration of these stimuli by the brain that distinguishes between, for example, eating an apple rather than a pear. Many studies have shown a significant relationship between smell disorders and taste disorders; loss of flavour can increase the salt intake in hyposmia patients (Henkin 2013), as smell loss severity decreased, salivary cAMP and cGMP levels increased consistently with each stepwise change of clinical loss severity (Henkin 2009), and decreased cAMP and cGMP levels in parotid saliva of patients diagnosed with taste and smell disorders (Henkin 2007).
With the growing population of elderly people globally, and the effects of drugs and other treatment forms of modern medicine at any age, peoples' senses of taste and smell will continue to be adversely affected. The sense of smell is more impaired by aging compared with the sense of taste (Winkler 1999). Both anatomical investigations and human taste threshold studies indicate that age‐related differences in the gustatory system are not as substantial as investigators have suggested in the past (Mistretta 1984).
Taste and smell protect against malnutrition, depression and their concomitant diseases. The taste or smell of rancid food telling us to avoid it, or perhaps the odour of gas alerting us to danger, are lost or diminished without these senses. Simple pleasures like delicious foods and their aroma enable an individual to enjoy quality of life.
People who suffer from dysgeusia (distortion of taste) are also forced to manage the impact that the disorder has on their quality of life. An altered taste has effects on food choice and intake, and can lead to weight loss, malnutrition, impaired immunity, and a decline in health (Bromley 2000). Patients diagnosed with dysgeusia must use caution when adding sugar and salt to food and must be sure not to over‐compensate for their lack of taste with excess amounts. Since the elderly are often on multiple medications, they are at risk for taste disturbances increasing the chances of developing depression, loss of appetite, and extreme weight loss. This is cause for an evaluation and management of their dysgeusia. In patients undergoing chemotherapy, taste distortions can often be severe and make compliance with cancer treatment difficult. Other problems that may arise include anorexia and behavioural changes that can be misinterpreted as psychiatric delusions regarding food. Symptoms including paranoia, amnesia, cerebellar malfunction and lethargy can also manifest when undergoing histidine treatment. This makes it critical that these patients' dysgeusia is either treated or managed in order to improve their quality of life (Padala 2006).
Description of the condition
The symptoms of taste impairment may vary depending on the cause. Patients may experience a reduced ability to taste (hypogeusia), a distortion of taste (dysgeusia), the total lack of taste (ageusia), or all three. However, the following terms have been used in literature to describe taste abnormalities (Hawkes 2002).
-
Ageusia: absence of taste sense.
-
Hypo or microgeusia: reduction of taste sense.
-
Dysgeusia: distortion of taste sense.
-
Parageusia: distortion due to a specific stimulus.
-
Phantogeusia: distortion when there is no external stimulus.
-
Cacogeusia: unpleasant type of distortion.
-
Torquegeusia: burning type of distortion.
-
Hypergeusia: increased sensitivity to common taste.
-
Gustatophobia: dislike of certain tastes.
-
Heterogeusia: all food and drink taste the same.
-
Presbygeusia: decline of taste sense with age.
-
Type 1 hypogeusia: inability to recognise stimulus with varying degrees of detection.
-
Type 2 hypogeusia: decreased detection or recognition.
-
Type 3 hypogeusia: reduced intensity ability with normal detection and recognition.
Anything that negatively affects either the physical make‐up of the taste buds or their cells, saliva production, the nerve pathway, or brain can cause a taste disorder. Therefore, in addition to the normal aging process, a host of other factors such as smoking, infection, nerve diseases, tumours, radiation treatment, drugs, chemicals, head injury, zinc deficiency, dry mouth and poor oral hygiene can also affect the ability to taste.
Taste impairment may be caused not only by an altered threshold of taste and sensory pathway but also by various mental and physical disorders, including depression, taste bud or mucosal lesions, gum disease, dry mouth, gastrointestinal diseases, zinc deficiency and medication. Therefore the symptoms of taste impairment may vary depending on the cause. Subnormal taste often induces appetite loss, which results in malnutrition and impairs quality of life (Kashihara 2011).
Any disturbance in taste perception can hamper quality of life in such patients by influencing their appetite, body weight and psychological well‐being (Heckmann 2005).
The sense of taste is very much essential to enjoy food, which in turn provides nutrition to an individual. Taste disorders are classified based on two principles: type and site of the lesion. Based on the type of lesion, taste disorders are grouped as quantitative dysgeusias (ageusia, hypogeusia and hypergeusia) and qualitative dysgeusias (parageusia, pseudogeusia, phantogeusia, cacogueusia and agnogeusia). Based on the site of the lesion, taste disorders are classified as epithelial, neural and central dysgeusias (Fikentscher 1987). Systemic disorders like renal disorders (Mahajan 1980), alcoholic cirrhosis (Russell 1980), regional enteritis (Solomons 1974), and iatrogenic causes like post‐radiation therapy (Silverman 1983; Mossman 1978), or chemotherapy (Wickham 1999) can lead to taste disorders.
Description of the intervention
Various treatment modalities have been used to improve taste disorders. These include the use of zinc (Heckmann 2005; Sakai 2002), transcranial magnetic stimulation (Henkin 2011a), alpha lipoic acid (Femiano 2002), ginkgo biloba (Mattes 2004), pilocarpine (Aframian 2007) and acupuncture (Brandt 2008). The ability to manage taste disorders varies with each intervention.
Diminished taste acuity resulting in malnutrition in haemodialysis patients was studied in Mahajan 1980. The subjects were tested for taste acuityrelated to plasma zinc concentration. This double‐blinded study was instituted using a zinc supplement (zinc acetate) and a placebo. The same authors studied the effect of zinc supplements on patients undergoing regular haemodialysis (Mahajan 1982). Treatment of taste abnormalities with zinc sulphate was tried in patients receiving external beam radiation therapy (ERT) for head and neck cancers (Halyard 2007; Ripamonti 1998). In a double‐blind, placebo controlled trial, the efficacy of zinc picolinate and zinc gluconate were studied in idiopathic zinc deficiency taste disorders (Sakai 2002). Zinc gluconate was tested in patients with drug induced taste disorders in Yoshida 1991. Zinc supplements were also tried in taste disorders due to head trauma and malignant tumours of head and neck in Henkin 1976.
Dosage of zinc varied drastically in different trials: capsules containing 22.6 mg of zinc (Barrie 1987); 29 mg of zinc three times a day for three months (Sakai 2002); 45 mg of zinc sulphate three times a day (Ripamonti 1998); and 50 mg of elementary zinc (as zinc acetate) per day (Mahajan 1980).
-
In an open cross‐over trial on idiopathic dysgeusia patients, considering idiopathic dysgeusia as a neuropathy similar to burning mouth syndrome, an alpha lipoic acid intervention was studied (Femiano 2002).
-
Gingko biloba extracts were tried to enhance cognitive, taste and smell functions in dementia patients (Mattes 2004).
-
Repetitive transcranial magnetic stimulation (rTMS) was used in patients with smell and taste disorders (Henkin 2010; Henkin 2011a).
-
Intranasal theophylline was used for the management of patients with smell and taste disorders (Henkin 2012).
Other than these interventional studies, many individual case reports/pilot studies on management of taste disorders are found in the literature. They are:
-
high dose biotin (Greenway 2011).
-
application of glutamate (Sasano 2010).
-
branched‐chain amino acid‐enriched supplementation (Aminofeel) (Nagao 2010).
-
transient cooling of the mouth by using ice cubes (Fujiyama 2010).
-
thioridazine/haloperidol to inhibit phantogeusia (Henkin 2000).
-
miracle fruit (Synsepalum dulcificum) (Wilken 2012).
How the intervention might work
Zinc is an important element in both the maintenance and repair of taste buds. Zinc influences the synthesis of the protein gustin, which is linked to the production of taste buds. A decrease in the salivary gustin/carbonic anhydrase VI is associated with taste and smell disorders and can be effectively treated with zinc supplementation (Henkin 1999). Zinc has also been shown to increase calcium concentration in saliva. Taste buds rely on calcium receptors to work properly (Heckmann 2005). Finally, zinc is an important cofactor for alkaline phosphatase, the most important enzyme in taste bud membranes (Bicknell 1988). Zinc supplementation has shown to be effective in treating taste disorders. It can also be found in natural foods such as meat, cereals, beans and oysters.
Alpha lipoic acid (ALA) is an antioxidant that is produced naturally in human cells. Among its functions, it has an important role in the Krebs cycle assisting in the production of nerve growth factor. Research in animals has shown that ALA can improve nerve induction velocity. However, there are contradictory opinions about the efficacy of ALA in treating burning mouth syndrome and dysgeusia (de Moraes 2012; Femiano 2002).
Ginkgo biloba, an herbal extract, may have three effects on the human body: improvement in blood flow to most tissues and organs; protection against oxidative cell damage from free radicals; and blockage of many platelet‐activating factors (aggregation and blood clotting). These anticlotting characteristics may be of help with circulatory problems attributed to aging. It is being used to treat memory loss, and the impact to the brain and circulation may make it helpful in treating taste disorders (Mattes 2004). However, there is no evidence for its clinically significant benefits in dementia patients (Birks 2009).
Transcranial magnetic stimulation (TMS) uses electromagnetic induction to induce weak electric currents stimulating activity in specific parts of the brain with minimal discomfort. A variant of TMS, called repetitive TMS, was used to treat various neurological and psychiatric disorders including migraines, Parkinson's disease, tinnitus, stroke, depression (Henkin 2011a), and phantogeusia (unpleasant taste sensation in the absence of food or drink) (Henkin 2011b).
Research has found that saliva contains specific proteins that are growth factors (nerve growth factor, epidermal growth factor) that make taste buds develop and mature. Without these growth factors, taste buds degenerate (Gardiner 2008). Pilocarpine, by increasing saliva production, gives taste buds greater access to food molecules and may be responsible for maintenance of taste buds. Studies have shown that treatment with pilocarpine enhances taste (Aframian 2007; Leek 2002).
Acupunture is the stimulation of specific acupoints along the skin of the body involving various methods such as the application of heat, pressure or laser or penetration of thin needles. It is a key component of traditional Chinese medicine which aims to treat a range of conditions including dysgeusia. According to traditional Chinese medicine, stimulating specific acupuncture points corrects imbalances in the flow of qi through channels known as meridians. This seeks to re‐establish an equilibrium of forces in the diseased body between the energies of yin and yang (contrary energies such as fire and water, hot and cold), which are distorted in the diseased body (Vent 2010).
Why it is important to do this review
Taste disturbances are not uncommon, have a range of causes and result in considerable loss of quality of life. A systematic review is necessary to summarise the evidence of the effects of the many interventions available to treat taste disturbances and to provide evidence to guide decision‐making.
Objectives
To assess the effects of interventions for the management of patients with taste disturbances.
Methods
Criteria for considering studies for this review
Types of studies
We included only parallel and cross‐over randomised controlled trials (RCTs) with either a pharmacological or non‐pharmacological intervention in this review.
Types of participants
We included patients with taste disorders diagnosed clinically as dysgeusia, parageusia, ageusia, hypogeusia or phantogeusia regardless of their age, sex, race, profession or residential location. It is a well established fact that many treatment procedures like surgery, radiation therapy and chemotherapy can cause taste perception problems. Once the effect of these treatment procedures diminishes, the taste perception slowly reverts back to normal. Considering these variations, we agreed upon the following exclusion criteria. We excluded the following types of patients in our review.
-
Demolitive surgery of tongue, palate or oropharynx.
-
Presence of oral lesions such as ulcers, stomatitis, candidiasis and necrosis.
-
Cerebral lesions or surgical damage to the nervous system.
-
Endocrinal and neurological disorders known to affect taste, or smell sensitivity, or both.
-
Patients undergoing treatment with drugs known to affect taste perception e.g. chemotherapy.
-
Patients experiencing xerostomia (dry mouth).
Types of interventions
-
Any intervention versus placebo or no treatment.
-
Any direct comparisons between two active interventions, e.g. drug A versus drug B, or between two doses of the same drug e.g. drug A dose X versus drug A dose Y.
-
We included all routes of drug administration or modes of application.
Types of outcome measures
We considered improvement in taste acuity to at least one quality of taste by subjective/objective assessment scales as the most important outcome. It could be any one of the following.
-
Sip and spit method (traditional method): In this method, a solution of a known concentration of a sweet, salty, bitter, or sour substance is gargled and sloshed in the mouth and then discarded. The patient is asked to identify the taste substance, and the concentration can be varied to determine threshold sensitivity. It is an easy test to administer but assumes severe taste loss. Regional damage (e.g. on the front or tip of the tongue) would be masked by stimulation of the remaining taste cells elsewhere in the mouth.
-
Filter paper disk method (Tomita 1986): In this test, filter paper or a dissolvable strip is impregnated with a known concentration of a sweet, salty, bitter, or sour substance, and the filter paper or strip is placed on a specific part of the tongue or palate. The patient is asked to identify the taste substance. The concentration can be varied to determine threshold sensitivity. This test is also easy to administer. The goal is to activate major regions of taste cells to determine whether the individual has partial taste deficit or damage.
-
Electrogustometry (Tomita 1986): The measurement of taste threshold by passing a controlled anodal current through the tongue. When the current passes through the tongue a unique and distinct metallic taste is perceived.
-
Three stimulus drop technique (Henkin 1963): Testing involves a three‐stimuli forced choice drop technique given in a type of staircase technique. The subject is given three drops of liquid, which are placed successively onto the lingual surface. Out of three, two drops are water and one drop is water with a solute, either NaCl (salt), sucrose (sweet), hydrogen chloride (HCl) (sour) or urea (bitter).
-
Edible taste strips (Smutzer 2008): Prepared from pullulan hydroxypropyl methylcellulose solutions that are dried to a thin film. The maximal amount of a tastant that could be incorporated in a 2.54 cm × 2.54 cm taste strip is 5% for each class of tastant (sweet, sour, salty, bitter and umami) during strip formation.
-
Filter paper strips method (Mueller 2003): All four of five taste qualities, sweet, sour, salty and bitter are tested using filter paper strips coated with four different concentrations for each taste quality. This is tested randomly on the right and left side of the anterior two‐thirds of the tongue, and the subject is asked to identify the taste from a list of four descriptors.
-
Visual analogue scale (traditional method).
-
Self reporting questionnaire method (Soter 2008).
-
Spatial taste test (Gondivkar 2009).
-
Clinical bitterness masking test for phantogeusia (Ishimaru 2001).
Primary outcomes
-
Taste acuity improvement ‐ we considered improvement in taste acuity to at least one quality of taste by subjective/objective assessment scales as the most important outcome.
-
Taste discrimination improvement.
Taste acuity includes taste detection and recognition, whereas taste discrimination is the ability to distinguish one taste from the other.
Secondary outcomes
-
Adverse events related to the interventions.
-
Health‐related quality of life.
Search methods for identification of studies
For the identification of studies included or considered for this review, detailed search strategies were developed for each database searched. These were based on the search strategy developed for MEDLINE (Appendix 1), but revised appropriately for each database to take account of differences in controlled vocabulary and syntax rules.
The search strategy combined the subject search with the Cochrane Highly Sensitive Search Strategy for identifying reports of RCTs (2008 revision), as published in Box 6.4.c in the Cochrane Handbook for Systematic Reviews of Interventions (Higgins 2011).
The subject search used a combination of controlled vocabulary and free text terms.
Electronic searches
We searched the following databases.
-
MEDLINE via OVID (1946 to 5 March 2014) (Appendix 1).
-
The Cochrane Oral Health Group Trials Register (to 5 March 2014) (Appendix 2).
-
The Cochrane Central Register of Controlled Trials (CENTRAL) (The Cochrane Library Issue 1, 2014) (Appendix 3).
-
EMBASE via OVID (1980 to 5 March 2014) (Appendix 4).
-
CINAHL via EBSCO (1980 to 5 March 2014) (Appendix 5).
-
AMED via OVID (1985 to 5 March 2014) (Appendix 6).
We did not impose any restrictions on language or date of publication in the searches of the electronic databases. We translated non‐English papers.
Searching other resources
We searched the following databases for ongoing trials.
-
The US National Institutes of Health Trials Register (http://www.clinicaltrials.gov) (to 5 March 2014) (Appendix 7).
-
The metaRegister of Controlled Trials (mRCT) (http://www.controlled‐trials.com/mrct/) (to 5 March 2014) (Appendix 8).;
-
The World Health Organization's International Clinical Trials Registry Platform (WHO ICTRP) (http://apps.who.int/trialsearch/) (to 5 March 2014) (Appendix 9).
-
The International Federation of Pharmaceutical Manufacturers and Associations (IFPMA) Clinical Trials Portal (http://clinicaltrials.ifpma.org/clinicaltrials/no_cache/en/myportal/index.htm) (to 5 March 2014) (Appendix 10).
We checked reference lists of included studies to identify any further additional studies. We contacted authors of the included studies for relevant unpublished material. We searched abstracts from scientific meetings and conferences for appropriate studies using the following web sites.
-
International Association of Dental Research/American Association of Dental Research Conference Proceedings (to 5 March 2014, Appendix 11).
-
Association for Research in Otolaryngology Conference Proceedings (to 5 March 2014, Appendix 12).
We only included handsearching done as part of the Cochrane worldwide handsearching programme and uploaded to CENTRAL (see the Cochrane Masterlist for details of journal issues searched to date).
Data collection and analysis
Selection of studies
Two review authors (RG, NYS) screened the titles and abstracts of all the obtained reports for eligibility, independently and in duplicate. Full papers of relevant RCTs (based on the inclusion and exclusion criteria) were obtained and screened independently and in duplicate by two review authors (KS, AS). Any disagreements on eligibility were resolved by discussion. When resolution was not possible, we consulted an arbiter (Adinegara Lutfi Abbas). We recorded studies excluded at this point in the Characteristics of excluded studies tables along with reasons for exclusion. We did not mention non‐RCTs or quasi‐RCTs in the Characteristics of excluded studies tables.
Data extraction and management
Two review authors (RG SKN) extracted the data independently and in duplicate, using a data extraction form specifically designed for this review. Any disagreements were resolved by discussions. For two studies, we could not resolve the disagreement, and a third review author was asked to do the data extraction independently, and this was deemed final. We entered all of the study details in the Characteristics of included studies tables in Review Manager 5 (RevMan 2014).
We recorded the following details for each study.
-
Publication details like year of publication and language
-
Demographic details of the report
-
Inclusion and exclusion criteria
-
Sample size, method of randomisation, allocation concealment, blinding, type of trial, method of assessing the outcome, and dropouts, if any
-
Type of intervention
-
Details of the outcome reported
-
Duration of follow‐up
-
Results of the intervention
-
Funding details
We contacted the author/s of included/excluded studies via email if clarification of any details or additional data were required.
Assessment of risk of bias in included studies
We assessed the risk of bias of included studies using The Cochrane Collaboration's 'Risk of bias' tool, as described in Chapter 8 of the Cochrane Handbook for Systematic Reviews of Interventions (Higgins 2011). We completed a 'Risk of bias' table for each included study. Within each table, we assessed the following domains of risk of bias: sequence generation, allocation concealment, blinding, incomplete outcome data, selective outcome reporting and other potential sources of bias. For each domain, we described what was reported to have happened, using quotes from the study, followed by a judgement of 'Low risk', 'High risk' or 'Unclear risk' of bias. We contacted the study authors for clarification where necessary, quoting their responses in the risk of bias table. We resolved any disagreements on risk of bias by consulting a third review author (Arbiter).
Summarising risk of bias for a study
Studies have been grouped into the following categories.
| Risk of bias | Interpretation | Within a study | Across studies |
| Low risk of bias | Plausible bias unlikely to seriously alter the results | Low risk of bias for all key domains | Most information is from studies at low risk of bias |
| Unclear risk of bias | Plausible bias that raises some doubt about the results | Unclear risk of bias for one or more key domains | Most information is from studies at low or unclear risk of bias |
| High risk of bias | Plausible bias that seriously weakens confidence in the results | High risk of bias for one or more key domains | The proportion of information from studies at high risk of bias is sufficient to affect the interpretation of results |
We summarised risk of bias graphically using the plots available in Review Manager 5 (RevMan 2014) as Figure 1.

Risk of bias summary: review authors' judgements about each risk of bias item for each included study.
Measures of treatment effect
For dichotomous data, we expressed the estimates of effect of an intervention as risk ratios (RRs) together with 95% confidence intervals (CIs). For continuous data, we used standardised mean difference, as the included studies used different taste scales to measure the same primary outcome (e.g. improvement in taste acuity).
Unit of analysis issues
Cross‐over studies
We had two cross‐over trials in our review. One study (Eggert 1982) presented the data in graphs and we separately analysed only the data before cross‐over. The other study (Watson 1983) gave the data in median value and we could not use thisin the meta‐analysis of outcomes; however, we used the adverse events data in the meta‐analysis.
Studies with multiple intervention arms
One study (Sakagami 2009) had three treatment arms. We combined the data using the method described in section 7.7.3.8 of the Cochrane Handbook for Systematic Reviews of Interventions (Higgins 2011).
Dealing with missing data
We contacted study authors to obtain missing data whenever possible. If we could not get the missing data, we used per protocol analyses for missing data and assessed the data at a high risk of bias in the 'Risk of bias' tables.
If both mean and standard deviation were reported as graphs, we derived the data from the graphs by magnifying them and approximating the measures of mean and standard deviation.
If the data were described in the form of ordinal outcome, we converted the shorter ordinal scales into dichotomous data by combining relevant adjacent categories.
Assessment of heterogeneity
We assessed heterogeneity of the studies by examining the forest plots, with poor overlap of the confidence intervals indicating the presence of heterogeneity. We used the Chi² test to assess whether heterogeneity was present and quantified it using the I² statistic. We used the guidance given in the Cochrane Handbook for Systematic Reviews of Interventions to interpret the I² statistic: 0% to 40% might not be important; 30% to 60% may represent moderate heterogeneity; 50% to 90% may represent substantial heterogeneity; and 75% to 100% indicates considerable heterogeneity (Higgins 2011).
Assessment of reporting biases
According to our protocol we intended to do a test of asymmetry to assess reporting bias, but we did not do this test as we had less than 10 trials included in our review.
Data synthesis
We analysed the data using Review Manager 5 software (RevMan 2014). We used the data available from the trials with similar comparisons and outcomes in the meta‐analysis. We combined RRs for dichotomous data and standardised mean differences for continuous data (as the trials used different scales), and used a fixed‐effects model in the meta‐analysis. We used the first phase data from one cross‐over study (Eggert 1982), although we did not pool this data with other studies in the meta‐analysis.
Subgroup analysis and investigation of heterogeneity
We conducted subgroup analyses whenever there was heterogeneity.
To identify the reasons for clinical or methodological heterogeneity in meta‐analyses, we carried out subgroup analyses, based on:
-
population: idiopathic dysgeusia/hypogeusia, and dysgeusia and hypogeusia secondary to chronic renal failure; and
-
outcome: patient reported outcome (VAS scale, questionnaire), and objective outcome (taste strips or filter paper disks).
Sensitivity analysis
Wherever feasible, we undertook sensitivity analyses to assess the robustness of our findings by excluding studies with high risk of bias.
Summarising and interpreting results
We used the GRADE approach to interpret findings. We used the GRADE Profiler software (version 3.6), and imported the data from Review Manager 5 to create 'Summary of findings' tables for each comparison included in this review. We assessed the outcomes with reference to the overall risk of bias of the included studies, the inconsistency of the results, the directness of the evidence, the precision of the estimates, and the risk of publication bias. We categorised the quality of the body of evidence for each assessable outcome as no reason to downgrade the quality of evidence, serious reason (downgraded by 1) or very serious reason (downgraded by 2). These tables provide the information concerning the overall quality of the evidence from the trials, the magnitude of effect of the interventions examined and the sum of available data on the primary outcome and secondary outcomes. We selected the outcomes of improvement in taste acuity, adverse events and taste discrimination, for inclusion in these tables (summary of findings Table for the main comparison, summary of findings Table 2).
Results
Description of studies
Results of the search
The electronic search strategies identified 3184 records from English and other language databases. We searched abstracts from scientific meetings and conferences for appropriate studies through the web sites of the following organisations.
We used keywords "taste", "dysgeusia" and "chemosensory" to search for related abstracts, and identified 41 abstracts from the International Association of Dental Research conference proceedings (as on 5 March 2014) and 13 trials from the Association of Research in Otolaryngologyconference proceedings (as on 5 March 2014). We searched the following databases for ongoing/completed trials.
-
The National Institutes of Health (NIH) database (http://www.clinicaltrials.gov).
-
The metaRegister of Controlled Trials (mRCT) (http://www.controlled‐trials.com/mrct/).
-
The World Health Organization's International Clinical Trials Registry Platform (WHO ICTRP) (http://apps.who.int/trialsearch/).
-
International Federation of Pharmaceutical Manufacturers and Associations (IFPMA) Clinical Trials Portal (http://clinicaltrials.ifpma.org/clinicaltrials/no_cache/en/myportal/index.htm).
The electronic search of these databases resulted in 130 trials from NIH, 13 trials from WHO ICTRP, 21 trials from IFPMA (as on 5 March 2014) and nine trials from mRCT (as on 5 March 2014). Only four trials were related to interventions in patients with taste disorders, and of these, two trials were ongoing (IFPMA, http://clinicaltrials.gov/show/NCT01143285 (excluded) and http://www.clinicaltrials.jp/user/showCteDetailE.jsp?japicId=JapicCTI‐121907) and two trials were completed (http://clinicaltrials.gov/show/NCT00316563 and http://apps.who.int/trialsearch/Trial.aspx?TrialID=JPRN‐C000000401). The completed trial (NCT00316563) is published and we excluded the study from our review (Brisbois 2011).
At the end of our search, we had 3187 records, out of which we discarded 3117 and we requested full text copies of 70 references. Four review authors (SKN, RG, NYS and AS), independently and in duplicate assessed these papers to determine their eligibility. We identified nine studies which met the inclusion criteria and included them in this review (Figure 2). For details of the studies examined and reasons for inclusion or exclusion, see the Characteristics of included studies and Characteristics of excluded studies tables.

Study flow diagram.
We contacted authors of six included trials and we received clarifications for only four trials. We could not contact authors of two trials due to non‐availability of recent address/ email address. One trial did not have any missing data and hence the authors were not contacted (see Characteristics of included studies). We also contacted the authors of an unpublished clinical trial and they refused to share the details of the trial (see Characteristics of studies awaiting classification).
Included studies
See Characteristics of included studies table.
Characteristics of the trial settings and investigators
We included nine trials in the review. Out of these, seven were in the English language, one was in German (Brandt 2008), and one was in Japanese (Ikeda 2013). The countries of origin for the included studies were: two from Germany (Brandt 2008; Heckmann 2005), three from Japan (Ikeda 2013; Sakagami 2009; Sakai 2002), one from the UK (Watson 1983), and three from the US (Eggert 1982; Mahajan 1980; Mahajan 1982).
Seven trials were parallel design trials and two were cross‐over trials (Eggert 1982; Watson 1983).
Out of nine trials, seven provided grant information and out of these seven, two were government funded (Mahajan 1980; Mahajan 1982), two were privately funded (Brandt 2008; Eggert 1982), one was funded by a pharmaceutical company (Ikeda 2013), one had the intervention drug sponsored by a pharmaceutical company (Sakagami 2009), and one had university sponsorship using taste strips and private funding (Heckmann 2005).
Two of the trials were multicentric (Ikeda 2013; Sakagami 2009) and others were carried out in either one or two centres.
Only one trial (Brandt 2008) studied taste discrimination as the study outcome; the other eight trials tested for taste acuity (detection, recognition, or both) as their study outcome. Two trials (Heckmann 2005; Brandt 2008) have reported health‐related quality of life for dysgeusia patients. Both the trials have reported the data related to improvement in the mood scale and depression inventory. In addition to these, Brandt 2008 also reports the assessment of ‘quality of life’ using visual analog scale.
Characteristics of the participants
Seven out of nine trials included only adult patients (Brandt 2008; Heckmann 2005; Ikeda 2013; Mahajan 1980; Mahajan 1982; Sakagami 2009; Sakai 2002) and two were trials on children (Eggert 1982; Watson 1983). Six trials included both genders in their study, one study included only males (Mahajan 1982) and two trials did not report on the gender distribution (Eggert 1982; Mahajan 1980). The minimum age included in the study was 0.5 years (Eggert 1982) and the maximum age included in the study was 83 years (Brandt 2008). The minimum sample size was 17 (Eggert 1982) and the maximum sample size was 219 (Ikeda 2013) with an average of 62.4.
Four trials were on renal failure‐induced hypogeusia (Eggert 1982; Mahajan 1980; Mahajan 1982; Watson 1983), three were on idiopathic dysgeusia/hypogeusia (Brandt 2008; Heckmann 2005; Sakagami 2009), and two were on idiopathic dysgeusia and zinc deficiency‐induced hypogeusia (Ikeda 2013; Sakai 2002).
Characteristics of the interventions
We only included one non‐pharmacological intervention (needle acupuncture) in our review (Brandt 2008); the remaining eight trials had zinc compounds as the intervention drug. Two trials studied zinc sulphate (Eggert 1982; Watson 1983) and two used polaprezinc (Ikeda 2013; Sakagami 2009). Zinc acetate was used in two trials (Mahajan 1980; Mahajan 1982), zinc gluconate in one (Heckmann 2005), and zinc picolinate in one trial (Sakai 2002).
Zinc supplement
Zinc sulphate
Two cross‐over trials studied the effects of zinc sulphate on taste disorders in chronic renal failure patients (Eggert 1982; Watson 1983). Zinc sulphate was given at the dosage of 0.5 mg/Zn/kg/day to 0.75 mg/Zn/kg/day to all the children included in the trial for six months (Eggert 1982). Zinc sulphate was given at a dose equivalent to 15 mg elemental zinc for children and 50 mg elemental zinc for adults, for a period of 6 weeks (Watson 1983).
Zinc acetate
Two trials studied the effects of zinc acetate on taste disorders in chronic renal failure patients (Mahajan 1980; Mahajan 1982). Both trials tested 25 mg elemental zinc, twice a day in zinc acetate form.
Polaprezinc
Two trials studied the efficacy of polaprezinc on taste disorders (Sakagami 2009; Ikeda 2013). In the trial by Sakagami 2009, polaprezinc was tested in three different dosages, 75 mg, 150 mg, and 300 mg, which was equivalent to 17 mg, 34 mg, and 68 mg of elemental zinc, respectively for 12 weeks. In the trial by Ikeda 2013, polaprezinc was administered as 75 mg (17 mg elemental zinc), twice a day for 12 weeks. Additional to this, the daily intake of dietary zinc was standardised in both the experimental and control group (Table 1, Table 2, Table 3, Table 4).
| Outcome | Gp A | Gp B | Time when measured | ||||
| Mean* | S.D. | n= | Mean* | S.D. | n= | ||
| Change of the mean 4 basic taste sensitivity scores from baseline | ‐0.52 | 0.68 | 108 | ‐0.47 | 0.61 | 111 | 4 weeks |
| ‐0.90 | 0.85 | 108 | ‐0.67 | 0.73 | 111 | 8 weeks | |
| ‐1.17 | 0.93 | 108 | ‐0.85 | 0.75 | 111 | 12 weeks | |
| ‐1.28 | 0.94 | 108 | ‐0.97 | 0.76 | 111 | 4 weeks after treatment | |
*Minus change score means better by filter paper disc method by Tomita
| Outcome | Gp A events (Improved) | Gp A total | Gp B events | Gp B total | Time when measured |
| Improved/not improved | 60 | 108 | 48 | 111 | 12 weeks |
| Outcome | Gp A (Placebo) N = 27 | Gp B (17 mg zinc) N = 27 | Gp C (34 mg zinc) N = 25 | Gp D (68 mg zinc) N = 28 | Time when measured | ||||
| Secondary outcome | Mean | Std Dev | Mean | Std Dev | Mean | Std Dev | Mean | Std Dev | 12 weeks |
| Mean filter paper disk test scores (filter paper disk) | 4.095 | 1.148 | 4.350 | 1.030 | 3.448 | 0.928 | 3.454 | 1.138 | ─ |
| Mean serum zinc level | 1.8 | 12.7 | 5.7 | 13.5 | 11.4 | 16.6 | 20.6 | 21.3 | ─ |
| Gp A | Gp B | Gp C | Gp D | ─ | |||||
| Increase in the average score of subjective symptoms | 0.6 | 0.9 | 1.2 | 1.0 | ─ | ||||
| Primary outcome: quantitative analysis of taste perception using filter paper disk method | Event (success) Cured + improved | No event (fail) Unchanged, neither cured nor improved nor worsened; aggravated | Total |
| Experimental intervention (17 mg Zinc) | SE= 14 | FE= 13 | NE= 27 |
| Control intervention (Placebo) | SC= 17 | FC= 10 | NC= 27 |
| RR = 0.824; OR = 0.634; RD = 0.447 | |||
| Experimental intervention (34 mg Zinc) | SE= 20 | FE= 5 | NE= 25 |
| Control intervention (Placebo) | SC= 17 | FC= 10 | NC= 27 |
| RR = 0.318; OR = 2.353; RD = 0.17 | |||
| Experimental intervention (68 mg Zinc) | SE= 25 | FE= 3 | NE= 28 |
| Control intervention (Placebo) | SC= 17 | FC= 10 | NC= 27 |
| RR = 1.418; OR = 4.902; RD = 0.263 | |||
RR = risk ratio: risk of event in experimental group/risk of event in control group.
OR = odds ratio: odds of event in experimental group/ odds of event in control group.
RD = risk difference: risk of event in experimental group – risk of event in control group.
Zinc picolinate
One trial studied the effects of zinc picolinate on taste disorders at the dosage of 28.9 mg, three times a day for three months (Sakai 2002). No dietary instructions to increase dietary zinc were given to either of the groups in this study (Table 5).
| Filter paper disk method | Event (success) Improved (+cured) | No event (fail) Unchanged | Total (N = 73) |
| Experimental intervention (Zinc picolinate) | SE= 28 | FE= 9 | NE= 37 |
| Control intervention (Placebo) | SC= 16 | FC= 20 | NC= 36 |
| RR = 1.703; OR = 3.889; RD = 0.312 | |||
| Experimental intervention (Zinc picolinate) | SE= 22 | FE= 12 | NE= 34 |
| Control intervention (Placebo) | SC= 18 | FC= 17 | NC= 35 |
| RR = 1.258 ; OR = 1.732; RD = 0.133 | |||
RR = risk ratio: risk of event in experimental group/risk of event in control group.
OR = odds ratio: odds of event in experimental group/ odds of event in control group.
RD = risk difference: risk of event in experimental group – risk of event in control group.
Zinc gluconate
One trial studied the effects of zinc gluconate on taste disorders at the dosage of 140 mg/day (equivalent to 20 mg elemental zinc) for three months. (Heckmann 2005) (Table 6, Table 7).
| Outcome | Gp A (Zinc treatment) | Gp B (Placebo) | Time when measured | ||||
| Mean | Std Dev | N= | Mean | Std Dev | N= | At the end of 3 months | |
| Primary outcome | ─ | ||||||
| Taste test (32 filter paper strip method by Muller et al 2003) | 25.7 | 6.5 | 26 | 21.2 | 5.7 | 24 | ─ |
| Self rated impairment in % (VAS scale of 10 cm length equivalent to 100%; 0 to 10. 0 = no impairment and 10 = extremely impaired) | 45.0 | 4.4 | 26 | 43.8 | 3.6 | 24 | ─ |
| Secondary outcome | ─ | ||||||
| Beck Depression Inventory (BDI) | 7.5 | 7.0 | 26 | 11.3 | 10.9 | 24 | ─ |
| von Zersen Mood Scale (ZMS) | 10.7 | 7.5 | 26 | 18.8 | 14.6 | 24 | ─ |
| Zinc in serum (microgram/dL) | 81.53 | 19.61 | 26 | 72.01 | 10.22 | 24 | ─ |
| Type of Intervention | Event (success) Improved | No event (fail) | Total |
| Experimental intervention (Zinc) | SE= 13 | FE= 13 | NE= 26 |
| Control intervention | SC= 6 | FC= 18 | NC= 24 |
| RR = 2; OR = 3; RD = 0.25 | |||
RR = risk ratio: risk of event in experimental group/risk of event in control group.
OR = odds ratio: odds of event in experimental group/ odds of event in control group.
RD = risk difference: risk of event in experimental group – risk of event in control group.
Acupuncture
We included one trial that studied the effects of 15 acupuncture treatments on taste disorders over a period of eight weeks (Brandt 2008). Two patients did not require further acupuncture treatment after 10 treatments. De‐activated laser acupuncture was used as a sham control (Table 8).
| Outcome | Gp A | Gp B | Time when measured | ||||||
| Mean | Std Dev* | N=17 | Mean | Std Dev* | N=20 | ||||
| Taste discrimination | 11.7 (before)/ 17.5 (after) | 4 (before)/ | ─ | 11.9 (before)/ 14.7(after) | 5 (before)/ | ─ | Before and after treatment | ||
| Quality of life | Not estimable (changes per group only given for each of the 5 individual questions of the questionnaire, but no combined score/analysis stated) Only information given: ‘both treatments resulted in an increased quality of life, however, no statistically significant difference could be found’ | Before and after treatment | |||||||
| Depressive symptoms | 11 (before)/ 6 (after)* | 5 (before) / 4 (after)* | ─ | 10,5 (before)/ 10 (after)* | 7 (before)/ 7 (after)* | ─ | Before and after treatment | ||
| “The psychological well‐being of the intervention groups increased for 94,1% of all patients in the intervention group, but only for 60% of patients in the control group. This difference was statistically significant” | |||||||||
| Subjective well‐being | 16 (before)/ 12 (after)* | 10 (before)/ 7 (after)* | ─ | 20 (before)/ 18 (after)* | 9 (before)/ 14 (after)* | ─ | Before and after treatment | ||
| “58.8% of all patients in the intervention group felt better, whereas only 45% of all patients in the control group felt better. This difference was not statistically significant” | |||||||||
*Only given in graph ‐> estimated from graph
Excluded studies
See Characteristics of excluded studies tables for further details.
We excluded thirty‐four non‐RCTs and quasi‐RCTs without any explanation. We procured twenty full text articles and excluded these with reasons (Characteristics of excluded studies).
Three trials included patients with taste disorders under medications which might affect taste perception (Brisbois 2011; Green 2013; Lyckholm 2012).
Seven trials reported the intervention effects on either normal volunteers or subjects without taste disorders (Atkin‐Thor 1978; Dahl 1984; Kamphuis 2003; Mahajan 1992; Ohno 2003; Stewart‐Knox 2008; Tupe 2009 ).
Six trials were aimed at prevention of taste disorders in patients undergoing chemotherapy or radiotherapy (Halyard 2007; Jham 2009; Najafizade 2013; NCT01143285 2013; Ripamonti 1998; Strasser 2008).
Three trials included patients with taste disorders due to trauma, cranial injuries, oral lesions, and neurological problems etc. (Henkin1976; Sprenger 1983; Yoshida 1991).
One trial included patients with taste disorders secondary to radiotherapy, including parotid carcinoma cases, where the patients could have experienced xerostomia (Velargo 2012).
Studies awaiting classification
See Characteristics of studies awaiting classification tables for further details.
We grouped four trials as studies awaiting classification. One clinical trial was completed but unpublished; hence the study group refused to share the results (JPRN‐C000000401). The full text was not available for three trials, and hence we could not decide on the inclusion/exclusion of the studies (Mahajan 1979; Sanchez 1993; Sturniolo 1985).
Ongoing studies
See Characteristics of ongoing studies table for further details.
We identified one ongoing clinical trial that was expected to be completed by the end of September, 2014 (Jprn‐JapicCti 2013); we will consider this study in our future update of the review.
Risk of bias in included studies
See the ’Risk of bias’ tables within Characteristics of included studies for further details. For a graphical summary, see Figure 1.
We documented the risk of bias for included studies based on the full text articles. Wherever there was a need for clarification, we contacted the authors. Based on the available data, the 'Risk of bias' assessment was either "low risk", "high risk" or "unclear risk". If the trial report mentioned it as "double‐blind" we considered it as low risk of bias and if the study was "single‐blind" (Brandt 2008), we assessed it as high risk of bias.
We assessed three trials (33.3%) as low risk of bias (Heckmann 2005; Mahajan 1980; Mahajan 1982), four trials (44.5%) as high risk of bias (Brandt 2008; Eggert 1982; Sakai 2002; Watson 1983), and two trials (22.2%) as unclear risk of bias (Ikeda 2013; Sakagami 2009).
Allocation
Seven of the included trials (Brandt 2008; Eggert 1982; Heckmann 2005; Sakagami 2009; Mahajan 1980; Mahajan 1982; Watson 1983) reported the method of sequence generation and five of the included studies (Eggert 1982; Heckmann 2005; Mahajan 1980; Mahajan 1982; Watson 1983) reported concealment of allocation (Figure 1).
Blinding
Out of nine included trials, blinding of participants and personnel was unclear in two (Sakai 2002; Watson 1983), and blinding was not done in one (Brandt 2008).
Blinding of assessors was not reported in three trials (Brandt 2008; Sakai 2002; Watson 1983), whereas three trials described that assessors were blinded (Heckmann 2005; Mahajan 1980; Mahajan 1982). The other three trials (Eggert 1982; Ikeda 2013; Sakagami 2009) described their studies as "double‐blind", but no details of assessor blinding were given.
Incomplete outcome data
Attrition bias was reported in three of the included studies (Eggert 1982; Sakai 2002; Watson 1983).
Selective reporting
None of the included trials had reporting bias.
Other potential sources of bias
One of the trials had a high risk of bias as this cross‐over trial did not have any washout period (Eggert 1982). We could not rule out the influence of the pharmaceutical company in the Sakagami 2009 trial. Routine medications (no details of those medications described) were continued during the trial which could have caused dysgeusia in the Watson 1983 trial.
Effects of interventions
See: Summary of findings for the main comparison Zinc compared to placebo for the management of taste disturbances; Summary of findings 2 Acupuncture compared to sham control for patients with taste disturbances
See: Summary of findings table 1 for the main comparison of zinc with placebo for the management of taste disturbances.
Taste acuity improvement ‐ zinc supplements versus placebo
Out of nine included trials, eight compared zinc supplements with placebo for taste disorder patients. One of these eight trials reported the results using median values (Watson 1983) and two trials reported the results in graphs (Eggert 1982; Watson 1983). Two trials assessed patient reported outcomes, and seven trials reported objective improvement based on taste strips/filter paper disks/three‐drop stimulus methods.
Patient reported outcome
We first evaluated our primary outcome, taste acuity as reported by the patient. Two trials (Heckmann 2005; Sakai 2002) assessed the patient reported outcome for taste acuity improvement. The Heckmann 2005 trial was at low risk of bias and the Sakai 2002 trial was at high risk of bias.
Heckmann 2005 used zinc gluconate in idiopathic dysgeusia patients and assessed the improvement using VAS scale (0 to 10 where 0 is no impairment and 10 is extremely impaired). Sakai 2002 used zinc picolinate in patients either with idiopathic dysgeusia or zinc deficient dysgeusia, and assessed the improvement using a questionnaire method (1 to 5 where 1 is no taste and 5 is normal). The forest plot (Analysis 1.1) shows an I2 of 9%, depicting low heterogeneity, and the CI ranges from 1 to 2.10, indicating that the effect estimate ranges between no benefit to appreciable benefit. The overall effect favours zinc supplements over placebo for this patient reported outcome with a RR of 1.45 (CI 1.0 to 2.10).
Objective outcome
Taste acuity can be tested objectively using methods like the filter paper disk method, and the three‐drop technique etc. We included seven trials (Eggert 1982; Heckmann 2005; Ikeda 2013; Mahajan 1980; Mahajan 1982; Sakagami 2009; Sakai 2002) that used different objective taste testing methods to see the improvement in taste acuity. Heckmann 2005 used the filter paper strip method whereas Ikeda 2013, Sakagami 2009 and Sakai 2002 have used the filter paper disk method. Mahajan 1980, Mahajan 1982 and Eggert 1982 used the three‐drop stimulus method in their trials.
Ikeda 2013 and Sakagami 2009 described the results as continuous data for taste acuity whereas Sakai 2002 and Mahajan 1982 described the results as dichotomous data. Hence, we analysed the data separately. Heckmann 2005 reported continuous data (in addition to dichotomous data for this patient reported outcome). Mahajan 1980 described the results as continuous data for each taste sensation. We only used the data from the first half of the cross‐over trial by Eggert 1982. We analysed the data from these two studies separately.
Continuous data
See: Analysis 1.2, Analysis 1.3 and Analysis 1.4
Three trials were included in the meta‐analysis for this outcome (Heckmann 2005; Ikeda 2013; Sakagami 2009) as they studied taste disorders in idiopathic dysgeusia. One of these trials (Heckmann 2005) was at low risk of bias and two trials (Ikeda 2013; Sakagami 2009) were at unclear risk of bias. Two other trials (Eggert 1982; Mahajan 1980) described the same outcome in chronic renal failure patients, and hence we analysed them separately.
In the Heckmann 2005 trial, 32 filter paper strips impregnated with various tastant were used, and an average was taken for each group. An improvement by six points in the taste test was regarded as substantial. Ikeda 2013 and Sakagami 2009 used the filter paper disk method. Ikeda 2013 explained the results in mean improvement of the taste grades whereas Sakagami 2009 explained the results in mean improvement for three different dosages of zinc (17 mg, 34 mg and 68 mg). Hence, we combined these data according to the method described in the Cochrane Handbook for Systematic Reviews of Interventions, section 7.7.3.8. The grade was expressed as negative value in the Sakagami 2009 study because the values were regarded as improvement only when it was less than the baseline data.
In the Ikeda 2013 trial, the average zinc intake from the diet in both the intervention and control groups were the same (obtained from food frequency questionnaire method and was 7.9 mg/day). But there is no data available for the zinc intake from the diet in the Sakagami 2009 trial.
The results of the Mahajan 1980 trial were described as an improvement for each individual taste quality. The salt, sugar and bitter taste acuity (detection and recognition) significantly improved in the interventional group compared to the control group. Bitter taste quality improvement was similar in both groups. Eggert 1982 described the results as taste detection and taste recognition in children with chronic renal failure in a cross‐over trial. We took the results of taste recognition before the cross‐over to prevent the carryover effect (the trial did not have any washout period). In both of these trials, the data were derived from graphs.
Three trials included for meta‐analysis (Heckmann 2005; Ikeda 2013; Sakagami 2009) used different taste detection tests, and hence we calculated the standardised mean difference. The overall effect favoured zinc supplements marginally (95% CI 0.23 to 0.65, effect size 0.44). We calculated the mean difference for the Mahajan 1980 and Eggert 1982 studies.
Dichotomous data
See: Analysis 1.5
Only two trials (Mahajan 1982; Sakai 2002) described the results as dichotomous data. When this subgroup analysis was done, heterogeneity was high because of the different populations (idiopathic and zinc deficient taste disorder in the Sakai 2002 trial and taste disorder secondary to chronic renal failure in the Mahajan 1982 Mahajan's trial). Hence, we it was decided to analyse the results separately. A lack of events in the placebo group in the Mahajan 1982 trial resulted in a high upper limit in the CI (95% CI 1.65, to 379.57, effect size 25).
Point estimates of both trials favoured zinc supplements, but, we did not have enough trials to conduct a meta‐analysis and conclude the results for this outcome.
None of the trials comparing zinc to placebo tested for any improvement in taste discrimination.
Taste discrimination improvement ‐ acupuncture versus sham control
See: Analysis 2.1 and Summary of findings table 2 for the main comparison of acupuncture to sham for the management of taste disturbances.
Only one trial (Brandt 2008) tested taste discrimination using acupuncture and was at high risk of bias. We analysed this trial separately. Brandt 2008 tested taste discrimination using the filter paper strip method and results are described in means of filter paper strips. As we had only one trial using acupuncture, we considered that the evidence is insufficient to conclude if there is any difference between acupuncture and sham acupuncture with laser to improve taste discrimination.
Adverse events
See: Table 9, Table 10, Analysis 1.6 and Summary of findings table 1 for adverse events in trials comparing zinc with placebo for the management of taste disturbances.
| Outcome | Gp A – Zinc picolinate events | Gp A total | Gp B – Placebo Events | Gp B total | Time when measured |
| Adverse events | 6 | 37 | 0 | 36 | 3 months |
| Outcome | Gp A ‐ 17 mg Zinc events | Gp A total | Gp B – 34 mg zinc Events | Gp B total | Gp C – 68 mg zinc events | Gp C total | Gp D ‐ Placebo events | Gp D total | Time when measured |
| Side effects | 5 | 27 | 6 | 25 | 7 | 28 | 3 | 27 | 12 weeks |
Out of eight trials using zinc supplementation, four reported adverse events (Ikeda 2013; Sakagami 2009; Sakai 2002; Watson 1983). Ikeda 2013 reported one case of eczema. Sakai 2002 reported adverse events like nausea, abdominal pain and diarrhoea in 16% of patients. Watson 1983 reported nausea and vomiting in one patient after zinc intervention only (Table 9). Sakagami 2009 reported adverse events like stomach discomfort, abdominal distension, constipation, decrease in blood iron, increase in blood alkaline phosphatase and minor increase in blood triglycerides in all four groups of the study (Table 10). We did not include this trial in the analysis since it did not report any further details on number of events. The other four trials (Eggert 1982 ; Heckmann 2005; Mahajan 1980; Mahajan 1982) did not given any data on adverse events.
The acupuncture trial (Brandt 2008) did not give any data on adverse events in either group.
Health‐ related quality of life
We could not meta‐analyse any of the trials for health‐related quality of life due to taste disorders. Two trials (Brandt 2008; Heckmann 2005) have reported the mood scale and symptoms of depression improvements in the intervention group. Heckmann 2005 reported that the signs of depression in the zinc group were less severe (Beck Depression inventory, P < 0.05; mood scale, P <0.05) and these findings were independent of the actual levels of zinc in serum/saliva (Table 6). Brandt 2008 reported significant improvement in the psychological symptoms in the interventional group ‐ Acupuncture (Table 8).
Discussion
Summary of main results
The main objective of this review was to evaluate the efficacy of various interventions to improve taste acuity and taste discrimination. We included nine RCTs in our review. We assessed three trials (33.3%) as low risk of bias, four trials (44.5%) as high risk of bias, and two trials (22.2%) as unclear risk of bias.
Eight trials compared the efficacy of different zinc supplements for improvement of taste acuity, and one trial compared the efficacy of acupuncture for improvement of taste discrimination in dysgeusia patients. However, the Mahajan 1980 trial was not included in the 'Summary of findings' tables because each taste sensation was analysed, rather than overall taste acuity. We did not pool the first half of the cross‐over trial by Eggert 1982 because of the different study design and we did not include the Mahajan 1982 trial in the 'Summary of findings' tables due to the large CI. Based on the available data, we conducted a meta‐analysis for taste acuity and taste discrimination separately.
Out of seven trials that reported taste acuity as their outcome, two trials (Heckmann 2005; Sakai 2002) documented this as a patient reported outcome. We assessed the body of evidence for this comparison using GRADE (3.6 version) which incorporates risk of bias, the directness of the evidence, inconsistency of the results, the precision of the estimates, and the risk of publication bias (summary of findings Table for the main comparison). We assessed the evidence from these two trials, which included 119 patients, with a mean study period of three months. The quality of evidence assessed was 'very low' and was insufficient to conclude if there is any benefit of zinc supplementation for improvement in taste acuity.
Three trials (Heckmann 2005; Ikeda 2013; Sakagami 2009) described overall taste improvement (summary of findings Table for the main comparison). We used GRADE to assess the evidence from these three trials, which included 366 patients with a mean study period of three months. The quality of evidence assessed was 'moderate' and the robustness of the evidence for clinical validity was minimal (95% CI 0.23 to 0.65). We assessed one trial (Eggert 1982) as having 'very low' quality evidence for taste recognition improvement.
We assessed one trial (Sakai 2002) which described taste acuity improvement, separately due to heterogeneity in the population. The evidence assessed from this trial included 73 patients with a study period of three months. We assessed the quality of evidence as 'low' and further research may change the estimate.
Only one trial using acupuncture reported taste discrimination as the outcome (Brandt 2008). We assessed the evidence from this trial, which included 37 participants with a study period of eight weeks, as 'low' (summary of findings Table 2).
Overall completeness and applicability of evidence
We systematically searched for trials according to the methodology written in our protocol. We included all RCTs that fit the inclusion criteria in our review. All the included trials had patients with dysgeusia or hypogeusia. None of them reported phantogeusia, ageusia, parageusia or cacogeusia in their patients.
For taste acuity improvement, we included eight trials using zinc supplements in different forms. We included only one trial using acupuncture for taste discrimination improvement. None of the included zinc supplement trials in our review tested taste discrimination. Zinc supplement is the most commonly used intervention for taste disorders and our review highlights the usage of zinc in the majority of the included trials. Taste acuity and taste discrimination were our two primary outcomes. However, our included trials investigated either one or the other; we did not find any trial investigating both outcomes. Health‐related quality of life due to taste impairment is an important issue to be addressed. We only found two trials addressing health‐related quality of life due to taste disorders. We included in the analysis all trials that reported adverse events appropriately.
Trials which were not included in the meta‐analysis were explained in the results. We did not exclude any trial due to missing data. In a cross‐over trial (Eggert 1982) without a sufficient washout period and suspected carry‐over effect, we included data before the cross‐over.
This review has limited evidence on the primary outcomes of taste acuity and taste discrimination, and is not conclusive in demonstrating improvement in taste perception with zinc supplements or acupuncture. However, the review encourages further high quality RCTs with primary outcomes of taste acuity and taste discrimination using zinc supplements or acupuncture for taste disorder patients to derive definitive conclusions and recommendations.
Quality of the evidence
We included seven parallel and two cross‐over RCTs with 566 participants in this meta‐analysis. The quality of evidence is discussed for each outcome.
Taste acuity ‐ patient reported outcome
Of the two trials comparing zinc supplement and placebo that were suitable for pooling in this meta‐analysis for the outcome of patient reported taste acuity, we considered one to be at low risk of bias (Heckmann 2005) and one to be at high risk of bias (Sakai 2002). We downgraded the quality of evidence by one for each trial due to high attrition bias, imprecision and publication bias (summary of findings Table for the main comparison). The results, therefore, do not allow us to draw a robust conclusion regarding the patient reported outcome in taste acuity.
Both trials excluded dysgeusia/hypogeusia subjects secondary to systemic illnesses. However, Sakai 2002 included idiopathic dysgeusia and dysgeusia due to zinc deficiency. Neither of the trials mentioned dietary zinc which could have been a major confounder here. Future studies on zinc interventions in dysgeusia cases should standardise dietary zinc to clearly ascertain the role of zinc in the improvement of dysgeusia. Gender differences between these two trials (Heckmann 2005; Sakai 2002 ) could have been another confounder that should be considered.
Taste acuity ‐ objective outcome
We included seven trials in the meta‐analysis for this outcome. Three trials reported overall taste improvement, and we found the quality of evidence to be 'moderate'. One study (Mahajan 1980) presented the data in the forms of a graph for each taste sensation (salt, sweet, bitter, sour) and could not be grouped with the other three trials. Another study (Eggert 1982) showed better taste recognition improvement in the zinc group among chronic renal failure patients and presented the data in the form of a graph. Due to clinical heterogeneity, we did not include this study in the meta‐analysis. However, we assessed this study separately as 'very low' quality of evidence.
One trial (Sakai 2002) reported the objective outcome for taste acuity in the form of dichotomous data and we graded this separately due to clinical heterogeneity. The results showed 'low' quality of evidence for taste acuity improvement (summary of findings Table for the main comparison).
Adverse events
We included only three trials in the meta‐analysis which reported adverse events in the zinc supplement group. The reported adverse events were either gastrointestinal or dermatological. The results were of 'low' quality and therefore do not allow us to draw a strong conclusion regarding the prediction of adverse events related to zinc supplementation (summary of findings Table for the main comparison). No adverse events were reported in the acupuncture trial.
Taste discrimination
We included only one trial (Brandt 2008) for the outcome of taste discrimination, and we assessed the quality of evidence as 'low' (summary of findings Table 2). The results therefore do not allow us to draw a robust conclusion regarding taste discrimination using acupuncture.
Potential biases in the review process
We have taken steps to minimise bias in every step of the review. We searched all the above mentioned databases, conference proceedings, and trial registries to include all relevant reports. We included foreign language reports and alternative medicine reports in our review. We tried to contact trial authors for missing data through emails. If the reports were very old, we tried to get the contact details of the authors through peer contacts, Google search and university/hospital web sites where they were previously affiliated. Nevertheless, there could be unpublished data which we could not trace with the above methods.
Two review authors independently reviewed data extraction forms obtained from translators and cross‐checked doubtful areas using the Google translator. We tried our best to follow the methodology stated in the protocol. However, post‐hoc changes in the inclusion criteria could have introduced some bias in our review.
Agreements and disagreements with other studies or reviews
We could find only one systematic review on dysgeusia associated with cancer therapies (Hovan 2010). The purpose of this review was to select relevant scientific papers written since 1989, which focused on the prevalence and management of dysgeusia as an oral side effect of cancer treatment. The literature search in the review was limited to English language papers published between 1990 and 2008. A total of 30 papers were reviewed; the results of 26 of these papers were included in the present systematic review. The study authors concluded that from the current literature, there does not appear to be a predictable way of preventing or treating dysgeusia.
In our review, we excluded prevention studies and included idiopathic dysgeusia/hypogeusia and dysgeusia/hypogeusia secondary to renal failure. The difference in opinion could be due to these reasons.
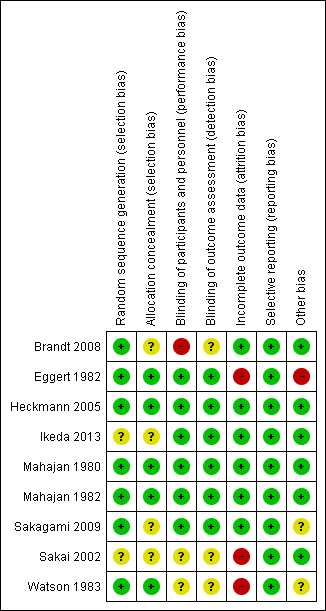
Risk of bias summary: review authors' judgements about each risk of bias item for each included study.

Study flow diagram.
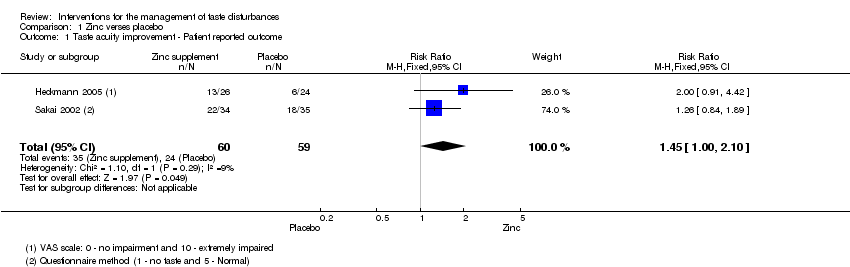
Comparison 1 Zinc verses placebo, Outcome 1 Taste acuity improvement ‐ Patient reported outcome.
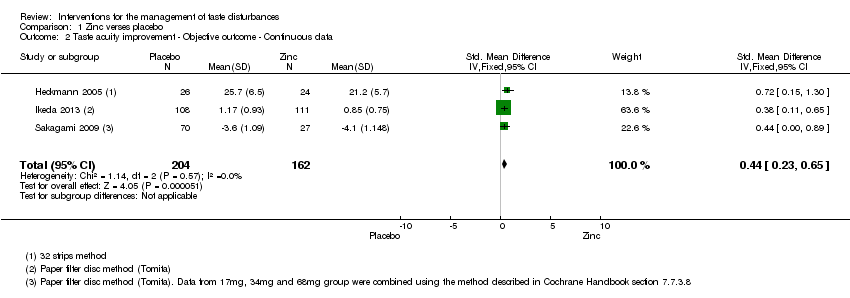
Comparison 1 Zinc verses placebo, Outcome 2 Taste acuity improvement ‐ Objective outcome ‐ Continuous data.
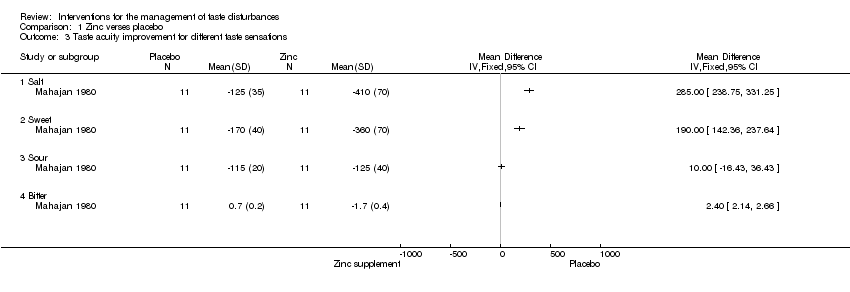
Comparison 1 Zinc verses placebo, Outcome 3 Taste acuity improvement for different taste sensations.

Comparison 1 Zinc verses placebo, Outcome 4 Cross‐over study.

Comparison 1 Zinc verses placebo, Outcome 5 Taste acuity improvement ‐ Objective outcome ‐ Dichotomous.
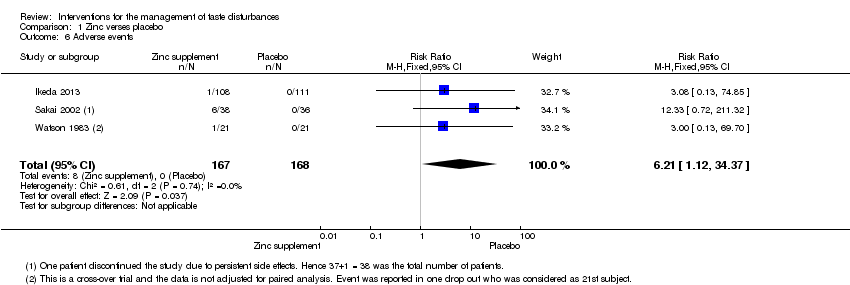
Comparison 1 Zinc verses placebo, Outcome 6 Adverse events.
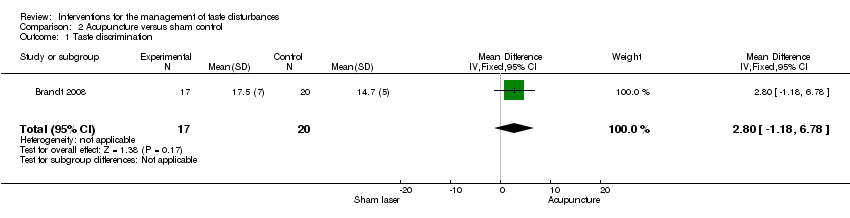
Comparison 2 Acupuncture versus sham control, Outcome 1 Taste discrimination.
| Zinc compared to placebo for the management of taste disturbances | ||||||
| Patient or population: patients with taste disturbances | ||||||
| Outcomes | Illustrative comparative risks* (95% CI) | Relative effect | No of Participants | Quality of the evidence | Comments | |
| Assumed risk | Corresponding risk | |||||
| Placebo | Zinc | |||||
| Taste acuity improvement ‐ Patient reported outcome | Study population | RR 1.45 | 119 | ⊕⊝⊝⊝ | ─ | |
| ˗407 per 1000 | 590 per 1000 | |||||
| Moderate | ||||||
| 382 per 1000 | 554 per 1000 | |||||
| Taste acuity improvement ‐ Objective outcome ‐ Continuous ‐ Overall taste improvement | ─ | The mean taste acuity improvement ‐ objective outcome ‐ continuous ‐ overall taste improvement in the intervention groups was | ─ | 366 | ⊕⊕⊕⊝ | SMD 0.44 (0.23 to 0.65) |
| Taste acuity improvement ‐ Objective outcome ‐ Continuous ‐ Taste recognition | — | The mean taste acuity improvement ‐ objective outcome ‐ continuous ‐ taste recognition in the intervention groups was | ─ | 14 | ⊕⊝⊝⊝ | Standardised mean difference (SMD) 1.26 (0.07 to 2.44) |
| Taste acuity improvement ‐ Objective outcome ‐ Dichotomous ‐ Idiopathic and zinc deficient taste disorders | Study population | RR 1.7 | 73 | ⊕⊕⊝⊝ | ─ | |
| ─444 per 1000 | 756 per 1000 | |||||
| Moderate | ||||||
| 444 per 1000 | 755 per 1000 | |||||
| Adverse events | Study population7 | RR 6.21 | 335 | ─ | ─ | |
| 1 per 1000 | 6 per 1000 | |||||
| Moderate | ||||||
| *The basis for the assumed risk (e.g. the median control group risk across studies) is provided in footnotes. The corresponding risk (and its 95% confidence interval) is based on the assumed risk in the comparison group and the relative effect of the intervention (and its 95% CI). | ||||||
| GRADE Working Group grades of evidence | ||||||
| 1 Risk of bias: unclear randomisation and blinding and high risk of bias due to attrition in Sakai 2002. Downgraded by 1 level. 7Risk of one per 1000 assumed in placebo group (as it was zero). 8Sakagami 2009 was not included in the grading of evidence as the number of patients reporting adverse events was not reported. | ||||||
| Acupuncture compared to sham control for patients with taste disturbances | ||||||
| Patient or population: patients with taste disturbances | ||||||
| Outcomes | Illustrative comparative risks* (95% CI) | Relative effect | No of Participants | Quality of the evidence | Comments | |
| Assumed risk | Corresponding risk | |||||
| Sham control | Acupuncture | |||||
| Taste discrimination | ─ | The mean taste discrimination in the intervention groups was | ─ | 37 | ⊕⊕⊝⊝ | ─ |
| *The basis for the assumed risk (e.g. the median control group risk across studies) is provided in footnotes. The corresponding risk (and its 95% confidence interval) is based on the assumed risk in the comparison group and the relative effect of the intervention (and its 95% CI). | ||||||
| GRADE Working Group grades of evidence | ||||||
| 1 Single‐blinded study. | ||||||
| Outcome | Gp A | Gp B | Time when measured | ||||
| Mean* | S.D. | n= | Mean* | S.D. | n= | ||
| Change of the mean 4 basic taste sensitivity scores from baseline | ‐0.52 | 0.68 | 108 | ‐0.47 | 0.61 | 111 | 4 weeks |
| ‐0.90 | 0.85 | 108 | ‐0.67 | 0.73 | 111 | 8 weeks | |
| ‐1.17 | 0.93 | 108 | ‐0.85 | 0.75 | 111 | 12 weeks | |
| ‐1.28 | 0.94 | 108 | ‐0.97 | 0.76 | 111 | 4 weeks after treatment | |
| *Minus change score means better by filter paper disc method by Tomita | |||||||
| Outcome | Gp A events (Improved) | Gp A total | Gp B events | Gp B total | Time when measured |
| Improved/not improved | 60 | 108 | 48 | 111 | 12 weeks |
| Outcome | Gp A (Placebo) N = 27 | Gp B (17 mg zinc) N = 27 | Gp C (34 mg zinc) N = 25 | Gp D (68 mg zinc) N = 28 | Time when measured | ||||
| Secondary outcome | Mean | Std Dev | Mean | Std Dev | Mean | Std Dev | Mean | Std Dev | 12 weeks |
| Mean filter paper disk test scores (filter paper disk) | 4.095 | 1.148 | 4.350 | 1.030 | 3.448 | 0.928 | 3.454 | 1.138 | ─ |
| Mean serum zinc level | 1.8 | 12.7 | 5.7 | 13.5 | 11.4 | 16.6 | 20.6 | 21.3 | ─ |
| Gp A | Gp B | Gp C | Gp D | ─ | |||||
| Increase in the average score of subjective symptoms | 0.6 | 0.9 | 1.2 | 1.0 | ─ | ||||
| Primary outcome: quantitative analysis of taste perception using filter paper disk method | Event (success) Cured + improved | No event (fail) Unchanged, neither cured nor improved nor worsened; aggravated | Total |
| Experimental intervention (17 mg Zinc) | SE= 14 | FE= 13 | NE= 27 |
| Control intervention (Placebo) | SC= 17 | FC= 10 | NC= 27 |
| RR = 0.824; OR = 0.634; RD = 0.447 | |||
| Experimental intervention (34 mg Zinc) | SE= 20 | FE= 5 | NE= 25 |
| Control intervention (Placebo) | SC= 17 | FC= 10 | NC= 27 |
| RR = 0.318; OR = 2.353; RD = 0.17 | |||
| Experimental intervention (68 mg Zinc) | SE= 25 | FE= 3 | NE= 28 |
| Control intervention (Placebo) | SC= 17 | FC= 10 | NC= 27 |
| RR = 1.418; OR = 4.902; RD = 0.263 | |||
| RR = risk ratio: risk of event in experimental group/risk of event in control group. OR = odds ratio: odds of event in experimental group/ odds of event in control group. RD = risk difference: risk of event in experimental group – risk of event in control group. | |||
| Filter paper disk method | Event (success) Improved (+cured) | No event (fail) Unchanged | Total (N = 73) |
| Experimental intervention (Zinc picolinate) | SE= 28 | FE= 9 | NE= 37 |
| Control intervention (Placebo) | SC= 16 | FC= 20 | NC= 36 |
| RR = 1.703; OR = 3.889; RD = 0.312 | |||
| Experimental intervention (Zinc picolinate) | SE= 22 | FE= 12 | NE= 34 |
| Control intervention (Placebo) | SC= 18 | FC= 17 | NC= 35 |
| RR = 1.258 ; OR = 1.732; RD = 0.133 | |||
| RR = risk ratio: risk of event in experimental group/risk of event in control group. OR = odds ratio: odds of event in experimental group/ odds of event in control group. RD = risk difference: risk of event in experimental group – risk of event in control group. | |||
| Outcome | Gp A (Zinc treatment) | Gp B (Placebo) | Time when measured | ||||
| Mean | Std Dev | N= | Mean | Std Dev | N= | At the end of 3 months | |
| Primary outcome | ─ | ||||||
| Taste test (32 filter paper strip method by Muller et al 2003) | 25.7 | 6.5 | 26 | 21.2 | 5.7 | 24 | ─ |
| Self rated impairment in % (VAS scale of 10 cm length equivalent to 100%; 0 to 10. 0 = no impairment and 10 = extremely impaired) | 45.0 | 4.4 | 26 | 43.8 | 3.6 | 24 | ─ |
| Secondary outcome | ─ | ||||||
| Beck Depression Inventory (BDI) | 7.5 | 7.0 | 26 | 11.3 | 10.9 | 24 | ─ |
| von Zersen Mood Scale (ZMS) | 10.7 | 7.5 | 26 | 18.8 | 14.6 | 24 | ─ |
| Zinc in serum (microgram/dL) | 81.53 | 19.61 | 26 | 72.01 | 10.22 | 24 | ─ |
| Type of Intervention | Event (success) Improved | No event (fail) | Total |
| Experimental intervention (Zinc) | SE= 13 | FE= 13 | NE= 26 |
| Control intervention | SC= 6 | FC= 18 | NC= 24 |
| RR = 2; OR = 3; RD = 0.25 | |||
| RR = risk ratio: risk of event in experimental group/risk of event in control group. OR = odds ratio: odds of event in experimental group/ odds of event in control group. RD = risk difference: risk of event in experimental group – risk of event in control group. | |||
| Outcome | Gp A | Gp B | Time when measured | ||||||
| Mean | Std Dev* | N=17 | Mean | Std Dev* | N=20 | ||||
| Taste discrimination | 11.7 (before)/ 17.5 (after) | 4 (before)/ | ─ | 11.9 (before)/ 14.7(after) | 5 (before)/ | ─ | Before and after treatment | ||
| Quality of life | Not estimable (changes per group only given for each of the 5 individual questions of the questionnaire, but no combined score/analysis stated) Only information given: ‘both treatments resulted in an increased quality of life, however, no statistically significant difference could be found’ | Before and after treatment | |||||||
| Depressive symptoms | 11 (before)/ 6 (after)* | 5 (before) / 4 (after)* | ─ | 10,5 (before)/ 10 (after)* | 7 (before)/ 7 (after)* | ─ | Before and after treatment | ||
| “The psychological well‐being of the intervention groups increased for 94,1% of all patients in the intervention group, but only for 60% of patients in the control group. This difference was statistically significant” | |||||||||
| Subjective well‐being | 16 (before)/ 12 (after)* | 10 (before)/ 7 (after)* | ─ | 20 (before)/ 18 (after)* | 9 (before)/ 14 (after)* | ─ | Before and after treatment | ||
| “58.8% of all patients in the intervention group felt better, whereas only 45% of all patients in the control group felt better. This difference was not statistically significant” | |||||||||
| *Only given in graph ‐> estimated from graph | |||||||||
| Outcome | Gp A – Zinc picolinate events | Gp A total | Gp B – Placebo Events | Gp B total | Time when measured |
| Adverse events | 6 | 37 | 0 | 36 | 3 months |
| Outcome | Gp A ‐ 17 mg Zinc events | Gp A total | Gp B – 34 mg zinc Events | Gp B total | Gp C – 68 mg zinc events | Gp C total | Gp D ‐ Placebo events | Gp D total | Time when measured |
| Side effects | 5 | 27 | 6 | 25 | 7 | 28 | 3 | 27 | 12 weeks |
| Outcome or subgroup title | No. of studies | No. of participants | Statistical method | Effect size |
| 1 Taste acuity improvement ‐ Patient reported outcome Show forest plot | 2 | 119 | Risk Ratio (M‐H, Fixed, 95% CI) | 1.45 [1.00, 2.10] |
| 2 Taste acuity improvement ‐ Objective outcome ‐ Continuous data Show forest plot | 3 | 366 | Std. Mean Difference (IV, Fixed, 95% CI) | 0.44 [0.23, 0.65] |
| 3 Taste acuity improvement for different taste sensations Show forest plot | 1 | Mean Difference (IV, Fixed, 95% CI) | Totals not selected | |
| 3.1 Salt | 1 | Mean Difference (IV, Fixed, 95% CI) | 0.0 [0.0, 0.0] | |
| 3.2 Sweet | 1 | Mean Difference (IV, Fixed, 95% CI) | 0.0 [0.0, 0.0] | |
| 3.3 Sour | 1 | Mean Difference (IV, Fixed, 95% CI) | 0.0 [0.0, 0.0] | |
| 3.4 Bitter | 1 | Mean Difference (IV, Fixed, 95% CI) | 0.0 [0.0, 0.0] | |
| 4 Cross‐over study Show forest plot | 1 | 14 | Mean Difference (IV, Fixed, 95% CI) | 3.00 [0.66, 5.34] |
| 5 Taste acuity improvement ‐ Objective outcome ‐ Dichotomous Show forest plot | 2 | Risk Ratio (M‐H, Fixed, 95% CI) | Subtotals only | |
| 5.1 Idiopathic and zinc deficient taste disorders | 1 | 73 | Risk Ratio (M‐H, Fixed, 95% CI) | 1.70 [1.13, 2.56] |
| 5.2 Taste disorder secondary to chronic renal failure | 1 | 24 | Risk Ratio (M‐H, Fixed, 95% CI) | 25.0 [1.65, 379.57] |
| 6 Adverse events Show forest plot | 3 | 335 | Risk Ratio (M‐H, Fixed, 95% CI) | 6.21 [1.12, 34.37] |
| Outcome or subgroup title | No. of studies | No. of participants | Statistical method | Effect size |
| 1 Taste discrimination Show forest plot | 1 | 37 | Mean Difference (IV, Fixed, 95% CI) | 2.80 [‐1.18, 6.78] |