Intervencije za liječenje poremećaja osjeta okusa
Appendices
Appendix 1. MEDLINE (OVID) search strategy
-
exp Taste disorders/
-
Taste perception/
-
(ageusia$ or hypogeusia$ or dysgeusia$ or parageusia$).mp.
-
(taste adj3 (distort$ or dysfunction$ or disorder$ or alter$ or change$ or abnormal$ or blind$)).mp.
-
(gustatory adj3 (perception$ or sensitive$ or distort$)).mp.
-
or/1‐5
The above subject search was linked to the Cochrane Highly Sensitive Search Strategy (CHSSS) for identifying randomised trials in MEDLINE: sensitivity maximising version (2008 revision) as referenced in Chapter 6.4.11.1 and detailed in box 6.4.c of the Cochrane Handbook for Systematic Reviews of Interventions Version 5.1.0 [updated March 2011] (Higgins 2011).
1. randomized controlled trial.pt.
2. controlled clinical trial.pt.
3. randomized.ab.
4. placebo.ab.
5. drug therapy.fs.
6. randomly.ab.
7. trial.ab.
8. groups.ab.
9. or/1‐8
10. exp animals/ not humans.sh.
11. 9 not 10
Appendix 2. Cochrane Oral Health Group Trials Register Search Strategy
#1 ((ageusi* or hypogeusi* or dysgeusi* or parageusi*):ti,ab) AND (INREGISTER)
#2 ((taste and (distort* or dysfunction* or disorder* or alter* or change* or abnormal* or blind*)):ti,ab) AND (INREGISTER)
#3 ((gustatory and (perception* or sensitiv* or distort*)):ti,ab) AND (INREGISTER)
#4 (#1 or #2 or #3) AND (INREGISTER)
Appendix 3. Cochrane Central Register of Controlled Trials (CENTRAL) Search Strategy
#1 [mh "Taste disorders"]
#2 [mh ^"Taste perception"]
#3 (ageusi* or hypogeusi* or dysgeusi* or parageusi*)
#4 (taste near/3 (distort* or dysfunction* or disorder* or alter* or change* or abnormal* or blind*))
#5 (gustatory near/3 (perception* or sensitiv* or distort*))
#6 #1 or #2 or #3 or #4 or #5
Appendix 4. EMBASE (OVID) Search Strategy
1. Taste disorder/
2. (ageusi$ or hypogeusi$ or dysgeusi$ or parageusi$).mp.
3. (taste adj3 (distort$ or dysfunction$ or disorder$ or alter$ or change$ or abnormal$ or blind$)).mp.
4. (gustatory adj3 (perception$ or sensitiv$ or distort$)).mp.
5. or/1‐4
The above subject search was linked to the Cochrane Oral Health Group filter for identifying RCTs in EMBASE via OVID:
1. random$.ti,ab.
2. factorial$.ti,ab.
3. (cross‐over$ or cross‐over$ or cross‐over$).ti,ab.
4. placebo$.ti,ab.
5. (doubl$ adj blind$).ti,ab.
6. (singl$ adj blind$).ti,ab.
7. assign$.ti,ab.
8. allocat$.ti,ab.
9. volunteer$.ti,ab.
10. CROSS‐OVER PROCEDURE.sh.
11. DOUBLE‐BLIND PROCEDURE.sh.
12. RANDOMIZED CONTROLLED TRIAL.sh.
13. SINGLE BLIND PROCEDURE.sh.
14. or/1‐13
15. (exp animal/ or animal.hw. or nonhuman/) not (exp human/ or human cell/ or (human or humans).ti.)
16. 14 NOT 15
Appendix 5. CINAHL (EBSCO) Search Strategy
S1 (MH "Taste disorders+")
S2 TI ( (ageusi* or hypogeusi* or dysgeusi* or parageusi*) ) OR AB ( (ageusi* or hypogeusi* or dysgeusi* or parageusi*))
S3 TI ( (taste N3 (distort* or dysfunction* or disorder* or alter* or change* or abnormal* or blind*)) ) OR AB ( (taste N3 (distort* or dysfunction* or disorder* or alter* or change* or abnormal* or blind*)))
S4 TI ( (gustatory N3 (perception* or sensitiv* or distort*)) ) OR AB ( (gustatory N3 (perception* or sensitiv* or distort*)))
S5 S1 or S2 or S3 or S4
The above subject search was linked to the Cochrane Oral Health Group filter for identifying RCTs in CINAHL via EBSCO:
S1 MH Random Assignment or MH Single‐blind Studies or MH Double‐blind Studies or MH Triple‐blind Studies or MH Cross‐over design or MH Factorial Design
S2 TI ("multicentre study" or "multicenter study" or "multi‐centre study" or "multi‐center study") or AB ("multicentre study" or "multicenter study" or "multi‐centre study" or "multi‐center study") or SU ("multicentre study" or "multicenter study" or "multi‐centre study" or "multi‐center study")
S3 TI random* or AB random*
S4 AB "latin square" or TI "latin square"
S5 TI (crossover or cross‐over) or AB (crossover or cross‐over) or SU (crossover or cross‐over)
S6 MH Placebos
S7 AB (singl* or doubl* or trebl* or tripl*) or TI (singl* or doubl* or trebl* or tripl*)
S8 TI blind* or AB mask* or AB blind* or TI mask*
S9 S7 and S8
S10 TI Placebo* or AB Placebo* or SU Placebo*
S11 MH Clinical Trials
S12 TI (Clinical AND Trial) or AB (Clinical AND Trial) or SU (Clinical AND Trial)
S13 S1 or S2 or S3 or S4 or S5 or S6 or S9 or S10 or S11 or S12
Appendix 6. AMED (OVID) Search Strategy
1. Taste disorders/
2. (ageusi$ or hypogeusi$ or dysgeusi$ or parageusi$).mp.
3. (taste adj3 (distort$ or dysfunction$ or disorder$ or alter$ or change$ or abnormal$ or blind$)).mp.
4. (gustatory adj3 (perception$ or sensitiv$ or distort$)).mp.
5. or/1‐4
Appendix 7. US National Institutes of Health Trials Registry Search Strategy
Condition = Taste disorder
Condition = Taste disturbance
Appendix 8. metaRegister of Controlled Trials Search Strategy
taste AND disorder
taste AND disturbance
Appendix 9. WHO International Clinical Trials Registry Search Strategy
taste disorder
taste disturbance
Appendix 10. International Federation of Pharmaceutical Manufacturers & Associations (IFPMA) Clinical Trials Portal Search Strategy
taste disorder
taste disturbance
Appendix 11. International Association of Dental Research (IADR) Conference Abstracts
taste disorder
dysgeusia
Appendix 12. Association for the Research in Otolaryngology Conference Proceedings
taste disorder
dysgeusia
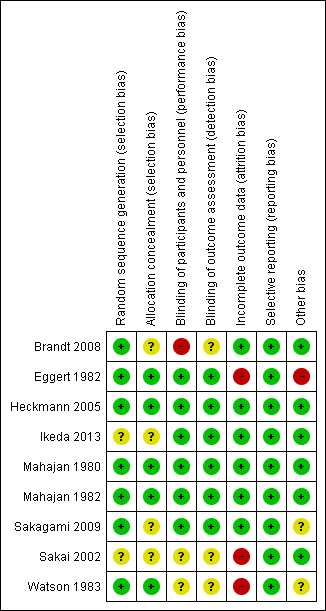
Risk of bias summary: review authors' judgements about each risk of bias item for each included study.

Study flow diagram.
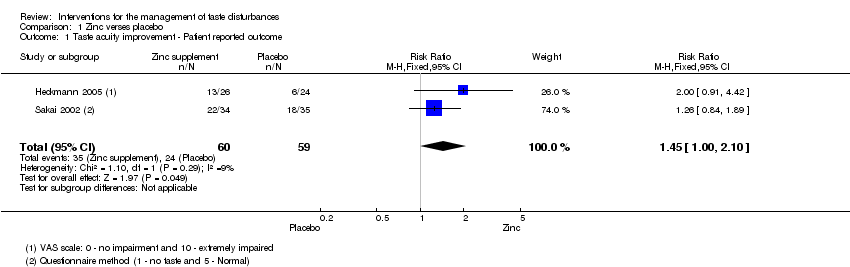
Comparison 1 Zinc verses placebo, Outcome 1 Taste acuity improvement ‐ Patient reported outcome.
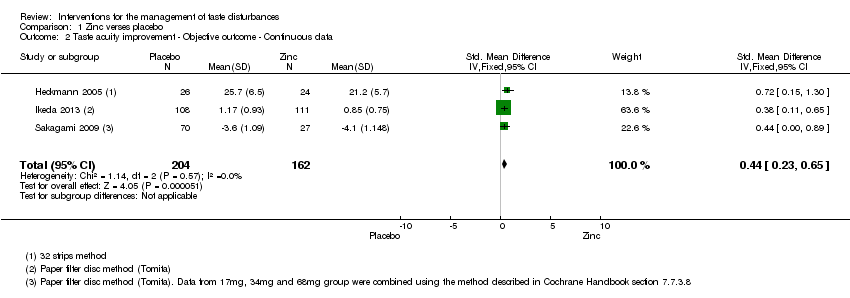
Comparison 1 Zinc verses placebo, Outcome 2 Taste acuity improvement ‐ Objective outcome ‐ Continuous data.
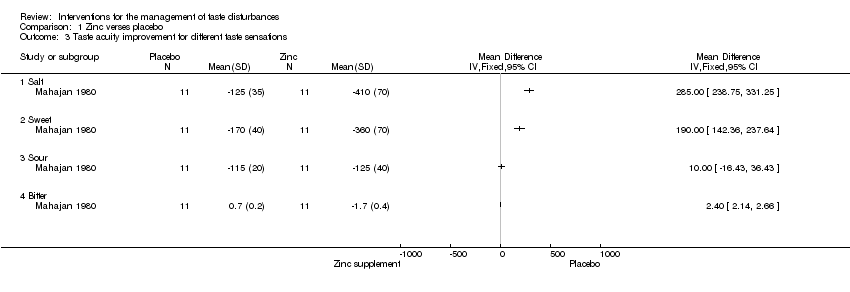
Comparison 1 Zinc verses placebo, Outcome 3 Taste acuity improvement for different taste sensations.

Comparison 1 Zinc verses placebo, Outcome 4 Cross‐over study.

Comparison 1 Zinc verses placebo, Outcome 5 Taste acuity improvement ‐ Objective outcome ‐ Dichotomous.
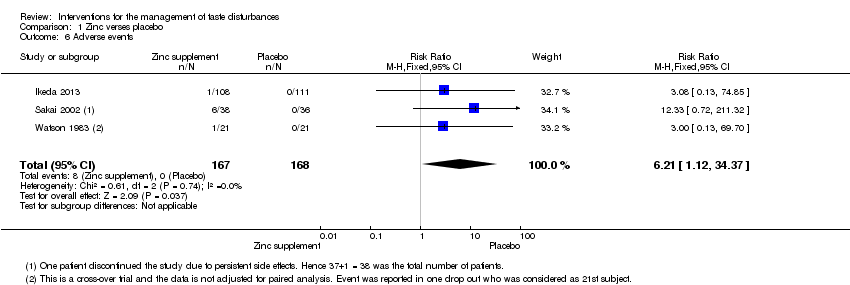
Comparison 1 Zinc verses placebo, Outcome 6 Adverse events.
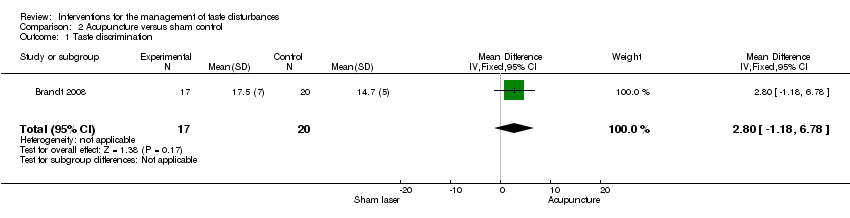
Comparison 2 Acupuncture versus sham control, Outcome 1 Taste discrimination.
| Zinc compared to placebo for the management of taste disturbances | ||||||
| Patient or population: patients with taste disturbances | ||||||
| Outcomes | Illustrative comparative risks* (95% CI) | Relative effect | No of Participants | Quality of the evidence | Comments | |
| Assumed risk | Corresponding risk | |||||
| Placebo | Zinc | |||||
| Taste acuity improvement ‐ Patient reported outcome | Study population | RR 1.45 | 119 | ⊕⊝⊝⊝ | ─ | |
| ˗407 per 1000 | 590 per 1000 | |||||
| Moderate | ||||||
| 382 per 1000 | 554 per 1000 | |||||
| Taste acuity improvement ‐ Objective outcome ‐ Continuous ‐ Overall taste improvement | ─ | The mean taste acuity improvement ‐ objective outcome ‐ continuous ‐ overall taste improvement in the intervention groups was | ─ | 366 | ⊕⊕⊕⊝ | SMD 0.44 (0.23 to 0.65) |
| Taste acuity improvement ‐ Objective outcome ‐ Continuous ‐ Taste recognition | — | The mean taste acuity improvement ‐ objective outcome ‐ continuous ‐ taste recognition in the intervention groups was | ─ | 14 | ⊕⊝⊝⊝ | Standardised mean difference (SMD) 1.26 (0.07 to 2.44) |
| Taste acuity improvement ‐ Objective outcome ‐ Dichotomous ‐ Idiopathic and zinc deficient taste disorders | Study population | RR 1.7 | 73 | ⊕⊕⊝⊝ | ─ | |
| ─444 per 1000 | 756 per 1000 | |||||
| Moderate | ||||||
| 444 per 1000 | 755 per 1000 | |||||
| Adverse events | Study population7 | RR 6.21 | 335 | ─ | ─ | |
| 1 per 1000 | 6 per 1000 | |||||
| Moderate | ||||||
| *The basis for the assumed risk (e.g. the median control group risk across studies) is provided in footnotes. The corresponding risk (and its 95% confidence interval) is based on the assumed risk in the comparison group and the relative effect of the intervention (and its 95% CI). | ||||||
| GRADE Working Group grades of evidence | ||||||
| 1 Risk of bias: unclear randomisation and blinding and high risk of bias due to attrition in Sakai 2002. Downgraded by 1 level. 7Risk of one per 1000 assumed in placebo group (as it was zero). 8Sakagami 2009 was not included in the grading of evidence as the number of patients reporting adverse events was not reported. | ||||||
| Acupuncture compared to sham control for patients with taste disturbances | ||||||
| Patient or population: patients with taste disturbances | ||||||
| Outcomes | Illustrative comparative risks* (95% CI) | Relative effect | No of Participants | Quality of the evidence | Comments | |
| Assumed risk | Corresponding risk | |||||
| Sham control | Acupuncture | |||||
| Taste discrimination | ─ | The mean taste discrimination in the intervention groups was | ─ | 37 | ⊕⊕⊝⊝ | ─ |
| *The basis for the assumed risk (e.g. the median control group risk across studies) is provided in footnotes. The corresponding risk (and its 95% confidence interval) is based on the assumed risk in the comparison group and the relative effect of the intervention (and its 95% CI). | ||||||
| GRADE Working Group grades of evidence | ||||||
| 1 Single‐blinded study. | ||||||
| Outcome | Gp A | Gp B | Time when measured | ||||
| Mean* | S.D. | n= | Mean* | S.D. | n= | ||
| Change of the mean 4 basic taste sensitivity scores from baseline | ‐0.52 | 0.68 | 108 | ‐0.47 | 0.61 | 111 | 4 weeks |
| ‐0.90 | 0.85 | 108 | ‐0.67 | 0.73 | 111 | 8 weeks | |
| ‐1.17 | 0.93 | 108 | ‐0.85 | 0.75 | 111 | 12 weeks | |
| ‐1.28 | 0.94 | 108 | ‐0.97 | 0.76 | 111 | 4 weeks after treatment | |
| *Minus change score means better by filter paper disc method by Tomita | |||||||
| Outcome | Gp A events (Improved) | Gp A total | Gp B events | Gp B total | Time when measured |
| Improved/not improved | 60 | 108 | 48 | 111 | 12 weeks |
| Outcome | Gp A (Placebo) N = 27 | Gp B (17 mg zinc) N = 27 | Gp C (34 mg zinc) N = 25 | Gp D (68 mg zinc) N = 28 | Time when measured | ||||
| Secondary outcome | Mean | Std Dev | Mean | Std Dev | Mean | Std Dev | Mean | Std Dev | 12 weeks |
| Mean filter paper disk test scores (filter paper disk) | 4.095 | 1.148 | 4.350 | 1.030 | 3.448 | 0.928 | 3.454 | 1.138 | ─ |
| Mean serum zinc level | 1.8 | 12.7 | 5.7 | 13.5 | 11.4 | 16.6 | 20.6 | 21.3 | ─ |
| Gp A | Gp B | Gp C | Gp D | ─ | |||||
| Increase in the average score of subjective symptoms | 0.6 | 0.9 | 1.2 | 1.0 | ─ | ||||
| Primary outcome: quantitative analysis of taste perception using filter paper disk method | Event (success) Cured + improved | No event (fail) Unchanged, neither cured nor improved nor worsened; aggravated | Total |
| Experimental intervention (17 mg Zinc) | SE= 14 | FE= 13 | NE= 27 |
| Control intervention (Placebo) | SC= 17 | FC= 10 | NC= 27 |
| RR = 0.824; OR = 0.634; RD = 0.447 | |||
| Experimental intervention (34 mg Zinc) | SE= 20 | FE= 5 | NE= 25 |
| Control intervention (Placebo) | SC= 17 | FC= 10 | NC= 27 |
| RR = 0.318; OR = 2.353; RD = 0.17 | |||
| Experimental intervention (68 mg Zinc) | SE= 25 | FE= 3 | NE= 28 |
| Control intervention (Placebo) | SC= 17 | FC= 10 | NC= 27 |
| RR = 1.418; OR = 4.902; RD = 0.263 | |||
| RR = risk ratio: risk of event in experimental group/risk of event in control group. OR = odds ratio: odds of event in experimental group/ odds of event in control group. RD = risk difference: risk of event in experimental group – risk of event in control group. | |||
| Filter paper disk method | Event (success) Improved (+cured) | No event (fail) Unchanged | Total (N = 73) |
| Experimental intervention (Zinc picolinate) | SE= 28 | FE= 9 | NE= 37 |
| Control intervention (Placebo) | SC= 16 | FC= 20 | NC= 36 |
| RR = 1.703; OR = 3.889; RD = 0.312 | |||
| Experimental intervention (Zinc picolinate) | SE= 22 | FE= 12 | NE= 34 |
| Control intervention (Placebo) | SC= 18 | FC= 17 | NC= 35 |
| RR = 1.258 ; OR = 1.732; RD = 0.133 | |||
| RR = risk ratio: risk of event in experimental group/risk of event in control group. OR = odds ratio: odds of event in experimental group/ odds of event in control group. RD = risk difference: risk of event in experimental group – risk of event in control group. | |||
| Outcome | Gp A (Zinc treatment) | Gp B (Placebo) | Time when measured | ||||
| Mean | Std Dev | N= | Mean | Std Dev | N= | At the end of 3 months | |
| Primary outcome | ─ | ||||||
| Taste test (32 filter paper strip method by Muller et al 2003) | 25.7 | 6.5 | 26 | 21.2 | 5.7 | 24 | ─ |
| Self rated impairment in % (VAS scale of 10 cm length equivalent to 100%; 0 to 10. 0 = no impairment and 10 = extremely impaired) | 45.0 | 4.4 | 26 | 43.8 | 3.6 | 24 | ─ |
| Secondary outcome | ─ | ||||||
| Beck Depression Inventory (BDI) | 7.5 | 7.0 | 26 | 11.3 | 10.9 | 24 | ─ |
| von Zersen Mood Scale (ZMS) | 10.7 | 7.5 | 26 | 18.8 | 14.6 | 24 | ─ |
| Zinc in serum (microgram/dL) | 81.53 | 19.61 | 26 | 72.01 | 10.22 | 24 | ─ |
| Type of Intervention | Event (success) Improved | No event (fail) | Total |
| Experimental intervention (Zinc) | SE= 13 | FE= 13 | NE= 26 |
| Control intervention | SC= 6 | FC= 18 | NC= 24 |
| RR = 2; OR = 3; RD = 0.25 | |||
| RR = risk ratio: risk of event in experimental group/risk of event in control group. OR = odds ratio: odds of event in experimental group/ odds of event in control group. RD = risk difference: risk of event in experimental group – risk of event in control group. | |||
| Outcome | Gp A | Gp B | Time when measured | ||||||
| Mean | Std Dev* | N=17 | Mean | Std Dev* | N=20 | ||||
| Taste discrimination | 11.7 (before)/ 17.5 (after) | 4 (before)/ | ─ | 11.9 (before)/ 14.7(after) | 5 (before)/ | ─ | Before and after treatment | ||
| Quality of life | Not estimable (changes per group only given for each of the 5 individual questions of the questionnaire, but no combined score/analysis stated) Only information given: ‘both treatments resulted in an increased quality of life, however, no statistically significant difference could be found’ | Before and after treatment | |||||||
| Depressive symptoms | 11 (before)/ 6 (after)* | 5 (before) / 4 (after)* | ─ | 10,5 (before)/ 10 (after)* | 7 (before)/ 7 (after)* | ─ | Before and after treatment | ||
| “The psychological well‐being of the intervention groups increased for 94,1% of all patients in the intervention group, but only for 60% of patients in the control group. This difference was statistically significant” | |||||||||
| Subjective well‐being | 16 (before)/ 12 (after)* | 10 (before)/ 7 (after)* | ─ | 20 (before)/ 18 (after)* | 9 (before)/ 14 (after)* | ─ | Before and after treatment | ||
| “58.8% of all patients in the intervention group felt better, whereas only 45% of all patients in the control group felt better. This difference was not statistically significant” | |||||||||
| *Only given in graph ‐> estimated from graph | |||||||||
| Outcome | Gp A – Zinc picolinate events | Gp A total | Gp B – Placebo Events | Gp B total | Time when measured |
| Adverse events | 6 | 37 | 0 | 36 | 3 months |
| Outcome | Gp A ‐ 17 mg Zinc events | Gp A total | Gp B – 34 mg zinc Events | Gp B total | Gp C – 68 mg zinc events | Gp C total | Gp D ‐ Placebo events | Gp D total | Time when measured |
| Side effects | 5 | 27 | 6 | 25 | 7 | 28 | 3 | 27 | 12 weeks |
| Outcome or subgroup title | No. of studies | No. of participants | Statistical method | Effect size |
| 1 Taste acuity improvement ‐ Patient reported outcome Show forest plot | 2 | 119 | Risk Ratio (M‐H, Fixed, 95% CI) | 1.45 [1.00, 2.10] |
| 2 Taste acuity improvement ‐ Objective outcome ‐ Continuous data Show forest plot | 3 | 366 | Std. Mean Difference (IV, Fixed, 95% CI) | 0.44 [0.23, 0.65] |
| 3 Taste acuity improvement for different taste sensations Show forest plot | 1 | Mean Difference (IV, Fixed, 95% CI) | Totals not selected | |
| 3.1 Salt | 1 | Mean Difference (IV, Fixed, 95% CI) | 0.0 [0.0, 0.0] | |
| 3.2 Sweet | 1 | Mean Difference (IV, Fixed, 95% CI) | 0.0 [0.0, 0.0] | |
| 3.3 Sour | 1 | Mean Difference (IV, Fixed, 95% CI) | 0.0 [0.0, 0.0] | |
| 3.4 Bitter | 1 | Mean Difference (IV, Fixed, 95% CI) | 0.0 [0.0, 0.0] | |
| 4 Cross‐over study Show forest plot | 1 | 14 | Mean Difference (IV, Fixed, 95% CI) | 3.00 [0.66, 5.34] |
| 5 Taste acuity improvement ‐ Objective outcome ‐ Dichotomous Show forest plot | 2 | Risk Ratio (M‐H, Fixed, 95% CI) | Subtotals only | |
| 5.1 Idiopathic and zinc deficient taste disorders | 1 | 73 | Risk Ratio (M‐H, Fixed, 95% CI) | 1.70 [1.13, 2.56] |
| 5.2 Taste disorder secondary to chronic renal failure | 1 | 24 | Risk Ratio (M‐H, Fixed, 95% CI) | 25.0 [1.65, 379.57] |
| 6 Adverse events Show forest plot | 3 | 335 | Risk Ratio (M‐H, Fixed, 95% CI) | 6.21 [1.12, 34.37] |
| Outcome or subgroup title | No. of studies | No. of participants | Statistical method | Effect size |
| 1 Taste discrimination Show forest plot | 1 | 37 | Mean Difference (IV, Fixed, 95% CI) | 2.80 [‐1.18, 6.78] |