Tratamiento farmacológico de los factores de riesgo vascular para la reducción de la mortalidad y los eventos cardiovasculares en pacientes con aneurisma aórtico abdominal
Información
- DOI:
- https://doi.org/10.1002/14651858.CD010447.pub3Copiar DOI

- Base de datos:
-
- Cochrane Database of Systematic Reviews
- Versión publicada:
-
- 12 enero 2017see what's new
- Tipo:
-
- Intervention
- Etapa:
-
- Review
- Grupo Editorial Cochrane:
-
Grupo Cochrane de Vascular
- Copyright:
-
- Copyright © 2017 The Cochrane Collaboration. Published by John Wiley & Sons, Ltd.
Cifras del artículo
Altmetric:
Citado por:
Autores
Contributions of authors
LR drafted the protocol, selected studies for inclusion, assessed the quality of studies, performed data analyses, and wrote and updated the review.
EA contributed to the protocol, selected studies for inclusion, assessed the quality of studies, and contributed to the text of the review and review update.
GS contributed to the protocol and the text of the review and review update.
Sources of support
Internal sources
-
No sources of support supplied
External sources
-
Chief Scientist Office, Scottish Government Health Directorates, The Scottish Government, UK.
The Cochrane Vascular editorial base is supported by the Chief Scientist Office.
Declarations of interest
LR: none known
EA: none known
GS: none known
Acknowledgements
We thank Karen Welch (CIS), Cochrane Vascular, for conducting the literature searches.
Version history
| Published | Title | Stage | Authors | Version |
| 2017 Jan 12 | Pharmacological treatment of vascular risk factors for reducing mortality and cardiovascular events in patients with abdominal aortic aneurysm | Review | Lindsay Robertson, Edmond Atallah, Gerard Stansby | |
| 2014 Jan 21 | Pharmacological treatment of vascular risk factors for reducing mortality and cardiovascular events in patients with abdominal aortic aneurysm | Review | Lindsay Robertson, Edmond Atallah, Gerard Stansby | |
| 2013 Mar 28 | Pharmacological treatment of vascular risk factors for reducing mortality and cardiovascular events in patients with abdominal aortic aneurysm | Protocol | Lindsay Robertson, Edmond Atallah, Gerard Stansby | |
Keywords
MeSH
Medical Subject Headings (MeSH) Keywords
- Antihypertensive Agents [therapeutic use];
- Aortic Aneurysm, Abdominal [*complications, mortality];
- Cardiovascular Agents [*therapeutic use];
- Cardiovascular Diseases [mortality, *prevention & control];
- Cause of Death;
- Metoprolol [*therapeutic use];
- Randomized Controlled Trials as Topic;
- Risk Factors;
Medical Subject Headings Check Words
Humans;
PICO
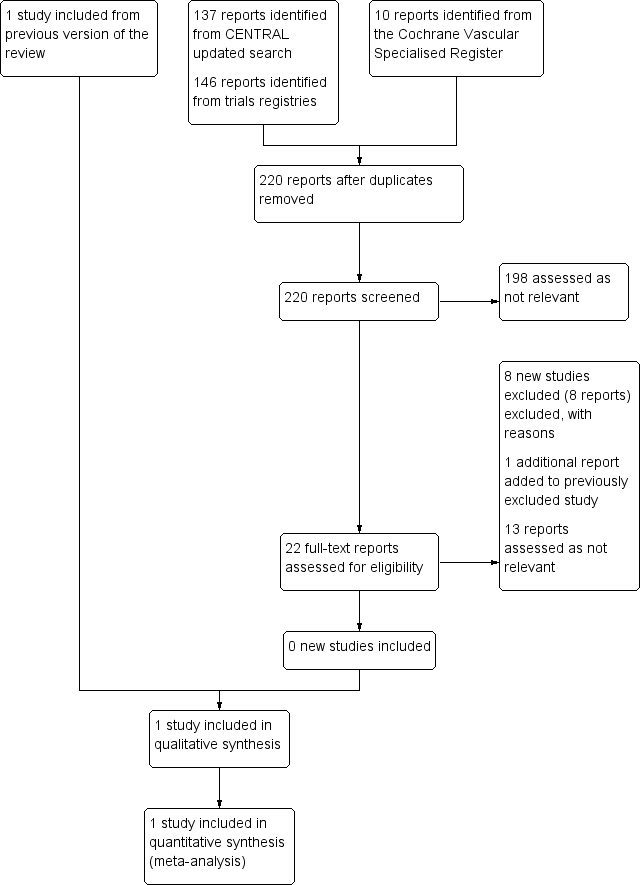
Study flow diagram.

'Risk of bias' summary: review authors' judgements about each 'Risk of bias' item for each included study.

Comparison 1 Metoprolol versus placebo, Outcome 1 All‐cause mortality, 30 days.

Comparison 1 Metoprolol versus placebo, Outcome 2 Cardiovascular death, 30 days.

Comparison 1 Metoprolol versus placebo, Outcome 3 AAA‐related death, 30 days.

Comparison 1 Metoprolol versus placebo, Outcome 4 Nonfatal cardiovascular event, 30 days.

Comparison 1 Metoprolol versus placebo, Outcome 5 All‐cause mortality, 6 months.
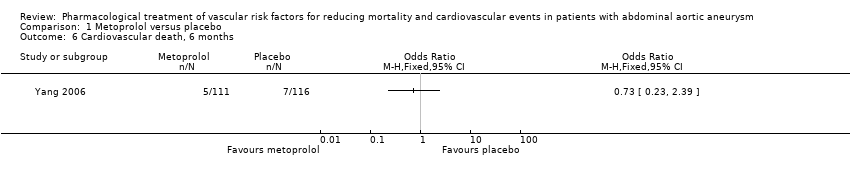
Comparison 1 Metoprolol versus placebo, Outcome 6 Cardiovascular death, 6 months.

Comparison 1 Metoprolol versus placebo, Outcome 7 Nonfatal cardiovascular event, 6 months.
| Metoprolol compared to placebo for reducing mortality and cardiovascular events in patients with abdominal aortic aneurysm (AAA) | ||||||
| Patient or population: patients of any age with AAA less than 30 mm in diameter | ||||||
| Outcomes | Anticipated absolute effects* (95% CI) | Relative effect | Number of participants | Quality of the evidence | Comments | |
| Risk with placebo | Risk with metoprolol | |||||
| All‐cause mortality, 30 days1 | Study population | OR 0.17 | 227 | ⊕⊕⊝⊝ | — | |
| 52 per 1000 | 9 per 1000 | |||||
| Cardiovascular death, 30 days3 | Study population | OR 0.20 | 227 | ⊕⊕⊝⊝ | — | |
| 43 per 1000 | 9 per 1000 | |||||
| AAA‐related death, 30 days4 | Study population | OR 1.05 | 227 | ⊕⊕⊝⊝ | — | |
| 9 per 1000 | 9 per 1000 | |||||
| Nonfatal cardiovascular event, 30 days5 | Study population | OR 1.44 | 227 | ⊕⊕⊝⊝ | — | |
| 78 per 1000 | 108 per 1000 | |||||
| All‐cause mortality, 6 months1 | Study population | OR 0.71 | 227 | ⊕⊕⊝⊝ | — | |
| 86 per 1000 | 63 per 1000 | |||||
| Cardiovascular death, 6 months3 | Study population | OR 0.73 | 227 | ⊕⊕⊝⊝ | — | |
| 60 per 1000 | 45 per 1000 | |||||
| AAA‐related death, 6 months4 | See comments | See comments | See comments | See comments | The incidence of AAA‐related death was not measured at six months. | |
| Nonfatal cardiovascular event, 6 months5 | Study population | OR 1.41 | 227 | ⊕⊕⊝⊝ | — | |
| 86 per 1000 | 117 per 1000 | |||||
| *The risk with placebo was the average risk in the placebo group (i.e. the number of participants with events divided by total number of participants of the placebo group included in the meta‐analysis). The risk in the metoprolol group (and its 95% CI) is based on the assumed risk in the placebo group and the relative effect of the intervention (and its 95% CI). | ||||||
| GRADE Working Group grades of evidence | ||||||
| 1Death from all causes. | ||||||
| Outcome or subgroup title | No. of studies | No. of participants | Statistical method | Effect size |
| 1 All‐cause mortality, 30 days Show forest plot | 1 | Odds Ratio (M‐H, Fixed, 95% CI) | Totals not selected | |
| 2 Cardiovascular death, 30 days Show forest plot | 1 | Odds Ratio (M‐H, Fixed, 95% CI) | Totals not selected | |
| 3 AAA‐related death, 30 days Show forest plot | 1 | Odds Ratio (M‐H, Fixed, 95% CI) | Totals not selected | |
| 4 Nonfatal cardiovascular event, 30 days Show forest plot | 1 | Odds Ratio (M‐H, Fixed, 95% CI) | Totals not selected | |
| 5 All‐cause mortality, 6 months Show forest plot | 1 | Odds Ratio (M‐H, Fixed, 95% CI) | Totals not selected | |
| 6 Cardiovascular death, 6 months Show forest plot | 1 | Odds Ratio (M‐H, Fixed, 95% CI) | Totals not selected | |
| 7 Nonfatal cardiovascular event, 6 months Show forest plot | 1 | Odds Ratio (M‐H, Fixed, 95% CI) | Totals not selected | |