Scolaris Content Display Scolaris Content Display

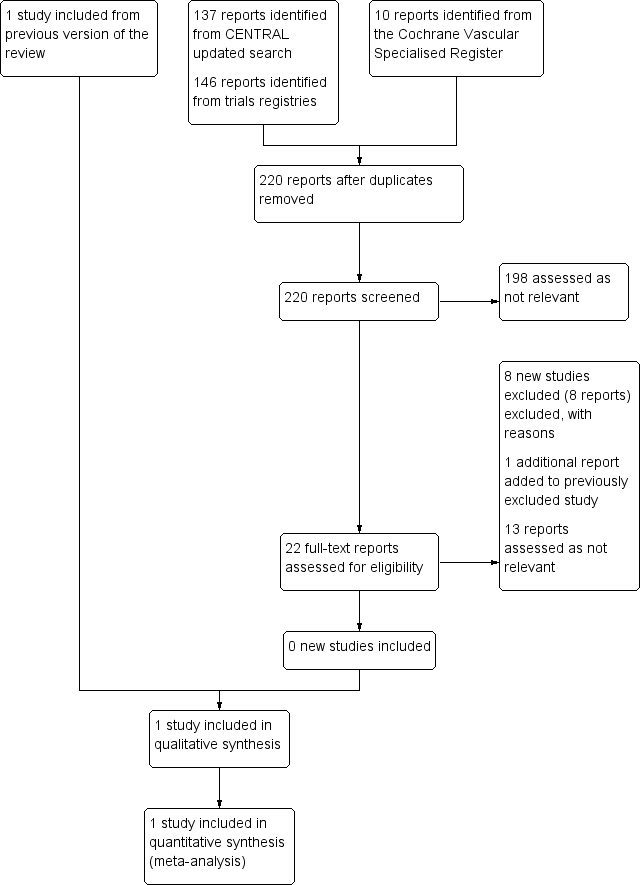
Study flow diagram.
Figuras y tablas -
Figure 1

Study flow diagram.

'Risk of bias' summary: review authors' judgements about each 'Risk of bias' item for each included study.
Figuras y tablas -
Figure 2

'Risk of bias' summary: review authors' judgements about each 'Risk of bias' item for each included study.

Comparison 1 Metoprolol versus placebo, Outcome 1 All‐cause mortality, 30 days.
Figuras y tablas -
Analysis 1.1

Comparison 1 Metoprolol versus placebo, Outcome 1 All‐cause mortality, 30 days.

Comparison 1 Metoprolol versus placebo, Outcome 2 Cardiovascular death, 30 days.
Figuras y tablas -
Analysis 1.2

Comparison 1 Metoprolol versus placebo, Outcome 2 Cardiovascular death, 30 days.

Comparison 1 Metoprolol versus placebo, Outcome 3 AAA‐related death, 30 days.
Figuras y tablas -
Analysis 1.3

Comparison 1 Metoprolol versus placebo, Outcome 3 AAA‐related death, 30 days.

Comparison 1 Metoprolol versus placebo, Outcome 4 Nonfatal cardiovascular event, 30 days.
Figuras y tablas -
Analysis 1.4

Comparison 1 Metoprolol versus placebo, Outcome 4 Nonfatal cardiovascular event, 30 days.

Comparison 1 Metoprolol versus placebo, Outcome 5 All‐cause mortality, 6 months.
Figuras y tablas -
Analysis 1.5

Comparison 1 Metoprolol versus placebo, Outcome 5 All‐cause mortality, 6 months.

Comparison 1 Metoprolol versus placebo, Outcome 6 Cardiovascular death, 6 months.
Figuras y tablas -
Analysis 1.6

Comparison 1 Metoprolol versus placebo, Outcome 6 Cardiovascular death, 6 months.

Comparison 1 Metoprolol versus placebo, Outcome 7 Nonfatal cardiovascular event, 6 months.
Figuras y tablas -
Analysis 1.7

Comparison 1 Metoprolol versus placebo, Outcome 7 Nonfatal cardiovascular event, 6 months.

Summary of findings for the main comparison. Metoprolol compared to placebo for reducing mortality and cardiovascular events in patients with abdominal aortic aneurysm

Metoprolol compared to placebo for reducing mortality and cardiovascular events in patients with abdominal aortic aneurysm (AAA)

Patient or population: patients of any age with AAA less than 30 mm in diameter
Setting: hospital
Intervention: metoprolol
Comparison: placebo

Outcomes

Anticipated absolute effects* (95% CI)

Relative effect
(95% CI)

Number of participants
(studies)

Quality of the evidence
(GRADE)

Comments

Risk with placebo

Risk with metoprolol

All‐cause mortality, 30 days1

Study population

OR 0.17
(0.02 to 1.41)

227
(1 RCT)

⊕⊕⊝⊝
low2

52 per 1000

9 per 1000
(1 to 71)

Cardiovascular death, 30 days3

Study population

OR 0.20
(0.02 to 1.76)

227
(1 RCT)

⊕⊕⊝⊝
low2

43 per 1000

9 per 1000
(1 to 73)

AAA‐related death, 30 days4

Study population

OR 1.05
(0.06 to 16.92)

227
(1 RCT)

⊕⊕⊝⊝
low2

9 per 1000

9 per 1000
(1 to 128)

Nonfatal cardiovascular event, 30 days5

Study population

OR 1.44
(0.58 to 3.57)

227
(1 RCT)

⊕⊕⊝⊝
low2

78 per 1000

108 per 1000
(47 to 231)

All‐cause mortality, 6 months1

Study population

OR 0.71
(0.26 to 1.95)

227
(1 RCT)

⊕⊕⊝⊝
low2

86 per 1000

63 per 1000
(24 to 155)

Cardiovascular death, 6 months3

Study population

OR 0.73
(0.23 to 2.39)

227
(1 RCT)

⊕⊕⊝⊝
low2

60 per 1000

45 per 1000
(15 to 133)

AAA‐related death, 6 months4

See comments

See comments

See comments

See comments

The incidence of AAA‐related death was not measured at six months.

Nonfatal cardiovascular event, 6 months5

Study population

OR 1.41
(0.59 to 3.35)

227
(1 RCT)

⊕⊕⊝⊝
low2

86 per 1000

117 per 1000
(53 to 240)

*The risk with placebo was the average risk in the placebo group (i.e. the number of participants with events divided by total number of participants of the placebo group included in the meta‐analysis). The risk in the metoprolol group (and its 95% CI) is based on the assumed risk in the placebo group and the relative effect of the intervention (and its 95% CI).

Abbreviations: AAA: abdominal aortic aneurysm; CI: confidence interval; MI: myocardial infarction; OR: odds ratio; RCT: randomised controlled trial

GRADE Working Group grades of evidence
High quality: we are very confident that the true effect lies close to that of the estimate of the effect
Moderate quality: we are moderately confident in the effect estimate: The true effect is likely to be close to the estimate of the effect, but there is a possibility that it is substantially different
Low quality: our confidence in the effect estimate is limited: The true effect may be substantially different from the estimate of the effect
Very low quality: we have very little confidence in the effect estimate: The true effect is likely to be substantially different from the estimate of effect

1Death from all causes.
2Quality of evidence downgraded to low for imprecision due to low number of events, small sample size and wide CIs.
3Fatal MI, fatal stroke and other vascular deaths.
4Death due to abdominal aortic aneurysm.
5Nonfatal MI, nonfatal stroke, or transient ischaemic attack.

Figuras y tablas -
Summary of findings for the main comparison. Metoprolol compared to placebo for reducing mortality and cardiovascular events in patients with abdominal aortic aneurysm
Comparison 1. Metoprolol versus placebo

Outcome or subgroup title

No. of studies

No. of participants

Statistical method

Effect size

1 All‐cause mortality, 30 days Show forest plot

1

Odds Ratio (M‐H, Fixed, 95% CI)

Totals not selected

2 Cardiovascular death, 30 days Show forest plot

1

Odds Ratio (M‐H, Fixed, 95% CI)

Totals not selected

3 AAA‐related death, 30 days Show forest plot

1

Odds Ratio (M‐H, Fixed, 95% CI)

Totals not selected

4 Nonfatal cardiovascular event, 30 days Show forest plot

1

Odds Ratio (M‐H, Fixed, 95% CI)

Totals not selected

5 All‐cause mortality, 6 months Show forest plot

1

Odds Ratio (M‐H, Fixed, 95% CI)

Totals not selected

6 Cardiovascular death, 6 months Show forest plot

1

Odds Ratio (M‐H, Fixed, 95% CI)

Totals not selected

7 Nonfatal cardiovascular event, 6 months Show forest plot

1

Odds Ratio (M‐H, Fixed, 95% CI)

Totals not selected

Figuras y tablas -
Comparison 1. Metoprolol versus placebo