Intervenciones con ejercicios y régimen dietético combinados para la prevención de la diabetes mellitus gestacional
Resumen
Antecedentes
La diabetes mellitus gestacional (DMG) se asocia con una amplia variedad de consecuencias adversas para la salud de las pacientes y sus hijos a corto y a largo plazo. Con el aumento de la prevalencia de DMG en todo el mundo, hay una necesidad urgente de evaluar estrategias para la prevención de la DMG, como las intervenciones combinadas con ejercicios y régimen dietético. Ésta es una actualización de una revisión Cochrane publicada por primera vez en el 2015.
Objetivos
Evaluar los efectos de las intervenciones en el régimen dietético en combinación con intervenciones con ejercicios físicos en embarazadas para prevenir la DMG y las consecuencias adversas para la salud asociadas en la madre y el lactante/niño.
Métodos de búsqueda
Se realizaron búsquedas en el Registro de ensayos del Grupo Cochrane de Embarazo y Parto (Cochrane Pregnancy and Chilbirth Group) (27 de noviembre de 2016) y en las listas de referencias de los estudios recuperados.
Criterios de selección
Se incluyeron los ensayos controlados aleatorios (ECA) y los ECA grupales que compararon intervenciones combinadas con ejercicios y régimen dietético con ninguna intervención (es decir, atención estándar), que se informaron sobre el diagnóstico de la DMG como un resultado. Se excluyeron los ensayos controlados cuasialeatorios. Los ensayos cruzados no fueron aptos para inclusión. Se programó incluir ECA que comparasen dos o más intervenciones diferentes de régimen dietético/ejercicio, aunque no se identificó ninguno.
Obtención y análisis de los datos
Dos autores de la revisión de forma independiente evaluaron la elegibilidad de los estudios, extrajeron los datos, evaluaron el riesgo de sesgo de los ensayos incluidos y evaluaron la calidad de la evidencia para los resultados materno y del lactante/niño seleccionados mediante el enfoque GRADE. Se verificó la exactitud de los datos.
Resultados principales
En esta actualización se incluyeron 23 ECA (con 8918 mujeres y 8709 lactantes) que compararon intervenciones combinadas con ejercicios y régimen dietético con ninguna intervención (atención estándar). Los estudios variaron en los programas de régimen dietético y ejercicios evaluados, así como en los resultados de salud informados. No se informó que se hubiera recibido financiamiento de agencias ni fabricantes de fármacos con intereses en los resultados. El riesgo general de sesgo se consideró incierto debido a la falta de informe de los detalles metodológicos. La mayoría de los estudios se realizaron en países de altos ingresos.
En los resultados primarios de la revisión hubo una posible reducción en el riesgo de DMG en el grupo de intervención de régimen dietético y ejercicios en comparación con el grupo de atención estándar (cociente de riesgos [CR] promedio 0,85; intervalo de confianza [IC] del 95%: 0,71 a 1,01; 6633 mujeres; 19 ECA; Tau² = 0,05; I² = 42%; P = 0,07; evidencia de calidad moderada). También hubo una posible reducción en el riesgo de cesárea (CR 0,95; IC del 95%: 0,88 a 1,02; 6089 pacientes; 14 ECA; evidencia de calidad moderada). No se observaron diferencias claras entre los grupos en la pre‐eclampsia (CR 0,98; IC del 95%: 0,79 a 1,22; 5366 participantes; ocho ECA; evidencia de baja calidad), la hipertensión inducida por el embarazo y la hipertensión (CR promedio 0,78; IC del 95%: 0,47 a 1,27; 3073 participantes; seis ECA; Tau² = 0,19; I² = 62%; evidencia de muy baja calidad), la mortalidad perinatal (CR 0,82; IC del 95%: 0,42 a 1,63; 3757 participantes; dos ECA; evidencia de baja calidad) ni en el tamaño grande para la edad gestacional (CR 0,93; IC del 95%: 0,81 a 1,07; 5353 participantes; 11 ECA; evidencia de baja calidad). No se informaron datos sobre la morbimortalidad infantil.
Los análisis de subgrupos (según el diseño de los ensayos, el índice de masa corporal [IMC] materno y el grupo étnico) no mostraron un efecto diferencial del tratamiento claro. No fue posible evaluar la repercusión de la edad materna, la paridad ni las características específicas de las intervenciones con régimen dietético y ejercicios. Los resultados de los análisis de sensibilidad (según la calidad de los ECA) en general apoyaron los observados en los análisis principales. No fue posible realizar análisis de subgrupos según la edad materna, la paridad ni la naturaleza de las intervenciones con ejercicios/alimentarias debido a la escasez de información/datos sobre estas características y a la imposibilidad de agrupar significativamente las características de la intervención.
Para la mayoría de los resultados secundarios de la revisión evaluados mediante GRADE no hubo diferencias claras entre los grupos, incluido el traumatismo perineal (CR 1,27; IC del 95%: 0,78 a 2,05; 2733 participantes; dos ECA; evidencia de calidad moderada) ni en la hipoglucemia neonatal (CR promedio 1,42; IC del 95%: 0,67 a 2,98; 3653 participantes; dos ECA; Tau² = 0,23; I² = 77%; evidencia de baja calidad); y adiposidad en la niñez (puntuación z del IMC) (DM 0,05; IC del 95%: ‐0,29 a 0,40; 794 participantes; dos ECA; Tau² = 0,04; I² = 59%; evidencia de baja calidad). Sin embargo, hubo evidencia de menos aumento de peso gestacional en el grupo de intervención con régimen dietético y ejercicios en comparación con el grupo control (diferencia de medias [DM] ‐0,89 kg; IC del 95%: ‐1,39 a ‐0,40; 5052 pacientes; 16 ECA; Tau² = 0,37; I² = 43%; evidencia de calidad moderada). No se informaron datos de la depresión materna posnatal ni de la diabetes tipo 2; la diabetes tipo 2 en la niñez/adultez ni de la discapacidad neurosensorial.
Conclusiones de los autores
La evidencia de calidad moderada indica un menor riesgo de DMG y cesárea con las intervenciones que combinan régimen dietético y ejercicio durante el embarazo, así como una reducción del aumento de peso gestacional, en comparación con la atención estándar. No hubo diferencias claras en los trastornos hipertensivos del embarazo, la mortalidad perinatal, el tamaño grande para la edad gestacional, el traumatismo perineal, la hipoglucemia neonatal ni la adiposidad en la niñez (evidencia de calidad moderada a muy baja).
Con el uso de la metodología GRADE la evidencia se consideró de calidad moderada a muy baja. Las decisiones de disminución con respecto a la calidad se debieron principalmente a limitaciones en el diseño (riesgo de sesgo), y a imprecisión (estimaciones inciertas del efecto y, en ocasiones, tamaños pequeños de la muestra y bajas tasas de eventos); sin embargo, dos resultados (hipertensión inducida por el embarazo/hipertensión e hipoglucemia neonatal), también se disminuyeron por inconsistencia no explicada (heterogeneidad estadística).
Debido a la variabilidad en los componentes del régimen dietético y del ejercicio evaluados en los estudios incluidos, la evidencia en esta revisión tiene una capacidad limitada para informar la práctica. Los estudios futuros podrían describir con más detalles las intervenciones utilizadas, si influyeron y cómo lo hicieron en el cambio de comportamientos, y preferiblemente estandarizarlas entre los estudios. Los estudios también podrían considerar el uso de grupos de resultados fundamentales existentes para facilitar un informe más estandarizado.
PICO
Resumen en términos sencillos
Ejercicio y régimen dietético combinados en el embarazo para la prevención de la diabetes mellitus gestacional
Pregunta de la revisión
¿Cuáles son los efectos del régimen dietético y el ejercicio combinados para prevenir la diabetes mellitus gestacional (DMG), y los problemas de salud relacionados en las madres y los lactantes? Ésta es una actualización de una revisión Cochrane publicada por primera vez en el 2015.
Antecedentes
La DMG es el aumento del azúcar sanguíneo (hiperglucemia) durante el embarazo. Hasta un cuarto de las embarazadas desarrolla DMG, algunas con un riesgo mayor que otras (como las mujeres con sobrepeso u obesidad, las mujeres mayores y las de grupos étnicos particulares). La DMG puede provocar problemas de salud significativos para las pacientes y los recién nacidos. A corto plazo, las pacientes con DMG pueden desarrollar preeclampsia (presión arterial elevada [hipertensión] y proteína en la orina), o tener un parto por cesárea. Los fetos pueden ser grandes para la edad gestacional y, como resultado, pueden lesionarse al nacer o provocar lesiones a la madre durante el parto. Los recién nacidos de madres con DMG a menudo tienen glucemia baja (hipoglucemia) y sobrepeso. En etapas posteriores de la vida, estos recién nacidos pueden desarrollar problemas de salud como discapacidades neurosensoriales y diabetes tipo 2. Se sabe que comer bien y hacer ejercicio evita la diabetes tipo 2 y puede ser efectivo para prevenir la DMG.
Características de los estudios
Se buscó evidencia en noviembre de 2016 y se incluyeron 23 ensayos controlados aleatorios (ECA) (con 8918 mujeres y 8709 recién nacidos). La mayoría de los estudios se realizaron en países de altos ingresos. Todos los estudios compararon a pacientes que recibieron programas de régimen dietético y ejercicios con pacientes que recibieron atención estándar sin régimen dietético ni programas de ejercicio. Los estudios variaron en los programas de régimen dietético y ejercicios evaluados, así como en los resultados de salud informados. No se informó que se hubiera recibido financiamiento de agencias ni fabricantes de fármacos con intereses en los resultados.
Resultados clave
Los resultados de 19 estudios (6633 pacientes) mostraron una posible reducción en la DMG en las pacientes que recibieron programas de régimen dietético y ejercicios en comparación con las pacientes que recibieron atención estándar. Catorce estudios (6089 pacientes) mostraron una posible reducción en el parto por cesárea (14 estudios; 6089 pacientes) y 16 estudios (5052 pacientes) mostraron un menor aumento de peso durante el embarazo en las pacientes que recibieron programas de ejercicio. No se encontraron diferencias entre los grupos en otros problemas de salud como: preeclampsia (ocho estudios; 5366 mujeres); hipertensión (seis estudios; 3073 mujeres); tamaño grande para la edad gestacional al parto (11 estudios; 5353 recién nacidos); y traumatismo perineal (dos estudios; 2733 mujeres). La muerte de los fetos alrededor del momento del parto (dos estudios; 3757 recién nacidos), los recién nacidos con glucemia baja después del nacimiento (dos estudios; 3653 recién nacidos) y los recién nacidos con sobrepeso (dos estudios; 794 lactantes) no difirieron en los dos grupos. No se informaron los efectos sobre la depresión o la diabetes tipo 2 en las madres, el resultado combinado de muerte o enfermedad para los recién nacidos, ni la diabetes tipo 2 o la discapacidad neurosensorial de los recién nacidos cuando niños. Se examinaron las opiniones de las participantes en los programas.
La evidencia indica que los programas combinados de régimen dietético y ejercicios pueden ser efectivos para prevenir la DMG, aunque los componentes óptimos de estos programas todavía no están claros. Los estudios futuros podrían describir con más detalles las intervenciones utilizadas, si influyeron y cómo lo hicieron en el cambio de comportamientos, y preferiblemente estandarizarlas entre los estudios. Los estudios también podrían considerar la posibilidad de medir resultados maternos e infantiles similares e informarlos de forma estandarizada.
Calidad de la evidencia
El riesgo general de sesgo se consideró poco claro debido a la falta de información sobre los métodos. La calidad de la evidencia de los resultados clave seleccionados se evaluó mediante las consideraciones GRADE. Las evaluaciones variaron de moderada a muy baja.
Conclusiones de los autores
Summary of findings
| Combined diet and exercise interventions for preventing GDM | ||||||
| Population: pregnant women, excluding women already diagnosed with GDM, type 1 or type 2 diabetes Setting: Australia (2 RCTs), Brazil (1 RCT), Canada (2 RCTs), China (2 RCTs), Denmark (1 RCT), Egypt (1 RCT), Finland (3 RCTs), Germany (1 RCT), Italy (2 RCTs), Norway (1 RCT), UK (2 RCTs), USA (5 RCTs) | ||||||
| Outcomes | Anticipated absolute effects* (95% CI) | Relative effect | № of participants | Quality of the evidence | Comments | |
| Risk with control | Risk with diet and exercise interventions | |||||
| GDM | Trial population | average RR 0.85 (0.71 to 1.01) | 6633 (19 RCTs) | ⊕⊕⊕⊝ MODERATE1,3 | ||
| 168 per 1000 | 143 per 1000 (119 to 170) | |||||
| Hypertensive disorders of pregnancy (pre‐eclampsia) | Trial population | RR 0.98 (0.79 to 1.22) | 5366 (8 RCTs) | ⊕⊕⊝⊝ LOW2,4 | Eclampsia was not reported by any trials (Sagedal 2017 reports combined severe pre‐eclampsia, HELLP and eclampsia) | |
| 57 per 1000 | 55 per 1000 (45 to 69) | |||||
| Hypertensive disorders of pregnancy (pregnancy‐induced hypertension/hypertension) | Trial population | average RR 0.78 | 3073 | ⊕⊝⊝⊝ VERY LOW2,5,6 | ||
| 103 per 1000 | 80 per 1000 (48 to 130) | |||||
| Caesarean section | Trial population | RR 0.95 (0.88 to 1.02) | 6089 (14 RCTs) | ⊕⊕⊕⊝ MODERATE7 | ||
| 299 per 1000 | 284 per 1000 (263 to 305) | |||||
| Perineal trauma | Trial population | RR 1.27 (0.78 to 2.05) | 2733 (2 RCTs) | ⊕⊕⊕⊝ MODERATE2 | ||
| 21 per 1000 | 27 per 1000 (17 to 44) | |||||
| Gestational weight gain (kg) | Trial population | MD ‐ 0.89 (‐1.39 to ‐ 0.40) | 5052 | ⊕⊕⊕⊝ MODERATE8,9 | ||
| The mean gestational weight gain in the intervention group was 0.89 kg less (1.39 kg less to 0.40 kg less) | ||||||
| Postnatal depression | Not estimable | (0 RCTs) | No data reported for postnatal depression in any of the included RCTs | |||
| Type 2 diabetes mellitus | Not estimable | (0 RCTs) | No data reported for type 2 diabetes mellitus in any of the included RCTs | |||
| *The risk in the intervention group (and its 95% confidence interval) is based on the assumed risk in the comparison group and the relative effect of the intervention (and its 95% CI) | ||||||
| GRADE Working Group grades of evidence | ||||||
| 1Trial limitations (‐1): 19 RCTs, intervention unable to be blinded (not downgraded for this as outcome is objective); some RCTS with potentially serious design limitations (unclear randomisation, attrition bias) | ||||||
| Combined diet and exercise interventions for preventing GDM | ||||||
| Population: pregnant women, excluding women already diagnosed with GDM, type 1 or type 2 diabetes Setting: Australia (2 RCTs), Brazil (1 RCT), Canada (2 RCTs), China (2 RCTs), Denmark (1 RCT), Egypt (1 RCT), Finland (3 RCTs), Germany (1 RCT), Italy (2 RCTs), Norway (1 RCT), UK (2 RCTs), USA (5 RCTs) | ||||||
| Outcomes | Anticipated absolute effects* (95% CI) | Relative effect | № of participants | Quality of the evidence | Comments | |
| Risk with control | Risk with diet and exercise interventions | |||||
| Perinatal mortality | Trial population | RR 0.82 (0.42 to 1.63) | 3757 (2 RCTs) | ⊕⊕⊝⊝ LOW1 | ||
| 10 per 1000 | 8 per 1000 (4 to 16) | |||||
| Large‐for‐gestational age | Trial population | RR 0.93 (0.81 to 1.07) | 5353 (11 RCTs) | ⊕⊕⊝⊝ LOW2,3 | ||
| 135 per 1000 | 126 per 1000 (109 to 144) | |||||
| Mortality or morbidity composite | Not estimable | (0 RCTs) | No data reported for mortality or morbidity composite in any of the included RCTs | |||
| Neonatal hypoglycaemia | Trial population | average RR 1.42 (0.67 to 2.98) | 3653 (2 RCTs) | ⊕⊕⊝⊝ LOW3,4 | ||
| 63 per 1000 | 90 per 1000 (42 to 189) | |||||
| Childhood adiposity (latest time reported) (BMI z score) | Trial population | MD 0.05 (‐0.29 to 0.40) | 794 (2 RCTs) | ⊕⊕⊝⊝ LOW3,5,6 | Additional meta‐analyses presented in review for: abdominal circumference, subscapular skinfold thickness, triceps skinfold thickness and total body fat | |
| The mean BMI z score in the intervention group was 0.05 higher (0.29 lower to 0.40 higher) | ||||||
| Type 2 diabetes mellitus | Not estimable | (0 RCTs) | No data reported for type 2 diabetes mellitus in any of the included RCTs | |||
| Neurosensory disability | Not estimable | (0 RCTs) | No data reported for neurosensory disability in any of the included RCTs | |||
| *The risk in the intervention group (and its 95% confidence interval) is based on the assumed risk in the comparison group and the relative effect of the intervention (and its 95% CI). | ||||||
| GRADE Working Group grades of evidence | ||||||
| 1Imprecision (‐2): confidence interval crossing the line of no effect and few events | ||||||
Antecedentes
Descripción de la afección
Introducción y definición
La diabetes mellitus gestacional (DMG) se define como la intolerancia a los carbohidratos que provoca hiperglucemia (aumento anormal del azúcar en sangre) de gravedad variable y que aparece o se detecta por primera vez durante el embarazo(WHO 1999). La DMG definida de este modo incluye a las mujeres con diabetes preexistente no diagnosticada y también a las mujeres en las que aparece por primera vez durante el embarazo (especialmente durante el primer trimestre).
Fisiopatología y síntomas
En el embarazo normal se desarrolla una resistencia relativa a la insulina materna a partir del segundo trimestre, con una disminución progresiva en la sensibilidad a la insulina hasta el término. Este cambio fisiológico facilita el transporte de la glucosa a través de la placenta para estimular el crecimiento y el desarrollo fetal normal. En las pacientes con DMG, un mayor grado de resistencia a la insulina materna puede provocar hiperglucemia en la madre, aumento del transporte de glucosa a través de la placenta, hiperinsulinemia fetal y crecimiento acelerado del feto (Setji 2005). Habitualmente la resistencia a la insulina materna inducida por el embarazo se resuelve rápidamente después del nacimiento. Aunque muchas pacientes están asintomáticas se pueden observar síntomas y signos asociados con la hiperglucemia como poliuria (aumento de la frecuencia urinaria), polidipsia (aumento de la sed), visión borrosa y fatiga cuando la DMG no se detecta o su control es deficiente (Kjos 1999).
Factores de riesgo de DMG
Los estudios observacionales han ayudado a identificar un grupo de factores de riesgo de DMG, como el aumento del índice de masa corporal (IMC) materno, la inactividad física Chasan‐Taber 2008), edad materna avanzada (Morisset 2010), aumento en la paridad y ciertos grupos étnicos. Se ha mostrado que los regímenes dietéticos con un bajo contenido en fibra con una carga glucémica alta aumentan el riesgo de DMG (Zhang 2006). Las pacientes que han tenido previamente un recién nacido macrosómico (peso al nacer 4000 g o más), han presentado anteriormente DMG (Petry 2010), tienen antecedentes familiares o un pariente de primero grado con diabetes o tienen síndrome de ovario poliquístico (Reece 2010) también tienen un mayor riesgo de DMG. Se ha demostrado que el aumento de peso durante el embarazo en las mujeres con sobrepeso u obesidad se correlaciona con el riesgo de DMG (Hedderson 2010; Morisset 2010).
Investigaciones
La prevalencia de DMG ha aumentado en todo el mundo en paralelo con el aumento de las tasas de diabetes mellitus tipo 2 y de obesidad materna (Bottalico 2007; Dabelea 2005). Según la población de muestra, los procedimientos de cribado y los criterios diagnósticos utilizados, las prevalencias informadas alcanzan el 28% (Jiwani 2012). Los procedimientos de cribado varían internacionalmente, con inconsistencias entre y en los países, y varían desde el cribado universal o sistemático, hasta las pruebas caso a caso (es decir, cribado por factores de riesgo), según las decisiones de los médicos o las pacientes (Buckley 2012). De igual manera, los criterios diagnósticos varían en todo el mundo.
El estudio Hyperglycaemia and Adverse Pregnancy Outcome (HAPO) se diseñó para aclarar los riesgos de los resultados adversos asociados con grados de intolerancia materna a la glucosa (Coustan 2010). Debido a la falta de consistencia internacional con respecto a los criterios diagnósticos para la DMG, después de este estudio un grupo de trabajo de la International Association of Diabetes in Pregnancy Study Group (IADPSG) recomendó criterios nuevos para el diagnóstico de la DMG, con valores de corte revisados (inferiores) de los umbrales que representan un odds ratio para los resultados adversos del embarazo de 1,75 en las pacientes con DMG, en comparación con las mujeres sin DMG (IADPSG Consensus Panel 2010). Estos criterios diagnostican la DMG si se cumple o se excede cualquiera de los siguientes tres umbrales de la prueba de tolerancia a la glucosa oral (PTGO) de 75 g: glucemia en ayunas: 5,1 mmol/l (92 mg/dl), glucemia a la hora: 10,0 mmol/l (180 mg/dl) o glucemia a las dos horas: 8,5 mmol/l (153 mg/dl) (IADPSG Consensus Panel 2010). Aunque en general los estudios han revelado una mayor prevalencia de DMG cuando se utilizan los criterios de la IADPSG en comparación con otros, algunos (Duran 2014; Hung 2015), pero no todos(Gerome 2017), han encontrado una mejoría en los resultados del embarazo con su uso. Hay un debate continuo con respecto a los riesgos, los costos y los efectos beneficiosos de utilizar estos criterios diagnósticos(Farrar 2016; Langer 2013).
Consecuencias de la DMG para la salud
La DMG se asocia con un aumento en la ocurrencia de varias complicaciones durante el embarazo que incluyen la preeclampsia y la necesidad de inducción del trabajo de parto, o la cesárea (Reece 2010). Las consecuencias fetales pueden incluir macrosomía, que a la vez se puede asociar con resultados maternos adversos como rotura uterina y traumatismo perineal (Reece 2010). Las pacientes que desarrollan DMG tienen un aumento significativo en el riesgo de desarrollar diabetes tipo 2 en etapas posteriores de la vida (Bellamy 2009); y también tienen un mayor riesgo de desarrollar DMG en los embarazos futuros (Bottalico 2007).
Para el lactante, la DMG se asocia con un rango de complicaciones. Los lactantes de madres con DMG tienen mayores probabilidades de presentar macrosomía o ser grandes para la edad gestacional (Reece 2009; Reece 2010). Los lactantes grandes para la edad gestacional presentan un aumento en el riesgo de traumatismo durante el parto, como distocia de hombro, asfixia perinatal, fracturas óseas y parálisis nerviosa (Henriksen 2008; Reece 2010). Estos lactantes tienen mayor riesgo de desarrollar diabetes tipo 2, hipertensión, obesidad y síndrome metabólico en etapas posteriores de la vida (Reece 2010; Whincup 2008). Además, los recién nacidos de madres con DMG tienen mayor riesgo de hipoglucemia neonatal, síndrome de dificultad respiratoria, policitemia (recuento elevado de los eritrocitos), hiperbilirrubinemia y nacimiento prematuro (Reece 2009; Reece 2010). Dichas consecuencias para la salud en conjunto contribuyen a la necesidad de mejorar la atención neonatal.
En ensayos controlados aleatorios se ha demostrado que el tratamiento de las pacientes con DMG (intervención dietética, automonitorización de la glucemia y tratamiento con insulina de ser necesario) reduce de forma significativa el riesgo de varias complicaciones asociadas (Crowther 2005; Landon 2009). En la actualidad se acepta de forma generalizada la importancia del tratamiento en las pacientes con DMG (Alwan 2009; Crowther 2005; Landon 2009) y es el tema de varias revisiones Cochrane que evalúan diferentes aspectos del tratamiento e incluyen intervenciones en el estilo de vida (Brown 2017a), insulina (Brown 2016a), tratamientos con antidiabéticos orales (Brown 2017b), ejercicio(Ceysens 2016), administración de suplementos dietéticos con mioinositol(Brown 2016b), y diferentes intensidades de control glucémico (Martis 2016).
Descripción de la intervención
Intervenciones dietéticas
El objetivo del asesoramiento dietético o de las intervenciones relacionadas en el embarazo es optimizar los resultados de salud, que podrían incluir controlar el aumento excesivo del peso gestacional o el control glucémico. Aunque la evidencia observacional indica una relación entre la DMG y el consumo elevado de carnes procesadas, aperitivos y comida rápida y el consumo bajo de vegetales antes o durante el embarazo (Lamyian 2017; Schoenaker 2015), la evidencia de los estudios de intervención acerca de la influencia del régimen dietético para prevenir la DMG es escasa.
Intervenciones con ejercicios
En la actualidad se reconocen los efectos beneficiosos del ejercicio durante el embarazo y, por lo tanto, se estimula a las pacientes a realizar ejercicios "moderados" cuando no existen complicaciones del embarazo o médicas confirmadas (ACOG 2015; NICE 2017). Las pacientes a menudo reducen los niveles de actividad física durante el embarazo (Pereira 2007), muchas veces debido a un riesgo percibido para la salud materna o fetal (Clarke 2004) y la repercusión de los síntomas tempranos del embarazo como las náuseas y la fatiga (Pereira 2007).
El ejercicio aeróbico regular puede dar lugar a concentraciones sanguíneas inferiores de glucosa en ayunas y posprandiales en individuos previamente sedentarios. El ejercicio puede reducir la circulación de la glucosa y la insulina durante, y por un período después de, una sesión de ejercicios (Clapp 1991; Clapp 1998). Se ha demostrado que fuera del embarazo el ejercicio puede reducir el riesgo y retrasar la aparición de la diabetes mellitus tipo 2 (Jeon 2007). El ejercicio ha demostrado reducir la resistencia a la insulina en los hombres y las mujeres no embarazadas, lo que previene y controla de forma efectiva la diabetes tipo 2 (Clapp 2006; Knowler 2002; Redden 2011).
Los efectos beneficiosos del ejercicio durante el embarazo incluyen una reducción del dolor lumbar, la retención de líquido y el estrés cardiovascular(Schlüssel 2008). Se considera que el ejercicio desempeña una función en la reducción del riesgo de complicaciones como el parto prematuro y la preeclampsia (Dempsey 2005; Schlüssel 2008), y puede ayudar a prevenir el aumento de peso excesivo en el embarazo y la retención de peso posparto(Schlüssel 2008). Hay más pruebas de estudios observacionales que indican que el ejercicio previo al embarazo y el ejercicio en el primer trimestre de embarazo se asocia con una reducción de la resistencia a la insulina (Reece 2009), y, por lo tanto, con una reducción en el riesgo de desarrollar DMG (Jeon 2007; Redden 2011).
De qué manera podría funcionar la intervención
Intervenciones combinadas con ejercicios y régimen dietético
Aunque las intervenciones con ejercicios y régimen dietético solas y por separado para la prevención de la diabetes tipo 2 y la DMG se han evaluado ampliamente, en fechas más recientes ha habido un cambio hacia combinar dichas intervenciones en lo que se puede considerar como intervenciones en el "estilo de vida".
Varios ensayos controlados aleatorios han establecido que la progresión a la diabetes tipo 2 se puede prevenir o aplazar con intervenciones en el estilo de vida en los individuos con intolerancia a la glucosa de la población general (individuos "con alto riesgo")(Knowler 2002; Li 2008; Ratner 2008; Tuomilehto 2001). Dichos estudios se han centrado firmemente en la combinación de mayor actividad física y modificación dietética, junto con la reducción de peso en los participantes con sobrepeso. Los estudios de seguimiento a largo plazo de dichas intervenciones en el estilo de vida (que duraron un tiempo limitado), han mostrado efectos beneficiosos sostenidos sobre los factores de riesgo y la incidencia de diabetes (Tuomilehto 2011). Se ha indicado que un factor clave en el éxito de dichas intervenciones es el enfoque integral, que está dirigido y actúa para corregir de forma simultánea varios factores de riesgo relacionados con el estilo de vida(Tuomilehto 2011).
Como se acepta que una multitud de factores de riesgo pueden aumentar el riesgo de diabetes tipo 2, estos ensayos aleatorios se centraron en varios factores relacionados con el estilo de vida de forma simultánea. En el Finnish Diabetes Prevention Study se definieron previamente cinco objetivos en el estilo de vida, que incluyen: pérdida de peso mayor del 5%, ingesta de grasa inferior al 30% de la energía, ingesta de grasas saturadas inferior al 10% de la energía, ingesta de fibra dietética mayor de 15 g/1000 kcal y un aumento de la actividad física de al menos cuatro horas por semana(Tuomilehto 2001). Estos objetivos se percibieron como relativamente moderados y se consideró que sería posible mantener dichos cambios en el estilo de vida a largo plazo(Tuomilehto 2011). Ningún individuo con "alto riesgo" con intolerancia a la glucosa desarrolló diabetes durante el ensayo si logró al menos cuatro de los cinco objetivos del estilo de vida (Tuomilehto 2001). Este ensayo fue el primero de varios que muestran que la diabetes tipo 2 se puede prevenir con intervenciones en el estilo de vida, y destacó la importancia de abordar múltiples factores de riesgo relacionados con el estilo de vida para lograr un efecto beneficioso óptimo (Knowler 2002; Li 2008; Tuomilehto 2001).
Aunque dichos ensayos consideraron la diabetes tipo 2 y no se centraron en las pacientes embarazadas, ofrecen algún apoyo al uso de intervenciones en el estilo de vida en las pacientes embarazadas para la prevención de la DMG. Hasta la fecha, las revisiones Cochrane que evalúan el asesoramiento dietético solo y las intervenciones con ejercicios solos para la prevención de la DMG han revelado resultados no concluyentes (Han 2012; Tieu 2017). La revisión "Asesoramiento dietético en el embarazo para la prevención de la diabetes mellitus gestacional" (Tieu 2017) incluyó 11 ensayos y concluyó que aunque evidencia de muy baja calidad indica una posible reducción en el riesgo de DMG en las pacientes que recibieron asesoramiento dietético versus atención estándar, se necesita evidencia adicional de alta calidad para determinar los efectos de las intervenciones de asesoramiento dietético en el embarazo (Tieu 2017). La revisión "Ejercicio en embarazadas para prevenir la diabetes mellitus gestacional"(Han 2012), incluyó cinco ensayos y concluyó que no hubo evidencia clara que apoyara una reducción en el riesgo de DMG en las pacientes que recibieron una intervención con ejercicios versus atención estándar y destacó la necesidad de evidencia adicional de alta calidad(Han 2012).
Debido a que se reconoce ampliamente que muchos factores se asocian con el riesgo de DMG, se considera creíble que las intervenciones en el estilo de vida, encaminadas a corregir los factores de riesgo relacionados con el mismo, pueden ser efectivas para prevenir la DMG. Dichas intervenciones en el estilo de vida pueden combinar intervenciones en el régimen dietético con intervenciones con ejercicios.
Por qué es importante realizar esta revisión
La DMG se asocia con una amplia variedad de consecuencias adversas para la salud de las pacientes y sus hijos a corto y a largo plazo. Por lo tanto, se requieren estrategias eficaces para prevenir la DMG y las complicaciones asociadas. Esta revisión complementará las revisiones existentes tituladas "Asesoramiento dietético en el embarazo para la prevención de la diabetes mellitus gestacional" (Tieu 2017) y "Ejercicio en embarazadas para prevenir la diabetes mellitus gestacional (Han 2012) y evaluará intervenciones combinadas con ejercicios y régimen dietético para prevenir la DMG. Ésta es una actualización de la revisión publicada por primera vez en 2015(Bain 2015).
Objetivos
Evaluar los efectos de las intervenciones en el régimen dietético en combinación con intervenciones con ejercicios físicos en embarazadas para prevenir la diabetes mellitus gestacional (DMG) y las consecuencias adversas para la salud asociadas para la madre y su lactante / niño.
Métodos
Criterios de inclusión de estudios para esta revisión
Tipos de estudios
Se incluyeron todos los ensayos controlados aleatorios publicados que evaluaran los efectos de intervenciones combinadas con ejercicios y régimen dietético para la prevención de la diabetes mellitus gestacional (DMG). Se incluyeron los ensayos aleatorios grupales y los ensayos publicados como resúmenes solamente. Se excluyeron los ensayos controlados cuasialeatorios. Los ensayos cruzados no fueron aptos para inclusión.
Tipos de participantes
Se incluyeron los estudios con embarazadas, independientemente de la edad, la gestación, la paridad o la cantidad de fetos. Se excluyeron los estudios que incluyeron a pacientes con DMG tipo 1 o tipo 2 preexistente.
Tipos de intervenciones
Se incluyeron las intervenciones que incorporaron cualquier tipo de intervención en el régimen dietético con cualquier tipo de intervención con ejercicios. Se incluyeron los estudios en los que dichas intervenciones se compararon con ninguna intervención (es decir, atención estándar), y se programó incluirlos cuando se compararan con una intervención con ejercicios y régimen dietético diferente.
Tipos de medida de resultado
En esta actualización se utilizaron los resultados estándar acordados por consenso entre los autores de las revisiones sistemáticas del grupo Cochrane de Embarazo y Parto para prevenir y tratar la DMG y la diabetes preexistente.
Resultados primarios
Madre
-
DMG (criterios diagnósticos como se definieron en los ensayos individuales)
-
Trastornos hipertensivos del embarazo (p.ej. preeclampsia, hipertensión inducida por el embarazo, eclampsia)
-
Cesárea
Lactante
-
Mortalidad perinatal (mortinatalidad o mortalidad neonatal)
-
Tamaño grande para la edad gestacional
-
Resultado compuesto de mortalidad o morbilidad (p.ej. mortalidad, distocia de hombros, fractura ósea o parálisis nerviosa)
Resultados secundarios
Madre
Lactante
Servicios de salud
-
Número de visitas al hospital o al profesional de salud (p.ej. partera, obstetra, médico, dietista, enfermera especializada en diabetes)
-
Número de ingresos o visitas prenatales
-
Duración de la estancia prenatal
-
Ingreso en la unidad de cuidados intensivos neonatales
-
Duración de la estancia posnatal (madre)
-
Duración de la estancia posnatal (lactante)
-
Costos para las familias asociados con el tratamiento proporcionado
-
Costos asociados con la intervención
-
Costo de la atención materna
-
Costo de la atención del lactante
Para ser incluidos, los ensayos tenían que informar sobre el resultado primario de esta revisión, DMG. Los ensayos que parecieron cumplir otros criterios para la inclusión en esta revisión y no informaron sobre la DMG se incluyeron en la sección "En espera de clasificación" (pendiente de la disponibilidad/informe de datos de resultado de la DMG) y se volverán a considerar en las actualizaciones futuras de esta revisión.
Results
Description of studies
Results of the search
In the previous version of the review we identified 79 records relating to 41 studies. We included 13 trials, excluded 11, 16 were ongoing, and one was awaiting further classification. See Figure 1.

Updated searches of the Cochrane Pregnancy and Childbirth's Trials Register in February 2015 (28 records) and November 2016 (72 records) identified 100 new records; and additional searching identified 23 records. Therefore we assessed 123 new records.
We included 10 new trials (Bruno 2016; Hawkins 2014; Herring 2016; Hoirisch‐Clapauch 2016; Hui 2014; Jing 2015; Koivusalo 2016; Poston 2015; Sagedal 2017; Wang 2015), excluded nine studies (Barakat 2006; Bo 2014; Crowther 2012; McGowan 2013; Parat 2015; Peacock 2014; Simmons 2015; Sun 2016; Youngwanichsetha 2014), identified eight ongoing studies (Chasan‐Taber 2015; Clements 2016; Farajzadegan 2013; Garmendia 2015; Kennelly 2016; Rauh 2014; Spieker 2015; Vesco 2012), and eight await further classification (Asci 2016; Kieffer 2014; Kim 2015; Marcinkevage 2013; Mujsindi 2014; Santos‐Rocha 2015; Skouteris 2016; Torres 2016). We also identified additional records relating to nine of the trials included in the previous version of this review. See Figure 2.

Update study flow diagram.
Where required, we also re‐classified some of the studies/records which were listed as excluded, ongoing or awaiting classification in the previous version of the review.
Overall, therefore, we have included 23 trials (Asbee 2009; Bruno 2016; Dodd 2014; El Beltagy 2013; Harrison 2013; Hawkins 2014; Herring 2016; Hoirisch‐Clapauch 2016; Hui 2012; Hui 2014; Jing 2015; Koivusalo 2016; Korpi‐Hyovalti 2011; Luoto 2011; Petrella 2013; Phelan 2011; Polley 2002; Poston 2013; Poston 2015; Rauh 2013; Sagedal 2017; Vinter 2011; Wang 2015), excluded 15 studies (Barakat 2006; Bo 2014; Clapp 1997; Crowther 2012; Luoto 2010; McGowan 2013; Nascimento 2012; NCT00924599; Parat 2015; Peacock 2014; Quinlivan 2011; Ruchat 2012; Simmons 2015; Sun 2016; Youngwanichsetha 2014), 14 are ongoing (Chasan‐Taber 2015; Clements 2016; Farajzadegan 2013; Garmendia 2015; Jelsma 2013; Kennelly 2016; Nagle 2013; NCT01643356; NCT01693510; NCT01719406; NCT01782105; Rauh 2014; Spieker 2015; Vesco 2012), and 10 await further classification, pending the availability of data on GDM (Althuizen 2013; Asci 2016; Kieffer 2014; Kim 2015; Marcinkevage 2013; Mujsindi 2014; Santos‐Rocha 2015; Skouteris 2016; Torres 2016; Wilkinson 2012).
Included studies
Following application of eligibility criteria 23 randomised controlled trials were included in this review (Asbee 2009; Bruno 2016; Dodd 2014; El Beltagy 2013; Harrison 2013; Hawkins 2014; Herring 2016; Hoirisch‐Clapauch 2016; Hui 2012; Hui 2014; Jing 2015; Koivusalo 2016; Korpi‐Hyovalti 2011; Luoto 2011; Petrella 2013; Phelan 2011; Polley 2002; Poston 2013; Poston 2015; Rauh 2013; Sagedal 2017; Vinter 2011; Wang 2015). Two trials (Luoto 2011; Rauh 2013) were cluster‐randomised and the other 21 were individually‐randomised.
A total of 8918 women and 8709 infants were involved in the included trials. Dodd 2014 was the largest trial, randomising 2212 women, followed by Poston 2015, randomising 1280 women. Korpi‐Hyovalti 2011, Petrella 2013, Herring 2016 and Hawkins 2014 were the smallest trials randomising 60, 63, 66 and 68 women, respectively. For the majority of included trials, fewer women were included in the analyses than were randomised, with a maximum of 6633 women and 5763 infants included in review meta‐analyses.
Settings
The majority of the trials were conducted in upper‐middle and high‐income countries. Five trials were conducted in the USA (Asbee 2009; Hawkins 2014; Herring 2016; Phelan 2011; Polley 2002); three in Finland (Koivusalo 2016; Korpi‐Hyovalti 2011; Luoto 2011); two in Australia (Dodd 2014; Harrison 2013); two in the UK (Poston 2013; Poston 2015); two in Canada (Hui 2012; Hui 2014); two in Italy (Bruno 2016; Petrella 2013); two in China (Jing 2015; Wang 2015); and one each in Brazil (Hoirisch‐Clapauch 2016); Denmark (Vinter 2011); Egypt (El Beltagy 2013); Germany (Rauh 2013); and Norway (Sagedal 2017).
Participants
All participants were pregnant women. Where reported, the mean (standard deviation (SD)) ages of women ranged from 25.5 (4.8) years in Polley 2002 to 32.3 (4.9) (diet and exercise intervention) and 32.6 (4.5) (standard care) years in Koivusalo 2016. In eight of the trials (Bruno 2016; Harrison 2013; Koivusalo 2016; Petrella 2013; Poston 2013; Poston 2015; Rauh 2013; Wang 2015), the mean ages of women in both the diet and exercise intervention and standard care groups were at least 30 years. Maternal age across the trials is further summarised in Table 1.
| Study ID | Diet and exercise intervention | Control |
| Mean (SD): 26.7 (6.0) | Mean (SD): 26.4 (5.0) | |
| Mean (SD): 31.5 (5) | Mean (SD): 30.8 (5.5) | |
| Mean (SD): 29.3 (5.4) | Mean (SD): 29.6 (5.6) | |
| Not reported | Not reported | |
| Mean (SD): 32.4 (4.6) | Mean (SD): 31.7 (4.5) | |
| N (%) | N (%) | |
| Mean (SD): 25.9 (4.9) | Mean (SD): 25.0 (5.7) | |
| Not reported | Not reported | |
| Mean (SD): 30.1 (5.2) | Mean (SD): 28.7 (5.9) | |
| Mean (SD) BMI ≤ 24.9 kg/m²: 31 (3) BMI ≥ 25 kg/m²: 31 (4) | Mean (SD) BMI ≤ 24.9 kg/m²: 29 (6) BMI ≥ 25 kg/m²: 32 (5) | |
| Mean (SD): 29.57 (4.13) | Mean (SD): 29.89 (3.86) | |
| Mean (SD): 32.3 (4.9) | Mean (SD): 32.6 (4.5) | |
| Mean (SD): 29.1 (5.4) | Mean (SD): 29.8 (5.4) | |
| Mean (SD): 29.5 (4.8) | Mean (SD): 30.0 (4.7) | |
| Mean (SD): 31.5 (4.2) | Mean (SD): 32.4 (5.9) | |
| Mean (SD): 28.6 (5.2) | Mean (SD): 28.8 (5.2) | |
| Mean (SD): 25.5 (4.8) | ||
| Mean (SD): 30.4 (5.7) | Mean (SD): 30.7 (4.9) | |
| Mean (SD): 30.5 (5.5) | Mean (SD): 30.4 (5.6) | |
| Mean (SD): 32.2 (4.4) | Mean (SD): 30.8 (4.9) | |
| Mean (SD): 27.9 (4.2) | Mean (SD): 28.1 (4.5) | |
| Median (IQR): 29 (27 ‐ 32) | Median (IQR): 29 (26 ‐ 31) | |
| Mean (SD): 31.0 (3.8) | Mean (SD): 30.27 (3.64) | |
Abbreviations: BMI: body mass index; IQR: interquartile range; N: number; SD: standard deviation
In regards to body mass index (BMI), 13 of the trials (Asbee 2009; Hoirisch‐Clapauch 2016; Hui 2012; Hui 2014; Jing 2015; Koivusalo 2016; Korpi‐Hyovalti 2011; Luoto 2011; Phelan 2011; Polley 2002; Rauh 2013; Sagedal 2017; Wang 2015) generally included all women regardless of their BMI, though some had restrictions: four had a specific lower acceptable BMI (ranging from 18 kg/m² to 19.8 kg/m²) (Phelan 2011; Polley 2002; Rauh 2013; Sagedal 2017); and three had a specific upper acceptable BMI (of 25 kg/m²) (Wang 2015), (or 40 kg/m²) (Asbee 2009; Phelan 2011). The remaining 10 trials only included women who were overweight or obese (six trials: Bruno 2016; Dodd 2014; Harrison 2013; Hawkins 2014; Herring 2016; Petrella 2013); or obese (four trials: El Beltagy 2013; Poston 2013; Poston 2015; Vinter 2011). The BMI eligibility criteria are reflected in the mean (SD) or median (interquartile range (IQR)) BMI of women pre‐pregnancy or at baseline, which was reported in all except for two trials (El Beltagy 2013; Hoirisch‐Clapauch 2016), and is summarised in Table 2.
| Study ID | Diet and exercise intervention | Control |
| Mean (SD): 25.5 (6.0) [pre‐pregnancy] | Mean (SD): 25.6 (5.1) [pre‐pregnancy] | |
| Mean (SD): 33.3 (6) [pre‐pregnancy] Mean (SD): 34.5 (6.8) [baseline] | Mean (SD): 33.4 (5.5) [pre‐pregnancy] Mean (SD): 33.9 (5.7) [baseline] | |
| Median (IQR): 31.0 (28.1‐35.9) [baseline] | Median (IQR): 31.1 (27.7‐35.6) [baseline] | |
| Not reported (all women were obese) | Not reported (all women were obese) | |
| Mean (SD): 30.4 (5.6) [baseline] | Mean (SD): 30.3 (5.9) [baseline] | |
| N (%) [pre‐pregnancy] | N (%) [pre‐pregnancy] | |
| Mean (SD): 33.5 (5.8) [early pregnancy] | Mean (SD): 32.2 (5.4) [early pregnancy] | |
| Not reported | Not reported | |
| Mean (SD): 25.7 (5.1) [pre‐pregnancy] | Mean (SD): 24.9 (5.4) [pre‐pregnancy] | |
| Mean (SD) [pre‐pregnancy] BMI ≤ 24.9 kg/m²: 21.6 (2.2) BMI ≥ 25 kg/m²: 29.5 (5.1) | Mean (SD) [pre‐pregnancy] BMI ≤ 24.9 kg/m²: 22.6 (1.9) BMI ≥ 25 kg/m²: 29.7 (1.3) | |
| Mean (SD): 20.44 (2.54) [pre‐pregnancy] | Mean (SD): 20.44 (2.54); 20.74 (2.43) [pre‐pregnancy] | |
| Mean (SD): 31.5 (6.0) [pre‐pregnancy] Mean (SD): 32.2 (5.9) [baseline] | Mean (SD): 32.0 (5.5) [pre‐pregnancy] Mean (SD): 32.3 (5.4) [baseline] | |
| Mean (SD): 27.3 (6.0) [baseline] | Mean (SD): 25.5 (3.4) [baseline] | |
| Mean (SD): 26.3 (4.9) [pre‐pregnancy] | Mean (SD): 26.4 (4.3) [pre‐pregnancy] | |
| Mean (SD): 32.1 (5) [baseline] | Mean (SD): 32.9 (6.2) [baseline] | |
| Mean (SD): 26.32 (5.6) [baseline] | Mean (SD): 26.48 (5.9) [baseline] | |
| Mean (SD) [pre‐pregnancy] Normal weight: 22.8 (1.9) Overweight: 31.4 (6.0) | Mean (SD) [pre‐pregnancy] Normal weight: 22.5 (2.0) Overweight: 34.1 (7.2) | |
| Mean (SD): 36.5 (4.7) [baseline] | Mean (SD): 36.1 (4.8) [baseline] | |
| Mean (SD): 36.3 (5.0) [baseline] | Mean (SD): 36.3 (4.6) [baseline] | |
| Median (IQR): 21.7 (19.9 ‐ 23.7) [pre‐pregnancy] Median (IQR): 22.2 (20.7 ‐ 24.3) [booking] | Median (IQR): 22.8 (20.6 ‐ 26.6) [pre‐pregnancy] Median (IQR): 23.3 (21.2 ‐ 26.8) [booking] | |
| Mean (SD): 23.8 (4.1) [pre‐pregnancy] | Mean (SD): 23.5 (3.7) [pre‐pregnancy] | |
| Median (IQR): 33.4 (31.7 ‐ 36.5) | Median (IQR): 33.3 (31.7 ‐ 36.9) | |
| Mean (SD): 22.95 (3.65) [pre‐pregnancy] | Mean (SD): 23.06 (3.63) [pre‐pregnancy] |
Abbreviations: BMI: body mass index; IQR: interquartile range; N: number; SD: standard deviation
Considering ethnicity, three trials included women predominately of ethnicities regarded to be at high risk for GDM (Asbee 2009: more than 75% of women were Hispanic or African American; Hawkins 2014: all women were Hispanic; Herring 2016: all women were African American), while five trials included women predominately of ethnicities at lower risk of GDM (Bruno 2016: more than 80% of women were Caucasian; Dodd 2014: more than 90% of women were Caucasian; Petrella 2013: more than 75% were Caucasian; Phelan 2011: more than 68% of women were non‐Hispanic white; Vinter 2011: all women were Caucasian). In seven trials ethnicity was considered 'mixed' or there was insufficient information to confidently determine ethnicity (Harrison 2013 reported only on country of birth (Australia, Southeast Asia, Southern/Central Asia, other); Hui 2012 and Hui 2014 reported only that approximately 20% of women were First Nations (Canadian Aboriginal people with First Nations status); Polley 2002, Poston 2013 and Poston 2015 only reported on the proportion of women who were 'Black' or 'White' (or 'Asian', or 'Other'); and Rauh 2013 only reported that over 80% of women were born in Germany). In eight trials, no baseline information related to the ethnicity/race/country of birth of women was reported (El Beltagy 2013; Hoirisch‐Clapauch 2016; Jing 2015; Koivusalo 2016; Korpi‐Hyovalti 2011; Luoto 2011; Sagedal 2017; Wang 2015). Information related to ethnicity is further summarised in Table 3.
| Study ID | Diet and exercise intervention | Control |
| N (%) | N (%) | |
| N (%) Caucasian: 79 (82.3) | N (%) Caucasian: 78 (82.1) | |
| N (%) | N (%) White: 998 (91.0) | |
| Not reported (conducted in Egypt) | Not reported (conducted in Egypt) | |
| Country of birth, N (%) | Country of birth, N (%) | |
| N (%) Hispanic: 33 (100) | N (%) Hispanic: 35 (100) | |
| N (%) African American: 33 (100) | N (%) African American: 33 (100) | |
| Not reported | Not reported | |
| N (%) | N (%) | |
| First Nations (Canadian Aboriginals with First Nations status), N (%) BMI ≤ 24.9 kg/m²: 2 (6.7) BMI ≥ 25 kg/m²: 3 (11.1) | First Nations (Canadian Aboriginals with First Nations status), N (%) BMI ≤ 24.9 kg/m²: 1 (3.7) BMI ≥ 25 kg/m²: 4 (13.8) | |
| Not reported (conducted in China) | Not reported (conducted in China) | |
| Not reported (conducted in Finland) | Not reported (conducted in Finland) | |
| Not reported (conducted in Norway) | Not reported (conducted in Norway) | |
| Not reported (conducted in Finland) | Not reported (conducted in Finland) | |
| N (%) Caucasian: 28 (84.9) Maghreb: 4 (12.1) Other: 1 (3.0) | Caucasian: 20 (66.7) Maghreb: 6 (20) Other: 4 (13.3) | |
| N (%) Non‐Hispanic White: 138 (68.7) Latina and Hispanic: 39 (19.6) Non‐Hispanic African American: 14 (7.1) Other: 9 (4.6) | N (%) Latina and Hispanic: 39 (19.6) Non‐Hispanic African American: 19 (9.6) Other: 7 (3.3) | |
| N (%) Black: 47 (39) White 73 (61) | ||
| N (%) White: 52 (55) Black: 38 (40) Asian: 2 (2) Other: 2 (2) | N (%) White: 51 (57) Black: 32 (26) Asian: 1 (1) Other: 5 (6) | |
| N (%) White: 490 (63) Black: 202 (26) Asian: 47 (6) Other: 44 (6) | N (%) Black: 200 (26) Asian: 48 (6) Other: 41 (5) | |
| Country of birth, N (%) Germany: 140 (83.8) Others: 27 (16.2) | Country of birth, N (%) Germany: 68 (81.9) Others: 15 (18.1) | |
| Not reported (conducted in Norway) | Not reported (conducted in Norway) | |
| N (%) | N (%) Caucasian: 154 (100) | |
| Not reported (conducted in China) | Not reported (conducted in China) | |
Abbreviations: N: number
Only one trial (Sagedal 2017) reported eligibility criteria relating to parity ‐ including only nulliparous women. Both nulliparous and multiparous women were included in the remaining trials (Asbee 2009; Bruno 2016; Dodd 2014; Harrison 2013; Hawkins 2014; Herring 2016; Koivusalo 2016; Korpi‐Hyovalti 2011; Luoto 2011; Petrella 2013; Phelan 2011; Polley 2002; Poston 2013; Poston 2015; Rauh 2013; Vinter 2011), though six trials did not report clearly report baseline information related to parity (El Beltagy 2013; Hoirisch‐Clapauch 2016; Hui 2012; Hui 2014; Jing 2015; Wang 2015). Detailed information relating to parity is reported in Table 4.
| Study ID | Diet and exercise intervention | Control |
| N (%) | N (%) | |
| N (%) 0: 53 (55.2) | N (%) 0: 59 (62.1) | |
| N (%) 0: 441 (40.2) | N (%) 0: 441 (40.2) | |
| Not reported | Not reported | |
| N (%) | N (%) | |
| N (%) | N (%) | |
| N (%): 0: 9 (27) | N (%): 0: 10 (30) | |
| Not reported | Not reported | |
| Not reported | Not reported | |
| Not reported | Not reported | |
| Not reported | Not reported | |
| Previous deliveries, N (%) | Previous deliveries, N (%) | |
| N (%) 0: 13 (50) | N (%) 0: 17 (63) | |
| N (%) 0: 103 (47.0) | N (%) 0: 73 (40.6) | |
| N (%) 0: 13 (39.4) | N (%) 0: 13 (43.3) | |
| N (%) 0: 153 (76.3) ≥ 1: 48 (23.7) | N (%) 0: 153 (76.6) ≥ 1: 47 (23.4) | |
| N (%) First pregnancy: 56 (47) Second pregnancy: 36 (30) Third pregnancy: 20 (17) > third pregnancy: 7 (6) | ||
| N (%) 0: 42 (45) 1: 29 (31) ≥ 2: 23 (24) | N (%) 0: 38 (43) 1: 36 (40) ≥ 2: 15 (17) | |
| N (%) 0: 336 (43) ≥ 1: 447 (57) | N (%) 0: 338 (44) ≥ 1: 434 (56) | |
| N (%) 0: 110 (65.9) 1: 50 (29.9) ≥ 2: 7 (4.2) | N (%) 0: 53 (63.9) 1: 23 (27.7) ≥ 2: 7 (8.4) | |
| N (%) 0: 303 (100) | N (%) 0: 303 (100) | |
| N (%) 0: 79 (52.7) | N (%) 0: 84 (54.6) | |
| Not reported | Not reported | |
Abbreviations: N: number
Interventions
Each of the 23 included trials assessed an intervention that included both diet and exercise components compared with standard/routine antenatal care and reported on GDM. However, the primary focus of many of the included trials was on limiting gestational weight gain. The interventions assessed varied greatly, as can be seen below.
-
Asbee 2009: an intensive‐lifestyle intervention consisting of an initial standardised counselling session delivered one‐on‐one in person by a dietitian in which women were provided with dietary advice, instructed to engage in moderate‐intensity exercise at least three times a week and educated about the Institute of Medicine (IOM) guidelines for gestational weight gain, supported by personalised monitoring and feedback at follow‐up at routine visits.
-
Bruno 2016: diet and exercise counselling provided in one one‐on‐one session by a dietitian at baseline (a hypocaloric, low‐glycaemic, low‐saturated fat diet and 30 minutes of moderate‐intensity exercise at least three times a week were recommended) with monitoring of progress on lifestyle changes and further individually‐tailored lifestyle advice by the dietitian and gynaecologist at routine antenatal appointments (16th, 20th, 25th and 36th weeks of pregnancy).
-
Dodd 2014: a comprehensive individually‐tailored lifestyle intervention that included a combination of diet and exercise advice and behavioural change strategies, delivered by a research dietitian and trained research assistants in three one‐on‐one face‐to‐face sessions (at entry, 28 and 36 weeks), and three phone sessions (at 22, 24 and 32 weeks).
-
El Beltagy 2013: a 12‐week mild exercise and diet control program (no further details provided in the conference abstract of this trial).
-
Harrison 2013: a personalised intervention delivered by a health coach (exercise physiologist) in four one‐on‐one sessions scheduled at the same time as routine visits (in which women were provided with individually‐tailored advice about diet and encouraged to increase exercise frequency) plus strategies to support behaviour change including self‐monitoring (pedometers provided).
-
Hawkins 2014: an intensive, personalised intervention tailored for Hispanic women consisting of six one‐on‐one face‐to‐face counselling sessions (individually‐tailored advice about diet provided and women advised to undertake at least 30 minutes of moderate‐intensity activity most days of the week to achieve the American College of Obstetricians and Gynecologists guidelines for gestational weight gain) and strategies to support adherence and behaviour change (including five telephone "booster" counselling sessions, pedometers and a exercise log books).
-
Herring 2016: a technology‐based intervention delivered via Facebook, telephone and text messaging and one one‐to‐one consultation (at baseline) tailored for African American women living in low‐income settings consisting of diet and exercise advice (including the recommendation that women increase activity to walking 5000 steps daily), distribution of digital scales for weighing food at home, strategies to support adherence (pedometers and a DVD walking video), and ongoing support via telephone and other technology platforms.
-
Hoirisch‐Clapauch 2016: diet and exercise advice (women were instructed to walk briskly for at least 40 minutes seven days a week, to avoid high‐carbohydrate index meals, e.g. such as snacks, candies, fibre‐free juices or sugar‐sweetened beverages, and to eat two daily servings of meat, poultry, fish or other protein‐rich food, starting when they decided to get pregnant and continuing until birth).
-
Hui 2012 and Hui 2014: an intensive lifestyle intervention consisting of mild to moderate exercise three to five times a week (group sessions in community centres or if not feasible, at home supported by a DVD) plus one‐on‐one diet counselling sessions (two, with a registered dietitian, providing individually‐tailored diet advice) and self‐monitoring of gestational weight gain goals.
-
Jing 2015: a moderate‐intensity intervention consisting of two one‐on‐one in person counselling sessions (with a trained graduate student) on a healthy diet and exercise regimen to follow during pregnancy, education about the benefits of a healthy lifestyle and harms of GDM (materials written by trial staff provided) as well as ongoing communication and support for behaviour change (provided through telephone or Tencent instant messenger).
-
Koivusalo 2016: an intensive lifestyle‐counselling intervention delivered via an initial two‐hour group counselling session (at enrolment) followed by three one‐to‐one in person counselling sessions delivered by trained trial nurses and dietitians supplemented by various strategies to support adherence to the diet and exercise recommendations and weight gain goals including self‐monitoring of behaviour (including via food diaries, activity log books and pedometers) and provision of free access to swimming pools and exercise classes of local municipalities.
-
Korpi‐Hyovalti 2011: an intensive lifestyle‐counselling intervention that included six one‐to‐one sessions with a nurse in which women were provided with personalised diet advice to follow during their pregnancy, as well as six sessions with a physiotherapist (in which women were encouraged to exercise 30 minutes daily if they had previously exercised less than two and a half hours per week, and 45 minutes if they had already engaged in two and a half hours per week).
-
Luoto 2011: an intensive lifestyle counselling delivered by nurses in five face‐to‐face, one‐on‐one counselling sessions (in session one gestational goals were set, women were provided with a notebook for monitoring and exercise recommendations were introduced, including participation in a monthly group exercise class, in the second session the healthy diet was introduced, sessions three reinforced the messages and focused on monitoring).
-
Petrella 2013: a Therapeutic Lifestyle Changes (TLC) program including a diet of 1700 kcal/day for overweight women and 1800 kcal/day for obese women and mild exercise (30 min/day, three times/week), introduced at randomisation by both a gynaecologist and a dietitian, and further detailed at a subsequent one‐hour appointment, with pedometers to support adherence.
-
Phelan 2011: an intensive individually‐tailored intervention consisting of one face‐to‐face visit during the first trimester delivered by a dietitian (focused on appropriate gestational weight gain, what constitutes a healthy diet during pregnancy. the benefits of walking 30 minutes walking most days of the week during pregnancy and the importance of daily self‐monitoring of eating, exercise, and weight gain) followed by three phone calls from the dietitian to support adherence and provide further tailored advice (women who were over or under weight gain guidelines during any one month interval received additional phone calls that provided structured meal plans, and specific goals).
-
Polley 2002: a lifestyle intervention consisting of education about appropriate gestational weight gain (as per the IOM guidelines), personalised advice about diet and exercise, as well as weight monitoring, delivered at regularly schedule clinic visits by masters and doctoral level staff with training in nutrition or clinical psychology and bi‐weekly provision of written education materials/reminders.
-
Poston 2013 and Poston 2015: a comprehensive intensive lifestyle change intervention that delivered via a one‐to‐one appointment with a"Health Trainer" (no specific health professional qualification, but experience in behaviour modification and conducting group sessions) and weekly group sessions for eight consecutive weeks from 19 weeks gestation (for women unable to attend, the session content was delivered by phone or email) which included diet advice (focus on substituting high‐ with low‐GI foods), exercise advice (women encouraged to undertake frequent walking at moderate intensity) as well as goal setting for diet and exercise and strategies to support achieving them (e.g. self‐monitoring through use of a pedometer and log‐book and provision of a DVD of a specifically devised pregnancy exercise regimen).
-
Rauh 2013: the Feasibility of a Lifestyle Intervention in Pregnancy to Optimise maternal weight development (FeLIPO) intervention consisting of two one‐to‐one lifestyle‐counselling sessions with trained researchers (in which women were educated about healthy gestational weight gain as per IOM guidelines, given diet and exercise advice to follow to achieve weight gain goals, including the recommendation of engaging in at least 30 minutes moderate‐intensity exercise most days of the week, and were provided with a list of suitable local prenatal exercise programs to attend) plus strategies to support behaviour change (including self‐monitoring through use of charts).
-
Sagedal 2017: the Norwegian Fit for Delivery (NFFD) intervention consisting of an intensive exercise program that included participation in group‐based exercise classes (moderate‐intensity exercise) twice a week and additional moderate‐intensity exercise three days of the week, diet advice (delivered via telephone by experienced clinical dietitians or graduate students), education focused on the IOM guidelines for gestational weight gain and strategies to support adherence to the lifestyle recommendations (including written materials reinforcing the recommendations, an invitation to one cooking class and one evening meeting).
-
Vinter 2011: intensive individually‐tailored intervention (women in the intervention group received a free six‐month gym membership and pedometer, were encouraged to attend exercise classes with a physiotherapist weekly and four to six group coaching sessions, plus individually‐tailored diet counselling with trained dietitians on four occasions, at 15, 20, 28, and 35 weeks gestation).
-
Wang 2015: a standardised group‐based lifestyle intervention that included three education sessions of 40 to 60 minutes on "a balanced diet" during pregnancy, the benefits of proper exercise (women were encouraged to walk at least 30 minutes walking after a meal at least once a day) and appropriate gestational weight gain (defined according to the IOM recommendations).
For additional details on the diet and exercise interventions (and controls) and how they varied across the trials see Characteristics of included studies.
Outcomes
For the primary outcomes for the mother, data in a format suitable for meta‐analysis were reported for GDM by 19 trials (Bruno 2016; Dodd 2014; Harrison 2013; Herring 2016; Hui 2012; Hui 2014; Jing 2015; Koivusalo 2016; Korpi‐Hyovalti 2011; Luoto 2011; Petrella 2013; Phelan 2011; Polley 2002; Poston 2013; Poston 2015; Rauh 2013; Sagedal 2017; Vinter 2011; Wang 2015), pre‐eclampsia by eight trials (Dodd 2014; Koivusalo 2016; Luoto 2011; Phelan 2011; Polley 2002; Poston 2015; Sagedal 2017; Vinter 2011), hypertension by six trials (Bruno 2016; Dodd 2014; Koivusalo 2016; Petrella 2013; Phelan 2011; Polley 2002), and caesarean section by 14 trials (Asbee 2009; Bruno 2016; Dodd 2014; Herring 2016; Hui 2012; Hui 2014; Koivusalo 2016; Petrella 2013; Phelan 2011; Polley 2002; Poston 2015; Rauh 2013; Sagedal 2017; Vinter 2011). For the primary outcomes for the child, data were reported in a format suitable for meta‐analysis by two trials for perinatal mortality (Dodd 2014; Poston 2015) and 11 trials for large‐for‐gestational age (Bruno 2016; Dodd 2014; Herring 2016; Hui 2012; Hui 2014; Luoto 2011; Poston 2013; Poston 2015; Rauh 2013; Sagedal 2017; Vinter 2011); no trial reported on mortality or morbidity composite (e.g. death, shoulder dystocia, bone fracture or nerve palsy).
Some data were reported for all secondary outcomes for the mother in the perinatal period, with between one and 17 included trials reporting data suitable for meta‐analyses or other data tables for these outcomes. However in regards to long‐term outcomes for the mother, data were only available for postnatal weight retention or return to pre‐pregnancy weight, BMI and cardiovascular health (blood pressure); no data were reported by the included trials for postnatal depression; GDM in a subsequent pregnancy; type 1 diabetes mellitus; type 2 diabetes mellitus or impaired glucose tolerance. Similarly, some data were reported for all secondary outcomes for the child in the fetal/neonatal period, with one, up to 13 included trials reporting data suitable for meta‐analyses for these outcomes. However in regards to childhood/adulthood outcomes, data were only available for weight, height, head circumference, adiposity and cardiovascular health; no data were reported by the included trials for employment, education and social status/achievement; type 1 diabetes mellitus; type 2 diabetes mellitus; impaired glucose tolerance; or neurosensory disability. Secondary outcomes related to health services were generally reported by only one to four included trials for included in meta‐analyses; no trial reported data for the outcome number of hospital or health professional visits.
Funding
Funding sources were reported by 18 included trials (Asbee 2009; Bruno 2016; Dodd 2014; Harrison 2013; Hawkins 2014; Herring 2016; Hui 2012; Hui 2014; Koivusalo 2016; Korpi‐Hyovalti 2011; Luoto 2011; Phelan 2011; Polley 2002; Poston 2013; Poston 2015; Rauh 2013; Sagedal 2017; Vinter 2011); funding bodies listed by the trials were all non‐commercial organisations (e.g. government funding bodies, health services, and other not‐for‐profit foundations). Five trials did not describe sources of funding (if any) (El Beltagy 2013; Hoirisch‐Clapauch 2016; Jing 2015; Petrella 2013; Wang 2015).
Declarations of interest
Sixteen of the trials (Asbee 2009; Bruno 2016; Dodd 2014; Harrison 2013; Hawkins 2014; Hui 2012; Hui 2014; Jing 2015; Koivusalo 2016; Korpi‐Hyovalti 2011; Luoto 2011; Petrella 2013; Phelan 2011; Poston 2013; Rauh 2013; Vinter 2011) reported that there were no conflicts of interests for any of the authors. Four trials (El Beltagy 2013; Hoirisch‐Clapauch 2016; Polley 2002; Wang 2015) did not report any information regarding declarations of interest. The remaining three trials (Herring 2016; Poston 2015; Sagedal 2017) reported information related to potential conflicts of interest for the trial authors, primarily related to income received from pharmaceutical companies/other commercial organisations. For further detail of these reported declarations, see Characteristics of included studies.
Excluded studies
We excluded 15 studies (Barakat 2006; Bo 2014; Clapp 1997; Crowther 2012; Luoto 2010; McGowan 2013; Nascimento 2012; NCT00924599; Parat 2015; Peacock 2014; Quinlivan 2011; Ruchat 2012; Simmons 2015; Sun 2016; Youngwanichsetha 2014). Seven trials assessed the effects of diet (Clapp 1997; McGowan 2013; Parat 2015; Quinlivan 2011) or exercise (Barakat 2006; Nascimento 2012; Ruchat 2012) interventions (not combined diet and exercise interventions), and one compared a diet and exercise intervention with a diet alone intervention and an exercise alone intervention (Simmons 2015). In five trials, the participants were women preconception (NCT00924599), or women with GDM (Bo 2014; Peacock 2014; Youngwanichsetha 2014) or borderline GDM (Crowther 2012). One trial was non‐randomised (Luoto 2011) and one was quasi‐randomised (Sun 2016).
Risk of bias in included studies
For a summary of the risk of bias across the included trials, see Figure 3 and Figure 4. Primarily due to lack of reporting, the overall risk of bias was judged to be unclear.

'Risk of bias' graph: review authors' judgements about each risk of bias item presented as percentages across all included trials.
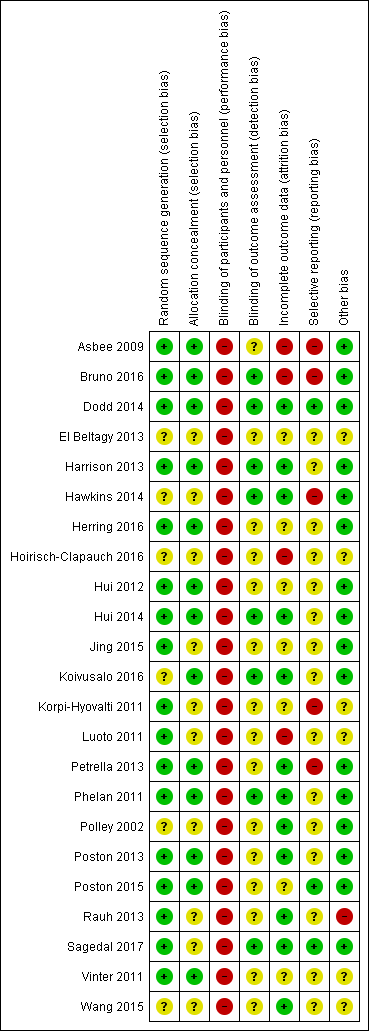
'Risk of bias' summary: review authors' judgements about each risk of bias item for each included trial.
Allocation
Methods to generate the random sequence were judged to be adequate in 17 of the 23 included trials (Asbee 2009; Bruno 2016; Dodd 2014; Harrison 2013; Herring 2016; Hui 2012; Hui 2014; Jing 2015; Korpi‐Hyovalti 2011; Luoto 2011; Petrella 2013; Phelan 2011; Poston 2013; Poston 2015; Rauh 2013; Sagedal 2017; Vinter 2011), all using computer‐generated random number lists/tables. In the remaining six trials (El Beltagy 2013; Hawkins 2014; Hoirisch‐Clapauch 2016; Koivusalo 2016; Polley 2002; Wang 2015), the risk of selection bias associated with sequence generation was judged to be unclear, with insufficient information provided.
Thirteen trials (Asbee 2009; Bruno 2016; Dodd 2014; Harrison 2013; Herring 2016; Hui 2012; Hui 2014; Koivusalo 2016; Petrella 2013; Phelan 2011; Poston 2013; Poston 2015; Vinter 2011) were judged to have used adequate methods for allocation concealment. Of these, 10 (Asbee 2009; Bruno 2016; Harrison 2013; Herring 2016; Hui 2012; Hui 2014; Koivusalo 2016; Petrella 2013; Phelan 2011; Vinter 2011;) reported using sealed envelopes (with varying detail provided regarding these envelopes being consecutively numbered, opaque etc.) and three (Dodd 2014; Poston 2013; Poston 2015) used centralised phone or online randomisation services. For the remaining 10 trials (El Beltagy 2013; Hawkins 2014; Hoirisch‐Clapauch 2016; Jing 2015; Korpi‐Hyovalti 2011; Luoto 2011; Polley 2002; Rauh 2013; Sagedal 2017; Wang 2015), the risk of selection bias was judged to be unclear, with no methods detailed, or the reported methods lacking sufficient detail.
Blinding
In all 23 trials Asbee 2009; Bruno 2016; Dodd 2014; El Beltagy 2013; Harrison 2013; Hawkins 2014; Herring 2016; Hoirisch‐Clapauch 2016; Hui 2012; Hui 2014; Jing 2015; Koivusalo 2016; Korpi‐Hyovalti 2011; Luoto 2011; Petrella 2013; Phelan 2011; Polley 2002; Poston 2013; Poston 2015; Rauh 2013; Sagedal 2017; Vinter 2011; Wang 2015), the risk of performance bias, due to inadequate blinding of women and/or trial personnel, was judged to be high. While for some trials, lack of blinding was specifically stated, for others, no information was provided. While some of the trials suggested that women and/or trial personnel were blinded, in view of the interventions assessed, it was considered unlikely that this would have been successfully achieved.
Considering blinding of outcome assessors, only eight trials (Bruno 2016; Dodd 2014; Harrison 2013; Hawkins 2014; Hui 2014; Koivusalo 2016; Phelan 2011; Sagedal 2017) clearly indicated that blinded trial personnel were involved in outcome assessment or data collection, and were judged to be at low risk of detection bias. For the remaining 15 trials, the risk of detection bias was judged to be unclear (Asbee 2009; El Beltagy 2013; Herring 2016; Hoirisch‐Clapauch 2016; Hui 2012; Jing 2015; Korpi‐Hyovalti 2011; Luoto 2011; Petrella 2013; Polley 2002; Poston 2013; Poston 2015; Rauh 2013; Vinter 2011; Wang 2015), with many of the trials not clearly detailing whether it was possible to blind outcome assessors.
Incomplete outcome data
Twelve trials (Dodd 2014; Harrison 2013; Hawkins 2014; Hui 2014; Koivusalo 2016; Petrella 2013; Phelan 2011; Polley 2002; Poston 2013; Rauh 2013; Sagedal 2017; Wang 2015) were judged to be at a low risk of attrition bias, with minimal losses to follow‐up, and similar numbers/reasons for losses between groups. For four trials (Asbee 2009; Bruno 2016; Hoirisch‐Clapauch 2016; Luoto 2011), the risk of bias due to incomplete outcome data was judged to be high. In Asbee 2009, of the 144 women randomised, 100 (69%) were included in the analyses; further, the number of women excluded from each group was not reported; in Bruno 2016, of the 191 women randomised, 131 (69%) were included in the analyses; women lost to follow‐up differed from those included in the analyses on a number of characteristics; in Hoirisch‐Clapauch 2016, of the 480 women randomised, 319 (66%) completed the trial; and in Luoto 2011, of the 634 women who agreed to participate, 399 (63%) were followed up (and, for a number of outcomes "number missing" is reported in the manuscript tables, however it was not clear from which groups the data were missing).
The remaining seven trials (El Beltagy 2013; Herring 2016; Hui 2012; Jing 2015; Korpi‐Hyovalti 2011; Poston 2015; Vinter 2011) were judged to be at an unclear risk of attrition bias. In two of the trials (Herring 2016; Korpi‐Hyovalti 2011), losses/exclusions of approximately 10% were considered relatively high in small samples (66 and 60, respectively); in one trial (Vinter 2011), of 360 women randomised, a maximum of 304 (84%) were included in the analyses; in three trials (Hui 2012; Jing 2015; Poston 2015) there was some concern regarding differential losses/exclusions between groups; the final trial (El Beltagy 2013), was reported in abstract form only, with insufficient information to determine losses/exclusions.
Judgements regarding risk of attrition bias were primarily made considering the main trial period and the assessment of perinatal and fetal/neonatal clinical outcomes (not longer‐term maternal or child follow‐up, where reported).
Selective reporting
Only three trials (Dodd 2014; Poston 2015; Sagedal 2017) were judged to be at low risk of reporting bias, providing data for pre‐specified and/or expected outcomes (including from the published protocols). Fifteen trials were judged to be at an unclear risk of reporting bias (El Beltagy 2013; Harrison 2013; Herring 2016; Hoirisch‐Clapauch 2016; Hui 2012; Hui 2014; Jing 2015; Koivusalo 2016; Luoto 2011; Phelan 2011; Polley 2002; Poston 2013; Rauh 2013; Vinter 2011; Wang 2015). For the majority of these trials, there was insufficient information to confidently assess selective reporting (i.e. no access to a published trial protocol).
The remaining five trials (Asbee 2009; Bruno 2016; Hawkins 2014; Korpi‐Hyovalti 2011; Petrella 2013) were judged to be at a high risk of reporting bias. Outcomes in Asbee 2009 were not clearly pre‐specified in the methods; while the results section detailed a number of outcomes, no outcome data were reported: "no statistically significant differences were noted between the groups". In Bruno 2016, for a number of outcomes, it was only reported that there "were very few and did not differ between groups".Hawkins 2014 reported very limited clinical data and reported GDM incompletely in the text, providing only the number of cases across both groups. Korpi‐Hyovalti 2011 reported P values for baseline characteristics, and a number of outcomes only as "NS", and for some outcomes, made statements made such as "There was no statistically significant difference between the randomised groups in terms of pre‐eclampsia, induction of labor, lacerations, Cesarean deliveries (data not shown)".Petrella 2013 reported a number of outcomes incompletely in the text as "similar" or described "no statistically significant differences" between groups.
Other potential sources of bias
Sixteen trials (Asbee 2009; Bruno 2016; Dodd 2014; Harrison 2013; Hawkins 2014; Herring 2016; Hui 2012; Hui 2014; Jing 2015; Koivusalo 2016; Petrella 2013; Phelan 2011; Polley 2002; Poston 2013; Poston 2015; Sagedal 2017) were judged to be at a low risk of potential sources of other bias. In one trial (Rauh 2013), significant baseline imbalance between groups existed in maternal pre‐pregnancy weight, pre‐pregnancy BMI and maternal median weight at the first antenatal appointment. In the same trial (Rauh 2013), the authors also reported that it was easier to recruit women for the diet and exercise intervention group than for the standard care group (and accordingly, the group numbers are imbalanced in a 2:1 ratio); thus, this trial (Rauh 2013) was judged to be at high risk of other bias. For the remaining six trials (El Beltagy 2013; Hoirisch‐Clapauch 2016; Korpi‐Hyovalti 2011; Luoto 2011; Vinter 2011; Wang 2015), the risk of other bias was judged to be unclear, due to, for example, possible baseline imbalances between groups (Korpi‐Hyovalti 2011; Luoto 2011; Vinter 2011), or insufficient methodological information available to confidently assess other sources of bias (El Beltagy 2013; Hoirisch‐Clapauch 2016; Wang 2015).
Effects of interventions
See: Summary of findings for the main comparison Combined diet and exercise interventions versus standard care (mother); Summary of findings 2 Combined diet and exercise interventions versus standard care (child)
Combined diet and exercise interventions versus standard care
Primary outcomes
Mother
GDM
There was a possible reduced risk of gestational diabetes mellitus (GDM) in the diet and exercise intervention group compared with the standard care group (average risk ratio (RR) 0.85, 95% confidence interval (CI) 0.71 to 1.01; 6633 participants; 19 trials; Tau² = 0.05; I² = 42%; P = 0.07; moderate‐quality evidence) (Analysis 1.1). The screening/diagnostic tests and criteria used across the 19 trials are reported in Table 5. Three of the trials (Harrison 2013; Luoto 2011; Vinter 2011) reported data for GDM according to additional diagnostic criteria (see Table 5). While we have included the data from the main/pre‐specified criteria reported by the trials in the meta‐analysis, when we substituted results for the additional criteria provided into the meta‐analysis for this outcome, the overall result remained largely unchanged. No obvious asymmetry was observed on visual assessment of a funnel plot for this outcome (Figure 5).

Funnel plot of comparison: 1 Diet and exercise interventions versus control, outcome: 1.1 Gestational diabetes.
| Study ID | Timing | Screening/diagnosis test(s) and glucose threshold(s) used for diagnosis | Reference(s) | Notes |
| Not reported | Not reported | Not provided | Data not provided in format suitable for meta‐analysis | |
| 16th to 18th weeks; repeated in 24th to 28th weeks for women negative at first test | 75 g 2‐hour OGTT Thresholds: fasting ≥ 5.1 mmol/L and/or 1‐hour ≥ 10.0 mmol/L and/or 2‐hour ≥ 8.5 mmol/L | "IADPSG criteria" (no reference provided) | ||
| Not reported | "all women were encouraged to undergo screening" 75 g 2‐hour OGTT Thresholds: fasting ≥ 5.5 mmol/L or 2‐hour ≥ 7.8 mmol/L | South Australian Perinatal Practice Guidelines 2013 (South Australian Perinatal Practice Guidelines: diabetes mellitus and abnormal glucose tolerance Government of Australia, SA Health, 2013. www.health.sa.gov.au/ppg/Default. | ||
| 24 to 28 weeks | "All women underwent routine GDM screening" | Not provided | Data not provided in format suitable for meta‐analysis | |
| 28 weeks | 2‐hour OGTT Thresholds: fasting ≥ 5.5 mmol/L and/or 2‐hour ≥ 8.0 mmol/L OR Thresholds: fasting ≥ 5.1 mmol/L and/or 1‐hour ≥ 10.0 mmol/L and/or 2‐hour ≥ 8.5 mmol/L | ADIPS 1998 (Hoffmann L, Nolan C, Wilson JD, Oats JJN, Simmons D. Gestational diabetes mellitus: management guidelines. MJA 1998;169:93–7.) OR IADPSG 2010 (Metzger BE, Gabbe SG, Persson B, et al. International association of diabetes and pregnancy study groups recommendations on the diagnosis and classification of hyperglycaemia in pregnancy. Diabetes Care 2010;33:676–82.) | Data in meta‐analysis according to IADPSG 2010 criteria [groups Ns not reported for ADIPS 1998 criteria] | |
| 24 to 28 weeks gestation | 50 g 1‐hour OGTT Thresholds: 1‐hour > 7.493 mmol/L 100 g 3‐hour OGTT Thresholds: not reported | American Diabetes Association 2012 (American Diabetes Association. Standards of medical care in diabetes–2012. Diabetes Care 2012; 35(Suppl. 1): S11–63.) | Data not provided in format suitable for meta‐analysis | |
| Not reported | Not reported | Not provided | ||
| Not reported | Not reported | Not provided | Data not provided in format suitable for meta‐analysis | |
| Not reported | Not reported | Canadian Diabetes Association 2008 (Canadian Diabetes Association. 2008 Clinical practice guidelines for the prevention and management of diabetes in Canada. Can J Diabetes 2008;32:S168–80.) | ||
| Not reported | Not reported | Canadian Diabetes Association 2008 (Canadian Diabetes Association, Clinical Practice Guidelines Committee, Canadian Diabetes Association: 2008 Clinical Practice Guidelines for the Prevention and Management of Diabetes in Canada. Can J Diabetes Care 2008, 32:S1:171.) | ||
| Not reported | Not reported | Not provided | ||
| 24 to 28 weeks | 75 g 2‐hour OGTT Thresholds: fasting ≥ 5.3 mmol/L and/or 1‐hour ≥ 10.0 mmol/L and/or 2‐hour ≥ 8.6 mmol/L | American Diabetes Association 2008 (Holcomb SS; American Diabetes Association. Update: standards of medical care in diabetes. Nurse Pract 2008;33:12–5.) | ||
| 26 to 28 weeks | 75 g 2‐hour OGTT Thresholds: fasting ≥ 5.6 mmol/L or 2‐hour ≥ 7.8 mmol/L | Modified from the World Health Organization 1998 (Alberti KG, Zimmet PZ: Definition, diagnosis and classification of diabetes mellitus and its complications. Part 1: diagnosis and classification of diabetes mellitus: provisional report of WHO consultation. Diabet Med 1998, 15:539‐53.) | All women also underwent 75 g 2 hour OGTT at 8 to 12 weeks; those diagnosed with GDM were excluded from the trial | |
| 26 to 28 weeks | 2‐hour OGTT Thresholds: fasting ≥ 5.3 mmol/L and/or 1‐hour > 10.0 mmol/L and/or 2‐hour > 8.6 mmol/L OR 1) Any of the above thresholds or newborn birthweight ≥ 4500 g or use of insulin or other diabetic medication 2) Any of the above thresholds or newborn birthweight ≥ 4000 g or use of insulin or other diabetic medication 3) Any of the above thresholds or use of insulin or other diabetic medication | American Diabetes Association 2010 ((2010) Diagnosis and classification of diabetes mellitus. Diabetes Care 33: S62–9.) | Data in meta‐analysis according to American Diabetes Association 2010 criteria [use of data according to other criteria did not change results] | |
| 16th to 18th week or 24th to 28th week "as recommend" | 75 g 2‐hour OGTT Thresholds: not reported | American Diabetes Association 2011 (American Diabetes Association. Standards of medical care in diabetes‐2011. Diabetes Care 2011;34:S11–61.) | ||
| Not reported | Not reported | Not provided | ||
| Not reported | Not reported | Not provided | ||
| 27 + 0 to 28 + 6 weeks | 75 g 2‐hour OGTT Thresholds: fasting ≥ 5.1 mmol/L and/or 1‐hour ≥ 10.0 mmol/L and/or 2‐hour ≥ 8.5 mmol/L | IADPSG 2010 (Metzger B, Gabbe SG, Persson B, Buchanan TA, Catalano PA, Damm P, Dyer AR, Leiva A, Hod M, Kitzmiler JL, Lowe LP, McIntyre HD, Oats JJ, Omori Y, Schmidt MI: International association of diabetes and pregnancy study groups recommendations on the diagnosis and classification of hyperglycaemia in pregnancy. Diabetes Care 2010, 33:676–82.) | ||
| 27 + 0 to 28 + 6 weeks | 75 g 2‐hour OGTT Thresholds: fasting ≥ 5.1 mmol/L and/or 1‐hour ≥ 10.0 mmol/L and/or 2‐hour ≥ 8.5 mmol/L | IADPSG 2010 (Metzger BE, Gabbe SG, Persson B, et al. International Association of Diabetes and Pregnancy Study Groups recommendations on the diagnosis and classification of hyperglycaemia in pregnancy. Diabetes Care 2010; 33: 676–82.) | ||
| 24th to 28th week | 2‐hour OGTT Thresholds: not reported | German Society of Gynecology and Obstetrics 2010 (Deutsche Gesellschaft für Gynäkologie und Geburtshilfe e.V.: Diagnostik und Therapie des Gestationsdiabetes. [http://www.dggg.de/leitlinien/].) | ||
| 30 weeks | 75 g 2‐hour OGTT Thresholds: 2‐hour ≥ 7.8 mmol/L | Norway national criteria 2008 (Tore HH, Torun C. Veileder i Fødselshjelp 2008 In) NGFNSfGaO, editor. Veileder i Fødselshjelp 2008; 2008. p. 112.); World Health Organization 2006 (World Health Organization. Definition and Diagnosis of Diabetes Mellitus and Intermediate Hyperglycaemia: Report of a WHO/IDF Consultation. Geneva, Switzerland: World Health Organization, 2006.) | ||
| 28 to 30 weeks and 34 to 36 weeks | 75 g 2‐hour OGTT Thresholds: 2‐hour ≥ 9 mmol/L OR Thresholds: 2‐hour ≥ 8.5 mmol/L | "Danish national recommendations" (no reference provided) OR IADPSG 2010 (Metzger BE, Gabbe SG, Persson B, Buchanan TA, Catalano PA, Damm P et al. International Association of Diabetes and Pregnancy Study Group’s recommendations on the diagnosis and classification of hyperglycaemia in pregnancy. Diabetes Care 2010; 33: 676–82.) | All women also underwent an OGTT at baseline (12 to 15 weeks); those diagnosed with GDM were excluded from the trial Data in meta‐analysis according to Danish national recommendations [use of data according to IADPSG 2010 criteria did not change results] | |
| 24 to 28 weeks | 75 g OGTT | "The International Association of Diabetes and Pregnancy Study Groups (IADPSG) criterion was used" (no reference provided) |
Abbreviations: ADIPS: Australasian Diabetes in Pregnancy Society; g: gram; GDM: gestational diabetes mellitus; IADPSG: International Association of the Diabetes and Pregnancy Study Group; OGTT: oral glucose tolerance test;
Four trials presented data for GDM that could not be included in the above meta‐analysis: Asbee 2009 reported "No statistically significant differences were noted between the groups in... gestational diabetes mellitus";El Beltagy 2013 reported "obese women enrolled in mild physical activity program and diet plan (48 women) had a lower incidence to develop GDM than those participated in neither intervention (48 women) (OR 0.91, 95% CI 0.06‐1.02)";Hawkins 2014 reported "When we repeated the above analyses excluding women with gestational diabetes (n = 7), the findings were virtually unchanged;"Hoirisch‐Clapauch 2016 reported "Protocol W + D… helped prevent gestational diabetes (OR, 0.1; 95% CI, 0.02–0.57);" and "W&D... reduced the risk of gestational diabetes (2% vs. 11%)".
Hypertensive disorders of pregnancy
There was no evidence of a difference in the risk of pre‐eclampsia between the diet and exercise and standard care groups (RR 0.98, 95% CI 0.79 to 1.22; 5366 participants; 8 trials; low‐quality evidence); nor in the risk of severe pre‐eclampsia, eclampsia or HELLP (Haemolysis, Elevated Liver enzymes and Low Platelet count) syndrome (RR 0.72, 95% CI 0.35 to 1.46; 2088 participants; 2 trials) (Analysis 1.2); pregnancy‐induced hypertension and/or hypertension (average RR 0.78, 95% CI 0.47 to 1.27; 3073 participants; 6 trials; Tau² = 0.19; I² = 62%; very low‐quality evidence); pregnancy‐induced hypertension (average RR 0.46, 95% CI 0.16 to 1.29; 810 participants; 4 trials; Tau² = 0.72; I² = 69%) or hypertension (RR 1.07, 95% CI 0.84 to 1.38; 2532 participants; 3 trials) (Analysis 1.3).
Three trials presented data for pre‐eclampsia that could not be included in the above meta‐analysis: Asbee 2009 reported that "No statistically significant differences were noted between the groups in... preeclampsia";Korpi‐Hyovalti 2011 reported "There was no statistically significant difference between the randomised groups in terms of pre‐eclampsia;" and Hoirisch‐Clapauch 2016 reported "W&D... reduced the risk of... preeclampsia (5% vs. 13%)".
Caesarean section
There was a possible reduction in the risk of caesarean birth between the diet and exercise and standard care groups (RR 0.95, 95% CI 0.88 to 1.02; 6089 participants; 14 trials; moderate‐quality evidence) (Analysis 1.4). No obvious asymmetry was observed on visual assessment of a funnel plot for this outcome (Figure 6).
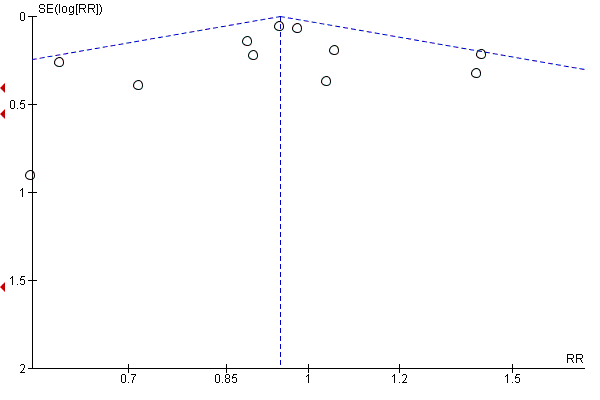
Funnel plot of comparison: 1 Diet and exercise interventions versus control, outcome: 1.4 Caesarean section.
Korpi‐Hyovalti 2011 reported "There was no statistically significant difference between the randomised groups in terms of...Cesarean deliveries (data not shown)".
Child
Perinatal mortality
Only Dodd 2014 and Poston 2015 reported on perinatal mortality, and there was no evidence of a difference in the risk observed between the diet and exercise and standard care groups (RR 0.82, 95% CI 0.42 to 1.63; 3757 participants; 2 trials; low‐quality evidence) (Analysis 1.5).
Hoirisch‐Clapauch 2016 reported "Protocol W + D… increased the rate of take‐home (OR, 6.9; 95% CI, 3.93–12.3)… babies;" and "W&D increased the rate of take‐home (88% vs. 52%)... babies".
Large‐for‐gestational age
There was no evidence of a difference in the risk of large‐for‐gestational age between the diet and exercise and standard care groups (RR 0.93, 95% CI 0.81 to 1.07; 5353 participants; 11 trials; low‐quality evidence) (Analysis 1.6). No obvious asymmetry was observed on visual assessment of a funnel plot for this outcome (Figure 7).
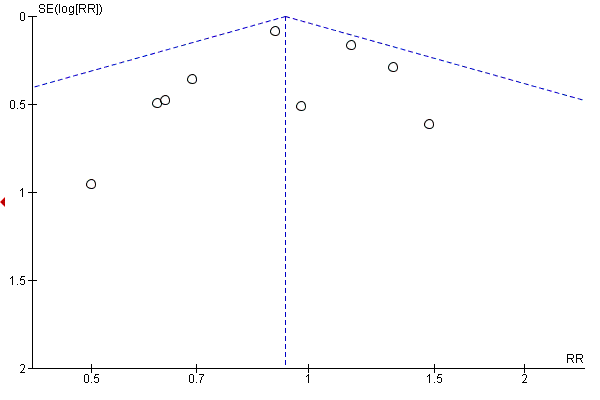
Funnel plot of comparison: 1 Diet and exercise interventions versus control, outcome: 1.6 Large‐for‐gestational age.
Two trials presented data for large‐for‐gestational age that could not be included in the above meta‐analysis: Hoirisch‐Clapauch 2016 reported "Protocol W + D… increased the rate of… appropriate‐for gestational‐age babies (OR, 7.5, 95% CI, 3.56–15.8);" and "W&D increased the rate of... appropriate‐for‐gestational‐age babies (respectively 90% vs. 63% and 92% vs. 61% of all live‐born babies)"; and Petrella 2013 reported "Large for gestational age babies were similar among groups".
Mortality or morbidity composite
A mortality or morbidity composite was not reported by any of the included trials.
Secondary outcomes
Mother
Perinatal outcomes
Operative vaginal birth
There was no evidence of a difference in the risk of operative vaginal birth between the diet and exercise intervention and standard care groups (RR 1.07, 95% CI 0.86 to 1.34; 2164 participants; 3 trials) (Analysis 1.7).
Asbee 2009 reported "No statistically significant differences were noted between the groups....[in] rate of ... operative vaginal delivery".
Induction of labour
There was no evidence of a difference in the risk of induction of labour between the diet and exercise intervention and standard care groups (average RR 0.92, 95% CI 0.79 to 1.06; 3907 participants; 5 trials; Tau² = 0.01; I² = 39%) (Analysis 1.8).
Korpi‐Hyovalti 2011 reported "There was no statistically significant difference between the randomised groups in terms of... induction of labor".
Perineal trauma
Only Dodd 2014 and Sagedal 2017 reported on perineal trauma, and there was no evidence of a difference in the risk between the diet and exercise intervention and standard care groups (RR 1.27, 95% CI 0.78 to 2.05; 2733 participants; 2 trials; moderate‐quality evidence) (Analysis 1.9).
Three trials presented data for perineal trauma that could be included in the above meta‐analysis: Asbee 2009 reported"No statistically significant differences were noted between the groups in...vaginal lacerations;"Korpi‐Hyovalti 2011 reported"There was no statistically significant difference between the randomised groups in terms of... lacerations;" and Petrella 2013 reported"No statistically significant differences were found in maternal morbidity (...perineal tears) at delivery".
Placental abruption
Only Poston 2015 reported on placental abruption and observed no evidence of a difference in the risk between the diet and exercise intervention and standard care groups (RR 2.96, 95% CI 0.12 to 72.50; 1555 participants; 1 trial) (Analysis 1.10).
Postpartum haemorrhage
There was no evidence of a difference in the risk of postpartum haemorrhage between the diet and exercise intervention and standard care groups (RR 1.03, 95% CI 0.89 to 1.18; 4235 participants; 3 trials) (Analysis 1.11).
Petrella 2013 reported"No statistically significant differences were found in maternal morbidity (post‐partum hemorrhage ...) at delivery".
Postpartum infection
Dodd 2014 and Poston 2015 were the only trials to report data on outcomes relating to postpartum infection, and observed no evidence of a difference in the risk between the diet and exercise intervention and standard care groups for endometritis (RR 1.19, 95% CI 0.52 to 2.74; 2142 participants; 1 trial), wound infection (RR 1.06, 95% CI 0.65 to 1.73; 2142 participants; 1 trial), postpartum antibiotic use (RR 1.00, 95% CI 0.77 to 1.31; 2142 participants; 1 trial), and postpartum sepsis (RR 0.33, 95% CI 0.01 to 8.06; 1555 participants; 1 trial) (Analysis 1.12).
Gestational weight gain
There was evidence of less total gestational weight gain in the diet and exercise intervention group compared with the standard care group (mean difference (MD) ‐0.89 kg, 95% CI ‐1.39 to ‐0.40; 5052 participants; 16 trials; Tau² = 0.37; I² = 43%;moderate‐quality evidence) (Analysis 1.13). Some asymmetry was observed on visual assessment of a funnel plot for this outcome, possibly indicating a lack of small negative studies (Figure 8).
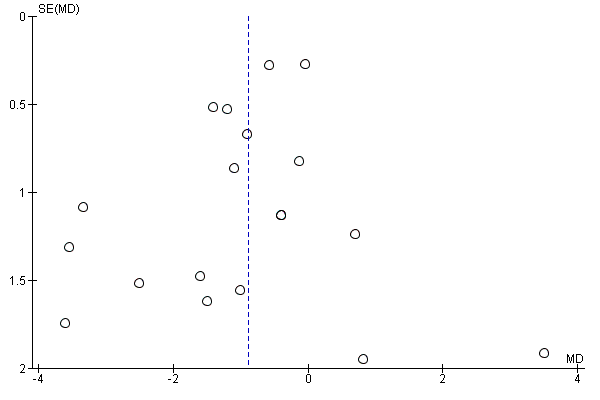
Funnel plot of comparison: 1 Diet and exercise interventions versus control, outcome: 1.13 Gestational weight gain (kg).
Four additional trials that did not report on total gestational weight gain, reported on weight gain at various time points during pregnancy; there was no evidence of a difference in gestational weight gain during the first (MD ‐0.03 kg, 95% CI ‐0.62 to 0.56; 272 participants; 1 trial), second (MD ‐0.38 kg, 95% CI ‐0.77 to 0.02; 541 participants; 2 trials) or third trimesters (MD ‐0.10 kg, 95% CI ‐1.17 to 0.97; 269 participants; 1 trial), or specifically at 20 to 24 weeks gestation (MD ‐0.45 kg, 95% CI ‐1.48 to 0.58; 221 participants; 1 trial); however, there was evidence of less weight gain at 26 to 28 weeks (MD ‐0.90 kg, 95% CI ‐1.75 to ‐0.05; 203 participants; 1 trial) (Analysis 1.14).
Three further trials presented data on gestational weight gain that could not be included in the above meta‐analysis: El Beltagy 2013 reported "weight gain per week was significantly lower in the diet and exercise group than the other group (p<0.001)";Hoirisch‐Clapauch 2016 reported "Protocol W + D… also helped prevent… excessive weight gain in term pregnancies (10 ± 2 versus 17 ± 9 kg);" and Poston 2013 reported "There was also no significant difference in gestational weight gain between control and intervention arms (secondary outcome)".
There was evidence of less gestational weight gain per week in the diet and exercise intervention group compared with the standard care group (MD ‐0.03 kg, 95% CI ‐0.06 to ‐0.00; 2772 participants; 4 trials; Tau² = 0.00; I² = 64%) (Analysis 1.15).
There was also evidence of a reduction in gestational weight gain above IOM recommendations in the diet and exercise intervention group compared with the standard care group (average RR 0.87, 95% CI 0.79 to 0.96; 4556 participants; 11 trials; Tau² = 0.01; I² = 50%) (Analysis 1.16). No obvious asymmetry was observed on visual assessment of a funnel plot for this outcome (Figure 9).
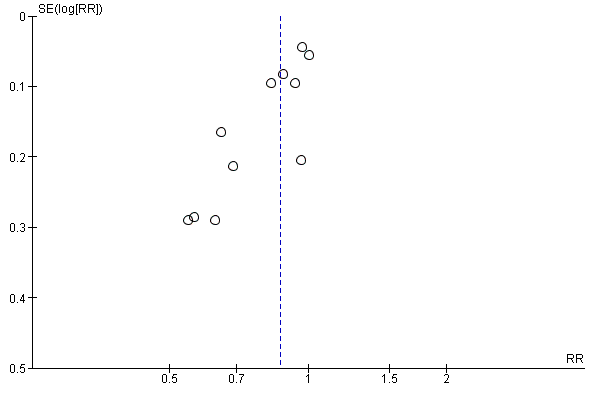
Funnel plot of comparison: 1 Diet and exercise interventions versus control, outcome: 1.16 Gestational weight gain (above IOM recommendations).
Harrison 2013 reported "The proportion of women exceeding Institute of Medicine recommendations for gestational weight gain was significantly reduced in the intervention group compared to controls, with results most marked in overweight women (17% vs 55%)".
There was, however, no evidence of a difference in gestational weight gain within (RR 1.02, 95% CI 0.93 to 1.11; 3730 participants; 9 trials) (Analysis 1.17) or below (RR 1.10, 95% CI 0.98 to 1.24; 3499 participants; 7 trials) (Analysis 1.18) IOM recommendations between the diet and exercise intervention and standard care groups.
Adherence to the intervention
The following trials provided information relating to adherence to the intervention, which was not considered suitable for meta‐analysis.
-
Harrison 2013: "Of the women allocated to the intervention, 95% attended session two, 89% session three and 93% session four".
-
Hawkins 2014: "In the lifestyle intervention group, 100% of the first and 96.9% of the second counselling sessions were completed. Rates were 93.5% for the third session and declined to 76.9% for session 4, 87.5% for session 5 and 85.7% for session 6. Overall, the women completed a mean ± SD of 4 ± 1.45 sessions".
-
Herring 2016: "The mean frequency of self‐monitoring response texts per intervention participant was 65.2 ± 29.4 (expected texts = 114), with the majority of participants (70%) responding to ≥ 50% of the self‐monitoring text prompts... Intervention participants also completed an average of 4 ± 1.5 coaching calls (expected calls = 7) during the first 12 program weeks and an average of 1 ± 0.5 additional calls until delivery... More than 90% of calls were attempted. While few participants (11%) commented or "liked" posts on Facebook, average number of weekly coach posts was 1.7 ± 0.9, which waned over time".
-
Hui 2014: "All participants in the intervention group met with the dietitian at baseline and at 2 months after. These women attended the group exercise and exercise regularly at home according to the protocol".
-
Luoto 2011: "The timing of the counseling sessions was as intended: The mean weeks gestation at the primary session was 9 (range 6 to 13), at the first booster session 17 (range 8‐25), at the second booster session 23 (range 19 to 29), at the third booster session 33 (range 30 to 37) and at the final booster session 37 (range 34 to 40). The mean duration of the primary counseling session on PA was 21 min (range 5 to 55) and the duration of subsequent booster sessions 10 (range 0 to 30), 11 (range 2 to 32), 10 (range 0 to 56) and 6 min (range 2 to 20). Two participants missed the second booster session at 22‐24 weeks gestation and three participants the last booster at 36‐37 weeks gestation. The average attendance at the monthly thematic meetings with group exercise was 33% ranging from 20% to 52% in the municipalities. On average, only 6% (municipality‐specific range 0% to 15%) of the participants attended all thematic meetings and 33% (municipality‐ specific range 10% to 67%) at least 3 of the meetings during their pregnancy".
-
Poston 2013: "Of the 94 women randomised to the intervention, 82 (88%) attended at least one group session, and 60 (64%) attended 4 or more. A total of 42 women (45%) received material from all eight sessions, 6 by full attendance (6%) and the remainder when partly/wholly covered by subsequent phone contact. For all women, 6.1 (SD 2.6) sessions were attended or partly/wholly covered".
-
Poston 2015: "On average, women who were assigned the intervention attended seven (SD 3) of eight health trainer‐led sessions, including four in person, and a further three by telephone or email. For sessions attended in person, 30% of women attended only one session, and 46% attended fewer than four. For sessions delivered by any method, 10% of women received only one session and 17% had fewer than four".
-
Sagedal 2017: "Among women in the intervention arm, 259 (87.5%) received both dietary consultations, 28 (9.5%) received one, and nine (3%) received none. All received access to physical fitness classes and 274 (92.6%) attended at least one class. The number of classes attended varied between 0 and 38, with a median of 14;" and at 12‐month follow‐up "Among intervention participants in the present analysis, 115 (56.7%) were defined as compliant and 88 (43.3%) non‐compliant with the intervention".
-
Vinter 2011: "92% of the women completed all four dietetic counseling sessions and 98% completed at least three sessions… The mean attendance for the 20 aerobic classes was 10.4 h, and 56% of women in the intervention group attended the aerobic classes for at least half of the lessons".
Behaviour changes associated with the intervention
Seventeen of the included trials (Bruno 2016; Dodd 2014; Harrison 2013; Hawkins 2014; Hui 2012; Hui 2014; Jing 2015; Koivusalo 2016; Luoto 2011; Petrella 2013; Phelan 2011; Polley 2002; Poston 2013; Poston 2015; Rauh 2013; Sagedal 2017; Vinter 2011) provided information relating to diet and/or exercise changes, which (given the substantial variation in reporting) was not considered suitable for meta‐analysis. We have summarised the findings from the trials in Analysis 1.19. The majority of these trials (Bruno 2016; Dodd 2014; Harrison 2013; Hawkins 2014; Hui 2012; Hui 2014; Jing 2015; Koivusalo 2016; Luoto 2011; Poston 2013; Poston 2015; Rauh 2013; Sagedal 2017; Vinter 2011) observed some evidence of benefit(s) in favour of the diet and exercise interventions; while one trial (Polley 2002) observed no evidence of difference between the diet and exercise interventions and control, and one trial (Bruno 2016) observed some evidence of benefit in favour of the control for exercise. Petrella 2013 did not report group differences.
Relevant biomarker changes associated with the intervention
Six of the included trials (Hawkins 2014; Koivusalo 2016; Korpi‐Hyovalti 2011; Luoto 2011; Poston 2015; Vinter 2011) provided information related to biomarker changes, which (given the substantial variation in reporting) was not considered suitable for meta‐analysis. We have summarised the findings from the trials in Analysis 1.20, Two of the trials (Koivusalo 2016; Vinter 2011) reported some evidence of benefit(s) in favour of the diet and exercise interventions for these changes; while the other four trials (Hawkins 2014; Korpi‐Hyovalti 2011; Luoto 2011; Poston 2015) observed no evidence of difference between the diet and exercise interventions and control.
Sense of well‐being and quality of life
Four of the included trials (Dodd 2014; Luoto 2011; Phelan 2011; Poston 2013) provided information related to sense of well‐being and/or quality of life, which (given the substantial variation in reporting) was not considered suitable for meta‐analysis. We have summarised the findings from the trials in Analysis 1.21. One of the trials (Dodd 2014) observed some evidence of benefit in favour of the diet and exercise intervention; while two of the trials (Luoto 2011; Poston 2013) observed no evidence of difference between the diet and exercise interventions and control, and one trial (Phelan 2011) observed some evidence of benefit in favour of the control.
Views of intervention
The following trials provided information relating to views of the intervention, which was not suitable for meta‐analysis.
-
Dodd 2014: "Although there were no significant differences in the proportion of women who indicated that they would participate in the study again [Lifestyle Advice 433 (74.4%) vs. Standard Care 467 (74.8%); p = 0.7222] or recommend participation to a friend [Lifestyle Advice 484 (82.7%) vs. Standard Care 492 (78.8%); p = 0.2302], women who received the intervention were more likely to be satisfied with their group allocation [Lifestyle Advice 506 (87.5%) vs. Standard Care 439 (70.6%); p < 0.0001]".
-
Hawkins 2014: "The majority of the participants were satisfied with the amount of information received (83.9%) and the amount of time spent on the study (88.7%), and found the written materials sometimes or always useful (80.6%). Finally, 91.9% of the women reported that they would definitely or possibly participate in a similar study in the future".
-
Herring 2016: "Among intervention participants who completed the treatment acceptability questionnaire (n= 22; 81%), 96% reported that the skills they learned in the program were extremely helpful (at least an 8 on a 10‐point scale); 96% found the text messages and 82% found the coach calls extremely useful; and 87% reported the program was extremely successful in changing eating habits. Qualitative feedback included: (i) "I believe without this program my weight gain would have been out of control" and (ii) "I’m [now] watching what I eat and drink as well as monitoring my kids diets so we can stay healthy and fit throughout our lives".
-
Poston 2013: "Women in both arms of the trial found the research processes acceptable, and felt supported by the study midwives. Women in the intervention group were generally willing, in principle, to attend the eight health trainer sessions, and most women who attended valued the group approach, citing opportunities to raise questions and discuss each other's experiences. Some were surprised at the extent of the intervention, having anticipated a less intensive, more advice‐based approach...Some women found the information contained in the handbook new, whilst for others it was too basic. The pedometers and step goals were generally well received. Setting and reflecting on weekly goals was motivational for most, but could also invoke feelings of guilt, or a sense of being observed and judges. Women reported having watched the DVD, but few used it regularly".
Breastfeeding
There was no evidence of a difference in exclusive breastfeeding at three days (RR 1.02, 95% CI 0.91 to 1.15; 695 participants; 1 trial), six weeks (RR 0.93, 95% CI 0.76 to 1.13; 202 participants; 1 trial) or six months (RR 0.91, 95% CI 0.61 to 1.36; 921 participants; 2 trials) postpartum (Analysis 1.22); or in partial breastfeeding at three days (RR 0.51, 95% CI 0.40 to 0.66; 695 participants; 1 trial), six weeks (RR 1.44, 95% CI 0.80 to 2.60; 202 participants; 1 trial) or six months postpartum (RR 0.98, 95% CI 0.82 to 1.18; 921 participants; 2 trials) (Analysis 1.23).
Three trials presented data on breastfeeding that could not be included in the above meta‐analysis: Rauh 2013 reported only group means, with no measures of variance, and found no difference between groups in exclusive and total breastfeeding durations (Analysis 1.24); Phelan 2011 reported"The intervention did not target breastfeeding and had no significant effect on breastfeeding rates, which were low in both the intervention and standard‐care groups (10.4% and 8.3%, respectively, at 6 mo and 3.4% and 4.6%, respectively, at 12 mo)";Sagedal 2017 reported "There was no significant difference in duration of breastfeeding between women compliant with the intervention and those in the control group (37.3 versus 34.2 weeks, mean difference 3.0 weeks, 95% CI ‐1.3, 7.5; P = 0.294)".
Long‐term maternal outcomes
Postnatal depression
Postnatal depression was not reported by the included trials.
Postnatal weight retention or return to pre‐pregnancy weight
There was evidence of less postnatal weight retention at latest time reported (from six weeks to 12 months postpartum) in the diet and exercise intervention group compared with the standard care group (MD ‐0.94 kg, 95% CI ‐1.52 to ‐0.37; 1673 participants; 6 trials) (Analysis 1.25).
There was also evidence of an increased chance of returning to pre‐pregnancy weight at latest time reported (from six to 12 months postpartum) in the diet and exercise intervention group compared with the standard care group (RR 1.25, 95% CI 1.08 to 1.45; 960 participants; 3 trials) (Analysis 1.26).
Postnatal BMI
Harrison 2013 and Poston 2015 reported on postnatal BMI (at six weeks and six months postpartum respectively), and there was no evidence of a difference between the diet and exercise intervention and standard care groups (MD ‐0.15 kg/m², 95% CI ‐0.85 to 0.55; 902 participants; 2 trials). Harrison 2013, however, observed evidence of a smaller change in BMI from baseline to six weeks postpartum in the diet and exercise group compared with the standard care group (MD ‐0.56 kg/m², 95% CI ‐1.12 to ‐0.00; 202 participants; 1 trial) (Analysis 1.27).
GDM in subsequent pregnancy
GDM in subsequent pregnancies was not reported by the included trials.
Type 1 diabetes mellitus
Type 1 diabetes mellitus was not reported by the included trials.
Type 2 diabetes mellitus
Type 2 diabetes mellitus was not reported by the included trials.
Impaired glucose tolerance
Impaired glucose tolerance was not reported by the included trials.
Cardiovascular health
Vinter 2011 observed no evidence of a difference in median systolic or diastolic blood pressure between the diet and exercise intervention and standard care groups at six months postpartum (Analysis 1.28).
Child
Fetal/neonatal outcomes
Stillbirth
There was no evidence of a difference in risk of stillbirth between the diet and exercise intervention and standard care groups (RR 0.69, 95% CI 0.35 to 1.36; 4783 participants; 5 trials) (Analysis 1.29).
Vinter 2011 presented data related to stillbirth, however it was unclear whether one of the three stillbirths occurred in the intervention or standard care group; and it was additionally unclear as to whether the three stillbirths discussed were the only deaths that occurred: "One woman had an unexplained stillbirth after induction of labor in GA 42. Two additional women had a preterm delivery with stillborn infants in second trimester of pregnancy, one from each randomization group".
Neonatal mortality
Only Dodd 2014 and Poston 2015 reported on neonatal mortality, and there was no evidence of a difference in risk between the diet and exercise intervention and standard care groups overall (RR 2.31, 95% CI 0.60 to 8.90; 3756 participants; 2 trials), or in Dodd 2014 when mortality associated with no lethal anomalies (RR 0.99, 95% CI 0.06 to 15.85; 2202 participants; 1 trial) and mortality due to lethal anomalies (RR 6.95, 95% CI 0.36 to 134.38; 2202 participants; 1 trial) were considered separately (Analysis 1.30).
Gestational age at birth
There was no evidence of a difference in gestational age at birth between the diet and exercise intervention and standard care groups (MD 0.05 weeks, 95% CI ‐0.05 to 0.15; 5658 participants; 11 trials) (Analysis 1.31). No obvious asymmetry was observed on visual assessment of a funnel plot for this outcome (Figure 10).

Funnel plot of comparison: 1 Diet and exercise interventions versus control, outcome: 1.31 Gestational age at birth (weeks).
Four trials presented data on gestational age at birth that could not be included in the above meta‐analysis: Polley 2002 reported only the mean values by group, and Vinter 2011 reported median values and interquartile ranges by group; neither trial observed evidence of a difference between groups (Analysis 1.32); Hoirisch‐Clapauch 2016 reported "Protocol W + D… increased the rate of … full‐term (OR, 12.2; 95% CI, 5.96–25.2)… babies";Korpi‐Hyovalti 2011 reported "There was no statistically significant difference between the randomized groups in terms of gestational age... (data not shown)".
Preterm birth
There was evidence of a reduction in preterm birth in the diet and exercise intervention group compared with the standard care group (RR 0.80, 95% CI 0.65 to 0.98; 5398 participants; 11 trials) (Analysis 1.33). No obvious asymmetry was observed on visual assessment of a funnel plot for this outcome (Figure 11).
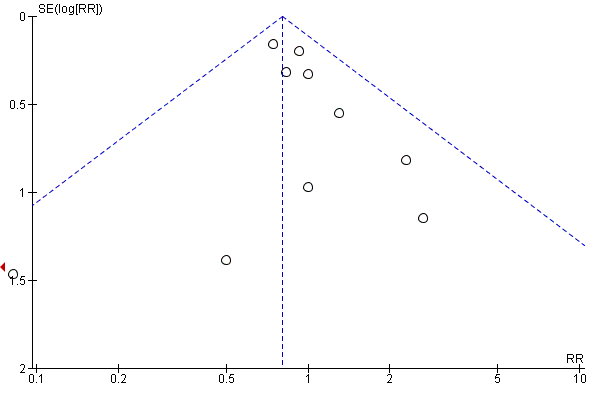
Funnel plot of comparison: 1 Diet and exercise interventions versus control, outcome: 1.33 Preterm birth.
Apgar score less than seven at five minutes
There was no evidence of a difference in risk of Apgar score less than seven at five minutes between the diet and exercise intervention and standard care groups (RR 0.80, 95% CI 0.48 to 1.32; 2864 participants; 3 trials) (Analysis 1.34).
Petrella 2013 reported "Low 5‐min Apgar... [was] equally distributed among groups".
Macrosomia
There was evidence of a reduction in macrosomia, defined as birthweight less than 4000 g (RR 0.89, 95% CI 0.78 to 1.01; 5368 participants; 9 trials; P = 0.06) and evidence of a reduction in macrosomia, defined as birthweight less than 4500 g (RR 0.63, 95% CI 0.42 to 0.94; 3061 participants; 4 trials) in the diet and exercise intervention group compared with the standard care group (Analysis 1.35). No obvious asymmetry was observed on visual assessment of a funnel plot for this outcome (Figure 12).

Funnel plot of comparison: 1 Diet and exercise interventions versus control, outcome: 1.35 Macrosomia.
Korpi‐Hyovalti 2011 reported "There was no difference in macrosomia (p = 0.480, adjusted by the prepregnancy weight of the women) between the groups".
Small‐for‐gestational age
There was a possible increase in the risk of small‐for‐gestational age between the diet and exercise intervention and standard care groups (RR 1.20, 95% CI 0.95 to 1.52; 2434 participants; 6 trials) (Analysis 1.36).
Birthweight and z score
There was no evidence of a difference in birthweight (MD ‐17.67 g, 95% CI ‐46.28 to 10.94; 5763 participants; 13 trials) (Analysis 1.37), or birthweight z score (MD ‐0.05, 95% CI ‐0.13 to 0.03; 2661 participants; 4 trials) (Analysis 1.39) between the diet and exercise intervention and standard care groups. No obvious asymmetry was observed on visual assessment of a funnel plot for this outcome (Figure 13).

Funnel plot of comparison: 1 Diet and exercise interventions versus control, outcome: 1.37 Birthweight (g).
Three trials presented data on birthweight that could not be included in the above meta‐analysis: Herring 2016 and Polley 2002 reported only the mean values by group; Vinter 2011 reported median values and interquartile ranges by group. While Herring 2016 and Polley 2002 observed no evidence of a difference in birthweight between the two groups, Vinter 2011 reported a higher birthweight in the diet and exercise intervention group compared with the standard care group (Analysis 1.38).
Head circumference and z score
There was no evidence of a difference in head circumference (MD ‐0.01 cm, 95% CI ‐0.11 to 0.10; 4229 participants; 4 trials) (Analysis 1.40), or head circumference z score (reported by Dodd 2014 only) (MD ‐0.05, 95% CI ‐0.14 to 0.04; 2142 participants; 1 trial) (Analysis 1.41) between the diet and exercise intervention and standard care groups.
Length and z score
There was no evidence of a difference in length between the diet and exercise intervention and standard care groups (MD ‐0.09 cm, 95% CI ‐0.26 to 0.09; 3303 participants; 6 trials) (Analysis 1.42). There was evidence of a lower length z score in the diet and exercise intervention group compared with the standard care group (reported by Dodd 2014 and Luoto 2011 only) (MD ‐0.08, 95% CI ‐0.15 to ‐0.02; 2235 participants; 2 trials) (Analysis 1.43).
Ponderal index
There was no evidence of a difference in ponderal index between the diet and exercise intervention and standard care groups (MD 0.04 kg/m3, 95% CI ‐0.16 to 0.25; 2826 participants; 3 trials) (Analysis 1.44).
Adiposity
Dodd 2014; and Poston 2015 reported on adiposity at birth, and there was no evidence of a difference in sum of skinfold thickness (MD 0.09 mm, 95% CI ‐0.33 to 0.50; 1472 participants; 2 trials) (Analysis 1.45) or abdominal circumference (MD ‐0.01 cm, 95% CI ‐0.23 to 0.22; 1566 participants; 2 trials) (Analysis 1.46) between the diet and exercise intervention and standard care groups.
Dodd 2014 and Poston 2015 provided additional information related to adiposity at birth, which (given the substantial variation in reporting) was not considered suitable for meta‐analysis. We have summarised the findings from the trials in Analysis 1.47. Neither trial observed evidence of a difference between the diet and exercise intervention and standard care groups for measures of adiposity.
Shoulder dystocia
Only Dodd 2014 and Sagedal 2017 reported on shoulder dystocia, and there was no evidence of a difference in risk between the diet and exercise intervention and standard care groups (RR 1.20, 95% CI 0.79 to 1.83; 2733 participants; 2 trials) (Analysis 1.48).
Nerve palsy
Dodd 2014 observed no evidence of a difference in risk of nerve palsy between the diet and exercise intervention and standard care groups (RR 1.99, 95% CI 0.36 to 10.82; 2142 participants; 1 trial) (Analysis 1.49).
Bone fracture
Dodd 2014 observed no evidence of a difference in risk of bone fracture between the diet and exercise intervention and standard care groups (RR 1.99, 95% CI 0.36 to 10.82; 2142 participants; 1 trial) (Analysis 1.50).
Respiratory distress syndrome
Only Dodd 2014 and Koivusalo 2016 reported on respiratory distress syndrome, and there was evidence of a reduction in the risk in the diet and exercise intervention group compared with the standard care group (RR 0.56, 95% CI 0.33 to 0.97; 2411 participants; 2 trials) (Analysis 1.51).
Korpi‐Hyovalti 2011 reported "There was no statistically significant difference between the randomized groups in terms of... respiratory distress (data not shown)".
Hypoglycaemia
Only Dodd 2014 and Poston 2015 reported on neonatal hypoglycaemia, and there was no evidence of a difference in risk between the diet and exercise intervention and standard care groups (average RR 1.42, 95% CI 0.67 to 2.98; 3653 participants; 2 trials; Tau² = 0.23; Chi² = 4.39, P = 0.04; I² = 77%; low‐quality evidence) (Analysis 1.52).
Hoirisch‐Clapauch 2016 reported "Protocol W + D… also helped prevent… neonatal hypoglycemia (2% versus 17%, OR, 0.1; 95% CI, 0.03–0.46);" and "W&D... reduced the risk of... neonatal hypoglycaemia (2% vs. 16%)".
Hyperbilirubinaemia
Dodd 2014 observed no evidence of a difference in risk of neonatal hyperbilirubinaemia between the diet and exercise intervention and standard care groups (RR 0.82, 95% CI 0.61 to 1.11; 2142 participants; 1 trial) (Analysis 1.53).
Korpi‐Hyovalti 2011 reported "There was no statistically significant difference between the randomized groups in terms of... jaundice requiring phototherapy... (data not shown)".
Childhood/adulthood outcomes
Weight and z scores
Poston 2015, Rauh 2013 and Vinter 2011 reported on childhood weight (at six months, 10‐12 months and 2.8 years respectively), and there was no evidence of a difference between the diet and exercise intervention and standard care groups. (MD ‐0.05 kg, 95% CI ‐0.33 to 0.22; 882 participants; 3 trials; Tau² = 0.03; Chi² = 3.20, P = 0.20; I² = 37%) (Analysis 1.54). Poston 2015 also observed no difference in childhood weight z score at six months between the diet and exercise intervention and standard care groups (MD ‐0.09, 95% CI ‐0.26 to 0.08; 643 participants; 1 trial) (Analysis 1.55).
Height and z scores
Poston 2015 and Vinter 2011 reported on childhood height (at six months, and 2.8 years respectively), and there was no evidence of a difference between the diet and exercise intervention and standard care groups (MD 0.33 cm, 95% CI ‐0.58 to 1.25; 816 participants; 2 trials) (Analysis 1.56). Poston 2015 also observed no difference in childhood height z score at six months between the diet and exercise intervention and standard care groups (MD ‐0.02, 95% CI ‐0.31 to 0.27; 622 participants; 1 trial) (Analysis 1.57).
Head circumference and z scores
Poston 2015 observed no difference in childhood head circumference at six months between the diet and exercise intervention and standard care groups (MD ‐0.12 cm, 95% CI ‐0.70 to 0.46; 670 participants; 1 trial) (Analysis 1.58).
Adiposity
Poston 2015 and Vinter 2011 reported on childhood adiposity (at six months, and 2.8 years, respectively), and there was no evidence of a difference between the diet and exercise intervention and standard care groups, as measured by: BMI z score (MD 0.05, 95% CI ‐0.29 to 0.40; 794 participants; 2 trials; Tau² = 0.04; I² = 59%; low‐quality evidence) (Analysis 1.59), abdominal circumference (MD 0.26 cm, 95% CI ‐0.37 to 0.90; 833 participants; 2 trials) (Analysis 1.60), subscapular skinfold thickness (MD ‐0.17 mm, 95% CI ‐0.66 to 0.32; 705 participants; 2 trials; Tau² = 0.09; I² = 70%) (Analysis 1.61), triceps skinfold thickness (MD ‐0.12 mm, 95% CI ‐0.48 to 0.23; 784 participants; 2 trials) (Analysis 1.62) and total body fat (MD ‐0.74 %, 95% CI ‐1.56 to 0.07; 614 participants; 2 trials) (Analysis 1.63).
Poston 2015 and Vinter 2011 provided additional information related to childhood adiposity (at six months, and 2.8 years, respectively), which (given the substantial variation in reporting) was not considered suitable for meta‐analysis. We have summarised the findings from the trials in Analysis 1.64. Neither trial observed evidence of a difference between the diet and exercise intervention and standard care groups for measures of adiposity, except for in Poston 2015, who observed evidence of a lower subscapular skinfold thickness z score at six months for the diet and exercise intervention group compared with the standard care group.
Cardiovascular health
Vinter 2011 provided information related to various measures of childhood cardiovascular health at 2.8 years; we have summarised the findings in Analysis 1.65. Vinter 2011 observed no evidence of differences between the diet and exercise intervention and standard care groups for these measures.
Employment, education and social status/achievement
Employment, education and social status/achievement were not reported by the included trials.
Type 1 diabetes mellitus
Type 1 diabetes mellitus was not reported by the included trials.
Type 2 diabetes mellitus
Type 2 diabetes mellitus was not reported by the included trials.
Impaired glucose tolerance
Impaired glucose tolerance was not reported by the included trials.
Neurosensory disability
Neurosensory disability was not reported by the included trials.
Health services
Number of hospital or health professional visits
Numbers of hospital or health professional visits were not reported by the included trials.
Number of antenatal visits or admissions
Koivusalo 2016 observed no evidence of a difference in the number of antenatal clinic visits before the second‐trimester oral glucose tolerance test (OGTT) between the diet and exercise intervention and standard care groups (MD 0.00 visits, 95% CI ‐0.36 to 0.36; 269 participants; 1 trial) (Analysis 1.66).
Dodd 2014 observed no evidence of a difference in the risk of antenatal hospital admission between the diet and exercise intervention and standard care groups (RR 0.86, 95% CI 0.71 to 1.04; 2153 participants; 1 trial) (Analysis 1.67).
Length of antenatal stay
Dodd 2014 observed evidence of a reduction in length of antenatal stay for the diet and exercise intervention group compared with the standard care group (MD ‐0.27 days, 95% CI ‐0.49 to ‐0.05; 2153 participants; 1 trial); Poston 2015, however, observed no evidence of a difference in number of antenatal inpatient nights (for those women admitted antenatally) (MD 0.00 nights, 95% CI ‐1.00 to 1.00; 139 participants; 1 trial) (Analysis 1.68).
Neonatal intensive care unit admission
There was no evidence of a difference in risk of neonatal intensive care unit admission between the diet and exercise intervention and standard care groups (RR 1.03, 95% CI 0.93 to 1.14; 4549 participants; 4 trials) (Analysis 1.69).
Three trials presented data on neonatal intensive care unit admission that could not be included in the above meta‐analysis: Bruno 2016 reported "Newborns... admitted to the NICU (3) were very few and did not differ between the groups";Korpi‐Hyovalti 2011 reported "There was no statistically significant difference between the randomized groups in terms of... admissions to neonatal intensive care unit... (data not shown);" and Petrella 2013 reported "Neonatal Intensive Care Unit admission [was] equally distributed among groups".
Length of postnatal stay (mother)
Dodd 2014 and Poston 2015 reported on length of postnatal stay (mother) (in Poston 2015 postnatal inpatient nights were reported), and there was no evidence of a difference between the diet and exercise intervention and standard care groups (MD 0.01 days, 95% CI ‐0.14 to 0.17; 3511 participants; 2 trials; Tau² = 0.01; I² = 47%) (Analysis 1.70).
Length of postnatal stay (baby)
Dodd 2014 and Poston 2015 reported on length of postnatal stay (baby), and there was no evidence of a difference between the diet and exercise intervention and standard care groups (MD ‐0.35 days, 95% CI ‐0.90 to 0.20; 3618 participants; 2 trials) (Analysis 1.71).
Costs to families associated with the management provided
Luoto 2011 observed no evidence of a difference in costs to families associated with the management provided between the diet and exercise intervention and standard care groups, as measured by: delivery costs to the patient (MD 3.00 €, 95% CI ‐10.82 to 16.82; 93 participants; 1 trial) and neonatal care costs to the patient (MD 3.00 €, 95% CI ‐13.67 to 19.67; 93 participants; 1 trial) (Analysis 1.72). In Luoto 2011, unit costs were entered at the price level for 2009.
Costs associated with the intervention
Luoto 2011 reported that the supplemental public‐health nurse’s and physiotherapist’s work contributions per person were €118 and €23, respectively for the diet and exercise intervention group. Luoto 2011 observed no evidence of a difference in costs associated with the intervention between the diet and exercise intervention and standard care groups, as measured by: total costs (MD 769.00 €, 95% CI ‐1032.23 to 2570.23; 93 participants; 1 trial) (Analysis 1.73). In Luoto 2011 unit costs were entered at the price level for 2009.
Luoto 2011 also reported that "The study indicated that intensive lifestyle counselling among GDM‐risk groups was not significantly cost‐effective as compared to the usual care for birth weight... quality of life in a 15‐dimension questionnaire... or VAS".
Cost of maternal care
Luoto 2011 observed no evidence of a difference in costs of maternal care between the diet and exercise intervention and standard care groups, as measured by: costs of visits for primary health care (MD ‐43.00 €, 95% CI ‐127.61 to 41.61; 93 participants; 1 trial), costs of visits for specialist health care (MD ‐47.00 €, 95% CI ‐195.33 to 101.33; 93 participants; 1 trial), costs of visits to a diabetes nurse (MD 6.00 €, 95% CI ‐7.02 to 19.02; 93 participants; 1 trial), costs of visits to a dietitian (not estimable), costs of use of insulin/other diabetes medications (MD ‐1.00 €, 95% CI ‐7.83 to 5.83; 93 participants; 1 trial), costs of hospital days before and after delivery (MD 101.00 €, 95% CI ‐206.71 to 408.71; 93 participants; 1 trial), delivery cost to the municipality (MD 22.00 €, 95% CI ‐234.43 to 278.43; 93 participants; 1 trial), costs of absence from work (MD 128.00 €, 95% CI ‐1295.58 to 1551.58; 93 participants; 1 trial) (Analysis 1.74). In Luoto 2011 unit costs were entered at the price level for 2009.
Cost of infant care
Luoto 2011 observed no evidence of a difference in costs of infant care between the diet and exercise intervention and standard care groups, as measured by: neonatal care cost to municipality (MD 453.00 €, 95% CI ‐298.20 to 1204.20; 93 participants; 1 trial) (Analysis 1.75). In Luoto 2011 unit costs were entered at the price level for 2009.
Subgroup analyses
Trial design
Analyses based on trial design used (individually‐randomised versus cluster‐randomised), revealed no clear subgroup differences for the primary outcomes, GDM (Chi² = 0.22; P = 0.64; I² = 0%) (Analysis 2.1), pre‐eclampsia (Chi² = 0.07; P = 0.79; I² = 0%) (Analysis 2.2), caesarean birth (Chi² = 0.52; P = 0.47; I² = 0%) (Analysis 2.3), and large‐for‐gestational age (Chi² = 1.09; P = 0.30; I² = 8.3%) (Analysis 2.4), suggesting no clear differences in treatment effect for these outcomes according to the randomisation unit. We did not perform subgroup analyses based on trial design for perinatal mortality and pregnancy‐induced hypertension, as only individually‐randomised trials reported on these outcomes.
Maternal BMI (at or before trial entry)
Analyses were performed based on maternal BMI at or before trial entry (considering normal weight women (BMI < 25 kg/m²) versus overweight or obese women (BMI ≥ 25 kg/m²) versus obese women (BMI ≥ 30 kg/m²) versus any women (a mixed subgroup which included normal weight, overweight and obese women)). No clear subgroup differences were revealed for the primary outcomes, GDM (Chi² = 1.73, P = 0.63, I² = 0%) (Analysis 3.1), pre‐eclampsia (Chi² = 3.45, P = 0.33, I² = 13.1%) (Analysis 3.2), pregnancy‐induced hypertension or hypertension (Chi² = 2.29, P = 0.32, I² = 12.9 %) (Analysis 3.3), caesarean section (Chi² = 0.95, P = 0.81, I² = 0%) (Analysis 3.4), perinatal mortality (Chi² = 0.17, P = 0.68, I² = 0%) (Analysis 3.5) or large‐for‐gestational age (Chi² = 5.46, P = 0.14, I² = 45.0%) (Analysis 3.6), suggesting no clear differences in treatment effect for these outcomes based on maternal BMI. Due to the difficulty in interpreting the results associated with the 'any women' (mixed) subgroup, we also conducted these analyses excluding this subgroup; similarly no clear subgroup differences were observed. Further, when we conducted these analyses combining the 'overweight or obese women' and 'obese women' subgroups, no clear subgroup differences were observed.
Ethnicity
Analyses were performed based on ethnicity (considering majority 'low‐risk' ethnicities versus majority 'high‐risk' ethnicities versus mixed ethnicities versus unclear). No clear subgroup differences were observed for the primary outcomes, GDM (Chi² = 0.22, P = 0.97, I² = 0%) (Analysis 4.1), pre‐eclampsia (Chi² = 0.04, P = 0.98, I² = 0%) (Analysis 4.2), pregnancy‐induced hypertension or hypertension (Chi² = 2.71, P = 0.10, I² = 63.0%) (Analysis 4.3), caesarean birth (Chi² = 1.75, P = 0.63, I² = 0%) (Analysis 4.4), perinatal mortality (Chi² = 0.17, P = 0.68, I² = 0%) (Analysis 4.5), or large‐for‐gestational age (Chi² = 2.76, P = 0.43, I² = 0%) (Analysis 4.6), suggesting no clear differences in treatment effect for these outcomes based on ethnicity. Due to the difficulty in interpreting the results associated with the 'mixed ethnicities' and 'unclear' subgroups, we also conducted these analyses excluding these two subgroups; similarly no clear subgroup differences were observed.
Sensitivity analyses
The 12 trials (Asbee 2009; Bruno 2016; Dodd 2014; Harrison 2013; Herring 2016; Hui 2012; Hui 2014; Petrella 2013; Phelan 2011; Poston 2013; Poston 2015; Vinter 2011) considered to be at low risk of selection bias were included in sensitivity analyses. There was still a possibly reduced risk of GDM between the diet and exercise intervention and standard care groups(though with a widening of the confidence intervals) (average RR 0.86, 95% CI 0.68 to 1.09; 5019 participants; 11 trials; Tau² = 0.06; Chi² = 21.30, P = 0.02; I² = 53%) (Analysis 5.1). pre‐eclampsia (RR 0.99, 95% CI 0.78 to 1.26; 4311 participants; 4 trials) (Analysis 5.2), pregnancy‐induced hypertension or hypertension (average RR 0.58, 95% CI 0.27 to 1.25; 2694 participants; 4 trials; Tau² = 0.36; Chi² = 11.71, P = 0.008; I² = 74%) (Analysis 5.3), caesarean birth (RR 0.94, 95% CI 0.87 to 1.02; 4968 participants; 10 trials) (Analysis 5.4), perinatal mortality (RR 0.82, 95% CI 0.42 to 1.63; 3757 participants; 2 trials; identical to main analysis) (Analysis 5.5), or large‐for‐gestational age (RR 0.95, 95% CI 0.83 to 1.09; 4618 participants; 8 trials) (Analysis 5.6). These findings supported those observed in the main analysis.
Discusión
Resumen de los resultados principales
en esta revisión Cochrane actualizada se incluyeron 23 ensayos controlados aleatorios (con 8918 pacientes y 8709 lactantes) que compararon intervenciones combinadas con ejercicios y régimen dietético con ninguna intervención (atención estándar).
En los resultados primarios de revisión hubo una posible reducción en el riesgo de diabetes mellitus gestacional (DMG) y cesárea en las pacientes que recibieron intervenciones con ejercicios y régimen dietético en comparación con atención estándar (ambas con evidencia de calidad moderada). De las 3353 pacientes que recibieron intervenciones con ejercicios y régimen dietético, 525 (16%) se diagnosticaron con DMG, en comparación con 551 (17%) de las 3280 pacientes que recibieron atención estándar (una reducción del riesgo absoluto de aproximadamente el 1%). Estos datos apoyaron las tasas de DMG de 168 por 1000 para el grupo de atención estándar, y 143 por 1000 (IC del 95%: 119 a 170) para el grupo de intervención con ejercicios y régimen dietético. No hubo diferencias claras entre los grupos para la preeclampsia (evidencia de baja calidad), hipertensión inducida por el embarazo/hipertensión (evidencia de muy baja calidad), mortalidad perinatal (evidencia de baja calidad) ni tamaño grande para la edad gestacional evidencia de baja calidad). Los ensayos incluidos no informaron datos de la mortalidad infantil ni del resultado compuesto de morbilidad.
Los análisis de subgrupos (según el diseño de los ensayos, el índice de masa corporal [IMC] materno y el grupo étnico) de los resultados primarios no mostraron efectos diferenciales claros del tratamiento según las características evaluadas. No fue posible evaluar la repercusión de la edad materna, la paridad y las características específicas de las intervenciones con régimen dietético y ejercicios, debido a la escasez de información/datos y a la imposibilidad de agrupar significativamente las características de la intervención. Los análisis de sensibilidad (limitados a los ensayos con bajo riesgo de sesgo de selección) apoyaron los resultados observados en los análisis principales.
De igual manera, no hubo diferencias claras entre los grupos en la mayoría de los resultados secundarios evaluados mediante GRADE, que incluyen el traumatismo perineal (evidencia de calidad moderada), hipoglucemia neonatal (evidencia de baja calidad) y adiposidad en la niñez (puntuación z del IMC) (evidencia de baja calidad). Sin embargo, hubo evidencia de menor aumento de peso gestacional en las pacientes que recibieron intervenciones con ejercicios y régimen dietético en comparación con atención estándar (evidencia de calidad moderada). Como promedio, las pacientes que recibieron intervenciones con ejercicios y régimen dietético ganaron 0,89 kg menos (IC del 95%: 1,39 kg a 0,40 kg menos) que las que recibieron atención estándar. Los ensayos incluidos no informaron datos de la depresión materna posnatal o la diabetes mellitus tipo 2, ni para diabetes mellitus tipo 2 en la niñez/adultez o la discapacidad neurosensorial.
En la mayoría de los otros resultados secundarios (no evaluados mediante GRADE) no se observaron diferencias claras entre los grupos. Sin embargo, se observaron efectos beneficiosos adicionales con relación al aumento de peso gestacional (menos aumento de peso gestacional por semana; y menores probabilidades de tener un aumento de peso gestacional por encima de las recomendaciones del Institute of Medicine (IOM) en las pacientes que recibieron intervenciones con ejercicios y régimen dietético en comparación con atención estándar. Además, en la etapa posnatal, las pacientes que recibieron intervenciones con ejercicios y régimen dietético tuvieron menos retención de peso y mayores probabilidades de regresar al peso previo al embarazo en comparación con las que recibieron atención estándar. También hubo reducciones en el parto prematuro, la macrosomía (definida como peso al nacer menor de 4500 g) y el síndrome de dificultad respiratoria observado entre los lactantes nacidos de madres que recibieron intervenciones con ejercicios y régimen dietético, en comparación con los nacidos de madres que recibieron atención estándar. No se realizaron metanálisis de los resultados secundarios relacionados con la adherencia con la intervención, los cambios de comportamientos asociados con la intervención, los cambios en biomarcadores relevantes asociados con la intervención, la sensación de bienestar y calidad de vida y las opiniones con respecto a la intervención, ya que los datos no se consideraron apropiados, a menudo debido a la variación significativa en el informe. En general se informó una buena adherencia y opiniones positivas entre las pacientes de los grupos de intervenciones con ejercicios y régimen dietético. Aunque los resultados relacionados con cambios en biomarcadores y la sensación de bienestar y calidad de vida fueron mixtos, la mayoría de los ensayos demostraron algunos efectos beneficiosos con respecto a cambios de comportamientos en el régimen dietético y los ejercicios en las pacientes que recibieron intervenciones con ejercicios y régimen dietético en comparación con las que recibieron atención estándar.
Compleción y aplicabilidad general de las pruebas
Las pruebas de las intervenciones combinadas con ejercicios y régimen dietético durante el embarazo para la prevención de DMG no están completas. Aunque fue posible incluir 23 ensayos con casi 9000 pacientes, que evaluaron una variedad amplia de intervenciones combinadas con ejercicios y régimen dietético, muchos de estos ensayos informaron pocos resultados de la revisión. Todos los ensayos incluidos compararon las intervenciones con atención estándar o habitual y, por lo tanto, no fue posible considerar las comparaciones de diferentes tipos de intervenciones combinadas con ejercicios y régimen dietético.
En cuanto a los resultados de la revisión seleccionados para la evaluación de la calidad mediante GRADE, aunque 19, 16 y 14 ensayos, respectivamente proporcionaron datos para los metanálisis de la DMG, el aumento de peso gestacional y la cesárea, menos de la mitad de los ensayos incluidos contribuyeron con datos para los metanálisis del tamaño grande para la edad gestacional (11 ensayos), la preeclampsia (ocho ensayos), la hipertensión inducida por el embarazo/hipertensión (seis ensayos), el traumatismo perineal (dos ensayos), la mortalidad perinatal (dos ensayos), la hipoglucemia neonatal (dos ensayos) y la adiposidad en la niñez (dos ensayos). Para los resultados restantes seleccionados para la evaluación de la calidad mediante GRADE (depresión materna y diabetes tipo 2; resultado compuesto de mortalidad o morbilidad del lactante; diabetes tipo 2 en la niñez/adultez y discapacidad neurosensorial), ningún ensayo incluido proporcionó datos.
Para muchos de los otros resultados secundarios de la revisión (incluidos los resultados en la niñez y los relacionados con el uso y los costos de los servicios de asistencia sanitaria), la evidencia estuvo limitada a los datos de uno o dos ensayos. Aunque ahora se incluyeron ensayos que han proporcionado algunos datos (limitados) sobre la salud en la niñez y la salud materna en el período posparto, no hubo datos para la mayoría de los resultados de la revisión con respecto a la salud a largo plazo de las madres y los lactantes en la niñez y la adultez. Por lo tanto, todavía persiste una escasez de evidencia con respecto a los efectos de estas intervenciones durante el embarazo sobre la salud a más largo plazo. Además, los ensayos incluidos proporcionaron datos limitados en cuanto a la adherencia, la sensación de las pacientes de bienestar, la calidad de vida y sus opiniones. El informe de resultados como los marcadores biológicos relevantes y los cambios de comportamientos asociados con la intervención no se estandarizó (y varió enormemente) en los ensayos incluidos, lo que limitó la posibilidad de combinar los datos.
La posibilidad de establecer conclusiones firmes fue aún más limitada, en particular, por las variaciones notables en las características de las intervenciones evaluadas (si se consideran las características de los componentes del régimen dietético y de los ejercicios) y de las pacientes incluidas en los ensayos. Aunque se decidió combinar los ensayos en una comparación e intentar explorar la variación mediante análisis de subgrupos, la posibilidad de hacerlo estuvo limitada por la dificultad de agrupar de manera lógica los ensayos según sus características. En cuanto a la aplicabilidad, de los 23 ensayos incluidos, todos excepto uno se realizaron en países de ingresos medio‐altos o altos. Lo anterior probablemente limita la generalizabilidad de los resultados a otros países, en particular los contextos de bajos recursos. Además, los ensayos incluidos utilizaron pruebas de cribado/diagnósticas, criterios diagnósticos y estrategias posteriores de tratamiento para la DMG específicos y variables, lo que puede limitar la interpretación de los datos y además la aplicabilidad de los resultados a países/contextos que utilicen diferentes enfoques y con practicabilidad y consideraciones de factibilidad variables.
Calidad de la evidencia
El riesgo de sesgo de los 23 ensayos incluidos fue mixto. Dodd 2014, el ensayo más grande (con 2212 mujeres y sus lactantes) se consideró con bajo riesgo de sesgo general. En general los ensayos incluidos no aportaron detalles metodológicos para evaluar aspectos específicos del riesgo de sesgo, por lo que muchos se consideraron "inciertos". Fue posible incluir en los análisis de sensibilidad 12 de los 23 ensayos, considerados con bajo riesgo de sesgo de selección, que apoyaron en gran parte los resultados de los análisis principales (donde Dodd 2014 contribuyó a aproximadamente entre el 20% y el 66% de la ponderación en los metanálisis).
En los resultados evaluados con GRADE se determinó que la evidencia fue de calidad moderada (DMG, cesárea, aumento de peso gestacional y traumatismo perineal), calidad baja (preeclampsia, mortalidad perinatal, tamaño grande para la edad gestacional, hipoglucemia neonatal y adiposidad en la niñez), o calidad muy baja (hipertensión inducida por el embarazo/hipertensión). La calidad de la evidencia se disminuyó debido principalmente a limitaciones en el diseño (riesgo de sesgo), e imprecisión (estimaciones inciertas del efecto y en ocasiones, tamaños pequeños de la muestra y bajas tasas de eventos); sin embargo, dos resultados (hipertensión inducida por el embarazo/hipertensión e hipoglucemia neonatal), también se disminuyeron por inconsistencia no explicada (heterogeneidad estadística).
Sesgos potenciales en el proceso de revisión
La búsqueda de ensayos en esta área se realizó utilizando el registro de ensayos del Grupo Cochrane de Embarazo y Parto (Cochrane Pregnancy and Childbirth’s Trials Register). Es poco probable que se hayan omitido estudios realizados; sin embargo, podrían faltar ensayos no publicados o ensayos en curso no registrados en los registros de ensayos clínicos. Si se identifican dichos ensayos, se incluirán en futuras actualizaciones de la revisión.
La posibilidad de sesgo de publicación se exploró mediante gráficos en embudo para los resultados con diez o más ensayos incluidos en los metanálisis (DMG, cesárea, tamaño grande para la edad gestacional, aumento de peso gestacional, aumento de peso gestacional por encima de las recomendaciones del IOM, edad gestacional al nacer, parto prematuro, macrosomía y peso al nacer) y no hubo indicación clara de asimetría excepto en el caso del aumento de peso gestacional.
Cuando fue posible se intentó reducir el sesgo al hacer que al menos dos autores de la revisión trabajaran de forma independiente en la selección de los ensayos, la extracción de los datos, la evaluación del riesgo de sesgo y las evaluaciones GRADE.
Acuerdos y desacuerdos con otros estudios o revisiones
Dos revisiones Cochrane han evaluado intervenciones en el régimen dietético (Tieu 2017) e intervenciones con ejercicios(Han 2012) para la prevención de la DMG. Tieu 2017 incluyó 11 ensayos con 2786 pacientes y sus lactantes, seis de estos ensayos compararon intervenciones en el régimen dietético con atención estándar. Al igual que en esta revisión se observó una reducción en la DMG en las pacientes que recibieron intervenciones en el régimen dietético en comparación con atención estándar (evidencia de muy baja calidad); sin embargo, a diferencia de la presente revisión, un análisis de subgrupos indicó un mayor efecto del tratamiento en las pacientes con sobrepeso y obesidad (Tieu 2017). Tieu 2017 también encontró menos aumento de peso gestacional entre las pacientes que recibieron intervenciones en el régimen dietético en comparación con atención estándar (evidencia de baja calidad). Han 2012 incluyó cinco ensayos con 1115 pacientes y sus lactantes que evaluaron una intervención con ejercicios en comparación con atención estándar. A diferencia de la presente revisión no se observó una repercusión clara de las intervenciones con ejercicios sobre la DMG (no se evaluó la calidad de la evidencia)(Han 2012). Ambas revisiones concluyeron que se requiere evidencia adicional de alta calidad (Han 2012; Tieu 2017).
Otra revisión Cochrane evaluó intervenciones en el régimen dietético, intervenciones con ejercicios e intervenciones combinadas con régimen dietético y ejercicios para la prevención del aumento excesivo de peso en el embarazo (Muktabhant 2015). Muktabhant 2015 incluyó 65 ensayos, de los que 49 con 11 444 pacientes y sus lactantes contribuyeron con datos, y la mayoría comparó dichas intervenciones con atención estándar. Como en la presente revisión, las intervenciones en el régimen dietético o el ejercicio, o ambos, mostraron reducir el aumento de peso gestacional excesivo (evidencia de calidad alta), y dieron lugar a un menor aumento de peso gestacional en comparación con atención estándar (evidencia de calidad moderada) (Muktabhant 2015). A diferencia de la presente revisión, se observó una reducción de la hipertensión materna (evidencia de baja calidad), y no se observaron diferencias claras en el parto prematuro (evidencia de calidad moderada) ni la macrosomía (evidencia de calidad alta). Sin embargo, en un análisis de subgrupos por el riesgo, las pacientes con alto riesgo que recibieron intervenciones combinadas con ejercicios y régimen dietético tuvieron un menor riesgo de macrosomía (evidencia de calidad moderada), y los lactantes tuvieron un menor riesgo de síndrome de dificultad respiratoria (evidencia de calidad moderada) (Muktabhant 2015), según se observó. Muktabhant 2015 no evaluó la repercusión de dichas intervenciones en la DMG (que es el centro de esta revisión).
Otras muchas revisiones sistemáticas y no sistemáticas han evaluado intervenciones con ejercicios y régimen dietético para la reducción de los resultados adversos del embarazo, incluida la DMG. Las revisiones aún proporcionan resultados inconsistentes con respecto a los efectos beneficiosos; sin embargo, gran parte de esta variación posiblemente es atribuible a las diferencias en los grupos de pacientes y los tipos de intervenciones (y por lo tanto, los ensayos) incluidos y evaluados. Por ejemplo en cuanto a las variaciones en los tipos de intervenciones, recientemente Song 2016 realizó una revisión sistemática y metanálisis que evaluó los efectos de intervenciones con ejercicios y régimen dietético en el riesgo de DMG. La revisión incluyó 29 ensayos con 11 487 pacientes y en general mostró una reducción en la DMG (Song 2016). Song 2016 por lo que concluyó que la modificación en el estilo de vida durante el embarazo puede reducir el riesgo de DMG. Sin embargo, cuando las intervenciones combinadas con ejercicios y régimen dietético (14 ensayos), las intervenciones en el régimen dietético solo (cinco ensayos) y las intervenciones con ejercicio solo (diez ensayos) se consideraron por separado, las reducciones observadas en la DMG ya no fueron "estadísticamente significativas", aunque la dirección del efecto para cada tipo de intervención indicó un efecto beneficioso (Song 2016). Con respecto a las evaluaciones de las intervenciones en diferentes grupos de pacientes, O’Brien 2016, por ejemplo, no mostró una repercusión clara de las intervenciones en el régimen dietético y el estilo de vida sobre la DMG específicamente en las pacientes con un IMC normal; mientras queMadhuvrata 2015 mostró una reducción en la DMG con las intervenciones en el régimen dietético (pero no con las intervenciones con ejercicio ni con las intervenciones combinadas con ejercicios y régimen dietético) específicamente en las pacientes con factores de riesgo de DMG.
Un análisis de datos de participantes individuales (DPI) reciente de intervenciones prenatales con régimen dietético y ejercicios (Rogozińska 2017) mostró algunas semejanzas y diferencias con los resultados de la presente revisión. En los DPI generales, hubo 36 estudios con 12 343 pacientes (última búsqueda en marzo de 2015), que analizaron intervenciones en el régimen dietético solo, intervenciones con ejercicio solo e intervenciones mixtas con ejercicios y régimen dietético en comparación con atención estándar. Los DPI no encontraron diferencias generales en la DMG ni el parto prematuro, a diferencia del hallazgo de la presente revisión de una reducción en estos dos resultados. Sin embargo, esta revisión y el DPI encontraron reducciones en el aumento de peso gestacional y la cesárea con las intervenciones en el estilo de vida. El DPI incluyó 16 estudios con intervenciones mixtas con ejercicios y régimen dietético pero señaló que otros diez estudios con intervenciones mixtas con ejercicios y régimen dietético no se incluyeron, lo que puede explicar las diferencias en los resultados (la presente revisión incluyó 23 estudios).
Aunque al parecer se ha acumulado evidencia a favor de las intervenciones combinadas con ejercicios y régimen dietético para la prevención de la DMG, todavía existe incertidumbre y se requiere trabajo adicional para dilucidar los efectos específicos en diferentes grupos de pacientes y con intervenciones con ejercicios y régimen dietético de características diferentes.

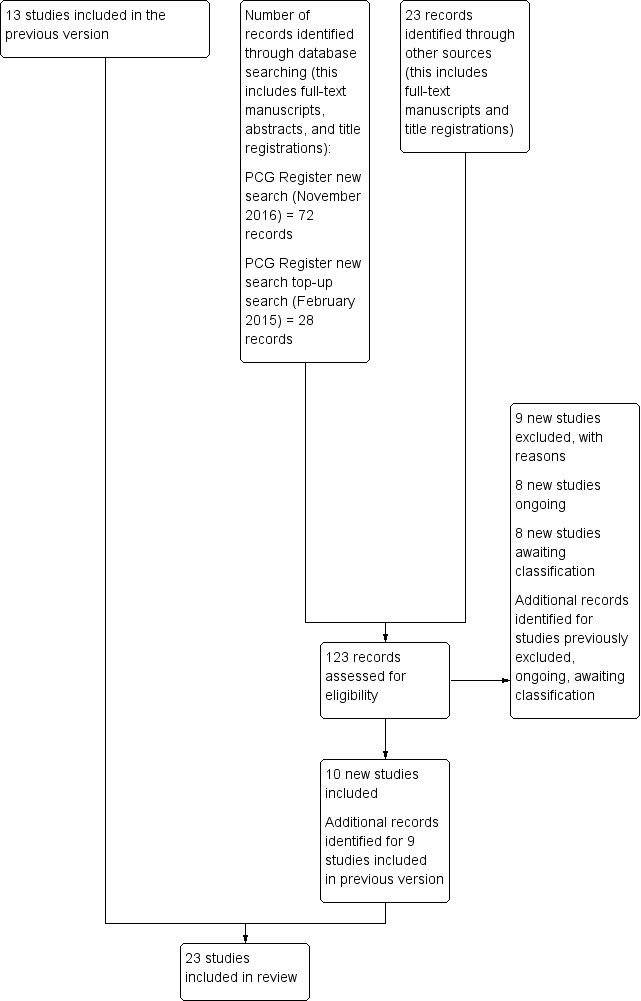
Update study flow diagram.
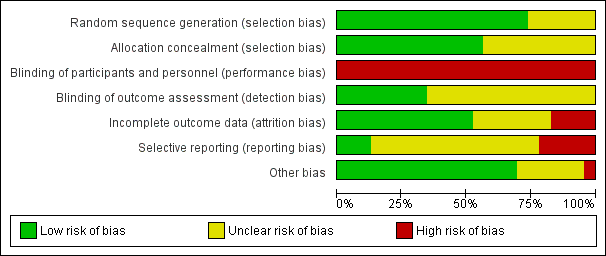
'Risk of bias' graph: review authors' judgements about each risk of bias item presented as percentages across all included trials.

'Risk of bias' summary: review authors' judgements about each risk of bias item for each included trial.

Funnel plot of comparison: 1 Diet and exercise interventions versus control, outcome: 1.1 Gestational diabetes.

Funnel plot of comparison: 1 Diet and exercise interventions versus control, outcome: 1.4 Caesarean section.

Funnel plot of comparison: 1 Diet and exercise interventions versus control, outcome: 1.6 Large‐for‐gestational age.

Funnel plot of comparison: 1 Diet and exercise interventions versus control, outcome: 1.13 Gestational weight gain (kg).

Funnel plot of comparison: 1 Diet and exercise interventions versus control, outcome: 1.16 Gestational weight gain (above IOM recommendations).

Funnel plot of comparison: 1 Diet and exercise interventions versus control, outcome: 1.31 Gestational age at birth (weeks).

Funnel plot of comparison: 1 Diet and exercise interventions versus control, outcome: 1.33 Preterm birth.

Funnel plot of comparison: 1 Diet and exercise interventions versus control, outcome: 1.35 Macrosomia.
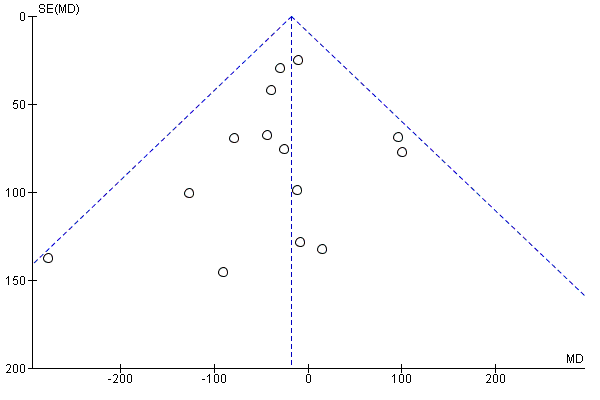
Funnel plot of comparison: 1 Diet and exercise interventions versus control, outcome: 1.37 Birthweight (g).

Comparison 1 Combined diet and exercise interventions versus standard care, Outcome 1 Gestational diabetes.

Comparison 1 Combined diet and exercise interventions versus standard care, Outcome 2 Pre‐eclampsia.

Comparison 1 Combined diet and exercise interventions versus standard care, Outcome 3 Pregnancy‐induced hypertension and/or hypertension.

Comparison 1 Combined diet and exercise interventions versus standard care, Outcome 4 Caesarean section.

Comparison 1 Combined diet and exercise interventions versus standard care, Outcome 5 Perinatal mortality.

Comparison 1 Combined diet and exercise interventions versus standard care, Outcome 6 Large‐for‐gestational age.

Comparison 1 Combined diet and exercise interventions versus standard care, Outcome 7 Operative vaginal birth.

Comparison 1 Combined diet and exercise interventions versus standard care, Outcome 8 Induction of labour.

Comparison 1 Combined diet and exercise interventions versus standard care, Outcome 9 Perineal trauma.

Comparison 1 Combined diet and exercise interventions versus standard care, Outcome 10 Placental abruption.

Comparison 1 Combined diet and exercise interventions versus standard care, Outcome 11 Postpartum haemorrhage.
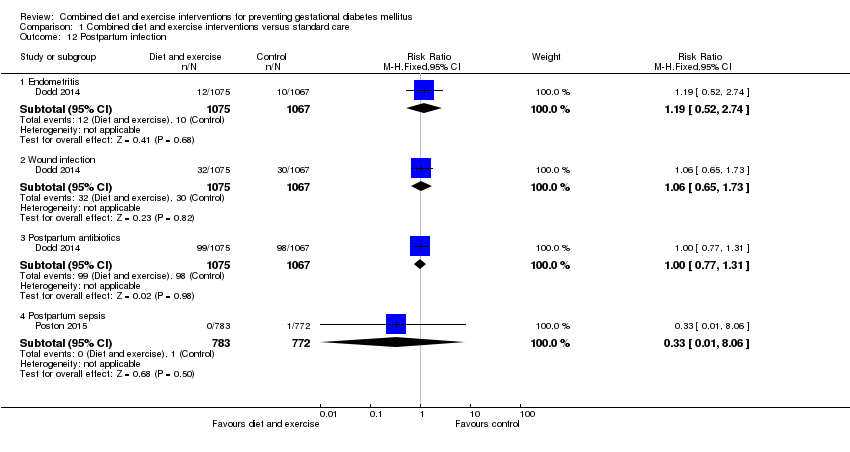
Comparison 1 Combined diet and exercise interventions versus standard care, Outcome 12 Postpartum infection.

Comparison 1 Combined diet and exercise interventions versus standard care, Outcome 13 Gestational weight gain (kg).

Comparison 1 Combined diet and exercise interventions versus standard care, Outcome 14 Gestational weight gain (various times reported) (kg).
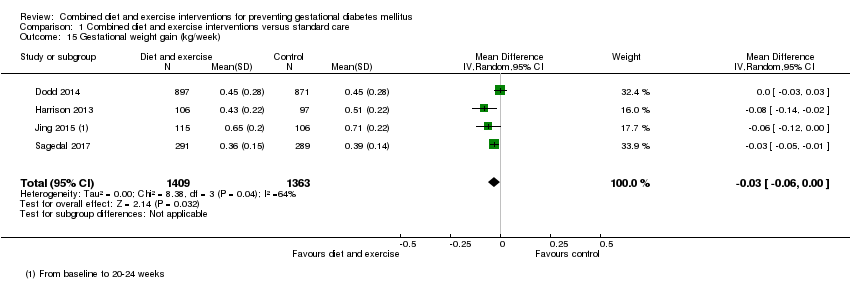
Comparison 1 Combined diet and exercise interventions versus standard care, Outcome 15 Gestational weight gain (kg/week).
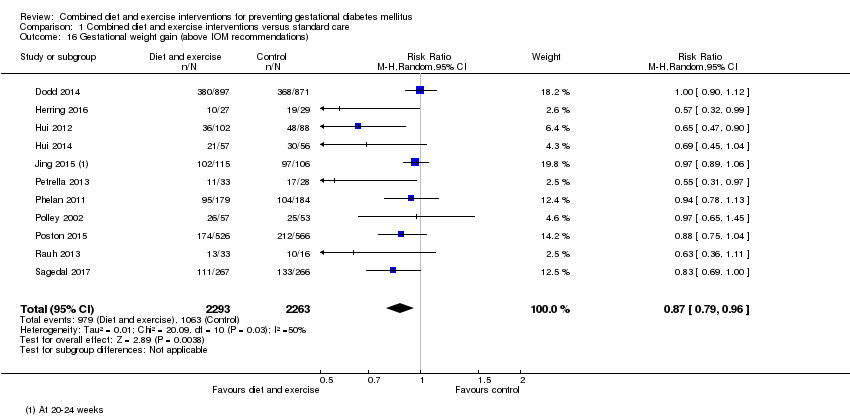
Comparison 1 Combined diet and exercise interventions versus standard care, Outcome 16 Gestational weight gain (above IOM recommendations).

Comparison 1 Combined diet and exercise interventions versus standard care, Outcome 17 Gestational weight gain (within IOM recommendations).
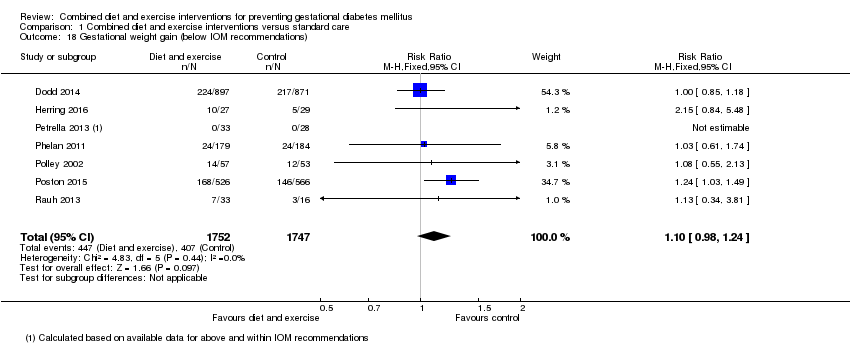
Comparison 1 Combined diet and exercise interventions versus standard care, Outcome 18 Gestational weight gain (below IOM recommendations).
| Study | Diet | Exercise | Benefit in favour of intervention | Benefit in favour of control |
| Bruno 2016 | Higher proportion of women in intervention group, compared with the control group, with Food Frequency Questionnaire score ≥ 2 at 36th week (P = 0.028). No clear difference between groups in ≥ 2 servings of vegetables/day (P = 0.400) or ≤ 3 times/week of food rich in saturated fat; higher proportion of women in intervention group, compared with the control group, having ≤ 30 g sugar/day (P = 0.026). | No clear difference between groups in number of steps/day or duration of physical activity in minutes at the 20th week. Women in the intervention group, compared with the control group, were less active at the 36th week (fewer steps/day (P = 0.016) and had a shorter duration of physical activity (P = 0.039)). | Some (diet) | Some (exercise) |
| Dodd 2014 | Macronutrient consumption and food groups Micronutrient consumption Healthy Eating Index (HEI) Glycaemic index and glycaemic load No clear difference between groups (from trial entry to 28 weeks, 36 weeks, 4 months) in glycaemic load (P = 0.15) or glycaemic index (P = 0.10). Changes in diet and knowledge of healthy food choices "women receiving lifestyle advice were more likely to indicate that the approach to participate in the trial prompted changes to... their diet [... p < 0.0001]... Women who received the intervention indicated greater knowledge about healthy food choices [... p < 0.0001]... compared with women who received Standard Care." | Physical activity Women in the intervention group, compared with the control group (from trial entry, to 28 weeks, 36 weeks, 4 months) had an increase in total activity (P = 0.01); and specifically an increase in household activity (P = 0.01). No clear differences between groups for commuting activity (P = 0.55), leisure activity (P = 0.06) or work activity (P = 0.52). Changes in lifestyle and knowledge of healthy exercise during pregnancy "women receiving lifestyle advice were more likely to indicate that the approach to participate in the trial prompted changes to... their lifestyle [...p < 0.0001]. Women who received the intervention indicated greater knowledge about... exercise during pregnancy [... p < 0.0001] compared with women who received Standard Care." | Some (diet and exercise) | No |
| Harrison 2013 | Not reported | The intervention group had higher steps/day at 28 weeks gestation compared with the control group (P < 0.05); no clear difference between groups in MET minutes‐1/day estimated by the The International Physical Activity Questionnaire (P value not reported). No clear difference between groups at 6 weeks postpartum in physical activity (steps/day) (P = 0.6). | Some (exercise) | No |
| Hawkins 2014 | No clear differences between groups in change from baseline to mid‐pregnancy and baseline to postpartum for total caloric intake (P = 0.78; P = 0.44), calories from fat (%) (P = 0.66; P = 0.14), and fibre (g) (P = 0.20; P = 0.23). | No clear differences between groups in change from baseline to mid‐pregnancy and baseline to postpartum for moderate‐intensity (P = 0.17; P = 0.78), moderate and vigorous‐intensity (P = 0.80; P = 0.82), or sports/exercise (P = 0.72; P = 0.63) physical activity; though significant increase in vigorous‐intensity physical activity in the intervention compared with control group (P = 0.04; P = 0.046) (MET hours/week). | No (diet) Some (exercise) | No |
| Hui 2012 | At 2 months after enrolment, the intervention group, compared with the control group, had lower daily intakes of total calories (P = 0.002*), carbohydrate (g) (P = 0.04), fat (g) (P = 0.0001*), saturated fat (g) (P = 0.00004*), cholesterol (mg) (P = P = 0.001*) and fat ratio (%) (P = 0.001*); and higher carbohydrate ratio (%) (P = 0.02) and protein ratio (%) (P = 0.04); no clear differences between groups for intakes of protein (g) (P = 0.11), and fibre (g) (P = 0.63). At 2 months after enrolment, the intervention group, compared with the control group, had lower daily servings of medium‐fat meat (P = 0.01), 1‐2% fat milk (P = 0.02) and oil and fats (P = 0.02), and higher daily servings of skim milk (P = 0.02); no clear differences between groups for starch (P = 0.66), very lean meat (P = 0.66), lean meat (P = 0.17), high‐fat meat (P = 0.50), vegetables (P = 0.43), fruits (P = 0.39), or whole fat milk (P = 0.15). *P values with statistical significance after Bonferroni | At 2 months after enrolment, the physical activity index was higher in the intervention group compared with the control group (P = 0.00002). | Some (diet) Yes (exercise) | No |
| Hui 2014 | Pre‐pregnancy BMI < 25 At 2 months after the onset of the intervention, women in the intervention group compared with the control group had lower intakes of total calorie (P = 0.01), carbohydrate (g) (P = 0.03), total fat (g) (P = 0.008), saturated fat (g) (P = 0.008), and cholesterol (mg) (P = 0.02); no clear difference between groups for intake of protein (g) (P = 0.36). Pre‐pregnancy BMI ≥ 25 At 2 months after the onset of the intervention, women in the intervention group compared with the control group had lower intakes of total calorie (P = 0.05), total fat (g) (P = 0.02), saturated fat (g) (P = 0.01), and cholesterol (mg) (P = 0.03); no clear differences between groups for intakes of carbohydrate (g) (P = 0.44) or protein (g) (P = 0.17). | Pre‐pregnancy BMI < 25 At 2 months after the onset of the intervention, women in the intervention group compared with the control group had higher physical activity index (units) (P < 0.01). Pre‐pregnancy BMI ≥ 25 At 2 months after the onset of the intervention, no clear difference between groups for physical activity index (units) (P value not reported) | Some (diet and exercise) | No |
| Jing 2015 | No clear differences between groups at 20‐24 weeks gestation for intake of carbohydrate (g) (P = 0.058), fat (g) (P = 0.216), meat (g) (P = 0.235), vegetables (g) (P = 0.637), eggs (g) (P = 0.962), milk (g) (P = 0.060), beans (g) (P = 0.982). Higher intake of energy (kcal) (P = 0.024), protein (g) (P = 0.003), grain (g) (P = 0.013), fruit (g) (P = 0.048), seafood (P = 0.031), and nuts (P = 0.036) for women in intervention group compared with control group. | No clear difference between groups at 20‐24 weeks for time spent (hours/day) doing moderate activity (P = 0.824) [and no clear difference between groups for time spent (hours/day) on intensities A, B, C, E, F, G, H]. Less time spent resting (P = 0.033) and more time doing mild activity (P = 0.016) among women in the intervention group compared with control group [and more time spent (hours/day) on intensity D]. | Some (diet and exercise) | No |
| Koivusalo 2016 | The dietary index score improved more among women in the intervention group, compared with the control group (P = 0.16 unadjusted, P = 0.037 adjusted). No clear differences between groups in changes in food intake from the first to second trimester for low‐fat milk (times/day) (P = 0.726), whole‐grain cereal (times/day) (P = 0.182), fruits and berries (times/day) (P = 0.865), vegetables and legumes (times/day) (P = 0.419), animal protein (times/day) (P = 0.658), snacks (times/week) (P = 0.112), sugar sweetened beverages (times/week) (P = 0.750), fast food (times/week) (P = 0.731), spread fat (score) (P = 0.103), cooking fat (score) (P = 0.937). Intakes of low‐fat cheese (P = 0.040) and fish (P = 0.011) increased in the intervention group compared with the control group. | Women in the intervention group increased their median weekly leisure time physical activity while the physical activities of women in the control group remained unchanged (P = 0.17 unadjusted, P = 0.029 adjusted). No clear difference between groups in proportion of women meeting the physical activity goal (150 minutes/week in the second trimester). | Some (diet and exercise) | No |
| Luoto 2011 | Dietary changes Compared with the control group, from baseline to 26‐28 weeks, the intervention group reduced their intake of saccharose (E%) (P = 0.04), and saturated fatty acids (E%) (P = 0.005); no clear differences between groups seen for intakes of total energy (MJ/day) (P = 0.97), total energy (kcal/day) (P = 0.97), protein (E%) (P = 0.094), carbohydrates (E%) (P = 0.76), dietary fibre (g/day) (P = 0.44), total fat (E%) (P = 0.15), trans fatty acids (E%) (P = 0.65), mono saturated fatty acids (E%) (P = 0.99), or polyunsaturated fatty acids (E%) (P = 0.21). Compared with the control group, from baseline to 36‐37 weeks, the intervention group reduced their intake of saccharose (E%) (P = 0.023) and saturated fatty acids (E%) (P = 0.01) and increased their intake of dietary fibre (g/day) (P = 0.019) and polyunsaturated fatty acids (E%) (P < 0.001); no clear differences between groups seen for intakes of total energy (MJ/day) (P = 0.90), total energy (kcal/day) (P = 0.90), protein (E%) (P = 0.29), carbohydrates (E%) (P = 0.60), total fat (E%) (P = 0.86), trans fatty acids (E%) (P = 0.30), or mono saturated fatty acids (E%) (P = 0.51). Food habits related to the objectives of dietary counselling From baseline to 26‐28 weeks, the intervention group, compared with the control group, increased their proportion of high‐fibre bread (% of all bread) (P = 0.001) and vegetable fats (% of all dietary fat) (P = 0.001), while the control group decreased their proportion of low‐fat cheeses (% of all cheese) (P = 0.001), and increased intake of snacks high in sugar and/or fat (g/day) (P = 0.022); no clear differences between groups in intake of vegetables, fruits and berries (g/day) (P = 0.117), fat‐free or low‐fat milk (% of all milk) (P = 0.093), frequency of eating fish (per week) (P = 0.120), or high‐fat foods (g/day) (0.664). From baseline to 36‐37 weeks, the intervention group, compared with the control group, increased their intake of vegetables, fruits and berries (g/day) (P = 0.001), proportion of high‐fibre bread (% of all bread) (P = 0.003) and vegetable fats (% of all dietary fat) (P = 0.003), while the control group decreased their proportion of low‐fat cheeses (% of all cheese) (P = 0.009); no clear differences between groups in proportion of fat‐free or low‐fat milk (% of all milk) (P = 0.630), frequency of eating fish (per week) (P = 0.068), intake of high‐fat foods (g/day) (0.108), or snacks high in sugar and/or fat (g/day) (P = 0.551). Consumption of the main food groups and foods From baseline to 26‐28 weeks gestation, the intervention group, compared with the control group, increased total intake of milk (P = 0.025), fish (P = 0.041), vegetable oils (P = 0.002) and oil based salad dressings (P = 0.002); while the control group, compared with the intervention group, increased consumption of porridge and breakfast cereals (P = 0.003) and candies and chocolates (P = 0.008) (all g/day); no clear differences between groups for intake of fruits and berries (P = 0.575), cooked potato or in dishes (P = 0.686), french fries, chips and other fatty potato products (P = 0.995), total bread (P = 0.459), rice and pasta (P = 0.118), total cheese (P = 0.318), red meat and game (P = 0.851), poultry (P = 0.252), sausages (P = 0.896), vegetable spreads (P = 0.071), butter and butter mixtures (P = 0.128), solid baking margarines (P = 0.194), sweet pastries and other sugary food items (P = 0.055), pizza and hamburgers (P = 0.703), tea (P = 0.464), coffee (P = 0.976), sugary soft drinks (P = 0.088) or juice (P = 0.096) (all g/day). From baseline to 36‐37 weeks gestation, the intervention group, compared with the control group, increased total intake of fish (P = 0.044), vegetable oils (P = 0.002) and oil based salad dressings (P = 0.010); while the control group, compared with the intervention group, decreased consumption of vegetables (P = 0.005); no clear differences between groups for intake of fruits and berries (P = 0.134), cooked potato or in dishes (P = 0.157), french fries, chips and other fatty potato products (P = 0.388), total bread (P = 0.175), porridge and breakfast cereals (P = 0.811), rice and pasta (P = 0.187), total milk (P = 0.878), total cheese (P = 0.364), red meat and game (P = 0.806), poultry (P = 0.482), sausages (P = 0.444), vegetable spreads (P = 0.215), butter and butter mixtures (P = 0.417), solid baking margarines (P = 0.208), candies and chocolates (P = 0.133), sweet pastries and other sugary food items (P = 0.104), pizza and hamburgers (P = 0.755), tea (P = 0.235), coffee (P = 0.481), sugary soft drinks (P = 0.730) or juice (P = 0.094) (all g/day). | Physical activity changes No clear differences between baseline to 26‐28 weeks or baseline to 36‐37 weeks for total MET minutes/week (P = 0.36; P = 0.63), MET minutes/week for at least moderate activity (P = 0.17; P = 0.82), MET minutes/week for light activity (P = 0.57; P = 0.17), or ≥ 800 MET minutes/week (%) (P = 0.27; P = 0.51). At 26‐28 weeks, the decreases in total leisure‐time physical activity (LTPA) (days/week) and moderate‐to‐vigorous LTPA (days/week) were smaller in the intervention group compared with the control group (P = 0.040; P = 0.016); though no clear differences between group/days in total LTPA (minutes/week) (P = 0.58), moderate‐to‐vigorous LTPA (minutes/week) (P = 0.11), light LTPA (days/week) (P = 0.80), light LTPA (minutes/week) (P = 0.65), or meeting physical activity recommendations for health (%) (P = 0.060) were observed. No clear differences between groups from baseline to 36‐37 weeks in total LTPA (days/week: P = 0.80; minutes/week: P = 0.60), moderate‐to‐vigorous LTPA (days/week: P = 0.16; minutes/week: P = 0.96), or light LTPA (days/week: P = 0.21; minutes/week: P = 0.75), or meeting physical activity recommendations for health (%: P = 0.70). "From 26‐28 weeks’ gestation to 36‐37 weeks’ gestation the number of weekly days with light‐intensity LTPA decreased significantly less in INT than in UC (0.1 vs. 0.6 days, p = 0.05, not shown in Table 4)." | Some (diet and exercise) | No |
| Petrella 2013 | "Significant changes in eating habits occurred in the Therapeutic Lifestyle Changes group, increasing the number of snacks/day, the consumption of vegetables and fruits. Moreover, intervention also decreased the consumption of sugar. No differences in the number of daily spoons of oil, red meat and complex carbohydrates intake were found." | "The step numbers for each walking session was constant during pregnancy (3267 ± 1683 at 36th week and 3755 ± 1816 at 28th week)." | Not applicable (only reported for intervention group) | Not applicable (only reported for intervention group) |
| Phelan 2011 | "No significant treatment... interaction effects over time were observed... for dietary factors." Repeated‐measures ANOVA of time (early pregnancy, late pregnancy, 6 months postpartum, 12 months postpartum) x treatment group interactions for dietary changes in calorie intake, percentage of calories from fat, percentage of calories from carbohydrate, percentage of calories from protein, percentage of calories from sweets, daily calories from soft drinks, daily saturated fat (g), daily servings of vegetables, daily servings of fruit and fruit juices, daily servings of bread, cereals, rice, pasta, daily servings of milk, yogurt, cheese, daily frequency of fats and oils, sweets, sodas, weekly fast food, daily iron from food (mg), daily calcium from food (mg), total daily dietary fibre (g), daily vitamin D from food (IU), daily folate from food (μg): P values all "NS." | "A trend was observed for an effect of the intervention on physical activity... which suggested a small intervention‐related increase in calories expended in physical activity during the postpartum period." Repeated‐measures ANOVA of time (early pregnancy, late pregnancy, 6 months postpartum, 12 months postpartum) x treatment group interaction for kcal (F = 2.5, P = 0.06, hp2 = 0.02). | No (diet) Yes (exercise) | No |
| Polley 2002 | "All groups decreased their fat consumption from these foods from baseline to 30 weeks, except normal‐weight women in the control condition. There was no effect of treatment on changes in fat intake from these foods from recruitment to 30 weeks (P>0.2)." | "Changes in exercise level from recruitment to 30 weeks (P>0.8) were not related to treatment condition." | No | No |
| Poston 2013 | At 28 weeks gestation, the intervention group had lower intakes of total energy (MJ/day) (P = 0.016), dietary glycaemic load (g/day) (P = < 0.001), glycaemic load (%E) (P = 0.013), total fat (%E) (P = 0.010) and saturated fatty acids (%E) (P = 0.015), and higher protein (%E) (P = 0.034), and fibre (non‐starch polysaccharides) (g) (P = 0.040) compared with the control group; no clear differences between groups for dietary glycaemic index (%) (P = 0.054), carbohydrate (%E) (P = 0.207), protein (g) (P = 0.204), monounsaturated fatty acids (%E) (P = 0.088), polyunsaturated fatty acids (%E) (P = 0.075), or polyunsaturated fatty acid, saturated fatty acid ratio (P = 0.075). "A principal component analysis (PCA) of Food Frequency Questionnaire (FFQ) data from the UPBEAT pilot study database was performed to derive three diet patterns: two with high coefficients for high‐sugar and/or highfat food groups defined as ‘Western’ and ‘Healthy‐unhealthy choices’ and a ‘traditional’ African or African‐Caribbean diet pattern…. The ‘Western’ and ‘Healthy‐unhealthy choices’ patterns scores were reduced in those who received the intervention." | At 28 weeks gestation, no clear differences between groups for physical activity, as measured by accelerometer (minutes/day of sedentary, active, light, moderate to vigorous activity) (P values not reported; mean differences with 95% confidence intervals indicate no clear differences), and Recent Physical Activity Questionnaire (minutes/day of sedentary, activity, light activity); self‐reported moderate to vigorous activity (minutes/day) was higher in the intervention group compared with the control group (P value not reported; mean difference with 95% confidence interval indicates difference), and women in the intervention group self‐reported walking (minutes/day) for leisure more than those in the control group (P = 0.003). | Some (diet and exercise) | No |
| Poston 2015 | At 27‐28 weeks and 6 days, women in the intervention group, compared with the control group, had lower mean total energy (MJ/day) (P < 0.0001), glycaemic index (0‐100) (P < 0.0001), glycaemic load per day (P < 0.0001), and intake carbohydrate (% energy) (P = 0.0011), total fat (% energy) (P = 0.0011), saturated fat (g/day) (P < 0.0001) and saturated fat (% energy) (P < 0.0001); and higher intake of protein (% energy) (P < 0.0001), and fibre (g/day) (P = 0.013). At 6 months postpartum, women in the intervention group, compared with the control group, had lower glycaemic load per day (P < 0.001), glycaemic index (0‐100) (P < 0.001), intakes of total energy (kcal per day) (P < 0.001), saturated fat (% energy) (P < 0.001), and total fat (% energy) (P < 0.001), and higher intake of protein (% energy) (P < 0.001); no clear differences between groups for intakes of carbohydrates (% energy) (P = 0.835) and fibre (g/day) (P = 0.873). | At 27‐28 weeks and 6 days, women in the intervention group, compared with the control group, were more physically active: MET (minutes/week) (P = 0.0015); attributed to more time spent walking (minutes/week) (P = 0.0018), with no clear difference seen between groups for moderate or vigorous activity (minutes/week) (P > 0.99). At 6 months postpartum, no clear differences between groups for measures of physical activity: MET (minutes/week) (P = 0.607), moderate or vigorous activity (minutes/week) (P = 0.681), or walking (minutes/week) (P = 1.00). | Some (diet and exercise) | No |
| Rauh 2013 | The intervention group had a lower change from baseline to 36‐38th week gestation energy intake compared with the control group (kcal/day) (P = 0.035). | No clear difference between groups in change from baseline to 36‐38th week gestation total activity (MET‐min/week) (P = 0.425). | Yes (diet) No (exercise) | No |
| Sagedal 2017 | At 36 weeks gestation the intervention group had a higher (more favourable) diet score compared with the control group (P = 0.013); dietary differences favouring the intervention group were identified in 7 domains: ‘drinking water when thirsty’ (P = 0.002), ‘vegetables with dinner’ (P = 0.027), ‘fruits and vegetables for between‐meal snacks’ (P = 0.023), ‘package size of unhealthy foods’ (P = 0.010), ‘added sugar' (P = 0.005), ‘eating beyond satiety’ (P = 0.009) and ‘food labels’ (P = 0.011); no clear differences between groups for 'meal regularity' (P = 0.176), 'eating sweets or snacks without appreciation' (P = 0.446), 'added salt' (P = 0.680). | At 36 weeks gestation the intervention group compared with the control group had higher weekly energy expenditure (MET‐minutes/week) (P = 0.009), and according to the International Physical Activity Questionnaire, fewer had 'low activity', and more had 'moderate activity' and 'high activity' (P = 0.013). | Some (diet) Yes (exercise) | No |
| Vinter 2011 | "When asked at 35 weeks’ gestation whether participation in the LiP study had resulted in more healthy eating habits, 85% of women in the intervention group responded affirmatively. In addition, 21% of women in the control group thought that their dietary habits in pregnancy were positively influenced by their participation." At 35 weeks' gestation, women in the intervention group had higher self‐reported physical activity levels compared with those in the control group (physical activity ≥ 2 hours/week (P = 0.001); physical activity making them sweaty or short of breath ≥ 2 hours/week (P < 0.001)); no clear differences between groups at 6 months postpartum (physical activity ≥ 2 hours/week (P = 0.620); physical activity making them sweaty or short of breath ≥ 2 hours/week (P = 0.961)). | "Among women in the intervention group, 77.5% undertook leisure time sporting activities in addition to the aerobic classes. In addition, 65% of women in the control group engaged in some type of leisure time sporting activities during pregnancy (P = 0.016)." At 35 weeks' gestation, women in the intervention group had improved eating habits compared with those in the control group (considered themselves as in the most healthy eating habit groups (P = 0.003)); no clear differences between groups at 6 months postpartum (considered themselves as in the most healthy eating habit groups (P = 0.609)). | Some (diet and exercise) | No |
Comparison 1 Combined diet and exercise interventions versus standard care, Outcome 19 Behaviour changes associated with the intervention.
| Study | Results | Benefit in favour of intervention | Benefit in favour of control |
| Hawkins 2014 | No clear differences between groups in change in biomarkers of insulin resistance from baseline to mid‐pregnancy: glucose (mmol/L) (P = 0.63); insulin (pmol/L) (P = 0.39); leptin (pmol/L) (P = 0.73); adiponectin (nmol/L) (P = 0.51); resistin (nmol/L) (P = 0.19); tumour necrosis factor‐alpha (pmol/L) (P = 0.11); c‐reactive protein (nmol/L) (P = 0.19). | No | No |
| Koivusalo 2016 | Women in the intervention group compared with the control group had a greater change (reduction) in fasting plasma glucose from baseline to the third trimester (P = 0.026 unadjusted; P = 0.011 adjusted). No clear difference between groups in change (increase) in 2‐hour glucose from baseline to second trimester (P = 0.92 unadjusted, P = 0.42 adjusted). | Some | No |
| Korpi‐Hyovalti 2011 | No clear difference between groups in fasting glucose (mmol/L), OGTT 1‐hour glucose (mmol/L), OGTT 2‐hour glucose (mmol/L), or area under the curve (mmol/L/2 hour) (all reported to be P = NS) at weeks 26‐28. | No | No |
| Luoto 2011 | There were no clear differences between groups in glucose intolerance measurements at 26‐28 weeks (glucose concentrations in 2‐hour OGTT (mg/L): fasting (P = 0.44), 1‐hour (P = 0.23), 2‐hour (P = 0.99); insulin (P = 0.10), or HOMA‐IR (P = 0.13)); or in the change from baseline (8‐12 weeks) to 26‐28 week values for insulin (P = 0.23), or HOMA‐IR (P = 0.24). | No | No |
| Poston 2015 | At 27‐28 weeks and 6 days gestation, no clear differences between groups in fasting blood glucose (mmol/L) (P = 0.49), 1‐hour blood glucose (mmol/L) (P = 0.43), 2‐hour blood glucose (mmol/L) (P = 0.81), plasma fasting insulin (mU/L) (P = 0.57), HOMA‐IR (units) (P = 0.60), plasma triglycerides (mmol/L) (P = 0.39), plasma LDL cholesterol (mmol/L) (P = 0.27), plasma HDL cholesterol (mmol/L) (0.93), plasma VLDL (mmol/L) (P = 0.39). | No | No |
| Vinter 2011 | Glucose metabolism and insulin sensitivity No clear differences between groups in fasting plasma glucose (mmol/L) at 28‐30 weeks (P = 0.060) or 34‐36 weeks (P = 0.431). No clear differences between groups in 2‐hour oral glucose tolerance test (mmol/L) at 28‐30 weeks (P = 0.459) or 34‐36 weeks (P = 0.723). No clear differences between groups in fasting insulin (mU/L) at 34‐36 weeks (P = 0.065) or change from baseline to 34‐36 weeks fasting insulin (P = 0.063); women in the intervention group had lower fasting insulin at 28‐30 weeks (P = 0.040), and lower change from baseline to 28‐30 weeks fasting insulin (P = 0.015). No clear differences between groups in HOMA‐IR at 34‐36 weeks (P = 0.062) or change from baseline to 34‐36 weeks fasting insulin (P = 0.079); women in the intervention group had lower fasting insulin at 28‐30 weeks (P = 0.032), and lower change from baseline to 28‐30 weeks fasting insulin (P = 0.022). No clear differences between groups at 28‐30 weeks or 34‐36 weeks for fasting cholesterol (mmol/L) (P = 0.332; P = 0.484), fasting HDL (mmol/L) (P = 0.781; P = 0.871), fasting LDL (mmol/L) (P = 0.148; P = 0.183), or fasting triglycerides (mmol/L) (P = 0.385; P = 0.399). | Some | No |
Comparison 1 Combined diet and exercise interventions versus standard care, Outcome 20 Relevant biomarker changes associated with the intervention.
| Study | Results | Benefits in favour of intervention | Benefits in favour of control |
| Dodd 2014 | There were no clear differences between groups (from trial entry, to 28 weeks, 36 weeks and 4 months postpartum) in mean depressive scores (Edinburgh Postnatal Depression Scale (EPDS) mean scores) (adjusted P = 0.25), risk of depression (EPDS score > 12, %) (adjusted P = 0.95), symptoms of anxiety (Spielberger State‐Trait Anxiety Inventory (STAI) mean scores) (adjusted P = 0.51), or risk of high level anxiety (STAI score ≥ 15, %) (adjusted P = 0.31). There were no clear differences between groups for any of the domains assessing health related quality of life (from trial entry, to 28 weeks, 36 weeks and 4 months postpartum) (mean scores: physical functioning adjusted P = 0.53; physical role adjusted P = 0.59; bodily pain adjusted P = 0.27; general health adjusted P = 1.00; vitality adjusted P = 0.48; social functioning adjusted P = 0.52; emotional role adjusted P > 0.11; mental health adjusted P = 0.07; physical component adjusted P = 0.47; mental component adjusted P = 0.36). For emotional role and mental health domains there were significant interactions between treatment group and time point (P = 0.03; P = 0.007); although there were no significant differences between treatment groups at any individual time point, the pattern of change over pregnancy differed according to treatment group. "All women reported a high degree of satisfaction with their pregnancy... p = 0.8722... and with birth... p = 0.9235... Most women agreed or strongly agreed that they felt in control during their pregnancy... p = 0.9945... and birth... p = 0.4510... and they liked their care providers... p = 0.1530... There were no differences with regard to the proportion of women who felt healthy during pregnancy... p = 0.3517... women who received the intervention were more likely to feel reassured about their own health... p = 0.0112... and that of their baby... p = 0.0143... In the postpartum period, most women felt healthy... p = 0.5942... and were not concerned about their future health... p = 0.9444... or the future health of their baby or child... p = 0.9467" | Some (reassurance about own health and health of baby) | No |
| Luoto 2011 | No clear difference between groups from 8‐13 weeks to 36‐37 weeks in change in health related quality of life (15D questionnaire) (P = 0.24), or perceived health (VAS scale of 0–10 cm) (P = 0.061). | No | No |
| Phelan 2011 | "The intervention group... had a significantly greater increase in scores on the Edinburgh Depression Scale during the postpartum period than did the standard‐care group (F = 23.2, P = 0.0001, hp2 = 0.094); however, multiple logistic regression analyses indicated no significant effects of the intervention compared with standard care on the prevalence of depression (defined as a score ≥13) at 30 wk of gestation (6.4% compared with 7.2%, respectively), 6 mo (3.4% compared with 3.6%, respectively), or 12 mo (5.2% compared with 6.3%, respectively) postpartum. Both groups reported very low depression scores overall... No significant treatment... interaction effects over time were observed for dietary disinhibition, stress or sleep." Repeated‐measures ANOVA of time (early pregnancy, late pregnancy, 6 months postpartum, 12 months postpartum) x treatment group interactions for disinhibition, stress, and sleep score: P values all reported to be "NS." | No | Some (Edinburgh Depression Scale scores) |
| Poston 2013 | At 28 weeks gestation, there was no clear difference between groups in the numbers of women reporting problems in each of the EuroQol quality of life (EQ‐5D) questionnaire domains: mobility, self‐care, usual activities, pain and discomfort, anxiety and depression; or in the time trade‐off health state rating and visual analogue scale of health related quality of life (0 to 100) (P values not reported, however treatment effects indicate no clear differences). At 28 weeks gestation there were also no clear differences between groups in Edinburgh Postnatal Depression Score total, total score > 9, and total score > 12 (P values not reported, however treatment effects indicate no clear differences). | No | No |
Comparison 1 Combined diet and exercise interventions versus standard care, Outcome 21 Sense of well‐being and quality of life.

Comparison 1 Combined diet and exercise interventions versus standard care, Outcome 22 Breastfeeding (exclusive).

Comparison 1 Combined diet and exercise interventions versus standard care, Outcome 23 Breastfeeding (partial).
| Study | Diet and exercise | Control | P value |
| Rauh 2013 | Mean (SD not reported) (N = 148, unadjusted) Exclusive breastfeeding duration (days): 130.7 Total breastfeeding duration (days): 232.1 | Mean (SD not reported) (N = 65, unadjusted) Exclusive breastfeeding duration (days): 116.3 Total breastfeeding duration (days): 219.4 | P = 0.180 P = 0.465 |
Comparison 1 Combined diet and exercise interventions versus standard care, Outcome 24 Breastfeeding.
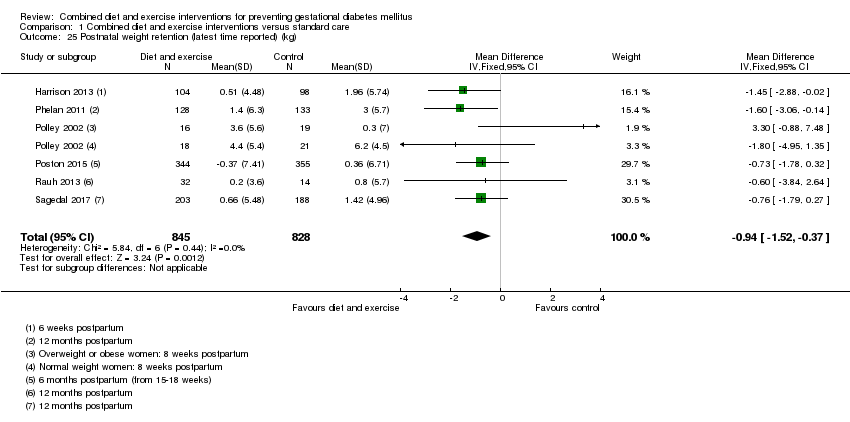
Comparison 1 Combined diet and exercise interventions versus standard care, Outcome 25 Postnatal weight retention (latest time reported) (kg).

Comparison 1 Combined diet and exercise interventions versus standard care, Outcome 26 Return to pre‐pregnancy weight (latest time reported).

Comparison 1 Combined diet and exercise interventions versus standard care, Outcome 27 Postnatal BMI (latest time reported).
| Study | Intervention | Control | P value |
| Vinter 2011 | 6 months postpartum (median (IQR)) (N = 123) Systolic blood pressure (mm Hg): 122 (116–129) Diastolic blood pressure (mm Hg): 83.5 (78–88) | 6 months postpartum (median (IQR)) (N = 115) Systolic blood pressure (mm Hg): 122 (115–128) Diastolic blood pressure (mm Hg): 82 (78–88) | 0.770 0.733 |
Comparison 1 Combined diet and exercise interventions versus standard care, Outcome 28 Maternal cardiovascular health (latest time reported).
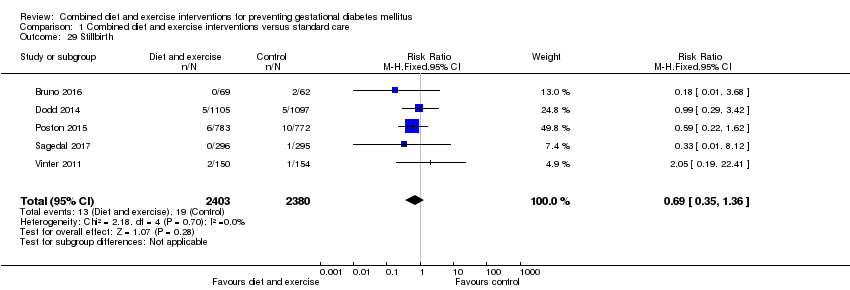
Comparison 1 Combined diet and exercise interventions versus standard care, Outcome 29 Stillbirth.

Comparison 1 Combined diet and exercise interventions versus standard care, Outcome 30 Neonatal mortality.

Comparison 1 Combined diet and exercise interventions versus standard care, Outcome 31 Gestational age at birth (weeks).
| Study | Intervention group | Control group | P value |
| Polley 2002 | Mean (SD not reported) Normal weight women (N = 30) 39.1 weeks Overweight women (N = 27) 39.4 weeks | Mean (SD not reported) Normal weight women (N = 31) 39.5 weeks Overweight women (N = 22) 39.1 weeks | Not reported |
| Vinter 2011 | Median (IQR) (N = 150) 283 days (273‐290) | Median (IQR) (n = 154) 283 days (274‐289) | 0.952 |
Comparison 1 Combined diet and exercise interventions versus standard care, Outcome 32 Gestational age at birth (days or weeks).

Comparison 1 Combined diet and exercise interventions versus standard care, Outcome 33 Preterm birth.
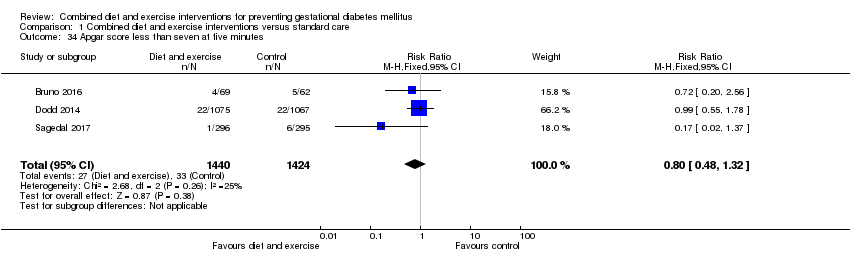
Comparison 1 Combined diet and exercise interventions versus standard care, Outcome 34 Apgar score less than seven at five minutes.

Comparison 1 Combined diet and exercise interventions versus standard care, Outcome 35 Macrosomia.
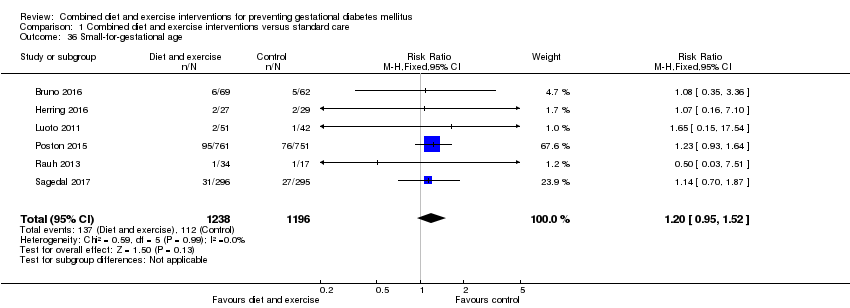
Comparison 1 Combined diet and exercise interventions versus standard care, Outcome 36 Small‐for‐gestational age.

Comparison 1 Combined diet and exercise interventions versus standard care, Outcome 37 Birthweight (g).
| Study | Intervention group | Control group | P value |
| Herring 2016 | Mean (SD not reported) (N = 27) 3147 | Mean (SD not reported) (N = 29) 3361 | Mean difference: ‐213 (95% CI: ‐431 to 3.7) |
| Polley 2002 | Mean (SD not reported) Born to normal weight women (N = 30) 3133.0 Born to overweight women (N = 27) 3282.8 | Mean (SD not reported) Born to normal weight women (N = 31) 3226.4 Born to overweight women (N = 22) 3349.0 | Not reported |
| Vinter 2011 | Median (IQR) (N = 150) 3742 (3464‐4070) | Median (IQR) (N = 154) 3593 (3335‐3930) | 0.039 |
Comparison 1 Combined diet and exercise interventions versus standard care, Outcome 38 Birthweight (g).
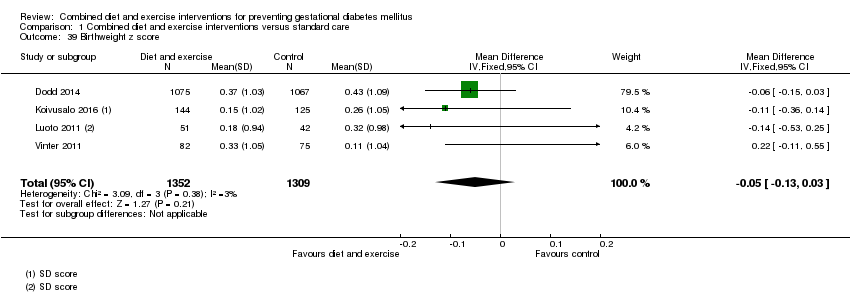
Comparison 1 Combined diet and exercise interventions versus standard care, Outcome 39 Birthweight z score.
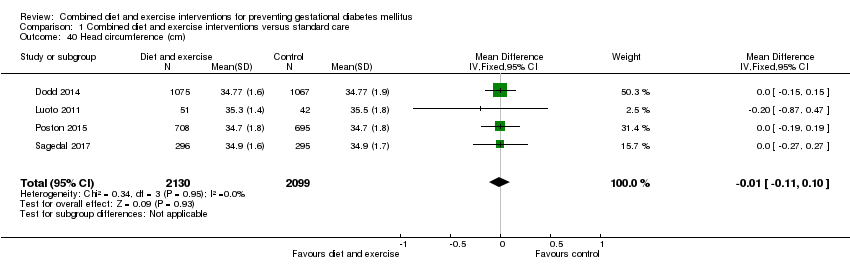
Comparison 1 Combined diet and exercise interventions versus standard care, Outcome 40 Head circumference (cm).

Comparison 1 Combined diet and exercise interventions versus standard care, Outcome 41 Head circumference z score.

Comparison 1 Combined diet and exercise interventions versus standard care, Outcome 42 Length (cm).

Comparison 1 Combined diet and exercise interventions versus standard care, Outcome 43 Length z score.
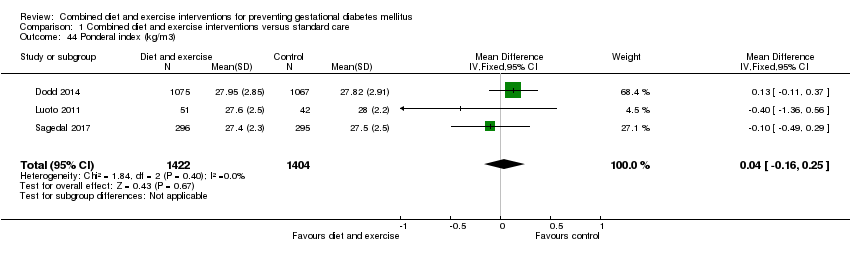
Comparison 1 Combined diet and exercise interventions versus standard care, Outcome 44 Ponderal index (kg/m3).
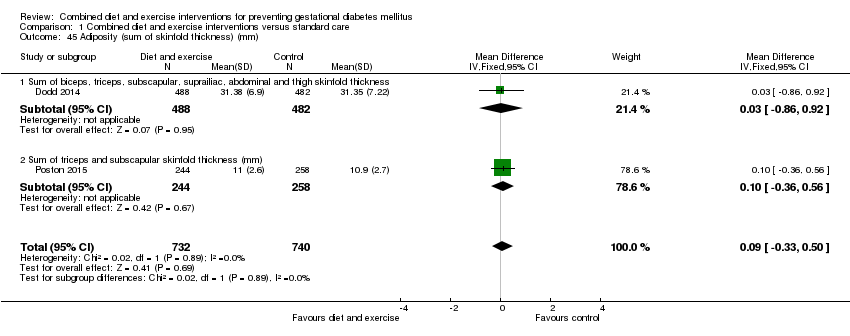
Comparison 1 Combined diet and exercise interventions versus standard care, Outcome 45 Adiposity (sum of skinfold thickness) (mm).

Comparison 1 Combined diet and exercise interventions versus standard care, Outcome 46 Adiposity (abdominal circumference) (cm).
| Study | Intervention | Control | P value |
| Dodd 2014 | Neonatal anthropometric measures Mean (SD) (N = 488) Chest circumference Arm circumference Biceps SFTM (mm): 4.37 (1.12) Triceps SFTM (mm): 5.45 (1.30) Subscapular SFTM (mm): 5.15 (1.30) Suprailiac SFTM (mm): 5.76 (1.83) Abdominal SFTM (mm): 3.85 (1.02) Thigh SFTM (mm): 6.99 (1.85) Abdominal circumference to length ratio: 0.65 (0.04) Fat mass (g): 522.72 (180.70) Fat‐free mass (g): 3026.64 (339.96) Percentage body fat: 14.41 (3.39) Percentage fat‐free mass: 85.59 (3.39) (N = 215) Fat‐free mass R0 (g): 3096.62 (320.97) Percentage fat‐free mass R0: 88.98 (2.98) | Neonatal anthropometric measures Mean (SD) (N = 482) Chest circumference Arm circumference Biceps SFTM (mm): 4.31 (1.13) Triceps SFTM (mm): 5.41 (1.44) Subscapular SFTM (mm): 5.11 (1.21) Suprailiac SFTM (mm): 5.75 (1.92) Abdominal SFTM (mm): 3.82 (1.06) Thigh SFTM (mm): 7.02 (1.90) Abdominal circumference to length ratio: 0.65 (0.04) Fat mass (g): 523.48 (189.05) Fat‐free mass (g): 3030.07 (362.54) Percentage body fat: 14.37 (3.44) Percentage fat‐free mass: 85.63 (3.44) (N = 179) Fat‐free mass R0 (g): 3133.15 (348.92) Percentage fat‐free mass R0: 89.10 (3.40) | "Average body circumferences, SFTM and calculated body fat measures were similar between the treatment groups, with no statistically significant differences identified... There were also no statistically significant differences identified between the two groups, with regard to fat‐free mass (R0) and percentage fat‐free mass (R0) obtained using bio‐impedance analysis" (P value: 0.94; 0.60; 0.45; 0.85; 0.90; 0.97; 0.85; 0.74; 0.90; 0.94; 0.97; 0.91; 0.91; 0.56; 0.79) |
| Poston 2015 | Mean (SD) (N = 249) Triceps SFTM (mm): 5.3 (1.4) (N = 244) Subscapular SFTM (mm): 5.7 (1.4) | Mean (SD) (N = 268) Triceps SFTM (mm): 5.3 (1.6) (N = 258) Subscapular SFTM (mm): 5.6 (1.4) | "Neonatal anthropometric measures were evaluated in a subgroup of infants and did not differ between groups" (P values: 0.72; 0.66) |
Comparison 1 Combined diet and exercise interventions versus standard care, Outcome 47 Adiposity.

Comparison 1 Combined diet and exercise interventions versus standard care, Outcome 48 Shoulder dystocia.

Comparison 1 Combined diet and exercise interventions versus standard care, Outcome 49 Nerve palsy.

Comparison 1 Combined diet and exercise interventions versus standard care, Outcome 50 Bone fracture.
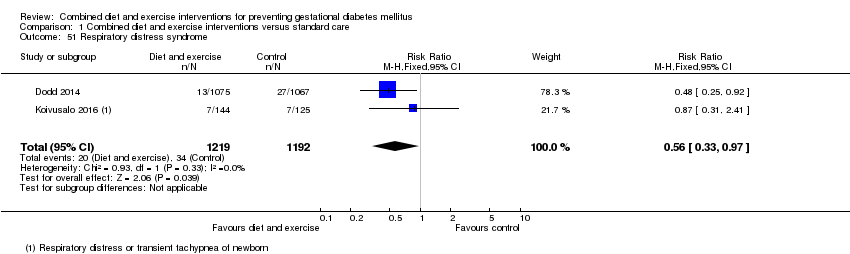
Comparison 1 Combined diet and exercise interventions versus standard care, Outcome 51 Respiratory distress syndrome.

Comparison 1 Combined diet and exercise interventions versus standard care, Outcome 52 Hypoglycaemia.

Comparison 1 Combined diet and exercise interventions versus standard care, Outcome 53 Hyperbilirubinaemia.
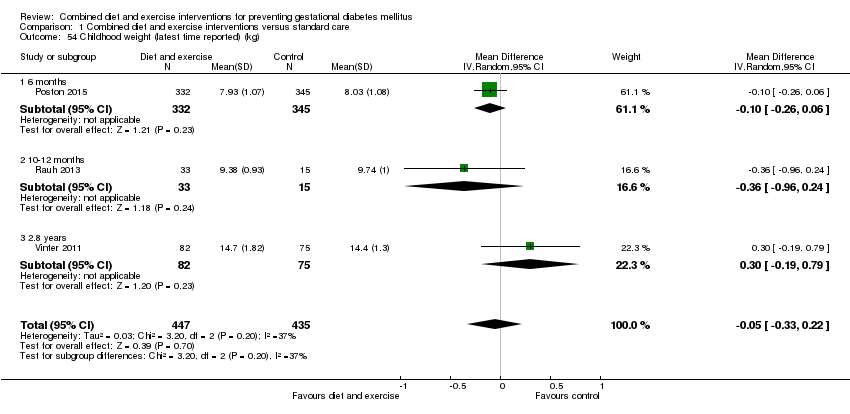
Comparison 1 Combined diet and exercise interventions versus standard care, Outcome 54 Childhood weight (latest time reported) (kg).
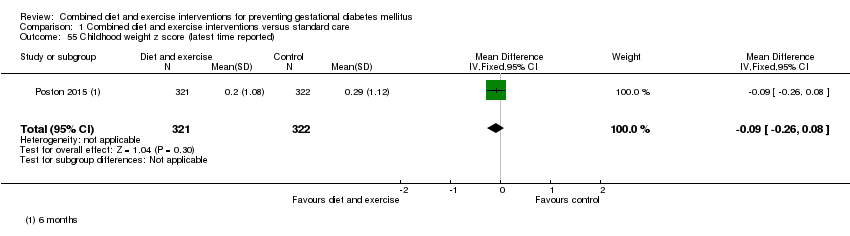
Comparison 1 Combined diet and exercise interventions versus standard care, Outcome 55 Childhood weight z score (latest time reported).
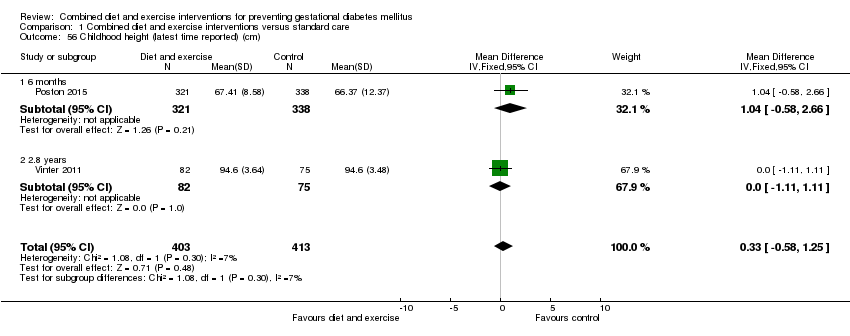
Comparison 1 Combined diet and exercise interventions versus standard care, Outcome 56 Childhood height (latest time reported) (cm).
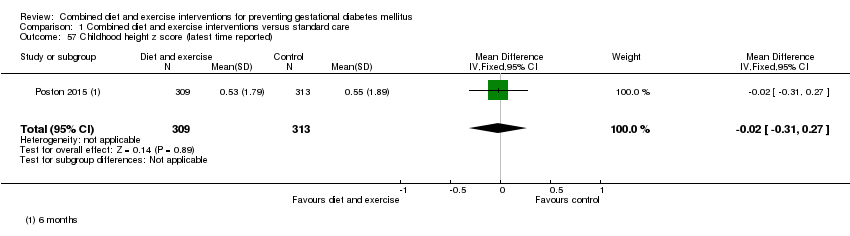
Comparison 1 Combined diet and exercise interventions versus standard care, Outcome 57 Childhood height z score (latest time reported).

Comparison 1 Combined diet and exercise interventions versus standard care, Outcome 58 Childhood head circumference (latest time reported) (cm).

Comparison 1 Combined diet and exercise interventions versus standard care, Outcome 59 Childhood adiposity (latest time reported) (BMI z score).
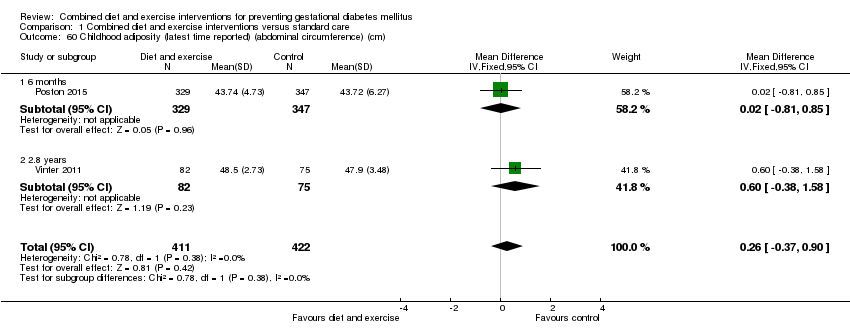
Comparison 1 Combined diet and exercise interventions versus standard care, Outcome 60 Childhood adiposity (latest time reported) (abdominal circumference) (cm).

Comparison 1 Combined diet and exercise interventions versus standard care, Outcome 61 Childhood adiposity (latest time reported) (subscapular skinfold thickness) (mm).

Comparison 1 Combined diet and exercise interventions versus standard care, Outcome 62 Childhood adiposity (latest time reported) (triceps skinfold thickness) (mm).
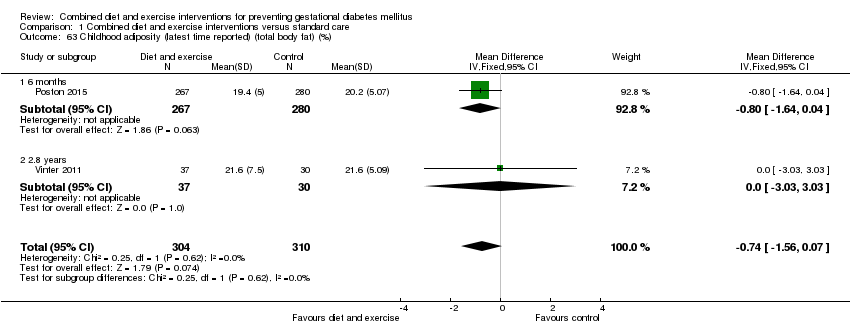
Comparison 1 Combined diet and exercise interventions versus standard care, Outcome 63 Childhood adiposity (latest time reported) (total body fat) (%).
| Study | Intervention | Control | P value |
| Poston 2015 | Anthropometric measures at 6 months Mean (SD) (N = 267) Subscapular SFTM z score: 0.08 (1.37) (N = 296) Triceps SFTM z score: 0.10 (1.56) (N = 267) Sum of SFTM (mm): 17.08 (3.93) (N = 267) Subscapular triceps ratio: 0.83 (0.22) (N = 315) Waist length ratio: 0.64 (0.08) (N = 314) Weight for length z score: ‐0.08 (1.79) (N = 329) Mid upper arm circumference (cm): 15.30 (1.49) | Anthropometric measures at 6 months Mean (SD) (N = 280) Subscapular SFTM z score: 0.36 (1.37) (N = 298) Triceps SFTM z score: 0.24 (1.43) (N = 280) Sum of SFTM (mm): 17.71 (3.97) (N = 280) Subscapular triceps ratio: 0.85 (0.23) (N = 328) Waist length ratio: 0.64 (0.10) (N = 324) Weight for length z score: 0.08 (1.63) (N = 347) Mid upper arm circumference (cm): 15.39 (2.08) | "There was no statistical difference in triceps skinfold thickness... but subscapular skinfold thickness z‐score was... lower in the intervention arm... The infant sum of skinfold thickness... did not reach statistical significance... There were no differences... in other anthropometric measures between the two arms" (P values: 0.021; 0.246; 0.058; 0.423; 0.928; 0.184; 0.511) |
| Vinter 2011 | Anthropometric measures at 2.8 years Mean (95% CI) or N (%) (N = 82) Overweight or obese: 9 (10.9%) BMI (kg/m²): 16.4 (16.1; 16.7) Hip (cm): 50.8 (50.1; 51.5) Abdominal circumference/hip ratio: 0.97 (0.95; 0.97) Dual Energy X‐ray scan results at 2.8 years Mean (95% CI) (N = 37) Total fat (g): 2463 (2147; 2779) Lean body mass (g): 11,336 (10,942; 11,730) | Anthropometric measures at 2.8 years Mean (95% CI) or N (%) (N = 75) Overweight or obese: 5 (6.7%) BMI (kg/m²): 16.1 (15.8; 16.4) Hip (cm): 50.2 (49.4; 51.0) Abdominal circumference/hip ratio: 0.96 (0.95; 0.97) Dual Energy X‐ray scan results at 2.8 years Mean (95% CI) (N = 30) Total fat (g): 2442 (2189; 2696) Lean body mass (g): 11,236 (10,797; 11,675) | "At a significance level of 0.05 (two‐sided), there were no statistically significant differences in any variables between the LiP intervention and control groups." (Individual P values not reported) |
Comparison 1 Combined diet and exercise interventions versus standard care, Outcome 64 Childhood adiposity (latest time reported).
| Study | Intervention | Control | P value |
| Vinter 2011 | Metabolic risk factors at 2.8 years Mean (95% CI) or N (%) (N = 63) Systolic blood pressure (mm Hg): 98.3 (93.7–105.3) Systolic blood pressure ≥ 90th percentile: 16 (25.4) Diastolic blood pressure (mm Hg): 64.3 (61.0–67.3) Diastolic blood pressure ≥ 90th percentile: 16 (25.4) (N = 59) Fasting plasma glucose (mmol/L): 5.2 (4.6 –5.6) Fasting plasma glucose ≥ 5.6 mmol/L: 16 (20.8) (N = 39) Fasting insulin (pmol/L): 16 (8–33) Fasting insulin ≥ 55 pmol/L: 3 (7.7) Fasting HDL (mmol/L): 1.2 (1.1–1.4) Fasting HDL ≥ 1.03 mmol/L: 6 (17.1) Fasting triglycerides (mmol/L): 0.7 (0.6 –1.1) Fasting triglycerides ≥ 1.7 mmol/L: 1 (2.9) Metabolic syndrome (a high abdominal circumference plus 2 or more of the following: low HDL, high triglycerides, high fasting glucose, and high systolic and/or diastolic blood pressure): 0 (0) | Metabolic risk factors at 2.8 years Mean (95% CI) or N (%) (N = 54) Systolic blood pressure (mm Hg): 97.3 (94.3–101.3) Systolic blood pressure ≥ 90th percentile: 12 (22.0) Diastolic blood pressure (mm Hg): 62.0 (60.3– 65.3) Diastolic blood pressure ≥ 90th percentile: 12 (22.0) (N = 59) Fasting plasma glucose (mmol/L): 5.1 (4.7–5.5) Fasting plasma glucose ≥ 5.6 mmol/L: 13 (18.1) (N = 51) Fasting insulin (pmol/L): 12 (8–18) Fasting insulin ≥ 55 pmol/L: 3 (5.9) Fasting HDL (mmol/L): 1.3 (1.1–1.5) Fasting HDL ≥ 1.03 mmol/L: 6 (12.2) Fasting triglycerides (mmol/L): 0.9 (0.6 –1.0) Fasting triglycerides ≥ 1.7 mmol/L: 3 (6.1) Metabolic syndrome (a high abdominal circumference plus 2 or more of the following: low HDL, high triglycerides, high fasting glucose, and high systolic and/or diastolic blood pressure): 0 (0) | "At a significance level of .05 (two‐sided), there were no statistically |
Comparison 1 Combined diet and exercise interventions versus standard care, Outcome 65 Childhood cardiovascular health (latest time reported).

Comparison 1 Combined diet and exercise interventions versus standard care, Outcome 66 Antenatal visits.
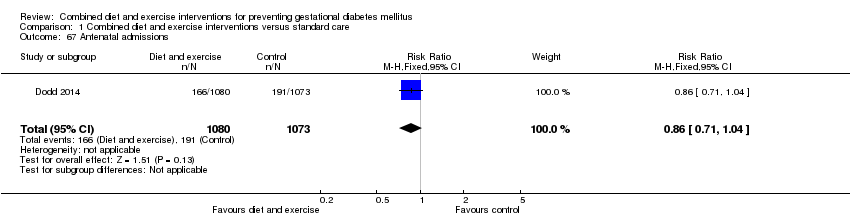
Comparison 1 Combined diet and exercise interventions versus standard care, Outcome 67 Antenatal admissions.
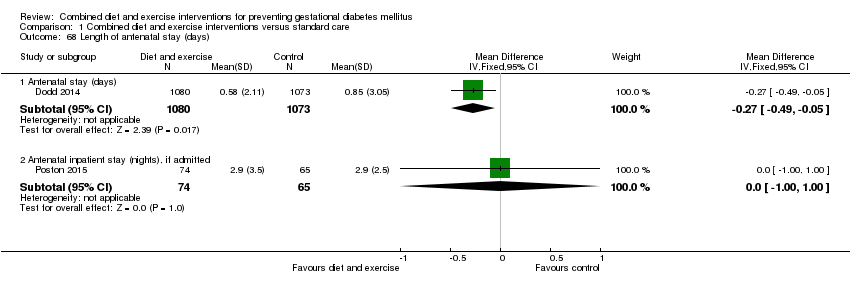
Comparison 1 Combined diet and exercise interventions versus standard care, Outcome 68 Length of antenatal stay (days).

Comparison 1 Combined diet and exercise interventions versus standard care, Outcome 69 Neonatal intensive care unit admission.

Comparison 1 Combined diet and exercise interventions versus standard care, Outcome 70 Length of postnatal stay (mother) (days).

Comparison 1 Combined diet and exercise interventions versus standard care, Outcome 71 Length of postnatal stay (baby) (days).

Comparison 1 Combined diet and exercise interventions versus standard care, Outcome 72 Costs to families associated with the management provided (unit cost, €).
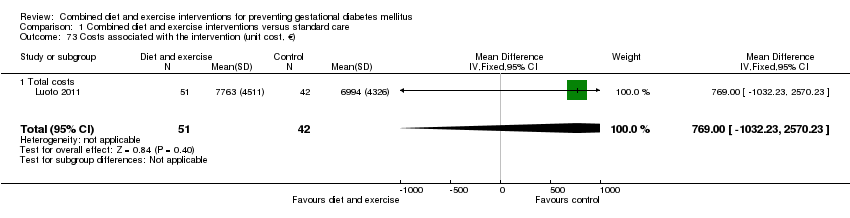
Comparison 1 Combined diet and exercise interventions versus standard care, Outcome 73 Costs associated with the intervention (unit cost, €).

Comparison 1 Combined diet and exercise interventions versus standard care, Outcome 74 Cost of maternal care (unit cost, €).

Comparison 1 Combined diet and exercise interventions versus standard care, Outcome 75 Cost of infant care (unit cost, €).

Comparison 2 Combined diet and exercise interventions versus standard care: subgroups based on study design, Outcome 1 Gestational diabetes.

Comparison 2 Combined diet and exercise interventions versus standard care: subgroups based on study design, Outcome 2 Pre‐eclampsia.

Comparison 2 Combined diet and exercise interventions versus standard care: subgroups based on study design, Outcome 3 Caesarean section.

Comparison 2 Combined diet and exercise interventions versus standard care: subgroups based on study design, Outcome 4 Large‐for‐gestational age.
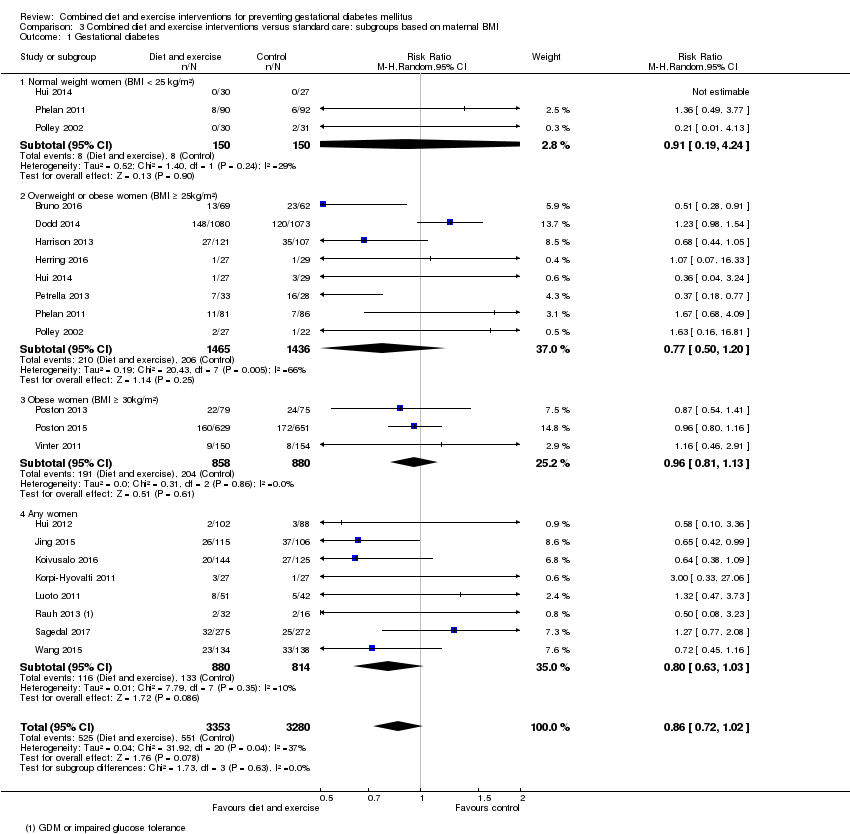
Comparison 3 Combined diet and exercise interventions versus standard care: subgroups based on maternal BMI, Outcome 1 Gestational diabetes.

Comparison 3 Combined diet and exercise interventions versus standard care: subgroups based on maternal BMI, Outcome 2 Pre‐eclampsia.

Comparison 3 Combined diet and exercise interventions versus standard care: subgroups based on maternal BMI, Outcome 3 Pregnancy‐induced hypertension or hypertension.

Comparison 3 Combined diet and exercise interventions versus standard care: subgroups based on maternal BMI, Outcome 4 Caesarean section.

Comparison 3 Combined diet and exercise interventions versus standard care: subgroups based on maternal BMI, Outcome 5 Perinatal mortality.
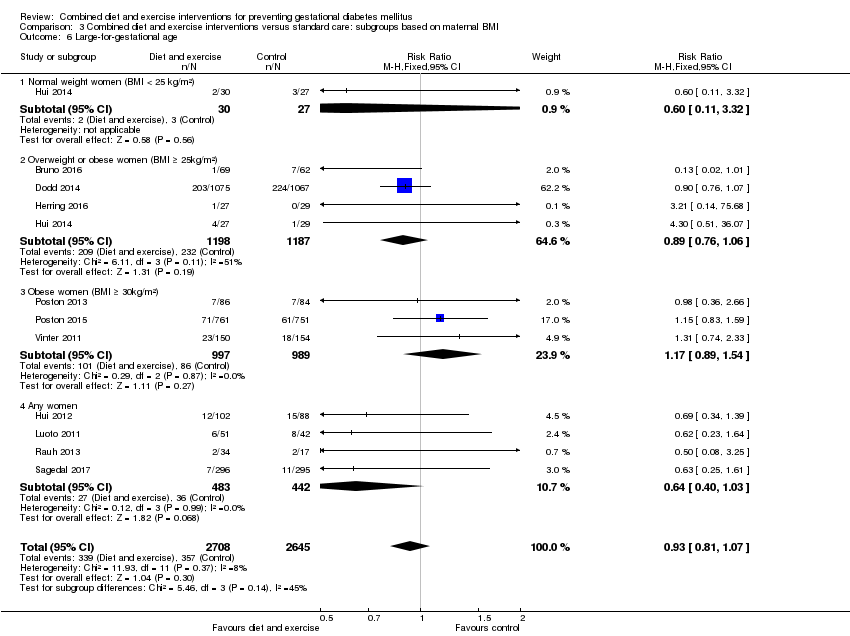
Comparison 3 Combined diet and exercise interventions versus standard care: subgroups based on maternal BMI, Outcome 6 Large‐for‐gestational age.
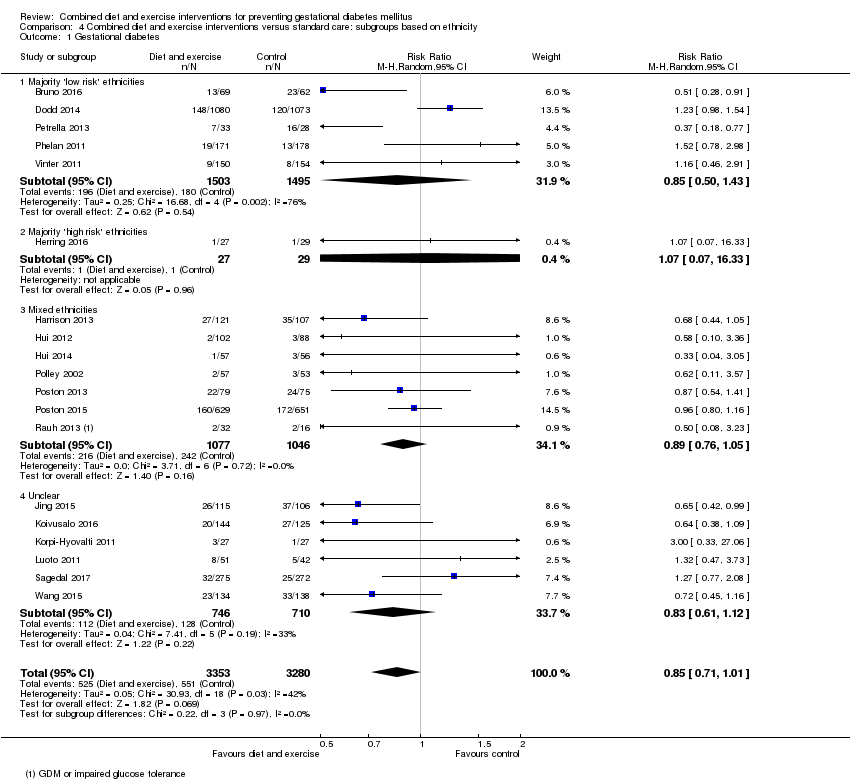
Comparison 4 Combined diet and exercise interventions versus standard care: subgroups based on ethnicity, Outcome 1 Gestational diabetes.

Comparison 4 Combined diet and exercise interventions versus standard care: subgroups based on ethnicity, Outcome 2 Pre‐eclampsia.

Comparison 4 Combined diet and exercise interventions versus standard care: subgroups based on ethnicity, Outcome 3 Pregnancy‐induced hypertension or hypertension.

Comparison 4 Combined diet and exercise interventions versus standard care: subgroups based on ethnicity, Outcome 4 Caesarean section.

Comparison 4 Combined diet and exercise interventions versus standard care: subgroups based on ethnicity, Outcome 5 Perinatal mortality.

Comparison 4 Combined diet and exercise interventions versus standard care: subgroups based on ethnicity, Outcome 6 Large‐for‐gestational age.

Comparison 5 Combined diet and exercise interventions versus standard care: sensitivity analyses, Outcome 1 Gestational diabetes.

Comparison 5 Combined diet and exercise interventions versus standard care: sensitivity analyses, Outcome 2 Pre‐eclampsia.

Comparison 5 Combined diet and exercise interventions versus standard care: sensitivity analyses, Outcome 3 Pregnancy‐induced hypertension.
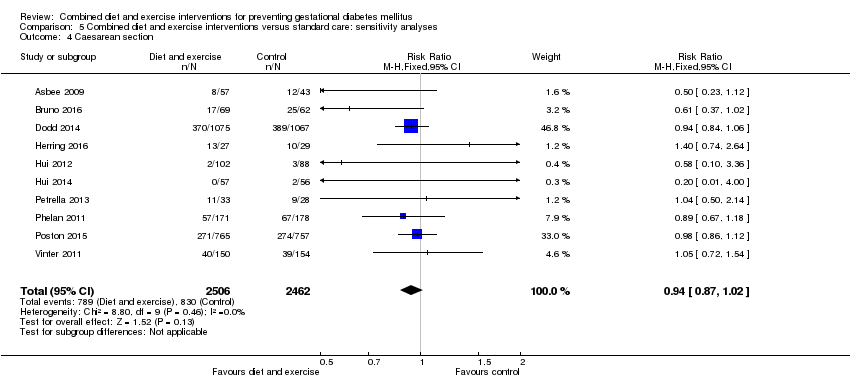
Comparison 5 Combined diet and exercise interventions versus standard care: sensitivity analyses, Outcome 4 Caesarean section.
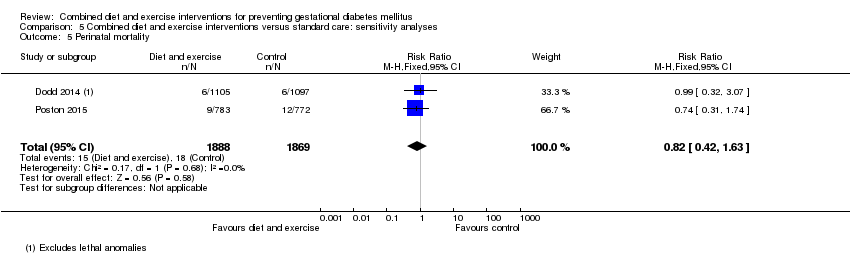
Comparison 5 Combined diet and exercise interventions versus standard care: sensitivity analyses, Outcome 5 Perinatal mortality.
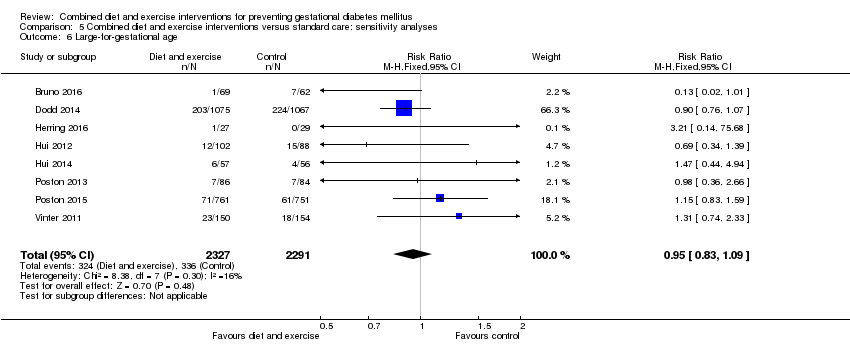
Comparison 5 Combined diet and exercise interventions versus standard care: sensitivity analyses, Outcome 6 Large‐for‐gestational age.
| Combined diet and exercise interventions for preventing GDM | ||||||
| Population: pregnant women, excluding women already diagnosed with GDM, type 1 or type 2 diabetes Setting: Australia (2 RCTs), Brazil (1 RCT), Canada (2 RCTs), China (2 RCTs), Denmark (1 RCT), Egypt (1 RCT), Finland (3 RCTs), Germany (1 RCT), Italy (2 RCTs), Norway (1 RCT), UK (2 RCTs), USA (5 RCTs) | ||||||
| Outcomes | Anticipated absolute effects* (95% CI) | Relative effect | № of participants | Quality of the evidence | Comments | |
| Risk with control | Risk with diet and exercise interventions | |||||
| GDM | Trial population | average RR 0.85 (0.71 to 1.01) | 6633 (19 RCTs) | ⊕⊕⊕⊝ MODERATE1,3 | ||
| 168 per 1000 | 143 per 1000 (119 to 170) | |||||
| Hypertensive disorders of pregnancy (pre‐eclampsia) | Trial population | RR 0.98 (0.79 to 1.22) | 5366 (8 RCTs) | ⊕⊕⊝⊝ LOW2,4 | Eclampsia was not reported by any trials (Sagedal 2017 reports combined severe pre‐eclampsia, HELLP and eclampsia) | |
| 57 per 1000 | 55 per 1000 (45 to 69) | |||||
| Hypertensive disorders of pregnancy (pregnancy‐induced hypertension/hypertension) | Trial population | average RR 0.78 | 3073 | ⊕⊝⊝⊝ VERY LOW2,5,6 | ||
| 103 per 1000 | 80 per 1000 (48 to 130) | |||||
| Caesarean section | Trial population | RR 0.95 (0.88 to 1.02) | 6089 (14 RCTs) | ⊕⊕⊕⊝ MODERATE7 | ||
| 299 per 1000 | 284 per 1000 (263 to 305) | |||||
| Perineal trauma | Trial population | RR 1.27 (0.78 to 2.05) | 2733 (2 RCTs) | ⊕⊕⊕⊝ MODERATE2 | ||
| 21 per 1000 | 27 per 1000 (17 to 44) | |||||
| Gestational weight gain (kg) | Trial population | MD ‐ 0.89 (‐1.39 to ‐ 0.40) | 5052 | ⊕⊕⊕⊝ MODERATE8,9 | ||
| The mean gestational weight gain in the intervention group was 0.89 kg less (1.39 kg less to 0.40 kg less) | ||||||
| Postnatal depression | Not estimable | (0 RCTs) | No data reported for postnatal depression in any of the included RCTs | |||
| Type 2 diabetes mellitus | Not estimable | (0 RCTs) | No data reported for type 2 diabetes mellitus in any of the included RCTs | |||
| *The risk in the intervention group (and its 95% confidence interval) is based on the assumed risk in the comparison group and the relative effect of the intervention (and its 95% CI) | ||||||
| GRADE Working Group grades of evidence | ||||||
| 1Trial limitations (‐1): 19 RCTs, intervention unable to be blinded (not downgraded for this as outcome is objective); some RCTS with potentially serious design limitations (unclear randomisation, attrition bias) | ||||||
| Combined diet and exercise interventions for preventing GDM | ||||||
| Population: pregnant women, excluding women already diagnosed with GDM, type 1 or type 2 diabetes Setting: Australia (2 RCTs), Brazil (1 RCT), Canada (2 RCTs), China (2 RCTs), Denmark (1 RCT), Egypt (1 RCT), Finland (3 RCTs), Germany (1 RCT), Italy (2 RCTs), Norway (1 RCT), UK (2 RCTs), USA (5 RCTs) | ||||||
| Outcomes | Anticipated absolute effects* (95% CI) | Relative effect | № of participants | Quality of the evidence | Comments | |
| Risk with control | Risk with diet and exercise interventions | |||||
| Perinatal mortality | Trial population | RR 0.82 (0.42 to 1.63) | 3757 (2 RCTs) | ⊕⊕⊝⊝ LOW1 | ||
| 10 per 1000 | 8 per 1000 (4 to 16) | |||||
| Large‐for‐gestational age | Trial population | RR 0.93 (0.81 to 1.07) | 5353 (11 RCTs) | ⊕⊕⊝⊝ LOW2,3 | ||
| 135 per 1000 | 126 per 1000 (109 to 144) | |||||
| Mortality or morbidity composite | Not estimable | (0 RCTs) | No data reported for mortality or morbidity composite in any of the included RCTs | |||
| Neonatal hypoglycaemia | Trial population | average RR 1.42 (0.67 to 2.98) | 3653 (2 RCTs) | ⊕⊕⊝⊝ LOW3,4 | ||
| 63 per 1000 | 90 per 1000 (42 to 189) | |||||
| Childhood adiposity (latest time reported) (BMI z score) | Trial population | MD 0.05 (‐0.29 to 0.40) | 794 (2 RCTs) | ⊕⊕⊝⊝ LOW3,5,6 | Additional meta‐analyses presented in review for: abdominal circumference, subscapular skinfold thickness, triceps skinfold thickness and total body fat | |
| The mean BMI z score in the intervention group was 0.05 higher (0.29 lower to 0.40 higher) | ||||||
| Type 2 diabetes mellitus | Not estimable | (0 RCTs) | No data reported for type 2 diabetes mellitus in any of the included RCTs | |||
| Neurosensory disability | Not estimable | (0 RCTs) | No data reported for neurosensory disability in any of the included RCTs | |||
| *The risk in the intervention group (and its 95% confidence interval) is based on the assumed risk in the comparison group and the relative effect of the intervention (and its 95% CI). | ||||||
| GRADE Working Group grades of evidence | ||||||
| 1Imprecision (‐2): confidence interval crossing the line of no effect and few events | ||||||
| Study ID | Diet and exercise intervention | Control |
| Mean (SD): 26.7 (6.0) | Mean (SD): 26.4 (5.0) | |
| Mean (SD): 31.5 (5) | Mean (SD): 30.8 (5.5) | |
| Mean (SD): 29.3 (5.4) | Mean (SD): 29.6 (5.6) | |
| Not reported | Not reported | |
| Mean (SD): 32.4 (4.6) | Mean (SD): 31.7 (4.5) | |
| N (%) | N (%) | |
| Mean (SD): 25.9 (4.9) | Mean (SD): 25.0 (5.7) | |
| Not reported | Not reported | |
| Mean (SD): 30.1 (5.2) | Mean (SD): 28.7 (5.9) | |
| Mean (SD) BMI ≤ 24.9 kg/m²: 31 (3) BMI ≥ 25 kg/m²: 31 (4) | Mean (SD) BMI ≤ 24.9 kg/m²: 29 (6) BMI ≥ 25 kg/m²: 32 (5) | |
| Mean (SD): 29.57 (4.13) | Mean (SD): 29.89 (3.86) | |
| Mean (SD): 32.3 (4.9) | Mean (SD): 32.6 (4.5) | |
| Mean (SD): 29.1 (5.4) | Mean (SD): 29.8 (5.4) | |
| Mean (SD): 29.5 (4.8) | Mean (SD): 30.0 (4.7) | |
| Mean (SD): 31.5 (4.2) | Mean (SD): 32.4 (5.9) | |
| Mean (SD): 28.6 (5.2) | Mean (SD): 28.8 (5.2) | |
| Mean (SD): 25.5 (4.8) | ||
| Mean (SD): 30.4 (5.7) | Mean (SD): 30.7 (4.9) | |
| Mean (SD): 30.5 (5.5) | Mean (SD): 30.4 (5.6) | |
| Mean (SD): 32.2 (4.4) | Mean (SD): 30.8 (4.9) | |
| Mean (SD): 27.9 (4.2) | Mean (SD): 28.1 (4.5) | |
| Median (IQR): 29 (27 ‐ 32) | Median (IQR): 29 (26 ‐ 31) | |
| Mean (SD): 31.0 (3.8) | Mean (SD): 30.27 (3.64) | |
| Abbreviations: BMI: body mass index; IQR: interquartile range; N: number; SD: standard deviation | ||
| Study ID | Diet and exercise intervention | Control |
| Mean (SD): 25.5 (6.0) [pre‐pregnancy] | Mean (SD): 25.6 (5.1) [pre‐pregnancy] | |
| Mean (SD): 33.3 (6) [pre‐pregnancy] Mean (SD): 34.5 (6.8) [baseline] | Mean (SD): 33.4 (5.5) [pre‐pregnancy] Mean (SD): 33.9 (5.7) [baseline] | |
| Median (IQR): 31.0 (28.1‐35.9) [baseline] | Median (IQR): 31.1 (27.7‐35.6) [baseline] | |
| Not reported (all women were obese) | Not reported (all women were obese) | |
| Mean (SD): 30.4 (5.6) [baseline] | Mean (SD): 30.3 (5.9) [baseline] | |
| N (%) [pre‐pregnancy] | N (%) [pre‐pregnancy] | |
| Mean (SD): 33.5 (5.8) [early pregnancy] | Mean (SD): 32.2 (5.4) [early pregnancy] | |
| Not reported | Not reported | |
| Mean (SD): 25.7 (5.1) [pre‐pregnancy] | Mean (SD): 24.9 (5.4) [pre‐pregnancy] | |
| Mean (SD) [pre‐pregnancy] BMI ≤ 24.9 kg/m²: 21.6 (2.2) BMI ≥ 25 kg/m²: 29.5 (5.1) | Mean (SD) [pre‐pregnancy] BMI ≤ 24.9 kg/m²: 22.6 (1.9) BMI ≥ 25 kg/m²: 29.7 (1.3) | |
| Mean (SD): 20.44 (2.54) [pre‐pregnancy] | Mean (SD): 20.44 (2.54); 20.74 (2.43) [pre‐pregnancy] | |
| Mean (SD): 31.5 (6.0) [pre‐pregnancy] Mean (SD): 32.2 (5.9) [baseline] | Mean (SD): 32.0 (5.5) [pre‐pregnancy] Mean (SD): 32.3 (5.4) [baseline] | |
| Mean (SD): 27.3 (6.0) [baseline] | Mean (SD): 25.5 (3.4) [baseline] | |
| Mean (SD): 26.3 (4.9) [pre‐pregnancy] | Mean (SD): 26.4 (4.3) [pre‐pregnancy] | |
| Mean (SD): 32.1 (5) [baseline] | Mean (SD): 32.9 (6.2) [baseline] | |
| Mean (SD): 26.32 (5.6) [baseline] | Mean (SD): 26.48 (5.9) [baseline] | |
| Mean (SD) [pre‐pregnancy] Normal weight: 22.8 (1.9) Overweight: 31.4 (6.0) | Mean (SD) [pre‐pregnancy] Normal weight: 22.5 (2.0) Overweight: 34.1 (7.2) | |
| Mean (SD): 36.5 (4.7) [baseline] | Mean (SD): 36.1 (4.8) [baseline] | |
| Mean (SD): 36.3 (5.0) [baseline] | Mean (SD): 36.3 (4.6) [baseline] | |
| Median (IQR): 21.7 (19.9 ‐ 23.7) [pre‐pregnancy] Median (IQR): 22.2 (20.7 ‐ 24.3) [booking] | Median (IQR): 22.8 (20.6 ‐ 26.6) [pre‐pregnancy] Median (IQR): 23.3 (21.2 ‐ 26.8) [booking] | |
| Mean (SD): 23.8 (4.1) [pre‐pregnancy] | Mean (SD): 23.5 (3.7) [pre‐pregnancy] | |
| Median (IQR): 33.4 (31.7 ‐ 36.5) | Median (IQR): 33.3 (31.7 ‐ 36.9) | |
| Mean (SD): 22.95 (3.65) [pre‐pregnancy] | Mean (SD): 23.06 (3.63) [pre‐pregnancy] | |
| Abbreviations: BMI: body mass index; IQR: interquartile range; N: number; SD: standard deviation | ||
| Study ID | Diet and exercise intervention | Control |
| N (%) | N (%) | |
| N (%) Caucasian: 79 (82.3) | N (%) Caucasian: 78 (82.1) | |
| N (%) | N (%) White: 998 (91.0) | |
| Not reported (conducted in Egypt) | Not reported (conducted in Egypt) | |
| Country of birth, N (%) | Country of birth, N (%) | |
| N (%) Hispanic: 33 (100) | N (%) Hispanic: 35 (100) | |
| N (%) African American: 33 (100) | N (%) African American: 33 (100) | |
| Not reported | Not reported | |
| N (%) | N (%) | |
| First Nations (Canadian Aboriginals with First Nations status), N (%) BMI ≤ 24.9 kg/m²: 2 (6.7) BMI ≥ 25 kg/m²: 3 (11.1) | First Nations (Canadian Aboriginals with First Nations status), N (%) BMI ≤ 24.9 kg/m²: 1 (3.7) BMI ≥ 25 kg/m²: 4 (13.8) | |
| Not reported (conducted in China) | Not reported (conducted in China) | |
| Not reported (conducted in Finland) | Not reported (conducted in Finland) | |
| Not reported (conducted in Norway) | Not reported (conducted in Norway) | |
| Not reported (conducted in Finland) | Not reported (conducted in Finland) | |
| N (%) Caucasian: 28 (84.9) Maghreb: 4 (12.1) Other: 1 (3.0) | Caucasian: 20 (66.7) Maghreb: 6 (20) Other: 4 (13.3) | |
| N (%) Non‐Hispanic White: 138 (68.7) Latina and Hispanic: 39 (19.6) Non‐Hispanic African American: 14 (7.1) Other: 9 (4.6) | N (%) Latina and Hispanic: 39 (19.6) Non‐Hispanic African American: 19 (9.6) Other: 7 (3.3) | |
| N (%) Black: 47 (39) White 73 (61) | ||
| N (%) White: 52 (55) Black: 38 (40) Asian: 2 (2) Other: 2 (2) | N (%) White: 51 (57) Black: 32 (26) Asian: 1 (1) Other: 5 (6) | |
| N (%) White: 490 (63) Black: 202 (26) Asian: 47 (6) Other: 44 (6) | N (%) Black: 200 (26) Asian: 48 (6) Other: 41 (5) | |
| Country of birth, N (%) Germany: 140 (83.8) Others: 27 (16.2) | Country of birth, N (%) Germany: 68 (81.9) Others: 15 (18.1) | |
| Not reported (conducted in Norway) | Not reported (conducted in Norway) | |
| N (%) | N (%) Caucasian: 154 (100) | |
| Not reported (conducted in China) | Not reported (conducted in China) | |
| Abbreviations: N: number | ||
| Study ID | Diet and exercise intervention | Control |
| N (%) | N (%) | |
| N (%) 0: 53 (55.2) | N (%) 0: 59 (62.1) | |
| N (%) 0: 441 (40.2) | N (%) 0: 441 (40.2) | |
| Not reported | Not reported | |
| N (%) | N (%) | |
| N (%) | N (%) | |
| N (%): 0: 9 (27) | N (%): 0: 10 (30) | |
| Not reported | Not reported | |
| Not reported | Not reported | |
| Not reported | Not reported | |
| Not reported | Not reported | |
| Previous deliveries, N (%) | Previous deliveries, N (%) | |
| N (%) 0: 13 (50) | N (%) 0: 17 (63) | |
| N (%) 0: 103 (47.0) | N (%) 0: 73 (40.6) | |
| N (%) 0: 13 (39.4) | N (%) 0: 13 (43.3) | |
| N (%) 0: 153 (76.3) ≥ 1: 48 (23.7) | N (%) 0: 153 (76.6) ≥ 1: 47 (23.4) | |
| N (%) First pregnancy: 56 (47) Second pregnancy: 36 (30) Third pregnancy: 20 (17) > third pregnancy: 7 (6) | ||
| N (%) 0: 42 (45) 1: 29 (31) ≥ 2: 23 (24) | N (%) 0: 38 (43) 1: 36 (40) ≥ 2: 15 (17) | |
| N (%) 0: 336 (43) ≥ 1: 447 (57) | N (%) 0: 338 (44) ≥ 1: 434 (56) | |
| N (%) 0: 110 (65.9) 1: 50 (29.9) ≥ 2: 7 (4.2) | N (%) 0: 53 (63.9) 1: 23 (27.7) ≥ 2: 7 (8.4) | |
| N (%) 0: 303 (100) | N (%) 0: 303 (100) | |
| N (%) 0: 79 (52.7) | N (%) 0: 84 (54.6) | |
| Not reported | Not reported | |
| Abbreviations: N: number | ||
| Study ID | Timing | Screening/diagnosis test(s) and glucose threshold(s) used for diagnosis | Reference(s) | Notes |
| Not reported | Not reported | Not provided | Data not provided in format suitable for meta‐analysis | |
| 16th to 18th weeks; repeated in 24th to 28th weeks for women negative at first test | 75 g 2‐hour OGTT Thresholds: fasting ≥ 5.1 mmol/L and/or 1‐hour ≥ 10.0 mmol/L and/or 2‐hour ≥ 8.5 mmol/L | "IADPSG criteria" (no reference provided) | ||
| Not reported | "all women were encouraged to undergo screening" 75 g 2‐hour OGTT Thresholds: fasting ≥ 5.5 mmol/L or 2‐hour ≥ 7.8 mmol/L | South Australian Perinatal Practice Guidelines 2013 (South Australian Perinatal Practice Guidelines: diabetes mellitus and abnormal glucose tolerance Government of Australia, SA Health, 2013. www.health.sa.gov.au/ppg/Default. | ||
| 24 to 28 weeks | "All women underwent routine GDM screening" | Not provided | Data not provided in format suitable for meta‐analysis | |
| 28 weeks | 2‐hour OGTT Thresholds: fasting ≥ 5.5 mmol/L and/or 2‐hour ≥ 8.0 mmol/L OR Thresholds: fasting ≥ 5.1 mmol/L and/or 1‐hour ≥ 10.0 mmol/L and/or 2‐hour ≥ 8.5 mmol/L | ADIPS 1998 (Hoffmann L, Nolan C, Wilson JD, Oats JJN, Simmons D. Gestational diabetes mellitus: management guidelines. MJA 1998;169:93–7.) OR IADPSG 2010 (Metzger BE, Gabbe SG, Persson B, et al. International association of diabetes and pregnancy study groups recommendations on the diagnosis and classification of hyperglycaemia in pregnancy. Diabetes Care 2010;33:676–82.) | Data in meta‐analysis according to IADPSG 2010 criteria [groups Ns not reported for ADIPS 1998 criteria] | |
| 24 to 28 weeks gestation | 50 g 1‐hour OGTT Thresholds: 1‐hour > 7.493 mmol/L 100 g 3‐hour OGTT Thresholds: not reported | American Diabetes Association 2012 (American Diabetes Association. Standards of medical care in diabetes–2012. Diabetes Care 2012; 35(Suppl. 1): S11–63.) | Data not provided in format suitable for meta‐analysis | |
| Not reported | Not reported | Not provided | ||
| Not reported | Not reported | Not provided | Data not provided in format suitable for meta‐analysis | |
| Not reported | Not reported | Canadian Diabetes Association 2008 (Canadian Diabetes Association. 2008 Clinical practice guidelines for the prevention and management of diabetes in Canada. Can J Diabetes 2008;32:S168–80.) | ||
| Not reported | Not reported | Canadian Diabetes Association 2008 (Canadian Diabetes Association, Clinical Practice Guidelines Committee, Canadian Diabetes Association: 2008 Clinical Practice Guidelines for the Prevention and Management of Diabetes in Canada. Can J Diabetes Care 2008, 32:S1:171.) | ||
| Not reported | Not reported | Not provided | ||
| 24 to 28 weeks | 75 g 2‐hour OGTT Thresholds: fasting ≥ 5.3 mmol/L and/or 1‐hour ≥ 10.0 mmol/L and/or 2‐hour ≥ 8.6 mmol/L | American Diabetes Association 2008 (Holcomb SS; American Diabetes Association. Update: standards of medical care in diabetes. Nurse Pract 2008;33:12–5.) | ||
| 26 to 28 weeks | 75 g 2‐hour OGTT Thresholds: fasting ≥ 5.6 mmol/L or 2‐hour ≥ 7.8 mmol/L | Modified from the World Health Organization 1998 (Alberti KG, Zimmet PZ: Definition, diagnosis and classification of diabetes mellitus and its complications. Part 1: diagnosis and classification of diabetes mellitus: provisional report of WHO consultation. Diabet Med 1998, 15:539‐53.) | All women also underwent 75 g 2 hour OGTT at 8 to 12 weeks; those diagnosed with GDM were excluded from the trial | |
| 26 to 28 weeks | 2‐hour OGTT Thresholds: fasting ≥ 5.3 mmol/L and/or 1‐hour > 10.0 mmol/L and/or 2‐hour > 8.6 mmol/L OR 1) Any of the above thresholds or newborn birthweight ≥ 4500 g or use of insulin or other diabetic medication 2) Any of the above thresholds or newborn birthweight ≥ 4000 g or use of insulin or other diabetic medication 3) Any of the above thresholds or use of insulin or other diabetic medication | American Diabetes Association 2010 ((2010) Diagnosis and classification of diabetes mellitus. Diabetes Care 33: S62–9.) | Data in meta‐analysis according to American Diabetes Association 2010 criteria [use of data according to other criteria did not change results] | |
| 16th to 18th week or 24th to 28th week "as recommend" | 75 g 2‐hour OGTT Thresholds: not reported | American Diabetes Association 2011 (American Diabetes Association. Standards of medical care in diabetes‐2011. Diabetes Care 2011;34:S11–61.) | ||
| Not reported | Not reported | Not provided | ||
| Not reported | Not reported | Not provided | ||
| 27 + 0 to 28 + 6 weeks | 75 g 2‐hour OGTT Thresholds: fasting ≥ 5.1 mmol/L and/or 1‐hour ≥ 10.0 mmol/L and/or 2‐hour ≥ 8.5 mmol/L | IADPSG 2010 (Metzger B, Gabbe SG, Persson B, Buchanan TA, Catalano PA, Damm P, Dyer AR, Leiva A, Hod M, Kitzmiler JL, Lowe LP, McIntyre HD, Oats JJ, Omori Y, Schmidt MI: International association of diabetes and pregnancy study groups recommendations on the diagnosis and classification of hyperglycaemia in pregnancy. Diabetes Care 2010, 33:676–82.) | ||
| 27 + 0 to 28 + 6 weeks | 75 g 2‐hour OGTT Thresholds: fasting ≥ 5.1 mmol/L and/or 1‐hour ≥ 10.0 mmol/L and/or 2‐hour ≥ 8.5 mmol/L | IADPSG 2010 (Metzger BE, Gabbe SG, Persson B, et al. International Association of Diabetes and Pregnancy Study Groups recommendations on the diagnosis and classification of hyperglycaemia in pregnancy. Diabetes Care 2010; 33: 676–82.) | ||
| 24th to 28th week | 2‐hour OGTT Thresholds: not reported | German Society of Gynecology and Obstetrics 2010 (Deutsche Gesellschaft für Gynäkologie und Geburtshilfe e.V.: Diagnostik und Therapie des Gestationsdiabetes. [http://www.dggg.de/leitlinien/].) | ||
| 30 weeks | 75 g 2‐hour OGTT Thresholds: 2‐hour ≥ 7.8 mmol/L | Norway national criteria 2008 (Tore HH, Torun C. Veileder i Fødselshjelp 2008 In) NGFNSfGaO, editor. Veileder i Fødselshjelp 2008; 2008. p. 112.); World Health Organization 2006 (World Health Organization. Definition and Diagnosis of Diabetes Mellitus and Intermediate Hyperglycaemia: Report of a WHO/IDF Consultation. Geneva, Switzerland: World Health Organization, 2006.) | ||
| 28 to 30 weeks and 34 to 36 weeks | 75 g 2‐hour OGTT Thresholds: 2‐hour ≥ 9 mmol/L OR Thresholds: 2‐hour ≥ 8.5 mmol/L | "Danish national recommendations" (no reference provided) OR IADPSG 2010 (Metzger BE, Gabbe SG, Persson B, Buchanan TA, Catalano PA, Damm P et al. International Association of Diabetes and Pregnancy Study Group’s recommendations on the diagnosis and classification of hyperglycaemia in pregnancy. Diabetes Care 2010; 33: 676–82.) | All women also underwent an OGTT at baseline (12 to 15 weeks); those diagnosed with GDM were excluded from the trial Data in meta‐analysis according to Danish national recommendations [use of data according to IADPSG 2010 criteria did not change results] | |
| 24 to 28 weeks | 75 g OGTT | "The International Association of Diabetes and Pregnancy Study Groups (IADPSG) criterion was used" (no reference provided) | ||
| Abbreviations: ADIPS: Australasian Diabetes in Pregnancy Society; g: gram; GDM: gestational diabetes mellitus; IADPSG: International Association of the Diabetes and Pregnancy Study Group; OGTT: oral glucose tolerance test; | ||||
| Outcome or subgroup title | No. of studies | No. of participants | Statistical method | Effect size |
| 1 Gestational diabetes Show forest plot | 19 | 6633 | Risk Ratio (M‐H, Random, 95% CI) | 0.85 [0.71, 1.01] |
| 2 Pre‐eclampsia Show forest plot | 8 | Risk Ratio (M‐H, Fixed, 95% CI) | Subtotals only | |
| 2.1 Pre‐eclampsia | 8 | 5366 | Risk Ratio (M‐H, Fixed, 95% CI) | 0.98 [0.79, 1.22] |
| 2.2 Severe pre‐eclampsia/HELLP/eclampsia | 2 | 2088 | Risk Ratio (M‐H, Fixed, 95% CI) | 0.72 [0.35, 1.46] |
| 3 Pregnancy‐induced hypertension and/or hypertension Show forest plot | 6 | Risk Ratio (M‐H, Random, 95% CI) | Subtotals only | |
| 3.1 Pregnancy‐induced hypertension and/or hypertension | 6 | 3073 | Risk Ratio (M‐H, Random, 95% CI) | 0.78 [0.47, 1.27] |
| 3.2 Pregnancy‐induced hypertension | 4 | 810 | Risk Ratio (M‐H, Random, 95% CI) | 0.46 [0.16, 1.29] |
| 3.3 Hypertension | 3 | 2532 | Risk Ratio (M‐H, Random, 95% CI) | 1.07 [0.84, 1.38] |
| 4 Caesarean section Show forest plot | 14 | 6089 | Risk Ratio (M‐H, Fixed, 95% CI) | 0.95 [0.88, 1.02] |
| 5 Perinatal mortality Show forest plot | 2 | 3757 | Risk Ratio (M‐H, Fixed, 95% CI) | 0.82 [0.42, 1.63] |
| 6 Large‐for‐gestational age Show forest plot | 11 | 5353 | Risk Ratio (M‐H, Fixed, 95% CI) | 0.93 [0.81, 1.07] |
| 7 Operative vaginal birth Show forest plot | 3 | 2164 | Risk Ratio (M‐H, Fixed, 95% CI) | 1.07 [0.86, 1.34] |
| 8 Induction of labour Show forest plot | 5 | 3907 | Risk Ratio (M‐H, Random, 95% CI) | 0.92 [0.79, 1.06] |
| 9 Perineal trauma Show forest plot | 2 | 2733 | Risk Ratio (M‐H, Fixed, 95% CI) | 1.27 [0.78, 2.05] |
| 10 Placental abruption Show forest plot | 1 | 1555 | Risk Ratio (M‐H, Fixed, 95% CI) | 2.96 [0.12, 72.50] |
| 11 Postpartum haemorrhage Show forest plot | 3 | 4235 | Risk Ratio (M‐H, Fixed, 95% CI) | 1.03 [0.89, 1.18] |
| 12 Postpartum infection Show forest plot | 2 | Risk Ratio (M‐H, Fixed, 95% CI) | Subtotals only | |
| 12.1 Endometritis | 1 | 2142 | Risk Ratio (M‐H, Fixed, 95% CI) | 1.19 [0.52, 2.74] |
| 12.2 Wound infection | 1 | 2142 | Risk Ratio (M‐H, Fixed, 95% CI) | 1.06 [0.65, 1.73] |
| 12.3 Postpartum antibiotics | 1 | 2142 | Risk Ratio (M‐H, Fixed, 95% CI) | 1.00 [0.77, 1.31] |
| 12.4 Postpartum sepsis | 1 | 1555 | Risk Ratio (M‐H, Fixed, 95% CI) | 0.33 [0.01, 8.06] |
| 13 Gestational weight gain (kg) Show forest plot | 16 | 5052 | Mean Difference (IV, Random, 95% CI) | ‐0.89 [‐1.39, ‐0.40] |
| 14 Gestational weight gain (various times reported) (kg) Show forest plot | 4 | Mean Difference (IV, Fixed, 95% CI) | Subtotals only | |
| 14.1 First trimester | 1 | 272 | Mean Difference (IV, Fixed, 95% CI) | ‐0.03 [‐0.62, 0.56] |
| 14.2 Second trimester | 2 | 541 | Mean Difference (IV, Fixed, 95% CI) | ‐0.38 [‐0.77, 0.02] |
| 14.3 Third trimester | 1 | 269 | Mean Difference (IV, Fixed, 95% CI) | ‐0.10 [‐1.17, 0.97] |
| 14.4 At 20‐24 weeks gestation | 1 | 221 | Mean Difference (IV, Fixed, 95% CI) | ‐0.45 [‐1.48, 0.58] |
| 14.5 At 26‐28 weeks gestation | 1 | 203 | Mean Difference (IV, Fixed, 95% CI) | ‐0.90 [‐1.75, ‐0.05] |
| 15 Gestational weight gain (kg/week) Show forest plot | 4 | 2772 | Mean Difference (IV, Random, 95% CI) | ‐0.03 [‐0.06, ‐0.00] |
| 16 Gestational weight gain (above IOM recommendations) Show forest plot | 11 | 4556 | Risk Ratio (M‐H, Random, 95% CI) | 0.87 [0.79, 0.96] |
| 17 Gestational weight gain (within IOM recommendations) Show forest plot | 9 | 3730 | Risk Ratio (M‐H, Fixed, 95% CI) | 1.02 [0.93, 1.11] |
| 18 Gestational weight gain (below IOM recommendations) Show forest plot | 7 | 3499 | Risk Ratio (M‐H, Fixed, 95% CI) | 1.10 [0.98, 1.24] |
| 19 Behaviour changes associated with the intervention Show forest plot | Other data | No numeric data | ||
| 20 Relevant biomarker changes associated with the intervention Show forest plot | Other data | No numeric data | ||
| 21 Sense of well‐being and quality of life Show forest plot | Other data | No numeric data | ||
| 22 Breastfeeding (exclusive) Show forest plot | 3 | Risk Ratio (M‐H, Fixed, 95% CI) | Subtotals only | |
| 22.1 3 days postpartum | 1 | 695 | Risk Ratio (M‐H, Fixed, 95% CI) | 1.02 [0.91, 1.15] |
| 22.2 6 weeks postpartum | 1 | 202 | Risk Ratio (M‐H, Fixed, 95% CI) | 0.93 [0.76, 1.13] |
| 22.3 6 months postpartum | 2 | 921 | Risk Ratio (M‐H, Fixed, 95% CI) | 0.91 [0.61, 1.36] |
| 23 Breastfeeding (partial) Show forest plot | 3 | Risk Ratio (M‐H, Fixed, 95% CI) | Subtotals only | |
| 23.1 3 days postpartum | 1 | 695 | Risk Ratio (M‐H, Fixed, 95% CI) | 0.51 [0.40, 0.66] |
| 23.2 6 weeks postpartum | 1 | 202 | Risk Ratio (M‐H, Fixed, 95% CI) | 1.44 [0.80, 2.60] |
| 23.3 6 months postpartum | 2 | 921 | Risk Ratio (M‐H, Fixed, 95% CI) | 0.98 [0.82, 1.18] |
| 24 Breastfeeding Show forest plot | Other data | No numeric data | ||
| 25 Postnatal weight retention (latest time reported) (kg) Show forest plot | 6 | 1673 | Mean Difference (IV, Fixed, 95% CI) | ‐0.94 [‐1.52, ‐0.37] |
| 26 Return to pre‐pregnancy weight (latest time reported) Show forest plot | 3 | 960 | Risk Ratio (M‐H, Fixed, 95% CI) | 1.25 [1.08, 1.45] |
| 27 Postnatal BMI (latest time reported) Show forest plot | 2 | Mean Difference (IV, Fixed, 95% CI) | Subtotals only | |
| 27.1 BMI | 2 | 902 | Mean Difference (IV, Fixed, 95% CI) | ‐0.15 [‐0.85, 0.55] |
| 27.2 BMI change from baseline to 6 weeks postpartum | 1 | 202 | Mean Difference (IV, Fixed, 95% CI) | ‐0.56 [‐1.12, ‐0.00] |
| 28 Maternal cardiovascular health (latest time reported) Show forest plot | Other data | No numeric data | ||
| 29 Stillbirth Show forest plot | 5 | 4783 | Risk Ratio (M‐H, Fixed, 95% CI) | 0.69 [0.35, 1.36] |
| 30 Neonatal mortality Show forest plot | 2 | Risk Ratio (M‐H, Fixed, 95% CI) | Subtotals only | |
| 30.1 Total | 2 | 3756 | Risk Ratio (M‐H, Fixed, 95% CI) | 2.31 [0.60, 8.90] |
| 30.2 No lethal anomalies | 1 | 2202 | Risk Ratio (M‐H, Fixed, 95% CI) | 0.99 [0.06, 15.85] |
| 30.3 Lethal anomalies | 1 | 2202 | Risk Ratio (M‐H, Fixed, 95% CI) | 6.95 [0.36, 134.38] |
| 31 Gestational age at birth (weeks) Show forest plot | 11 | 5658 | Mean Difference (IV, Fixed, 95% CI) | 0.05 [‐0.05, 0.15] |
| 32 Gestational age at birth (days or weeks) Show forest plot | Other data | No numeric data | ||
| 33 Preterm birth Show forest plot | 11 | 5398 | Risk Ratio (M‐H, Fixed, 95% CI) | 0.80 [0.65, 0.98] |
| 34 Apgar score less than seven at five minutes Show forest plot | 3 | 2864 | Risk Ratio (M‐H, Fixed, 95% CI) | 0.80 [0.48, 1.32] |
| 35 Macrosomia Show forest plot | 10 | Risk Ratio (M‐H, Fixed, 95% CI) | Subtotals only | |
| 35.1 > 4000 g | 9 | 5368 | Risk Ratio (M‐H, Fixed, 95% CI) | 0.89 [0.78, 1.01] |
| 35.2 > 4500 g | 4 | 3061 | Risk Ratio (M‐H, Fixed, 95% CI) | 0.63 [0.42, 0.94] |
| 36 Small‐for‐gestational age Show forest plot | 6 | 2434 | Risk Ratio (M‐H, Fixed, 95% CI) | 1.20 [0.95, 1.52] |
| 37 Birthweight (g) Show forest plot | 13 | 5763 | Mean Difference (IV, Fixed, 95% CI) | ‐17.67 [‐46.28, 10.94] |
| 38 Birthweight (g) Show forest plot | Other data | No numeric data | ||
| 39 Birthweight z score Show forest plot | 4 | 2661 | Mean Difference (IV, Fixed, 95% CI) | ‐0.05 [‐0.13, 0.03] |
| 40 Head circumference (cm) Show forest plot | 4 | 4229 | Mean Difference (IV, Fixed, 95% CI) | ‐0.01 [‐0.11, 0.10] |
| 41 Head circumference z score Show forest plot | 1 | 2142 | Mean Difference (IV, Fixed, 95% CI) | ‐0.05 [‐0.14, 0.04] |
| 42 Length (cm) Show forest plot | 6 | 3303 | Mean Difference (IV, Fixed, 95% CI) | ‐0.09 [‐0.26, 0.09] |
| 43 Length z score Show forest plot | 2 | 2235 | Mean Difference (IV, Fixed, 95% CI) | ‐0.08 [‐0.15, ‐0.02] |
| 44 Ponderal index (kg/m3) Show forest plot | 3 | 2826 | Mean Difference (IV, Fixed, 95% CI) | 0.04 [‐0.16, 0.25] |
| 45 Adiposity (sum of skinfold thickness) (mm) Show forest plot | 2 | 1472 | Mean Difference (IV, Fixed, 95% CI) | 0.09 [‐0.33, 0.50] |
| 45.1 Sum of biceps, triceps, subscapular, suprailiac, abdominal and thigh skinfold thickness | 1 | 970 | Mean Difference (IV, Fixed, 95% CI) | 0.03 [‐0.86, 0.92] |
| 45.2 Sum of triceps and subscapular skinfold thickness (mm) | 1 | 502 | Mean Difference (IV, Fixed, 95% CI) | 0.10 [‐0.36, 0.56] |
| 46 Adiposity (abdominal circumference) (cm) Show forest plot | 2 | 1566 | Mean Difference (IV, Fixed, 95% CI) | ‐0.01 [‐0.23, 0.22] |
| 47 Adiposity Show forest plot | Other data | No numeric data | ||
| 48 Shoulder dystocia Show forest plot | 2 | 2733 | Risk Ratio (M‐H, Fixed, 95% CI) | 1.20 [0.79, 1.83] |
| 49 Nerve palsy Show forest plot | 1 | 2142 | Risk Ratio (M‐H, Fixed, 95% CI) | 1.99 [0.36, 10.82] |
| 50 Bone fracture Show forest plot | 1 | 2142 | Risk Ratio (M‐H, Fixed, 95% CI) | 1.99 [0.36, 10.82] |
| 51 Respiratory distress syndrome Show forest plot | 2 | 2411 | Risk Ratio (M‐H, Fixed, 95% CI) | 0.56 [0.33, 0.97] |
| 52 Hypoglycaemia Show forest plot | 2 | 3653 | Risk Ratio (M‐H, Random, 95% CI) | 1.42 [0.67, 2.98] |
| 53 Hyperbilirubinaemia Show forest plot | 1 | 2142 | Risk Ratio (M‐H, Fixed, 95% CI) | 0.82 [0.61, 1.11] |
| 54 Childhood weight (latest time reported) (kg) Show forest plot | 3 | 882 | Mean Difference (IV, Random, 95% CI) | ‐0.05 [‐0.33, 0.22] |
| 54.1 6 months | 1 | 677 | Mean Difference (IV, Random, 95% CI) | ‐0.10 [‐0.26, 0.06] |
| 54.2 10‐12 months | 1 | 48 | Mean Difference (IV, Random, 95% CI) | ‐0.36 [‐0.96, 0.24] |
| 54.3 2.8 years | 1 | 157 | Mean Difference (IV, Random, 95% CI) | 0.30 [‐0.19, 0.79] |
| 55 Childhood weight z score (latest time reported) Show forest plot | 1 | 643 | Mean Difference (IV, Fixed, 95% CI) | ‐0.09 [‐0.26, 0.08] |
| 56 Childhood height (latest time reported) (cm) Show forest plot | 2 | 816 | Mean Difference (IV, Fixed, 95% CI) | 0.33 [‐0.58, 1.25] |
| 56.1 6 months | 1 | 659 | Mean Difference (IV, Fixed, 95% CI) | 1.04 [‐0.58, 2.66] |
| 56.2 2.8 years | 1 | 157 | Mean Difference (IV, Fixed, 95% CI) | 0.0 [‐1.11, 1.11] |
| 57 Childhood height z score (latest time reported) Show forest plot | 1 | 622 | Mean Difference (IV, Fixed, 95% CI) | ‐0.02 [‐0.31, 0.27] |
| 58 Childhood head circumference (latest time reported) (cm) Show forest plot | 1 | 670 | Mean Difference (IV, Fixed, 95% CI) | ‐0.12 [‐0.70, 0.46] |
| 59 Childhood adiposity (latest time reported) (BMI z score) Show forest plot | 2 | 794 | Mean Difference (IV, Random, 95% CI) | 0.05 [‐0.29, 0.40] |
| 59.1 6 months | 1 | 637 | Mean Difference (IV, Random, 95% CI) | ‐0.11 [‐0.39, 0.17] |
| 59.2 2.8 years | 1 | 157 | Mean Difference (IV, Random, 95% CI) | 0.24 [‐0.10, 0.58] |
| 60 Childhood adiposity (latest time reported) (abdominal circumference) (cm) Show forest plot | 2 | 833 | Mean Difference (IV, Fixed, 95% CI) | 0.26 [‐0.37, 0.90] |
| 60.1 6 months | 1 | 676 | Mean Difference (IV, Fixed, 95% CI) | 0.02 [‐0.81, 0.85] |
| 60.2 2.8 years | 1 | 157 | Mean Difference (IV, Fixed, 95% CI) | 0.60 [‐0.38, 1.58] |
| 61 Childhood adiposity (latest time reported) (subscapular skinfold thickness) (mm) Show forest plot | 2 | 705 | Mean Difference (IV, Random, 95% CI) | ‐0.17 [‐0.66, 0.32] |
| 61.1 6 months | 1 | 548 | Mean Difference (IV, Random, 95% CI) | ‐0.40 [‐0.73, ‐0.07] |
| 61.2 2.8 years | 1 | 157 | Mean Difference (IV, Random, 95% CI) | 0.10 [‐0.33, 0.53] |
| 62 Childhood adiposity (latest time reported) (triceps skinfold thickness) (mm) Show forest plot | 2 | 784 | Mean Difference (IV, Fixed, 95% CI) | ‐0.12 [‐0.48, 0.23] |
| 62.1 6 months | 1 | 627 | Mean Difference (IV, Fixed, 95% CI) | ‐0.18 [‐0.61, 0.25] |
| 62.2 2.8 years | 1 | 157 | Mean Difference (IV, Fixed, 95% CI) | 0.0 [‐0.63, 0.63] |
| 63 Childhood adiposity (latest time reported) (total body fat) (%) Show forest plot | 2 | 614 | Mean Difference (IV, Fixed, 95% CI) | ‐0.74 [‐1.56, 0.07] |
| 63.1 6 months | 1 | 547 | Mean Difference (IV, Fixed, 95% CI) | ‐0.80 [‐1.64, 0.04] |
| 63.2 2.8 years | 1 | 67 | Mean Difference (IV, Fixed, 95% CI) | 0.0 [‐3.03, 3.03] |
| 64 Childhood adiposity (latest time reported) Show forest plot | Other data | No numeric data | ||
| 65 Childhood cardiovascular health (latest time reported) Show forest plot | Other data | No numeric data | ||
| 66 Antenatal visits Show forest plot | 1 | 269 | Mean Difference (IV, Fixed, 95% CI) | 0.0 [‐0.36, 0.36] |
| 67 Antenatal admissions Show forest plot | 1 | 2153 | Risk Ratio (M‐H, Fixed, 95% CI) | 0.86 [0.71, 1.04] |
| 68 Length of antenatal stay (days) Show forest plot | 2 | Mean Difference (IV, Fixed, 95% CI) | Subtotals only | |
| 68.1 Antenatal stay (days) | 1 | 2153 | Mean Difference (IV, Fixed, 95% CI) | ‐0.27 [‐0.49, ‐0.05] |
| 68.2 Antenatal inpatient stay (nights), if admitted | 1 | 139 | Mean Difference (IV, Fixed, 95% CI) | 0.0 [‐1.00, 1.00] |
| 69 Neonatal intensive care unit admission Show forest plot | 4 | 4549 | Risk Ratio (M‐H, Fixed, 95% CI) | 1.03 [0.93, 1.14] |
| 70 Length of postnatal stay (mother) (days) Show forest plot | 2 | 3511 | Mean Difference (IV, Random, 95% CI) | 0.01 [‐0.14, 0.17] |
| 71 Length of postnatal stay (baby) (days) Show forest plot | 2 | 3618 | Mean Difference (IV, Fixed, 95% CI) | ‐0.35 [‐0.90, 0.20] |
| 72 Costs to families associated with the management provided (unit cost, €) Show forest plot | 1 | Mean Difference (IV, Fixed, 95% CI) | Subtotals only | |
| 72.1 Delivery cost to the patient | 1 | 93 | Mean Difference (IV, Fixed, 95% CI) | 3.0 [‐10.82, 16.82] |
| 72.2 Neonatal care cost to the patient | 1 | 93 | Mean Difference (IV, Fixed, 95% CI) | 3.00 [‐13.67, 19.67] |
| 73 Costs associated with the intervention (unit cost, €) Show forest plot | 1 | 93 | Mean Difference (IV, Fixed, 95% CI) | 769.0 [‐1032.23, 2570.23] |
| 73.1 Total costs | 1 | 93 | Mean Difference (IV, Fixed, 95% CI) | 769.0 [‐1032.23, 2570.23] |
| 74 Cost of maternal care (unit cost, €) Show forest plot | 1 | Mean Difference (IV, Fixed, 95% CI) | Subtotals only | |
| 74.1 Visits for primary health care | 1 | 93 | Mean Difference (IV, Fixed, 95% CI) | ‐43.0 [‐127.61, 41.61] |
| 74.2 Visits for specialist health care | 1 | 93 | Mean Difference (IV, Fixed, 95% CI) | ‐47.0 [‐195.33, 101.33] |
| 74.3 Visits to a diabetes nurse | 1 | 93 | Mean Difference (IV, Fixed, 95% CI) | 6.00 [‐7.02, 19.02] |
| 74.4 Visits to a dietitian | 1 | 93 | Mean Difference (IV, Fixed, 95% CI) | 0.0 [0.0, 0.0] |
| 74.5 Use of insulin/other diabetes medication | 1 | 93 | Mean Difference (IV, Fixed, 95% CI) | ‐1.0 [‐7.83, 5.83] |
| 74.6 Hospital days before and after delivery | 1 | 93 | Mean Difference (IV, Fixed, 95% CI) | 101.00 [‐206.71, 408.71] |
| 74.7 Delivery cost to the municipality | 1 | 93 | Mean Difference (IV, Fixed, 95% CI) | 22.0 [‐234.43, 278.43] |
| 74.8 Absence from work | 1 | 93 | Mean Difference (IV, Fixed, 95% CI) | 128.0 [‐1295.58, 1551.58] |
| 75 Cost of infant care (unit cost, €) Show forest plot | 1 | 93 | Mean Difference (IV, Fixed, 95% CI) | 453.0 [‐298.20, 1204.20] |
| 75.1 Neonatal care cost to municipality | 1 | 93 | Mean Difference (IV, Fixed, 95% CI) | 453.0 [‐298.20, 1204.20] |
| Outcome or subgroup title | No. of studies | No. of participants | Statistical method | Effect size |
| 1 Gestational diabetes Show forest plot | 19 | 6633 | Risk Ratio (M‐H, Random, 95% CI) | 0.85 [0.71, 1.01] |
| 1.1 Individually‐randomised | 17 | 6492 | Risk Ratio (M‐H, Random, 95% CI) | 0.84 [0.70, 1.01] |
| 1.2 Cluster‐randomised | 2 | 141 | Risk Ratio (M‐H, Random, 95% CI) | 1.05 [0.42, 2.60] |
| 2 Pre‐eclampsia Show forest plot | 8 | 5366 | Risk Ratio (M‐H, Fixed, 95% CI) | 0.98 [0.79, 1.22] |
| 2.1 Individually‐randomised | 7 | 5273 | Risk Ratio (M‐H, Fixed, 95% CI) | 0.97 [0.78, 1.21] |
| 2.2 Cluster‐randomised | 1 | 93 | Risk Ratio (M‐H, Fixed, 95% CI) | 1.24 [0.22, 7.05] |
| 3 Caesarean section Show forest plot | 14 | 6089 | Risk Ratio (M‐H, Fixed, 95% CI) | 0.95 [0.88, 1.02] |
| 3.1 Individually‐randomised | 13 | 6038 | Risk Ratio (M‐H, Fixed, 95% CI) | 0.95 [0.88, 1.02] |
| 3.2 Cluster‐randomised | 1 | 51 | Risk Ratio (M‐H, Fixed, 95% CI) | 0.71 [0.33, 1.54] |
| 4 Large‐for‐gestational age Show forest plot | 11 | 5353 | Risk Ratio (M‐H, Fixed, 95% CI) | 0.93 [0.81, 1.07] |
| 4.1 Individually‐randomised | 9 | 5209 | Risk Ratio (M‐H, Fixed, 95% CI) | 0.94 [0.82, 1.08] |
| 4.2 Cluster‐randomised | 2 | 144 | Risk Ratio (M‐H, Fixed, 95% CI) | 0.59 [0.25, 1.40] |
| Outcome or subgroup title | No. of studies | No. of participants | Statistical method | Effect size |
| 1 Gestational diabetes Show forest plot | 19 | 6633 | Risk Ratio (M‐H, Random, 95% CI) | 0.86 [0.72, 1.02] |
| 1.1 Normal weight women (BMI < 25 kg/m²) | 3 | 300 | Risk Ratio (M‐H, Random, 95% CI) | 0.91 [0.19, 4.24] |
| 1.2 Overweight or obese women (BMI ≥ 25kg/m²) | 8 | 2901 | Risk Ratio (M‐H, Random, 95% CI) | 0.77 [0.50, 1.20] |
| 1.3 Obese women (BMI ≥ 30kg/m²) | 3 | 1738 | Risk Ratio (M‐H, Random, 95% CI) | 0.96 [0.81, 1.13] |
| 1.4 Any women | 8 | 1694 | Risk Ratio (M‐H, Random, 95% CI) | 0.80 [0.63, 1.03] |
| 2 Pre‐eclampsia Show forest plot | 8 | 5366 | Risk Ratio (M‐H, Fixed, 95% CI) | 0.98 [0.79, 1.21] |
| 2.1 Normal weight women (BMI < 25 kg/m²) | 2 | 243 | Risk Ratio (M‐H, Fixed, 95% CI) | 0.34 [0.10, 1.22] |
| 2.2 Overweight or obese women (BMI ≥ 25kg/m²) | 3 | 2369 | Risk Ratio (M‐H, Fixed, 95% CI) | 1.12 [0.82, 1.54] |
| 2.3 Obese women (BMI ≥ 30kg/m²) | 2 | 1809 | Risk Ratio (M‐H, Fixed, 95% CI) | 0.92 [0.64, 1.32] |
| 2.4 Any women | 3 | 945 | Risk Ratio (M‐H, Fixed, 95% CI) | 0.94 [0.51, 1.73] |
| 3 Pregnancy‐induced hypertension or hypertension Show forest plot | 6 | 3073 | Risk Ratio (M‐H, Random, 95% CI) | 0.71 [0.41, 1.25] |
| 3.1 Underweight women | 1 | 110 | Risk Ratio (M‐H, Random, 95% CI) | 0.70 [0.26, 1.88] |
| 3.2 Normal weight women (BMI < 25 kg/m²) | 1 | 182 | Risk Ratio (M‐H, Random, 95% CI) | 0.28 [0.08, 0.97] |
| 3.3 Overweight or obese women (BMI ≥ 25kg/m²) | 5 | 2781 | Risk Ratio (M‐H, Random, 95% CI) | 0.82 [0.43, 1.58] |
| 4 Caesarean section Show forest plot | 14 | 6089 | Risk Ratio (M‐H, Fixed, 95% CI) | 0.95 [0.88, 1.02] |
| 4.1 Normal weight women (BMI < 25 kg/m²) | 3 | 300 | Risk Ratio (M‐H, Fixed, 95% CI) | 0.92 [0.58, 1.45] |
| 4.2 Overweight or obese women (BMI ≥ 25kg/m²) | 7 | 2662 | Risk Ratio (M‐H, Fixed, 95% CI) | 0.91 [0.83, 1.01] |
| 4.3 Obese women (BMI ≥ 30kg/m²) | 2 | 1826 | Risk Ratio (M‐H, Fixed, 95% CI) | 0.99 [0.87, 1.12] |
| 4.4 Any women | 5 | 1301 | Risk Ratio (M‐H, Fixed, 95% CI) | 0.98 [0.75, 1.28] |
| 5 Perinatal mortality Show forest plot | 2 | 3757 | Risk Ratio (M‐H, Fixed, 95% CI) | 0.82 [0.42, 1.63] |
| 5.1 Overweight or obese women (BMI ≥ 25kg/m²) | 1 | 2202 | Risk Ratio (M‐H, Fixed, 95% CI) | 0.99 [0.32, 3.07] |
| 5.2 Obese women (BMI ≥ 30 kg/m²) | 1 | 1555 | Risk Ratio (M‐H, Fixed, 95% CI) | 0.74 [0.31, 1.74] |
| 6 Large‐for‐gestational age Show forest plot | 11 | 5353 | Risk Ratio (M‐H, Fixed, 95% CI) | 0.93 [0.81, 1.07] |
| 6.1 Normal weight women (BMI < 25 kg/m²) | 1 | 57 | Risk Ratio (M‐H, Fixed, 95% CI) | 0.6 [0.11, 3.32] |
| 6.2 Overweight or obese women (BMI ≥ 25kg/m²) | 4 | 2385 | Risk Ratio (M‐H, Fixed, 95% CI) | 0.89 [0.76, 1.06] |
| 6.3 Obese women (BMI ≥ 30kg/m²) | 3 | 1986 | Risk Ratio (M‐H, Fixed, 95% CI) | 1.17 [0.89, 1.54] |
| 6.4 Any women | 4 | 925 | Risk Ratio (M‐H, Fixed, 95% CI) | 0.64 [0.40, 1.03] |
| Outcome or subgroup title | No. of studies | No. of participants | Statistical method | Effect size |
| 1 Gestational diabetes Show forest plot | 19 | 6633 | Risk Ratio (M‐H, Random, 95% CI) | 0.85 [0.71, 1.01] |
| 1.1 Majority 'low risk' ethnicities | 5 | 2998 | Risk Ratio (M‐H, Random, 95% CI) | 0.85 [0.50, 1.43] |
| 1.2 Majority 'high risk' ethnicities | 1 | 56 | Risk Ratio (M‐H, Random, 95% CI) | 1.07 [0.07, 16.33] |
| 1.3 Mixed ethnicities | 7 | 2123 | Risk Ratio (M‐H, Random, 95% CI) | 0.89 [0.76, 1.05] |
| 1.4 Unclear | 6 | 1456 | Risk Ratio (M‐H, Random, 95% CI) | 0.83 [0.61, 1.12] |
| 2 Pre‐eclampsia Show forest plot | 8 | 5366 | Risk Ratio (M‐H, Fixed, 95% CI) | 0.98 [0.79, 1.22] |
| 2.1 Majority 'low risk' ethnicities | 3 | 2806 | Risk Ratio (M‐H, Fixed, 95% CI) | 0.99 [0.76, 1.29] |
| 2.2 Mixed ethnicities | 2 | 1615 | Risk Ratio (M‐H, Fixed, 95% CI) | 0.96 [0.58, 1.58] |
| 2.3 Unclear | 3 | 945 | Risk Ratio (M‐H, Fixed, 95% CI) | 0.94 [0.51, 1.73] |
| 3 Pregnancy‐induced hypertension or hypertension Show forest plot | 6 | 3073 | Risk Ratio (M‐H, Random, 95% CI) | 0.78 [0.47, 1.27] |
| 3.1 Majority 'low risk' ethnicities | 5 | 2804 | Risk Ratio (M‐H, Random, 95% CI) | 0.64 [0.34, 1.17] |
| 3.2 Unclear | 1 | 269 | Risk Ratio (M‐H, Random, 95% CI) | 1.37 [0.70, 2.72] |
| 4 Caesarean section Show forest plot | 14 | 6089 | Risk Ratio (M‐H, Fixed, 95% CI) | 0.95 [0.88, 1.02] |
| 4.1 Majority 'low risk' ethnicities | 5 | 2987 | Risk Ratio (M‐H, Fixed, 95% CI) | 0.93 [0.84, 1.03] |
| 4.2 Majority 'high risk' ethnicities | 2 | 156 | Risk Ratio (M‐H, Fixed, 95% CI) | 0.87 [0.54, 1.42] |
| 4.3 Mixed ethnicities | 5 | 1986 | Risk Ratio (M‐H, Fixed, 95% CI) | 0.94 [0.82, 1.07] |
| 4.4 Unclear | 2 | 960 | Risk Ratio (M‐H, Fixed, 95% CI) | 1.15 [0.84, 1.56] |
| 5 Perinatal mortality Show forest plot | 2 | 3757 | Risk Ratio (M‐H, Fixed, 95% CI) | 0.82 [0.42, 1.63] |
| 5.1 Majority 'low risk' ethnicities | 1 | 2202 | Risk Ratio (M‐H, Fixed, 95% CI) | 0.99 [0.32, 3.07] |
| 5.2 Mixed ethnicities | 1 | 1555 | Risk Ratio (M‐H, Fixed, 95% CI) | 0.74 [0.31, 1.74] |
| 6 Large‐for‐gestational age Show forest plot | 11 | 5353 | Risk Ratio (M‐H, Fixed, 95% CI) | 0.93 [0.81, 1.07] |
| 6.1 Majority 'low risk' ethnicities | 3 | 2577 | Risk Ratio (M‐H, Fixed, 95% CI) | 0.91 [0.77, 1.07] |
| 6.2 Majority 'high risk' ethnicities | 1 | 56 | Risk Ratio (M‐H, Fixed, 95% CI) | 3.21 [0.14, 75.68] |
| 6.3 Mixed ethnicities | 5 | 2036 | Risk Ratio (M‐H, Fixed, 95% CI) | 1.05 [0.80, 1.38] |
| 6.4 Unclear | 2 | 684 | Risk Ratio (M‐H, Fixed, 95% CI) | 0.63 [0.32, 1.23] |
| Outcome or subgroup title | No. of studies | No. of participants | Statistical method | Effect size |
| 1 Gestational diabetes Show forest plot | 11 | 5019 | Risk Ratio (M‐H, Random, 95% CI) | 0.86 [0.68, 1.09] |
| 2 Pre‐eclampsia Show forest plot | 4 | 4311 | Risk Ratio (M‐H, Fixed, 95% CI) | 0.99 [0.78, 1.26] |
| 3 Pregnancy‐induced hypertension Show forest plot | 4 | 2694 | Risk Ratio (M‐H, Random, 95% CI) | 0.58 [0.27, 1.25] |
| 4 Caesarean section Show forest plot | 10 | 4968 | Risk Ratio (M‐H, Fixed, 95% CI) | 0.94 [0.87, 1.02] |
| 5 Perinatal mortality Show forest plot | 2 | 3757 | Risk Ratio (M‐H, Fixed, 95% CI) | 0.82 [0.42, 1.63] |
| 6 Large‐for‐gestational age Show forest plot | 8 | 4618 | Risk Ratio (M‐H, Fixed, 95% CI) | 0.95 [0.83, 1.09] |