Intervenciones con ejercicios y régimen dietético combinados para la prevención de la diabetes mellitus gestacional
Información
- DOI:
- https://doi.org/10.1002/14651858.CD010443.pub3Copiar DOI

- Base de datos:
-
- Cochrane Database of Systematic Reviews
- Versión publicada:
-
- 13 noviembre 2017see what's new
- Tipo:
-
- Intervention
- Etapa:
-
- Review
- Grupo Editorial Cochrane:
-
Grupo Cochrane de Embarazo y parto
- Copyright:
-
- Copyright © 2017 The Cochrane Collaboration. Published by John Wiley & Sons, Ltd.
Cifras del artículo
Altmetric:
Citado por:
Autores
Contributions of authors
For this update of the review, Emily Shepherd and Judith Gomersall assessed the citations and studies found for inclusion, extracted data, assessed risk of bias and quality of evidence using the GRADE approach, conducted analyses and wrote the first draft of the review. All review authors (Joanna Tieu, Shanshan Han, Caroline Crowther and Philippa Middleton) assisted with data interpretation and edited and commented on the review.
For the first version of the review, Emily Shepherd (nee Bain) and Morven Crane assessed the citations and studies found for inclusion, extracted data, assessed risk of bias and conducted data analyses. Emily Shepherd, Morven Crane and Shanshan Han wrote the first draft of the review, and all review authors (Joanna Tieu, Caroline Crowther, Philippa Middleton) assisted with data interpretation and edited and commented on the review.
Morven Crane wrote the first draft of the protocol, with all review authors (Emily Shepherd, Joanna Tieu, Shanshan Han, Philippa Middleton, Caroline Crowther) making comments and contributing to subsequent drafts.
Sources of support
Internal sources
-
ARCH: Australian Research Centre for Health of Women and Babies, Robinson Research Institute, The University of Adelaide, Australia.
-
Healthy Mothers, Babies and Children, SAHMRI: South Australian Health and Medical Research Institute, Adelaide, Australia.
-
Liggins Institute, The University of Auckland, Auckland, New Zealand.
External sources
-
NHMRC: National Health and Medical Research Council, Australia.
Funding for the Australian and New Zealand Pregnancy and Childbirth Satellite
-
NIHR: National Institute for Health Research, UK.
Cochrane Review Incentive Scheme Award: 16/72/02
Declarations of interest
Emily Shepherd: none known.
Judith Gomersall: none known.
Joanna Tieu has received funding for work outside of the scope of this review‐ NHMRC postgraduate scholarship, Ken Muirden fellowship (administered by Arthritis Australia; jointly funded by Australian Rheumatology Association and Roche).
Shanshan Han: Shanshan Han was an investigator on one of the excluded trials (Crowther 2012). Assessment of eligibility for inclusion was carried out by other members of the review team who were not directly involved in the trial.
Caroline Crowther: Caroline Crowther was an investigator on one of the included trials (Dodd 2014), and one of the excluded trials (Crowther 2012). All tasks relating to these trials (assessment of eligibility for inclusion, and if applicable, data extraction and assessment of risk of bias) were carried out by other members of the review team who were not directly involved in the trials.
Philippa Middleton: Philippa Middleton was an investigator on one of the excluded trials (Crowther 2012). Assessment of eligibility for inclusion was carried out by other members of the review team who were not directly involved in the trial.
Acknowledgements
We acknowledge the support from the Cochrane Pregnancy and Childbirth editorial team in Liverpool, UK and the Australian and New Zealand Satellite of Cochrane Pregnancy and Childbirth in Adelaide, Australia.
This project was supported by the National Institute for Health Research (NIHR), via a Cochrane Infrastructure funding and a Cochrane Review Incentive Scheme Award: 16/72/02. The views and opinions expressed therein are those of the authors and do not necessarily reflect those of NIHR.
We thank Morven Crane for her contribution to the protocol and initial version of this review.
Version history
| Published | Title | Stage | Authors | Version |
| 2017 Nov 13 | Combined diet and exercise interventions for preventing gestational diabetes mellitus | Review | Emily Shepherd, Judith C Gomersall, Joanna Tieu, Shanshan Han, Caroline A Crowther, Philippa Middleton | |
| 2015 Apr 12 | Diet and exercise interventions for preventing gestational diabetes mellitus | Review | Emily Bain, Morven Crane, Joanna Tieu, Shanshan Han, Caroline A Crowther, Philippa Middleton | |
| 2013 Mar 28 | Diet and exercise interventions for preventing gestational diabetes mellitus | Protocol | Morven Crane, Emily Bain, Joanna Tieu, Shanshan Han, Philippa Middleton, Caroline A Crowther | |
Differences between protocol and review
For this update, we have updated the methods to be in line with those in the standard template used by Cochrane Pregnancy and Childbirth, specifically we included use of the GRADE approach to assess the quality of the body of evidence and the use of ’Summary of findings’ tables. Judith Gomersall has joined the review team for this update.
We have revised the review outcomes, using the standardised outcome set agreed by consensus between review authors of Cochrane Pregnancy and Childbirth systematic reviews for prevention and treatment of GDM and pre‐existing diabetes.
We have clarified that in order to be eligible, trials had to report on our primary outcome, GDM. Trials that appeared to meet other eligibility criteria, that did not report on GDM have been included as 'Awaiting classification' (pending the availability/reporting of data on GDM), and will be re‐considered in future updates of this review. We have also clarified that in order to be eligible, trials had to compare a combined diet and exercise intervention with no intervention (i.e. standard care) or with a different diet and exercise intervention. Our review title has been edited accordingly. Trials comparing a diet and exercise intervention with a diet only intervention, or an exercise only intervention, were not eligible, as such trials assess the effects of the addition of an exercise or diet intervention, and thus are of relevance to the Han 2012 and Tieu 2017 reviews, respectively.
Keywords
MeSH
Medical Subject Headings (MeSH) Keywords
- Cesarean Section [statistics & numerical data];
- Combined Modality Therapy [methods];
- Diabetes, Gestational [*prevention & control];
- *Diet;
- *Exercise;
- Hypertension [epidemiology];
- Perinatal Mortality;
- Perineum [injuries];
- Pregnancy Complications, Cardiovascular [epidemiology];
- Randomized Controlled Trials as Topic;
Medical Subject Headings Check Words
Female; Humans; Infant, Newborn; Pregnancy;
PICO

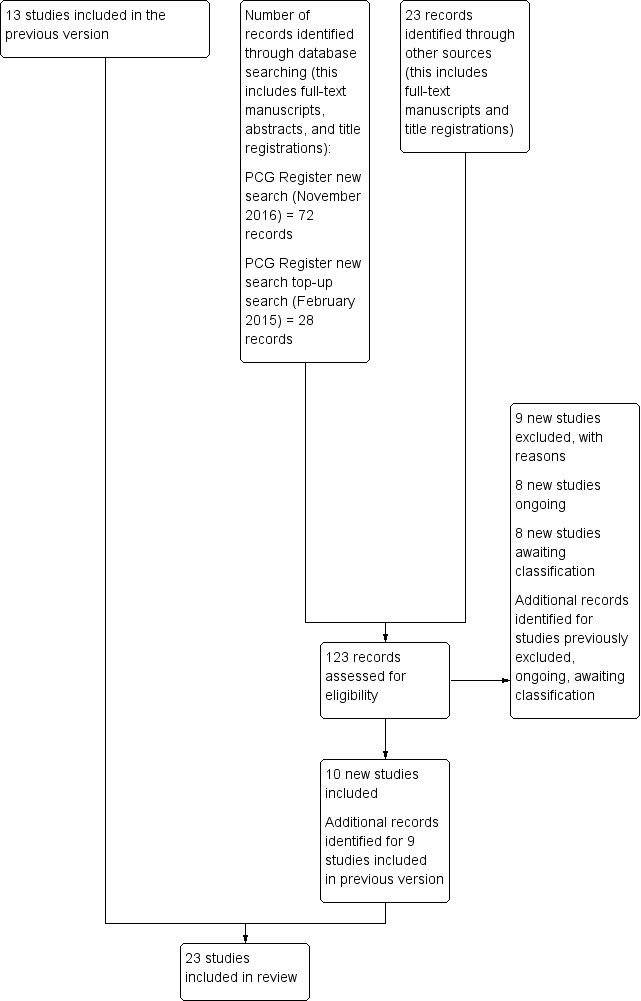
Update study flow diagram.
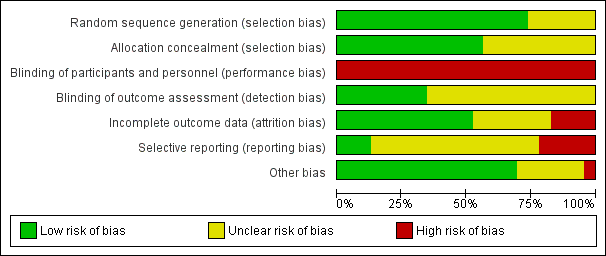
'Risk of bias' graph: review authors' judgements about each risk of bias item presented as percentages across all included trials.

'Risk of bias' summary: review authors' judgements about each risk of bias item for each included trial.

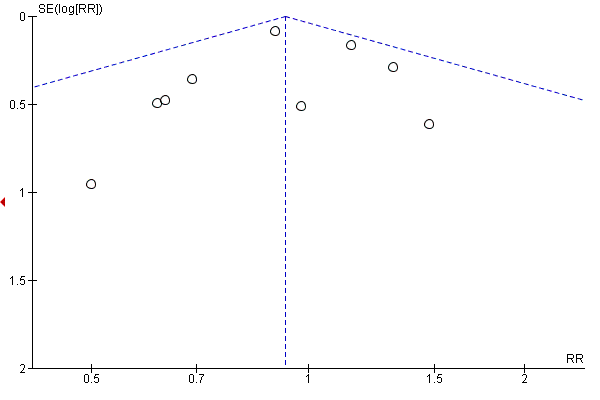
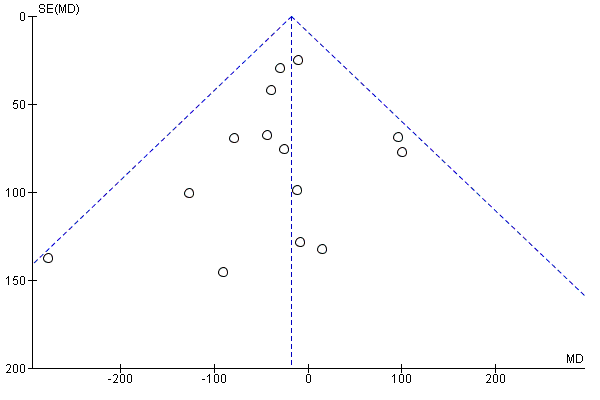
Funnel plot of comparison: 1 Diet and exercise interventions versus control, outcome: 1.1 Gestational diabetes.

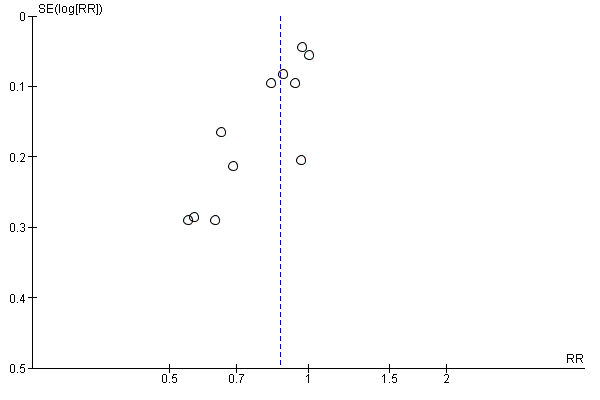
Funnel plot of comparison: 1 Diet and exercise interventions versus control, outcome: 1.4 Caesarean section.
Funnel plot of comparison: 1 Diet and exercise interventions versus control, outcome: 1.6 Large‐for‐gestational age.

Funnel plot of comparison: 1 Diet and exercise interventions versus control, outcome: 1.13 Gestational weight gain (kg).
Funnel plot of comparison: 1 Diet and exercise interventions versus control, outcome: 1.16 Gestational weight gain (above IOM recommendations).

Funnel plot of comparison: 1 Diet and exercise interventions versus control, outcome: 1.31 Gestational age at birth (weeks).

Funnel plot of comparison: 1 Diet and exercise interventions versus control, outcome: 1.33 Preterm birth.

Funnel plot of comparison: 1 Diet and exercise interventions versus control, outcome: 1.35 Macrosomia.
Funnel plot of comparison: 1 Diet and exercise interventions versus control, outcome: 1.37 Birthweight (g).

Comparison 1 Combined diet and exercise interventions versus standard care, Outcome 1 Gestational diabetes.

Comparison 1 Combined diet and exercise interventions versus standard care, Outcome 2 Pre‐eclampsia.

Comparison 1 Combined diet and exercise interventions versus standard care, Outcome 3 Pregnancy‐induced hypertension and/or hypertension.

Comparison 1 Combined diet and exercise interventions versus standard care, Outcome 4 Caesarean section.

Comparison 1 Combined diet and exercise interventions versus standard care, Outcome 5 Perinatal mortality.

Comparison 1 Combined diet and exercise interventions versus standard care, Outcome 6 Large‐for‐gestational age.

Comparison 1 Combined diet and exercise interventions versus standard care, Outcome 7 Operative vaginal birth.

Comparison 1 Combined diet and exercise interventions versus standard care, Outcome 8 Induction of labour.

Comparison 1 Combined diet and exercise interventions versus standard care, Outcome 9 Perineal trauma.

Comparison 1 Combined diet and exercise interventions versus standard care, Outcome 10 Placental abruption.

Comparison 1 Combined diet and exercise interventions versus standard care, Outcome 11 Postpartum haemorrhage.
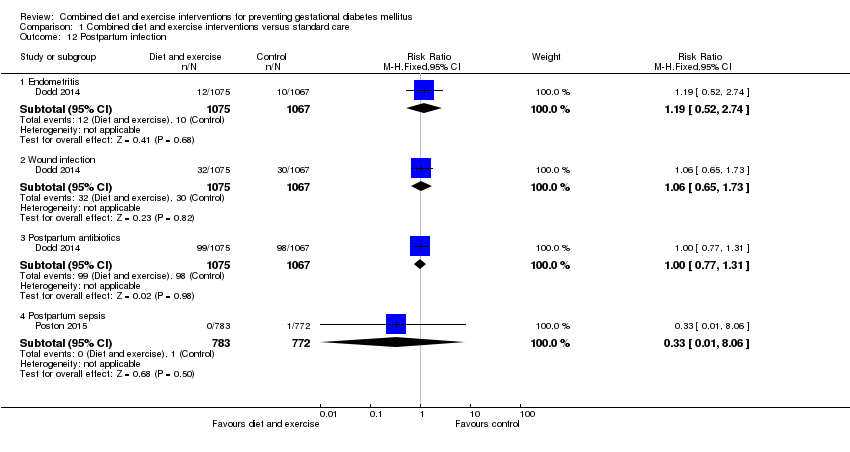
Comparison 1 Combined diet and exercise interventions versus standard care, Outcome 12 Postpartum infection.

Comparison 1 Combined diet and exercise interventions versus standard care, Outcome 13 Gestational weight gain (kg).

Comparison 1 Combined diet and exercise interventions versus standard care, Outcome 14 Gestational weight gain (various times reported) (kg).
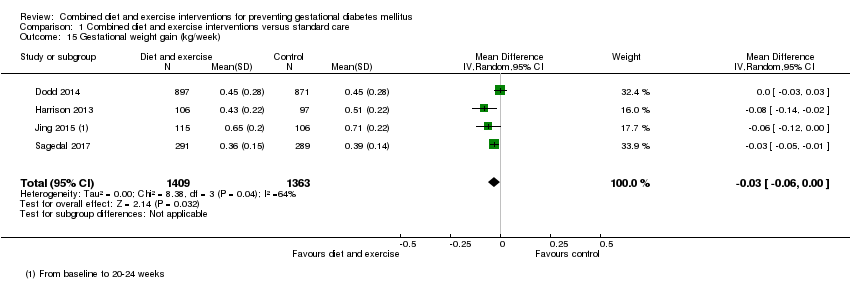
Comparison 1 Combined diet and exercise interventions versus standard care, Outcome 15 Gestational weight gain (kg/week).
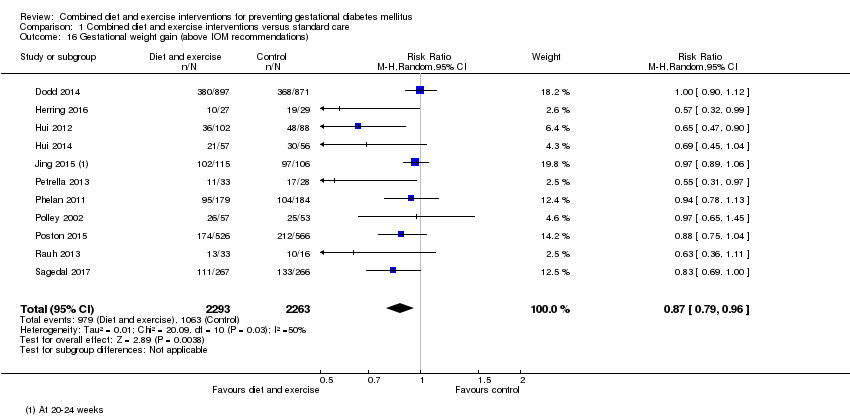
Comparison 1 Combined diet and exercise interventions versus standard care, Outcome 16 Gestational weight gain (above IOM recommendations).

Comparison 1 Combined diet and exercise interventions versus standard care, Outcome 17 Gestational weight gain (within IOM recommendations).
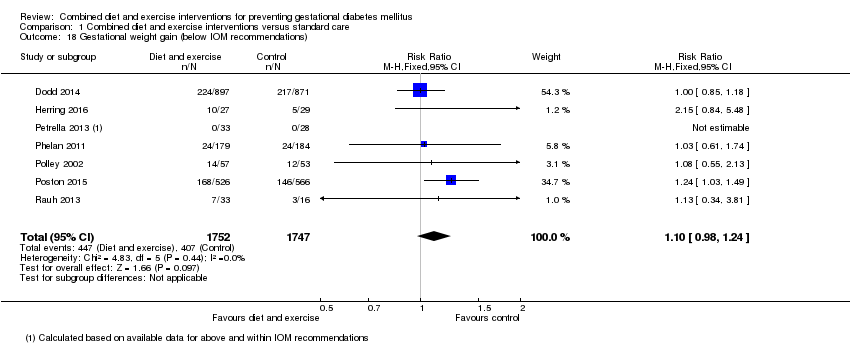
Comparison 1 Combined diet and exercise interventions versus standard care, Outcome 18 Gestational weight gain (below IOM recommendations).
| Study | Diet | Exercise | Benefit in favour of intervention | Benefit in favour of control |
| Bruno 2016 | Higher proportion of women in intervention group, compared with the control group, with Food Frequency Questionnaire score ≥ 2 at 36th week (P = 0.028). No clear difference between groups in ≥ 2 servings of vegetables/day (P = 0.400) or ≤ 3 times/week of food rich in saturated fat; higher proportion of women in intervention group, compared with the control group, having ≤ 30 g sugar/day (P = 0.026). | No clear difference between groups in number of steps/day or duration of physical activity in minutes at the 20th week. Women in the intervention group, compared with the control group, were less active at the 36th week (fewer steps/day (P = 0.016) and had a shorter duration of physical activity (P = 0.039)). | Some (diet) | Some (exercise) |
| Dodd 2014 | Macronutrient consumption and food groups Micronutrient consumption Healthy Eating Index (HEI) Glycaemic index and glycaemic load No clear difference between groups (from trial entry to 28 weeks, 36 weeks, 4 months) in glycaemic load (P = 0.15) or glycaemic index (P = 0.10). Changes in diet and knowledge of healthy food choices "women receiving lifestyle advice were more likely to indicate that the approach to participate in the trial prompted changes to... their diet [... p < 0.0001]... Women who received the intervention indicated greater knowledge about healthy food choices [... p < 0.0001]... compared with women who received Standard Care." | Physical activity Women in the intervention group, compared with the control group (from trial entry, to 28 weeks, 36 weeks, 4 months) had an increase in total activity (P = 0.01); and specifically an increase in household activity (P = 0.01). No clear differences between groups for commuting activity (P = 0.55), leisure activity (P = 0.06) or work activity (P = 0.52). Changes in lifestyle and knowledge of healthy exercise during pregnancy "women receiving lifestyle advice were more likely to indicate that the approach to participate in the trial prompted changes to... their lifestyle [...p < 0.0001]. Women who received the intervention indicated greater knowledge about... exercise during pregnancy [... p < 0.0001] compared with women who received Standard Care." | Some (diet and exercise) | No |
| Harrison 2013 | Not reported | The intervention group had higher steps/day at 28 weeks gestation compared with the control group (P < 0.05); no clear difference between groups in MET minutes‐1/day estimated by the The International Physical Activity Questionnaire (P value not reported). No clear difference between groups at 6 weeks postpartum in physical activity (steps/day) (P = 0.6). | Some (exercise) | No |
| Hawkins 2014 | No clear differences between groups in change from baseline to mid‐pregnancy and baseline to postpartum for total caloric intake (P = 0.78; P = 0.44), calories from fat (%) (P = 0.66; P = 0.14), and fibre (g) (P = 0.20; P = 0.23). | No clear differences between groups in change from baseline to mid‐pregnancy and baseline to postpartum for moderate‐intensity (P = 0.17; P = 0.78), moderate and vigorous‐intensity (P = 0.80; P = 0.82), or sports/exercise (P = 0.72; P = 0.63) physical activity; though significant increase in vigorous‐intensity physical activity in the intervention compared with control group (P = 0.04; P = 0.046) (MET hours/week). | No (diet) Some (exercise) | No |
| Hui 2012 | At 2 months after enrolment, the intervention group, compared with the control group, had lower daily intakes of total calories (P = 0.002*), carbohydrate (g) (P = 0.04), fat (g) (P = 0.0001*), saturated fat (g) (P = 0.00004*), cholesterol (mg) (P = P = 0.001*) and fat ratio (%) (P = 0.001*); and higher carbohydrate ratio (%) (P = 0.02) and protein ratio (%) (P = 0.04); no clear differences between groups for intakes of protein (g) (P = 0.11), and fibre (g) (P = 0.63). At 2 months after enrolment, the intervention group, compared with the control group, had lower daily servings of medium‐fat meat (P = 0.01), 1‐2% fat milk (P = 0.02) and oil and fats (P = 0.02), and higher daily servings of skim milk (P = 0.02); no clear differences between groups for starch (P = 0.66), very lean meat (P = 0.66), lean meat (P = 0.17), high‐fat meat (P = 0.50), vegetables (P = 0.43), fruits (P = 0.39), or whole fat milk (P = 0.15). *P values with statistical significance after Bonferroni | At 2 months after enrolment, the physical activity index was higher in the intervention group compared with the control group (P = 0.00002). | Some (diet) Yes (exercise) | No |
| Hui 2014 | Pre‐pregnancy BMI < 25 At 2 months after the onset of the intervention, women in the intervention group compared with the control group had lower intakes of total calorie (P = 0.01), carbohydrate (g) (P = 0.03), total fat (g) (P = 0.008), saturated fat (g) (P = 0.008), and cholesterol (mg) (P = 0.02); no clear difference between groups for intake of protein (g) (P = 0.36). Pre‐pregnancy BMI ≥ 25 At 2 months after the onset of the intervention, women in the intervention group compared with the control group had lower intakes of total calorie (P = 0.05), total fat (g) (P = 0.02), saturated fat (g) (P = 0.01), and cholesterol (mg) (P = 0.03); no clear differences between groups for intakes of carbohydrate (g) (P = 0.44) or protein (g) (P = 0.17). | Pre‐pregnancy BMI < 25 At 2 months after the onset of the intervention, women in the intervention group compared with the control group had higher physical activity index (units) (P < 0.01). Pre‐pregnancy BMI ≥ 25 At 2 months after the onset of the intervention, no clear difference between groups for physical activity index (units) (P value not reported) | Some (diet and exercise) | No |
| Jing 2015 | No clear differences between groups at 20‐24 weeks gestation for intake of carbohydrate (g) (P = 0.058), fat (g) (P = 0.216), meat (g) (P = 0.235), vegetables (g) (P = 0.637), eggs (g) (P = 0.962), milk (g) (P = 0.060), beans (g) (P = 0.982). Higher intake of energy (kcal) (P = 0.024), protein (g) (P = 0.003), grain (g) (P = 0.013), fruit (g) (P = 0.048), seafood (P = 0.031), and nuts (P = 0.036) for women in intervention group compared with control group. | No clear difference between groups at 20‐24 weeks for time spent (hours/day) doing moderate activity (P = 0.824) [and no clear difference between groups for time spent (hours/day) on intensities A, B, C, E, F, G, H]. Less time spent resting (P = 0.033) and more time doing mild activity (P = 0.016) among women in the intervention group compared with control group [and more time spent (hours/day) on intensity D]. | Some (diet and exercise) | No |
| Koivusalo 2016 | The dietary index score improved more among women in the intervention group, compared with the control group (P = 0.16 unadjusted, P = 0.037 adjusted). No clear differences between groups in changes in food intake from the first to second trimester for low‐fat milk (times/day) (P = 0.726), whole‐grain cereal (times/day) (P = 0.182), fruits and berries (times/day) (P = 0.865), vegetables and legumes (times/day) (P = 0.419), animal protein (times/day) (P = 0.658), snacks (times/week) (P = 0.112), sugar sweetened beverages (times/week) (P = 0.750), fast food (times/week) (P = 0.731), spread fat (score) (P = 0.103), cooking fat (score) (P = 0.937). Intakes of low‐fat cheese (P = 0.040) and fish (P = 0.011) increased in the intervention group compared with the control group. | Women in the intervention group increased their median weekly leisure time physical activity while the physical activities of women in the control group remained unchanged (P = 0.17 unadjusted, P = 0.029 adjusted). No clear difference between groups in proportion of women meeting the physical activity goal (150 minutes/week in the second trimester). | Some (diet and exercise) | No |
| Luoto 2011 | Dietary changes Compared with the control group, from baseline to 26‐28 weeks, the intervention group reduced their intake of saccharose (E%) (P = 0.04), and saturated fatty acids (E%) (P = 0.005); no clear differences between groups seen for intakes of total energy (MJ/day) (P = 0.97), total energy (kcal/day) (P = 0.97), protein (E%) (P = 0.094), carbohydrates (E%) (P = 0.76), dietary fibre (g/day) (P = 0.44), total fat (E%) (P = 0.15), trans fatty acids (E%) (P = 0.65), mono saturated fatty acids (E%) (P = 0.99), or polyunsaturated fatty acids (E%) (P = 0.21). Compared with the control group, from baseline to 36‐37 weeks, the intervention group reduced their intake of saccharose (E%) (P = 0.023) and saturated fatty acids (E%) (P = 0.01) and increased their intake of dietary fibre (g/day) (P = 0.019) and polyunsaturated fatty acids (E%) (P < 0.001); no clear differences between groups seen for intakes of total energy (MJ/day) (P = 0.90), total energy (kcal/day) (P = 0.90), protein (E%) (P = 0.29), carbohydrates (E%) (P = 0.60), total fat (E%) (P = 0.86), trans fatty acids (E%) (P = 0.30), or mono saturated fatty acids (E%) (P = 0.51). Food habits related to the objectives of dietary counselling From baseline to 26‐28 weeks, the intervention group, compared with the control group, increased their proportion of high‐fibre bread (% of all bread) (P = 0.001) and vegetable fats (% of all dietary fat) (P = 0.001), while the control group decreased their proportion of low‐fat cheeses (% of all cheese) (P = 0.001), and increased intake of snacks high in sugar and/or fat (g/day) (P = 0.022); no clear differences between groups in intake of vegetables, fruits and berries (g/day) (P = 0.117), fat‐free or low‐fat milk (% of all milk) (P = 0.093), frequency of eating fish (per week) (P = 0.120), or high‐fat foods (g/day) (0.664). From baseline to 36‐37 weeks, the intervention group, compared with the control group, increased their intake of vegetables, fruits and berries (g/day) (P = 0.001), proportion of high‐fibre bread (% of all bread) (P = 0.003) and vegetable fats (% of all dietary fat) (P = 0.003), while the control group decreased their proportion of low‐fat cheeses (% of all cheese) (P = 0.009); no clear differences between groups in proportion of fat‐free or low‐fat milk (% of all milk) (P = 0.630), frequency of eating fish (per week) (P = 0.068), intake of high‐fat foods (g/day) (0.108), or snacks high in sugar and/or fat (g/day) (P = 0.551). Consumption of the main food groups and foods From baseline to 26‐28 weeks gestation, the intervention group, compared with the control group, increased total intake of milk (P = 0.025), fish (P = 0.041), vegetable oils (P = 0.002) and oil based salad dressings (P = 0.002); while the control group, compared with the intervention group, increased consumption of porridge and breakfast cereals (P = 0.003) and candies and chocolates (P = 0.008) (all g/day); no clear differences between groups for intake of fruits and berries (P = 0.575), cooked potato or in dishes (P = 0.686), french fries, chips and other fatty potato products (P = 0.995), total bread (P = 0.459), rice and pasta (P = 0.118), total cheese (P = 0.318), red meat and game (P = 0.851), poultry (P = 0.252), sausages (P = 0.896), vegetable spreads (P = 0.071), butter and butter mixtures (P = 0.128), solid baking margarines (P = 0.194), sweet pastries and other sugary food items (P = 0.055), pizza and hamburgers (P = 0.703), tea (P = 0.464), coffee (P = 0.976), sugary soft drinks (P = 0.088) or juice (P = 0.096) (all g/day). From baseline to 36‐37 weeks gestation, the intervention group, compared with the control group, increased total intake of fish (P = 0.044), vegetable oils (P = 0.002) and oil based salad dressings (P = 0.010); while the control group, compared with the intervention group, decreased consumption of vegetables (P = 0.005); no clear differences between groups for intake of fruits and berries (P = 0.134), cooked potato or in dishes (P = 0.157), french fries, chips and other fatty potato products (P = 0.388), total bread (P = 0.175), porridge and breakfast cereals (P = 0.811), rice and pasta (P = 0.187), total milk (P = 0.878), total cheese (P = 0.364), red meat and game (P = 0.806), poultry (P = 0.482), sausages (P = 0.444), vegetable spreads (P = 0.215), butter and butter mixtures (P = 0.417), solid baking margarines (P = 0.208), candies and chocolates (P = 0.133), sweet pastries and other sugary food items (P = 0.104), pizza and hamburgers (P = 0.755), tea (P = 0.235), coffee (P = 0.481), sugary soft drinks (P = 0.730) or juice (P = 0.094) (all g/day). | Physical activity changes No clear differences between baseline to 26‐28 weeks or baseline to 36‐37 weeks for total MET minutes/week (P = 0.36; P = 0.63), MET minutes/week for at least moderate activity (P = 0.17; P = 0.82), MET minutes/week for light activity (P = 0.57; P = 0.17), or ≥ 800 MET minutes/week (%) (P = 0.27; P = 0.51). At 26‐28 weeks, the decreases in total leisure‐time physical activity (LTPA) (days/week) and moderate‐to‐vigorous LTPA (days/week) were smaller in the intervention group compared with the control group (P = 0.040; P = 0.016); though no clear differences between group/days in total LTPA (minutes/week) (P = 0.58), moderate‐to‐vigorous LTPA (minutes/week) (P = 0.11), light LTPA (days/week) (P = 0.80), light LTPA (minutes/week) (P = 0.65), or meeting physical activity recommendations for health (%) (P = 0.060) were observed. No clear differences between groups from baseline to 36‐37 weeks in total LTPA (days/week: P = 0.80; minutes/week: P = 0.60), moderate‐to‐vigorous LTPA (days/week: P = 0.16; minutes/week: P = 0.96), or light LTPA (days/week: P = 0.21; minutes/week: P = 0.75), or meeting physical activity recommendations for health (%: P = 0.70). "From 26‐28 weeks’ gestation to 36‐37 weeks’ gestation the number of weekly days with light‐intensity LTPA decreased significantly less in INT than in UC (0.1 vs. 0.6 days, p = 0.05, not shown in Table 4)." | Some (diet and exercise) | No |
| Petrella 2013 | "Significant changes in eating habits occurred in the Therapeutic Lifestyle Changes group, increasing the number of snacks/day, the consumption of vegetables and fruits. Moreover, intervention also decreased the consumption of sugar. No differences in the number of daily spoons of oil, red meat and complex carbohydrates intake were found." | "The step numbers for each walking session was constant during pregnancy (3267 ± 1683 at 36th week and 3755 ± 1816 at 28th week)." | Not applicable (only reported for intervention group) | Not applicable (only reported for intervention group) |
| Phelan 2011 | "No significant treatment... interaction effects over time were observed... for dietary factors." Repeated‐measures ANOVA of time (early pregnancy, late pregnancy, 6 months postpartum, 12 months postpartum) x treatment group interactions for dietary changes in calorie intake, percentage of calories from fat, percentage of calories from carbohydrate, percentage of calories from protein, percentage of calories from sweets, daily calories from soft drinks, daily saturated fat (g), daily servings of vegetables, daily servings of fruit and fruit juices, daily servings of bread, cereals, rice, pasta, daily servings of milk, yogurt, cheese, daily frequency of fats and oils, sweets, sodas, weekly fast food, daily iron from food (mg), daily calcium from food (mg), total daily dietary fibre (g), daily vitamin D from food (IU), daily folate from food (μg): P values all "NS." | "A trend was observed for an effect of the intervention on physical activity... which suggested a small intervention‐related increase in calories expended in physical activity during the postpartum period." Repeated‐measures ANOVA of time (early pregnancy, late pregnancy, 6 months postpartum, 12 months postpartum) x treatment group interaction for kcal (F = 2.5, P = 0.06, hp2 = 0.02). | No (diet) Yes (exercise) | No |
| Polley 2002 | "All groups decreased their fat consumption from these foods from baseline to 30 weeks, except normal‐weight women in the control condition. There was no effect of treatment on changes in fat intake from these foods from recruitment to 30 weeks (P>0.2)." | "Changes in exercise level from recruitment to 30 weeks (P>0.8) were not related to treatment condition." | No | No |
| Poston 2013 | At 28 weeks gestation, the intervention group had lower intakes of total energy (MJ/day) (P = 0.016), dietary glycaemic load (g/day) (P = < 0.001), glycaemic load (%E) (P = 0.013), total fat (%E) (P = 0.010) and saturated fatty acids (%E) (P = 0.015), and higher protein (%E) (P = 0.034), and fibre (non‐starch polysaccharides) (g) (P = 0.040) compared with the control group; no clear differences between groups for dietary glycaemic index (%) (P = 0.054), carbohydrate (%E) (P = 0.207), protein (g) (P = 0.204), monounsaturated fatty acids (%E) (P = 0.088), polyunsaturated fatty acids (%E) (P = 0.075), or polyunsaturated fatty acid, saturated fatty acid ratio (P = 0.075). "A principal component analysis (PCA) of Food Frequency Questionnaire (FFQ) data from the UPBEAT pilot study database was performed to derive three diet patterns: two with high coefficients for high‐sugar and/or highfat food groups defined as ‘Western’ and ‘Healthy‐unhealthy choices’ and a ‘traditional’ African or African‐Caribbean diet pattern…. The ‘Western’ and ‘Healthy‐unhealthy choices’ patterns scores were reduced in those who received the intervention." | At 28 weeks gestation, no clear differences between groups for physical activity, as measured by accelerometer (minutes/day of sedentary, active, light, moderate to vigorous activity) (P values not reported; mean differences with 95% confidence intervals indicate no clear differences), and Recent Physical Activity Questionnaire (minutes/day of sedentary, activity, light activity); self‐reported moderate to vigorous activity (minutes/day) was higher in the intervention group compared with the control group (P value not reported; mean difference with 95% confidence interval indicates difference), and women in the intervention group self‐reported walking (minutes/day) for leisure more than those in the control group (P = 0.003). | Some (diet and exercise) | No |
| Poston 2015 | At 27‐28 weeks and 6 days, women in the intervention group, compared with the control group, had lower mean total energy (MJ/day) (P < 0.0001), glycaemic index (0‐100) (P < 0.0001), glycaemic load per day (P < 0.0001), and intake carbohydrate (% energy) (P = 0.0011), total fat (% energy) (P = 0.0011), saturated fat (g/day) (P < 0.0001) and saturated fat (% energy) (P < 0.0001); and higher intake of protein (% energy) (P < 0.0001), and fibre (g/day) (P = 0.013). At 6 months postpartum, women in the intervention group, compared with the control group, had lower glycaemic load per day (P < 0.001), glycaemic index (0‐100) (P < 0.001), intakes of total energy (kcal per day) (P < 0.001), saturated fat (% energy) (P < 0.001), and total fat (% energy) (P < 0.001), and higher intake of protein (% energy) (P < 0.001); no clear differences between groups for intakes of carbohydrates (% energy) (P = 0.835) and fibre (g/day) (P = 0.873). | At 27‐28 weeks and 6 days, women in the intervention group, compared with the control group, were more physically active: MET (minutes/week) (P = 0.0015); attributed to more time spent walking (minutes/week) (P = 0.0018), with no clear difference seen between groups for moderate or vigorous activity (minutes/week) (P > 0.99). At 6 months postpartum, no clear differences between groups for measures of physical activity: MET (minutes/week) (P = 0.607), moderate or vigorous activity (minutes/week) (P = 0.681), or walking (minutes/week) (P = 1.00). | Some (diet and exercise) | No |
| Rauh 2013 | The intervention group had a lower change from baseline to 36‐38th week gestation energy intake compared with the control group (kcal/day) (P = 0.035). | No clear difference between groups in change from baseline to 36‐38th week gestation total activity (MET‐min/week) (P = 0.425). | Yes (diet) No (exercise) | No |
| Sagedal 2017 | At 36 weeks gestation the intervention group had a higher (more favourable) diet score compared with the control group (P = 0.013); dietary differences favouring the intervention group were identified in 7 domains: ‘drinking water when thirsty’ (P = 0.002), ‘vegetables with dinner’ (P = 0.027), ‘fruits and vegetables for between‐meal snacks’ (P = 0.023), ‘package size of unhealthy foods’ (P = 0.010), ‘added sugar' (P = 0.005), ‘eating beyond satiety’ (P = 0.009) and ‘food labels’ (P = 0.011); no clear differences between groups for 'meal regularity' (P = 0.176), 'eating sweets or snacks without appreciation' (P = 0.446), 'added salt' (P = 0.680). | At 36 weeks gestation the intervention group compared with the control group had higher weekly energy expenditure (MET‐minutes/week) (P = 0.009), and according to the International Physical Activity Questionnaire, fewer had 'low activity', and more had 'moderate activity' and 'high activity' (P = 0.013). | Some (diet) Yes (exercise) | No |
| Vinter 2011 | "When asked at 35 weeks’ gestation whether participation in the LiP study had resulted in more healthy eating habits, 85% of women in the intervention group responded affirmatively. In addition, 21% of women in the control group thought that their dietary habits in pregnancy were positively influenced by their participation." At 35 weeks' gestation, women in the intervention group had higher self‐reported physical activity levels compared with those in the control group (physical activity ≥ 2 hours/week (P = 0.001); physical activity making them sweaty or short of breath ≥ 2 hours/week (P < 0.001)); no clear differences between groups at 6 months postpartum (physical activity ≥ 2 hours/week (P = 0.620); physical activity making them sweaty or short of breath ≥ 2 hours/week (P = 0.961)). | "Among women in the intervention group, 77.5% undertook leisure time sporting activities in addition to the aerobic classes. In addition, 65% of women in the control group engaged in some type of leisure time sporting activities during pregnancy (P = 0.016)." At 35 weeks' gestation, women in the intervention group had improved eating habits compared with those in the control group (considered themselves as in the most healthy eating habit groups (P = 0.003)); no clear differences between groups at 6 months postpartum (considered themselves as in the most healthy eating habit groups (P = 0.609)). | Some (diet and exercise) | No |
Comparison 1 Combined diet and exercise interventions versus standard care, Outcome 19 Behaviour changes associated with the intervention.
| Study | Results | Benefit in favour of intervention | Benefit in favour of control |
| Hawkins 2014 | No clear differences between groups in change in biomarkers of insulin resistance from baseline to mid‐pregnancy: glucose (mmol/L) (P = 0.63); insulin (pmol/L) (P = 0.39); leptin (pmol/L) (P = 0.73); adiponectin (nmol/L) (P = 0.51); resistin (nmol/L) (P = 0.19); tumour necrosis factor‐alpha (pmol/L) (P = 0.11); c‐reactive protein (nmol/L) (P = 0.19). | No | No |
| Koivusalo 2016 | Women in the intervention group compared with the control group had a greater change (reduction) in fasting plasma glucose from baseline to the third trimester (P = 0.026 unadjusted; P = 0.011 adjusted). No clear difference between groups in change (increase) in 2‐hour glucose from baseline to second trimester (P = 0.92 unadjusted, P = 0.42 adjusted). | Some | No |
| Korpi‐Hyovalti 2011 | No clear difference between groups in fasting glucose (mmol/L), OGTT 1‐hour glucose (mmol/L), OGTT 2‐hour glucose (mmol/L), or area under the curve (mmol/L/2 hour) (all reported to be P = NS) at weeks 26‐28. | No | No |
| Luoto 2011 | There were no clear differences between groups in glucose intolerance measurements at 26‐28 weeks (glucose concentrations in 2‐hour OGTT (mg/L): fasting (P = 0.44), 1‐hour (P = 0.23), 2‐hour (P = 0.99); insulin (P = 0.10), or HOMA‐IR (P = 0.13)); or in the change from baseline (8‐12 weeks) to 26‐28 week values for insulin (P = 0.23), or HOMA‐IR (P = 0.24). | No | No |
| Poston 2015 | At 27‐28 weeks and 6 days gestation, no clear differences between groups in fasting blood glucose (mmol/L) (P = 0.49), 1‐hour blood glucose (mmol/L) (P = 0.43), 2‐hour blood glucose (mmol/L) (P = 0.81), plasma fasting insulin (mU/L) (P = 0.57), HOMA‐IR (units) (P = 0.60), plasma triglycerides (mmol/L) (P = 0.39), plasma LDL cholesterol (mmol/L) (P = 0.27), plasma HDL cholesterol (mmol/L) (0.93), plasma VLDL (mmol/L) (P = 0.39). | No | No |
| Vinter 2011 | Glucose metabolism and insulin sensitivity No clear differences between groups in fasting plasma glucose (mmol/L) at 28‐30 weeks (P = 0.060) or 34‐36 weeks (P = 0.431). No clear differences between groups in 2‐hour oral glucose tolerance test (mmol/L) at 28‐30 weeks (P = 0.459) or 34‐36 weeks (P = 0.723). No clear differences between groups in fasting insulin (mU/L) at 34‐36 weeks (P = 0.065) or change from baseline to 34‐36 weeks fasting insulin (P = 0.063); women in the intervention group had lower fasting insulin at 28‐30 weeks (P = 0.040), and lower change from baseline to 28‐30 weeks fasting insulin (P = 0.015). No clear differences between groups in HOMA‐IR at 34‐36 weeks (P = 0.062) or change from baseline to 34‐36 weeks fasting insulin (P = 0.079); women in the intervention group had lower fasting insulin at 28‐30 weeks (P = 0.032), and lower change from baseline to 28‐30 weeks fasting insulin (P = 0.022). No clear differences between groups at 28‐30 weeks or 34‐36 weeks for fasting cholesterol (mmol/L) (P = 0.332; P = 0.484), fasting HDL (mmol/L) (P = 0.781; P = 0.871), fasting LDL (mmol/L) (P = 0.148; P = 0.183), or fasting triglycerides (mmol/L) (P = 0.385; P = 0.399). | Some | No |
Comparison 1 Combined diet and exercise interventions versus standard care, Outcome 20 Relevant biomarker changes associated with the intervention.
| Study | Results | Benefits in favour of intervention | Benefits in favour of control |
| Dodd 2014 | There were no clear differences between groups (from trial entry, to 28 weeks, 36 weeks and 4 months postpartum) in mean depressive scores (Edinburgh Postnatal Depression Scale (EPDS) mean scores) (adjusted P = 0.25), risk of depression (EPDS score > 12, %) (adjusted P = 0.95), symptoms of anxiety (Spielberger State‐Trait Anxiety Inventory (STAI) mean scores) (adjusted P = 0.51), or risk of high level anxiety (STAI score ≥ 15, %) (adjusted P = 0.31). There were no clear differences between groups for any of the domains assessing health related quality of life (from trial entry, to 28 weeks, 36 weeks and 4 months postpartum) (mean scores: physical functioning adjusted P = 0.53; physical role adjusted P = 0.59; bodily pain adjusted P = 0.27; general health adjusted P = 1.00; vitality adjusted P = 0.48; social functioning adjusted P = 0.52; emotional role adjusted P > 0.11; mental health adjusted P = 0.07; physical component adjusted P = 0.47; mental component adjusted P = 0.36). For emotional role and mental health domains there were significant interactions between treatment group and time point (P = 0.03; P = 0.007); although there were no significant differences between treatment groups at any individual time point, the pattern of change over pregnancy differed according to treatment group. "All women reported a high degree of satisfaction with their pregnancy... p = 0.8722... and with birth... p = 0.9235... Most women agreed or strongly agreed that they felt in control during their pregnancy... p = 0.9945... and birth... p = 0.4510... and they liked their care providers... p = 0.1530... There were no differences with regard to the proportion of women who felt healthy during pregnancy... p = 0.3517... women who received the intervention were more likely to feel reassured about their own health... p = 0.0112... and that of their baby... p = 0.0143... In the postpartum period, most women felt healthy... p = 0.5942... and were not concerned about their future health... p = 0.9444... or the future health of their baby or child... p = 0.9467" | Some (reassurance about own health and health of baby) | No |
| Luoto 2011 | No clear difference between groups from 8‐13 weeks to 36‐37 weeks in change in health related quality of life (15D questionnaire) (P = 0.24), or perceived health (VAS scale of 0–10 cm) (P = 0.061). | No | No |
| Phelan 2011 | "The intervention group... had a significantly greater increase in scores on the Edinburgh Depression Scale during the postpartum period than did the standard‐care group (F = 23.2, P = 0.0001, hp2 = 0.094); however, multiple logistic regression analyses indicated no significant effects of the intervention compared with standard care on the prevalence of depression (defined as a score ≥13) at 30 wk of gestation (6.4% compared with 7.2%, respectively), 6 mo (3.4% compared with 3.6%, respectively), or 12 mo (5.2% compared with 6.3%, respectively) postpartum. Both groups reported very low depression scores overall... No significant treatment... interaction effects over time were observed for dietary disinhibition, stress or sleep." Repeated‐measures ANOVA of time (early pregnancy, late pregnancy, 6 months postpartum, 12 months postpartum) x treatment group interactions for disinhibition, stress, and sleep score: P values all reported to be "NS." | No | Some (Edinburgh Depression Scale scores) |
| Poston 2013 | At 28 weeks gestation, there was no clear difference between groups in the numbers of women reporting problems in each of the EuroQol quality of life (EQ‐5D) questionnaire domains: mobility, self‐care, usual activities, pain and discomfort, anxiety and depression; or in the time trade‐off health state rating and visual analogue scale of health related quality of life (0 to 100) (P values not reported, however treatment effects indicate no clear differences). At 28 weeks gestation there were also no clear differences between groups in Edinburgh Postnatal Depression Score total, total score > 9, and total score > 12 (P values not reported, however treatment effects indicate no clear differences). | No | No |
Comparison 1 Combined diet and exercise interventions versus standard care, Outcome 21 Sense of well‐being and quality of life.

Comparison 1 Combined diet and exercise interventions versus standard care, Outcome 22 Breastfeeding (exclusive).

Comparison 1 Combined diet and exercise interventions versus standard care, Outcome 23 Breastfeeding (partial).
| Study | Diet and exercise | Control | P value |
| Rauh 2013 | Mean (SD not reported) (N = 148, unadjusted) Exclusive breastfeeding duration (days): 130.7 Total breastfeeding duration (days): 232.1 | Mean (SD not reported) (N = 65, unadjusted) Exclusive breastfeeding duration (days): 116.3 Total breastfeeding duration (days): 219.4 | P = 0.180 P = 0.465 |
Comparison 1 Combined diet and exercise interventions versus standard care, Outcome 24 Breastfeeding.
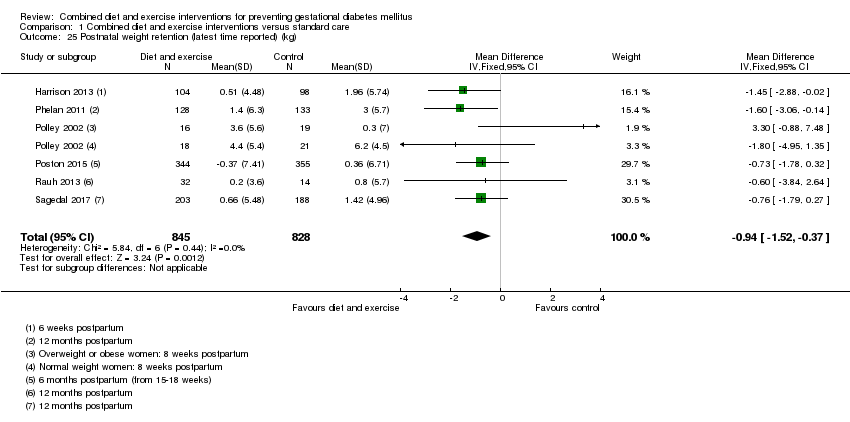
Comparison 1 Combined diet and exercise interventions versus standard care, Outcome 25 Postnatal weight retention (latest time reported) (kg).

Comparison 1 Combined diet and exercise interventions versus standard care, Outcome 26 Return to pre‐pregnancy weight (latest time reported).

Comparison 1 Combined diet and exercise interventions versus standard care, Outcome 27 Postnatal BMI (latest time reported).
| Study | Intervention | Control | P value |
| Vinter 2011 | 6 months postpartum (median (IQR)) (N = 123) Systolic blood pressure (mm Hg): 122 (116–129) Diastolic blood pressure (mm Hg): 83.5 (78–88) | 6 months postpartum (median (IQR)) (N = 115) Systolic blood pressure (mm Hg): 122 (115–128) Diastolic blood pressure (mm Hg): 82 (78–88) | 0.770 0.733 |
Comparison 1 Combined diet and exercise interventions versus standard care, Outcome 28 Maternal cardiovascular health (latest time reported).
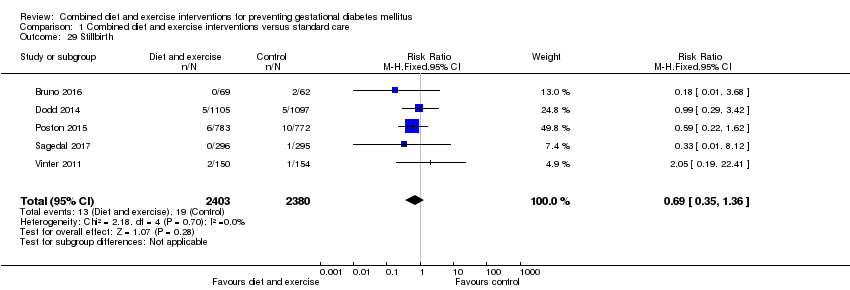
Comparison 1 Combined diet and exercise interventions versus standard care, Outcome 29 Stillbirth.

Comparison 1 Combined diet and exercise interventions versus standard care, Outcome 30 Neonatal mortality.

Comparison 1 Combined diet and exercise interventions versus standard care, Outcome 31 Gestational age at birth (weeks).
| Study | Intervention group | Control group | P value |
| Polley 2002 | Mean (SD not reported) Normal weight women (N = 30) 39.1 weeks Overweight women (N = 27) 39.4 weeks | Mean (SD not reported) Normal weight women (N = 31) 39.5 weeks Overweight women (N = 22) 39.1 weeks | Not reported |
| Vinter 2011 | Median (IQR) (N = 150) 283 days (273‐290) | Median (IQR) (n = 154) 283 days (274‐289) | 0.952 |
Comparison 1 Combined diet and exercise interventions versus standard care, Outcome 32 Gestational age at birth (days or weeks).

Comparison 1 Combined diet and exercise interventions versus standard care, Outcome 33 Preterm birth.
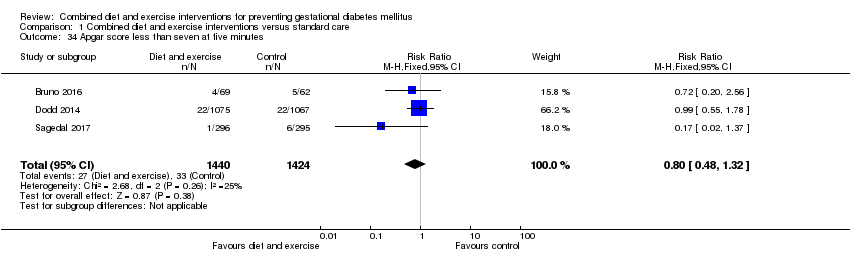
Comparison 1 Combined diet and exercise interventions versus standard care, Outcome 34 Apgar score less than seven at five minutes.

Comparison 1 Combined diet and exercise interventions versus standard care, Outcome 35 Macrosomia.
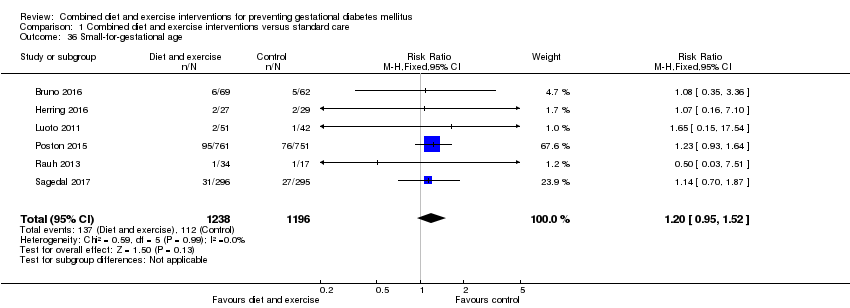
Comparison 1 Combined diet and exercise interventions versus standard care, Outcome 36 Small‐for‐gestational age.

Comparison 1 Combined diet and exercise interventions versus standard care, Outcome 37 Birthweight (g).
| Study | Intervention group | Control group | P value |
| Herring 2016 | Mean (SD not reported) (N = 27) 3147 | Mean (SD not reported) (N = 29) 3361 | Mean difference: ‐213 (95% CI: ‐431 to 3.7) |
| Polley 2002 | Mean (SD not reported) Born to normal weight women (N = 30) 3133.0 Born to overweight women (N = 27) 3282.8 | Mean (SD not reported) Born to normal weight women (N = 31) 3226.4 Born to overweight women (N = 22) 3349.0 | Not reported |
| Vinter 2011 | Median (IQR) (N = 150) 3742 (3464‐4070) | Median (IQR) (N = 154) 3593 (3335‐3930) | 0.039 |
Comparison 1 Combined diet and exercise interventions versus standard care, Outcome 38 Birthweight (g).
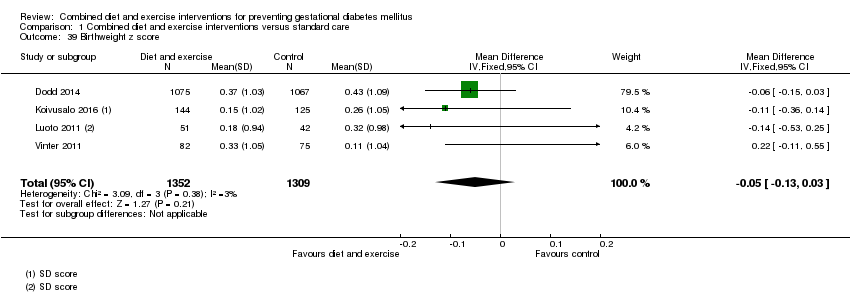
Comparison 1 Combined diet and exercise interventions versus standard care, Outcome 39 Birthweight z score.
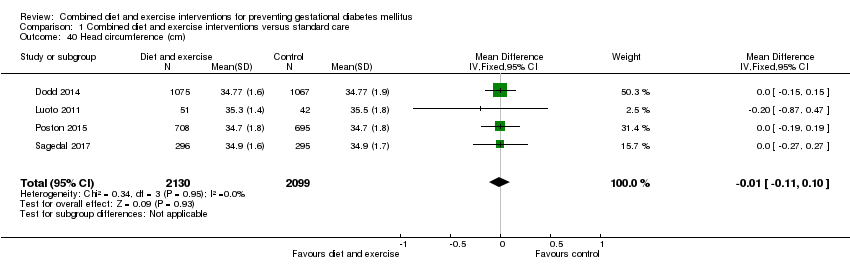
Comparison 1 Combined diet and exercise interventions versus standard care, Outcome 40 Head circumference (cm).

Comparison 1 Combined diet and exercise interventions versus standard care, Outcome 41 Head circumference z score.

Comparison 1 Combined diet and exercise interventions versus standard care, Outcome 42 Length (cm).

Comparison 1 Combined diet and exercise interventions versus standard care, Outcome 43 Length z score.
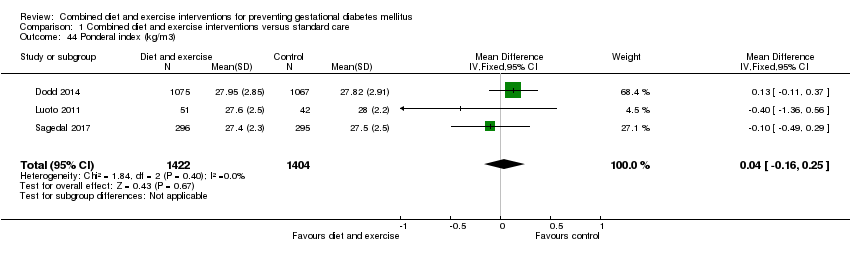
Comparison 1 Combined diet and exercise interventions versus standard care, Outcome 44 Ponderal index (kg/m3).
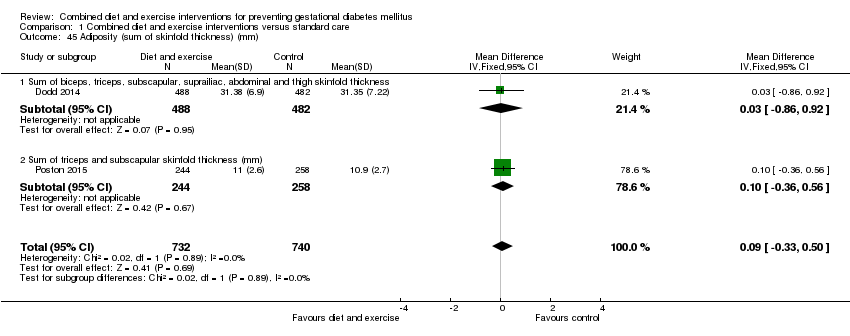
Comparison 1 Combined diet and exercise interventions versus standard care, Outcome 45 Adiposity (sum of skinfold thickness) (mm).

Comparison 1 Combined diet and exercise interventions versus standard care, Outcome 46 Adiposity (abdominal circumference) (cm).
| Study | Intervention | Control | P value |
| Dodd 2014 | Neonatal anthropometric measures Mean (SD) (N = 488) Chest circumference Arm circumference Biceps SFTM (mm): 4.37 (1.12) Triceps SFTM (mm): 5.45 (1.30) Subscapular SFTM (mm): 5.15 (1.30) Suprailiac SFTM (mm): 5.76 (1.83) Abdominal SFTM (mm): 3.85 (1.02) Thigh SFTM (mm): 6.99 (1.85) Abdominal circumference to length ratio: 0.65 (0.04) Fat mass (g): 522.72 (180.70) Fat‐free mass (g): 3026.64 (339.96) Percentage body fat: 14.41 (3.39) Percentage fat‐free mass: 85.59 (3.39) (N = 215) Fat‐free mass R0 (g): 3096.62 (320.97) Percentage fat‐free mass R0: 88.98 (2.98) | Neonatal anthropometric measures Mean (SD) (N = 482) Chest circumference Arm circumference Biceps SFTM (mm): 4.31 (1.13) Triceps SFTM (mm): 5.41 (1.44) Subscapular SFTM (mm): 5.11 (1.21) Suprailiac SFTM (mm): 5.75 (1.92) Abdominal SFTM (mm): 3.82 (1.06) Thigh SFTM (mm): 7.02 (1.90) Abdominal circumference to length ratio: 0.65 (0.04) Fat mass (g): 523.48 (189.05) Fat‐free mass (g): 3030.07 (362.54) Percentage body fat: 14.37 (3.44) Percentage fat‐free mass: 85.63 (3.44) (N = 179) Fat‐free mass R0 (g): 3133.15 (348.92) Percentage fat‐free mass R0: 89.10 (3.40) | "Average body circumferences, SFTM and calculated body fat measures were similar between the treatment groups, with no statistically significant differences identified... There were also no statistically significant differences identified between the two groups, with regard to fat‐free mass (R0) and percentage fat‐free mass (R0) obtained using bio‐impedance analysis" (P value: 0.94; 0.60; 0.45; 0.85; 0.90; 0.97; 0.85; 0.74; 0.90; 0.94; 0.97; 0.91; 0.91; 0.56; 0.79) |
| Poston 2015 | Mean (SD) (N = 249) Triceps SFTM (mm): 5.3 (1.4) (N = 244) Subscapular SFTM (mm): 5.7 (1.4) | Mean (SD) (N = 268) Triceps SFTM (mm): 5.3 (1.6) (N = 258) Subscapular SFTM (mm): 5.6 (1.4) | "Neonatal anthropometric measures were evaluated in a subgroup of infants and did not differ between groups" (P values: 0.72; 0.66) |
Comparison 1 Combined diet and exercise interventions versus standard care, Outcome 47 Adiposity.

Comparison 1 Combined diet and exercise interventions versus standard care, Outcome 48 Shoulder dystocia.

Comparison 1 Combined diet and exercise interventions versus standard care, Outcome 49 Nerve palsy.

Comparison 1 Combined diet and exercise interventions versus standard care, Outcome 50 Bone fracture.
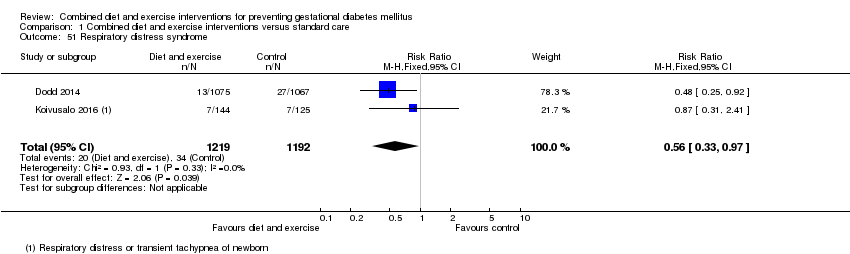
Comparison 1 Combined diet and exercise interventions versus standard care, Outcome 51 Respiratory distress syndrome.

Comparison 1 Combined diet and exercise interventions versus standard care, Outcome 52 Hypoglycaemia.

Comparison 1 Combined diet and exercise interventions versus standard care, Outcome 53 Hyperbilirubinaemia.
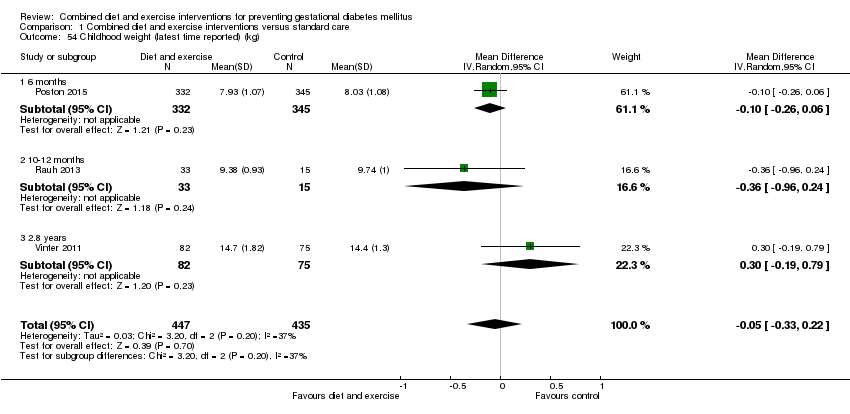
Comparison 1 Combined diet and exercise interventions versus standard care, Outcome 54 Childhood weight (latest time reported) (kg).
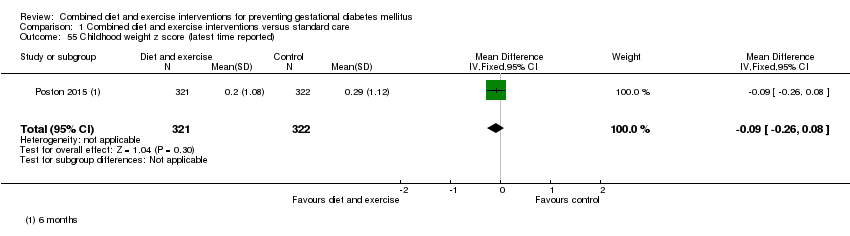
Comparison 1 Combined diet and exercise interventions versus standard care, Outcome 55 Childhood weight z score (latest time reported).
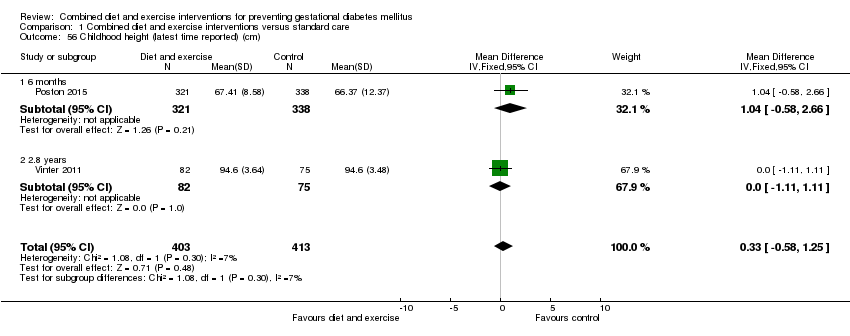
Comparison 1 Combined diet and exercise interventions versus standard care, Outcome 56 Childhood height (latest time reported) (cm).
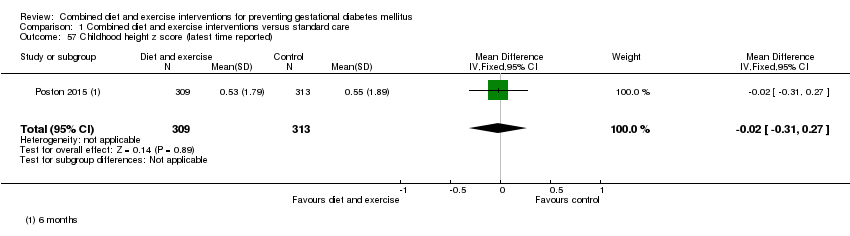
Comparison 1 Combined diet and exercise interventions versus standard care, Outcome 57 Childhood height z score (latest time reported).

Comparison 1 Combined diet and exercise interventions versus standard care, Outcome 58 Childhood head circumference (latest time reported) (cm).

Comparison 1 Combined diet and exercise interventions versus standard care, Outcome 59 Childhood adiposity (latest time reported) (BMI z score).
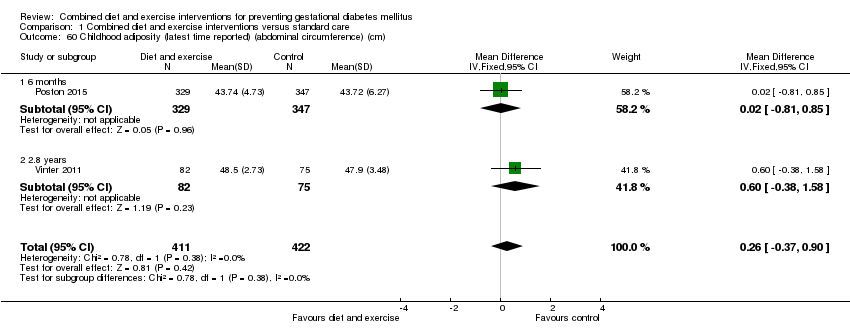
Comparison 1 Combined diet and exercise interventions versus standard care, Outcome 60 Childhood adiposity (latest time reported) (abdominal circumference) (cm).

Comparison 1 Combined diet and exercise interventions versus standard care, Outcome 61 Childhood adiposity (latest time reported) (subscapular skinfold thickness) (mm).

Comparison 1 Combined diet and exercise interventions versus standard care, Outcome 62 Childhood adiposity (latest time reported) (triceps skinfold thickness) (mm).
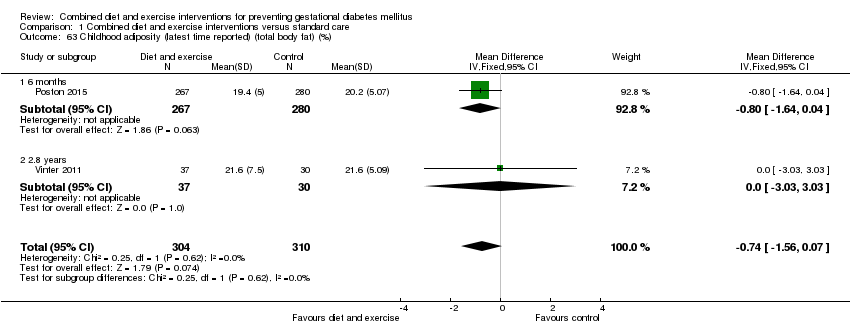
Comparison 1 Combined diet and exercise interventions versus standard care, Outcome 63 Childhood adiposity (latest time reported) (total body fat) (%).
| Study | Intervention | Control | P value |
| Poston 2015 | Anthropometric measures at 6 months Mean (SD) (N = 267) Subscapular SFTM z score: 0.08 (1.37) (N = 296) Triceps SFTM z score: 0.10 (1.56) (N = 267) Sum of SFTM (mm): 17.08 (3.93) (N = 267) Subscapular triceps ratio: 0.83 (0.22) (N = 315) Waist length ratio: 0.64 (0.08) (N = 314) Weight for length z score: ‐0.08 (1.79) (N = 329) Mid upper arm circumference (cm): 15.30 (1.49) | Anthropometric measures at 6 months Mean (SD) (N = 280) Subscapular SFTM z score: 0.36 (1.37) (N = 298) Triceps SFTM z score: 0.24 (1.43) (N = 280) Sum of SFTM (mm): 17.71 (3.97) (N = 280) Subscapular triceps ratio: 0.85 (0.23) (N = 328) Waist length ratio: 0.64 (0.10) (N = 324) Weight for length z score: 0.08 (1.63) (N = 347) Mid upper arm circumference (cm): 15.39 (2.08) | "There was no statistical difference in triceps skinfold thickness... but subscapular skinfold thickness z‐score was... lower in the intervention arm... The infant sum of skinfold thickness... did not reach statistical significance... There were no differences... in other anthropometric measures between the two arms" (P values: 0.021; 0.246; 0.058; 0.423; 0.928; 0.184; 0.511) |
| Vinter 2011 | Anthropometric measures at 2.8 years Mean (95% CI) or N (%) (N = 82) Overweight or obese: 9 (10.9%) BMI (kg/m²): 16.4 (16.1; 16.7) Hip (cm): 50.8 (50.1; 51.5) Abdominal circumference/hip ratio: 0.97 (0.95; 0.97) Dual Energy X‐ray scan results at 2.8 years Mean (95% CI) (N = 37) Total fat (g): 2463 (2147; 2779) Lean body mass (g): 11,336 (10,942; 11,730) | Anthropometric measures at 2.8 years Mean (95% CI) or N (%) (N = 75) Overweight or obese: 5 (6.7%) BMI (kg/m²): 16.1 (15.8; 16.4) Hip (cm): 50.2 (49.4; 51.0) Abdominal circumference/hip ratio: 0.96 (0.95; 0.97) Dual Energy X‐ray scan results at 2.8 years Mean (95% CI) (N = 30) Total fat (g): 2442 (2189; 2696) Lean body mass (g): 11,236 (10,797; 11,675) | "At a significance level of 0.05 (two‐sided), there were no statistically significant differences in any variables between the LiP intervention and control groups." (Individual P values not reported) |
Comparison 1 Combined diet and exercise interventions versus standard care, Outcome 64 Childhood adiposity (latest time reported).
| Study | Intervention | Control | P value |
| Vinter 2011 | Metabolic risk factors at 2.8 years Mean (95% CI) or N (%) (N = 63) Systolic blood pressure (mm Hg): 98.3 (93.7–105.3) Systolic blood pressure ≥ 90th percentile: 16 (25.4) Diastolic blood pressure (mm Hg): 64.3 (61.0–67.3) Diastolic blood pressure ≥ 90th percentile: 16 (25.4) (N = 59) Fasting plasma glucose (mmol/L): 5.2 (4.6 –5.6) Fasting plasma glucose ≥ 5.6 mmol/L: 16 (20.8) (N = 39) Fasting insulin (pmol/L): 16 (8–33) Fasting insulin ≥ 55 pmol/L: 3 (7.7) Fasting HDL (mmol/L): 1.2 (1.1–1.4) Fasting HDL ≥ 1.03 mmol/L: 6 (17.1) Fasting triglycerides (mmol/L): 0.7 (0.6 –1.1) Fasting triglycerides ≥ 1.7 mmol/L: 1 (2.9) Metabolic syndrome (a high abdominal circumference plus 2 or more of the following: low HDL, high triglycerides, high fasting glucose, and high systolic and/or diastolic blood pressure): 0 (0) | Metabolic risk factors at 2.8 years Mean (95% CI) or N (%) (N = 54) Systolic blood pressure (mm Hg): 97.3 (94.3–101.3) Systolic blood pressure ≥ 90th percentile: 12 (22.0) Diastolic blood pressure (mm Hg): 62.0 (60.3– 65.3) Diastolic blood pressure ≥ 90th percentile: 12 (22.0) (N = 59) Fasting plasma glucose (mmol/L): 5.1 (4.7–5.5) Fasting plasma glucose ≥ 5.6 mmol/L: 13 (18.1) (N = 51) Fasting insulin (pmol/L): 12 (8–18) Fasting insulin ≥ 55 pmol/L: 3 (5.9) Fasting HDL (mmol/L): 1.3 (1.1–1.5) Fasting HDL ≥ 1.03 mmol/L: 6 (12.2) Fasting triglycerides (mmol/L): 0.9 (0.6 –1.0) Fasting triglycerides ≥ 1.7 mmol/L: 3 (6.1) Metabolic syndrome (a high abdominal circumference plus 2 or more of the following: low HDL, high triglycerides, high fasting glucose, and high systolic and/or diastolic blood pressure): 0 (0) | "At a significance level of .05 (two‐sided), there were no statistically |
Comparison 1 Combined diet and exercise interventions versus standard care, Outcome 65 Childhood cardiovascular health (latest time reported).

Comparison 1 Combined diet and exercise interventions versus standard care, Outcome 66 Antenatal visits.
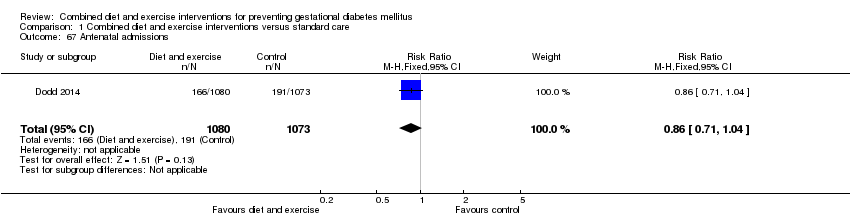
Comparison 1 Combined diet and exercise interventions versus standard care, Outcome 67 Antenatal admissions.
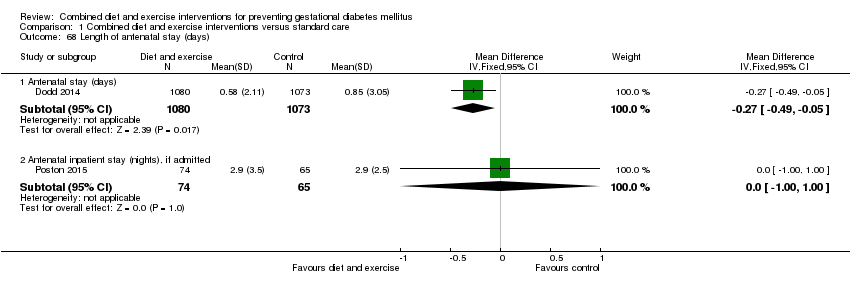
Comparison 1 Combined diet and exercise interventions versus standard care, Outcome 68 Length of antenatal stay (days).

Comparison 1 Combined diet and exercise interventions versus standard care, Outcome 69 Neonatal intensive care unit admission.

Comparison 1 Combined diet and exercise interventions versus standard care, Outcome 70 Length of postnatal stay (mother) (days).

Comparison 1 Combined diet and exercise interventions versus standard care, Outcome 71 Length of postnatal stay (baby) (days).

Comparison 1 Combined diet and exercise interventions versus standard care, Outcome 72 Costs to families associated with the management provided (unit cost, €).
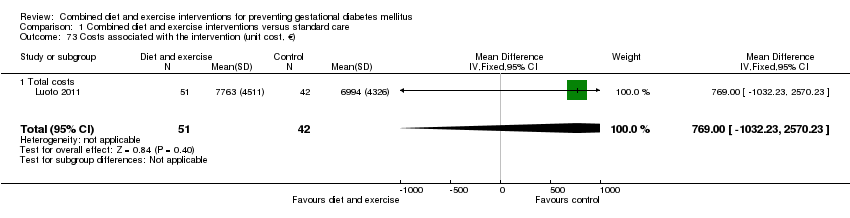
Comparison 1 Combined diet and exercise interventions versus standard care, Outcome 73 Costs associated with the intervention (unit cost, €).

Comparison 1 Combined diet and exercise interventions versus standard care, Outcome 74 Cost of maternal care (unit cost, €).

Comparison 1 Combined diet and exercise interventions versus standard care, Outcome 75 Cost of infant care (unit cost, €).

Comparison 2 Combined diet and exercise interventions versus standard care: subgroups based on study design, Outcome 1 Gestational diabetes.

Comparison 2 Combined diet and exercise interventions versus standard care: subgroups based on study design, Outcome 2 Pre‐eclampsia.

Comparison 2 Combined diet and exercise interventions versus standard care: subgroups based on study design, Outcome 3 Caesarean section.

Comparison 2 Combined diet and exercise interventions versus standard care: subgroups based on study design, Outcome 4 Large‐for‐gestational age.
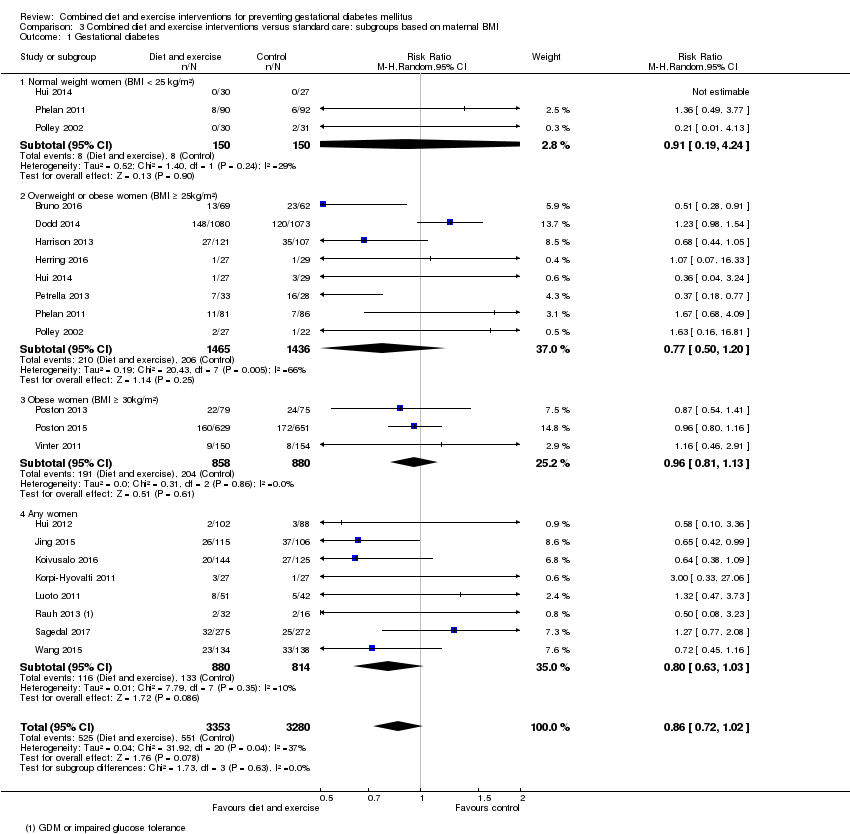
Comparison 3 Combined diet and exercise interventions versus standard care: subgroups based on maternal BMI, Outcome 1 Gestational diabetes.

Comparison 3 Combined diet and exercise interventions versus standard care: subgroups based on maternal BMI, Outcome 2 Pre‐eclampsia.

Comparison 3 Combined diet and exercise interventions versus standard care: subgroups based on maternal BMI, Outcome 3 Pregnancy‐induced hypertension or hypertension.

Comparison 3 Combined diet and exercise interventions versus standard care: subgroups based on maternal BMI, Outcome 4 Caesarean section.

Comparison 3 Combined diet and exercise interventions versus standard care: subgroups based on maternal BMI, Outcome 5 Perinatal mortality.
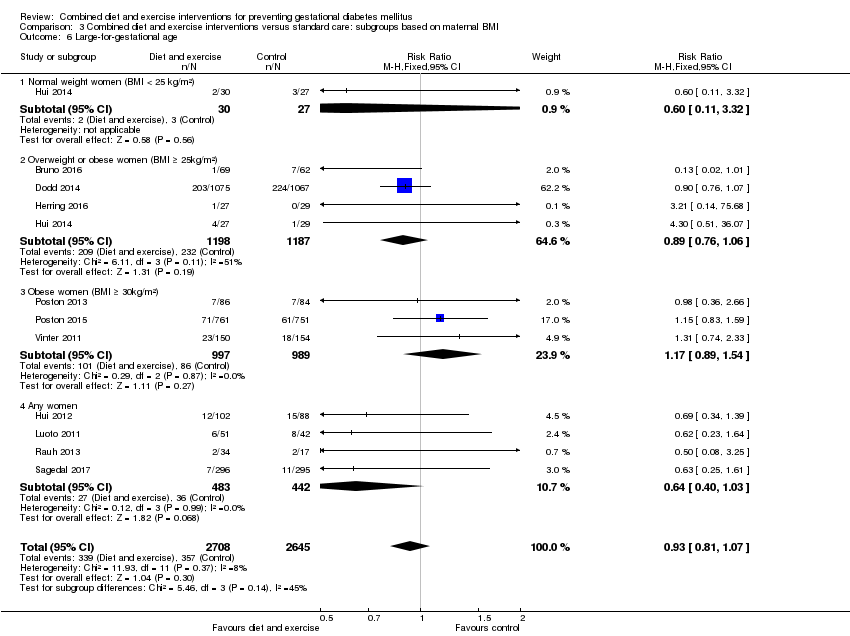
Comparison 3 Combined diet and exercise interventions versus standard care: subgroups based on maternal BMI, Outcome 6 Large‐for‐gestational age.
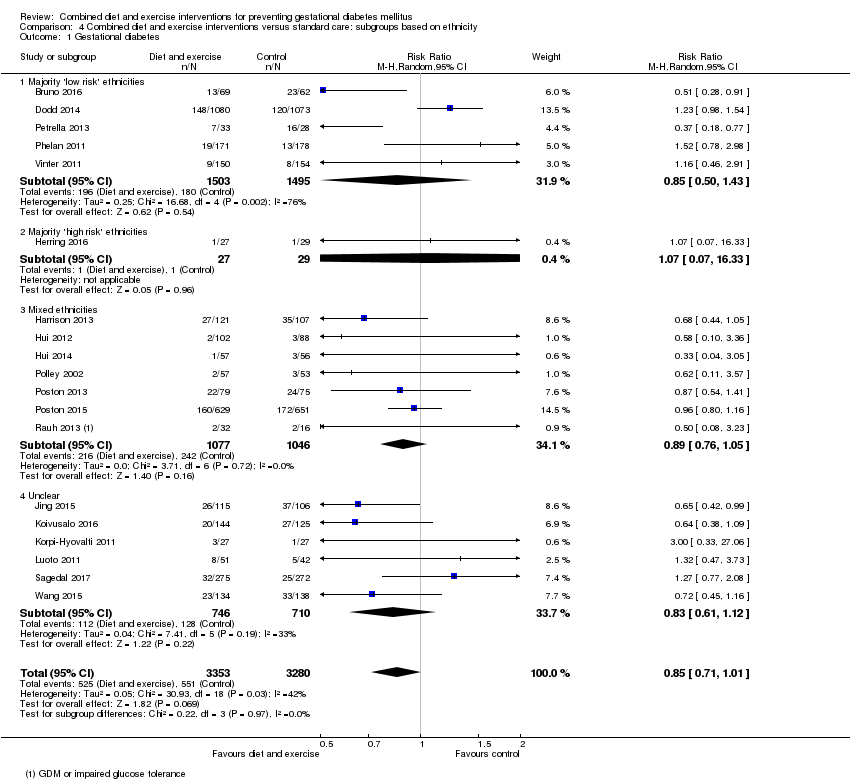
Comparison 4 Combined diet and exercise interventions versus standard care: subgroups based on ethnicity, Outcome 1 Gestational diabetes.

Comparison 4 Combined diet and exercise interventions versus standard care: subgroups based on ethnicity, Outcome 2 Pre‐eclampsia.

Comparison 4 Combined diet and exercise interventions versus standard care: subgroups based on ethnicity, Outcome 3 Pregnancy‐induced hypertension or hypertension.

Comparison 4 Combined diet and exercise interventions versus standard care: subgroups based on ethnicity, Outcome 4 Caesarean section.

Comparison 4 Combined diet and exercise interventions versus standard care: subgroups based on ethnicity, Outcome 5 Perinatal mortality.

Comparison 4 Combined diet and exercise interventions versus standard care: subgroups based on ethnicity, Outcome 6 Large‐for‐gestational age.

Comparison 5 Combined diet and exercise interventions versus standard care: sensitivity analyses, Outcome 1 Gestational diabetes.

Comparison 5 Combined diet and exercise interventions versus standard care: sensitivity analyses, Outcome 2 Pre‐eclampsia.

Comparison 5 Combined diet and exercise interventions versus standard care: sensitivity analyses, Outcome 3 Pregnancy‐induced hypertension.
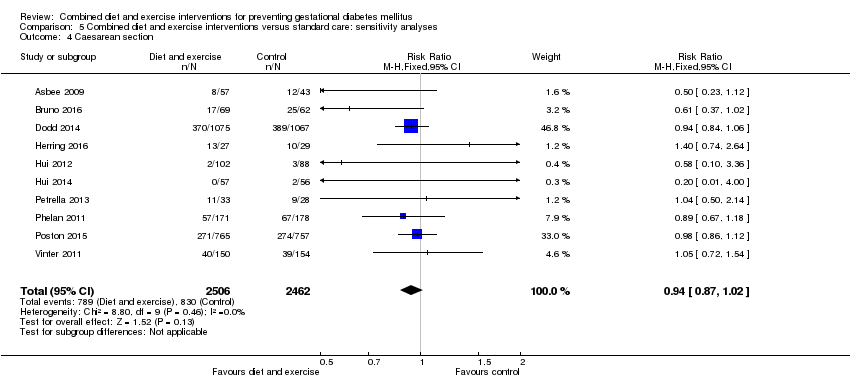
Comparison 5 Combined diet and exercise interventions versus standard care: sensitivity analyses, Outcome 4 Caesarean section.
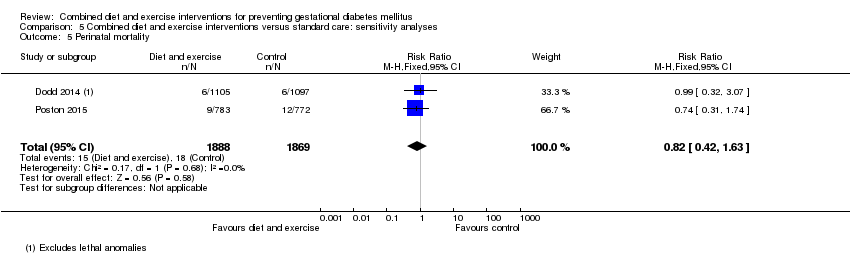
Comparison 5 Combined diet and exercise interventions versus standard care: sensitivity analyses, Outcome 5 Perinatal mortality.
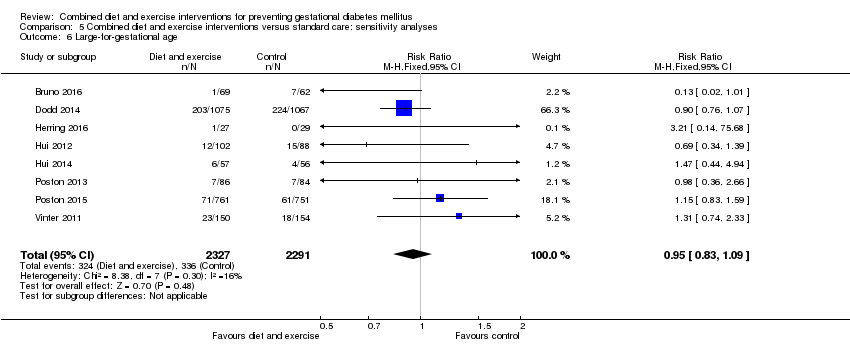
Comparison 5 Combined diet and exercise interventions versus standard care: sensitivity analyses, Outcome 6 Large‐for‐gestational age.
| Combined diet and exercise interventions for preventing GDM | ||||||
| Population: pregnant women, excluding women already diagnosed with GDM, type 1 or type 2 diabetes Setting: Australia (2 RCTs), Brazil (1 RCT), Canada (2 RCTs), China (2 RCTs), Denmark (1 RCT), Egypt (1 RCT), Finland (3 RCTs), Germany (1 RCT), Italy (2 RCTs), Norway (1 RCT), UK (2 RCTs), USA (5 RCTs) | ||||||
| Outcomes | Anticipated absolute effects* (95% CI) | Relative effect | № of participants | Quality of the evidence | Comments | |
| Risk with control | Risk with diet and exercise interventions | |||||
| GDM | Trial population | average RR 0.85 (0.71 to 1.01) | 6633 (19 RCTs) | ⊕⊕⊕⊝ MODERATE1,3 | ||
| 168 per 1000 | 143 per 1000 (119 to 170) | |||||
| Hypertensive disorders of pregnancy (pre‐eclampsia) | Trial population | RR 0.98 (0.79 to 1.22) | 5366 (8 RCTs) | ⊕⊕⊝⊝ LOW2,4 | Eclampsia was not reported by any trials (Sagedal 2017 reports combined severe pre‐eclampsia, HELLP and eclampsia) | |
| 57 per 1000 | 55 per 1000 (45 to 69) | |||||
| Hypertensive disorders of pregnancy (pregnancy‐induced hypertension/hypertension) | Trial population | average RR 0.78 | 3073 | ⊕⊝⊝⊝ VERY LOW2,5,6 | ||
| 103 per 1000 | 80 per 1000 (48 to 130) | |||||
| Caesarean section | Trial population | RR 0.95 (0.88 to 1.02) | 6089 (14 RCTs) | ⊕⊕⊕⊝ MODERATE7 | ||
| 299 per 1000 | 284 per 1000 (263 to 305) | |||||
| Perineal trauma | Trial population | RR 1.27 (0.78 to 2.05) | 2733 (2 RCTs) | ⊕⊕⊕⊝ MODERATE2 | ||
| 21 per 1000 | 27 per 1000 (17 to 44) | |||||
| Gestational weight gain (kg) | Trial population | MD ‐ 0.89 (‐1.39 to ‐ 0.40) | 5052 | ⊕⊕⊕⊝ MODERATE8,9 | ||
| The mean gestational weight gain in the intervention group was 0.89 kg less (1.39 kg less to 0.40 kg less) | ||||||
| Postnatal depression | Not estimable | (0 RCTs) | No data reported for postnatal depression in any of the included RCTs | |||
| Type 2 diabetes mellitus | Not estimable | (0 RCTs) | No data reported for type 2 diabetes mellitus in any of the included RCTs | |||
| *The risk in the intervention group (and its 95% confidence interval) is based on the assumed risk in the comparison group and the relative effect of the intervention (and its 95% CI) | ||||||
| GRADE Working Group grades of evidence | ||||||
| 1Trial limitations (‐1): 19 RCTs, intervention unable to be blinded (not downgraded for this as outcome is objective); some RCTS with potentially serious design limitations (unclear randomisation, attrition bias) | ||||||
| Combined diet and exercise interventions for preventing GDM | ||||||
| Population: pregnant women, excluding women already diagnosed with GDM, type 1 or type 2 diabetes Setting: Australia (2 RCTs), Brazil (1 RCT), Canada (2 RCTs), China (2 RCTs), Denmark (1 RCT), Egypt (1 RCT), Finland (3 RCTs), Germany (1 RCT), Italy (2 RCTs), Norway (1 RCT), UK (2 RCTs), USA (5 RCTs) | ||||||
| Outcomes | Anticipated absolute effects* (95% CI) | Relative effect | № of participants | Quality of the evidence | Comments | |
| Risk with control | Risk with diet and exercise interventions | |||||
| Perinatal mortality | Trial population | RR 0.82 (0.42 to 1.63) | 3757 (2 RCTs) | ⊕⊕⊝⊝ LOW1 | ||
| 10 per 1000 | 8 per 1000 (4 to 16) | |||||
| Large‐for‐gestational age | Trial population | RR 0.93 (0.81 to 1.07) | 5353 (11 RCTs) | ⊕⊕⊝⊝ LOW2,3 | ||
| 135 per 1000 | 126 per 1000 (109 to 144) | |||||
| Mortality or morbidity composite | Not estimable | (0 RCTs) | No data reported for mortality or morbidity composite in any of the included RCTs | |||
| Neonatal hypoglycaemia | Trial population | average RR 1.42 (0.67 to 2.98) | 3653 (2 RCTs) | ⊕⊕⊝⊝ LOW3,4 | ||
| 63 per 1000 | 90 per 1000 (42 to 189) | |||||
| Childhood adiposity (latest time reported) (BMI z score) | Trial population | MD 0.05 (‐0.29 to 0.40) | 794 (2 RCTs) | ⊕⊕⊝⊝ LOW3,5,6 | Additional meta‐analyses presented in review for: abdominal circumference, subscapular skinfold thickness, triceps skinfold thickness and total body fat | |
| The mean BMI z score in the intervention group was 0.05 higher (0.29 lower to 0.40 higher) | ||||||
| Type 2 diabetes mellitus | Not estimable | (0 RCTs) | No data reported for type 2 diabetes mellitus in any of the included RCTs | |||
| Neurosensory disability | Not estimable | (0 RCTs) | No data reported for neurosensory disability in any of the included RCTs | |||
| *The risk in the intervention group (and its 95% confidence interval) is based on the assumed risk in the comparison group and the relative effect of the intervention (and its 95% CI). | ||||||
| GRADE Working Group grades of evidence | ||||||
| 1Imprecision (‐2): confidence interval crossing the line of no effect and few events | ||||||
| Study ID | Diet and exercise intervention | Control |
| Mean (SD): 26.7 (6.0) | Mean (SD): 26.4 (5.0) | |
| Mean (SD): 31.5 (5) | Mean (SD): 30.8 (5.5) | |
| Mean (SD): 29.3 (5.4) | Mean (SD): 29.6 (5.6) | |
| Not reported | Not reported | |
| Mean (SD): 32.4 (4.6) | Mean (SD): 31.7 (4.5) | |
| N (%) | N (%) | |
| Mean (SD): 25.9 (4.9) | Mean (SD): 25.0 (5.7) | |
| Not reported | Not reported | |
| Mean (SD): 30.1 (5.2) | Mean (SD): 28.7 (5.9) | |
| Mean (SD) BMI ≤ 24.9 kg/m²: 31 (3) BMI ≥ 25 kg/m²: 31 (4) | Mean (SD) BMI ≤ 24.9 kg/m²: 29 (6) BMI ≥ 25 kg/m²: 32 (5) | |
| Mean (SD): 29.57 (4.13) | Mean (SD): 29.89 (3.86) | |
| Mean (SD): 32.3 (4.9) | Mean (SD): 32.6 (4.5) | |
| Mean (SD): 29.1 (5.4) | Mean (SD): 29.8 (5.4) | |
| Mean (SD): 29.5 (4.8) | Mean (SD): 30.0 (4.7) | |
| Mean (SD): 31.5 (4.2) | Mean (SD): 32.4 (5.9) | |
| Mean (SD): 28.6 (5.2) | Mean (SD): 28.8 (5.2) | |
| Mean (SD): 25.5 (4.8) | ||
| Mean (SD): 30.4 (5.7) | Mean (SD): 30.7 (4.9) | |
| Mean (SD): 30.5 (5.5) | Mean (SD): 30.4 (5.6) | |
| Mean (SD): 32.2 (4.4) | Mean (SD): 30.8 (4.9) | |
| Mean (SD): 27.9 (4.2) | Mean (SD): 28.1 (4.5) | |
| Median (IQR): 29 (27 ‐ 32) | Median (IQR): 29 (26 ‐ 31) | |
| Mean (SD): 31.0 (3.8) | Mean (SD): 30.27 (3.64) | |
| Abbreviations: BMI: body mass index; IQR: interquartile range; N: number; SD: standard deviation | ||
| Study ID | Diet and exercise intervention | Control |
| Mean (SD): 25.5 (6.0) [pre‐pregnancy] | Mean (SD): 25.6 (5.1) [pre‐pregnancy] | |
| Mean (SD): 33.3 (6) [pre‐pregnancy] Mean (SD): 34.5 (6.8) [baseline] | Mean (SD): 33.4 (5.5) [pre‐pregnancy] Mean (SD): 33.9 (5.7) [baseline] | |
| Median (IQR): 31.0 (28.1‐35.9) [baseline] | Median (IQR): 31.1 (27.7‐35.6) [baseline] | |
| Not reported (all women were obese) | Not reported (all women were obese) | |
| Mean (SD): 30.4 (5.6) [baseline] | Mean (SD): 30.3 (5.9) [baseline] | |
| N (%) [pre‐pregnancy] | N (%) [pre‐pregnancy] | |
| Mean (SD): 33.5 (5.8) [early pregnancy] | Mean (SD): 32.2 (5.4) [early pregnancy] | |
| Not reported | Not reported | |
| Mean (SD): 25.7 (5.1) [pre‐pregnancy] | Mean (SD): 24.9 (5.4) [pre‐pregnancy] | |
| Mean (SD) [pre‐pregnancy] BMI ≤ 24.9 kg/m²: 21.6 (2.2) BMI ≥ 25 kg/m²: 29.5 (5.1) | Mean (SD) [pre‐pregnancy] BMI ≤ 24.9 kg/m²: 22.6 (1.9) BMI ≥ 25 kg/m²: 29.7 (1.3) | |
| Mean (SD): 20.44 (2.54) [pre‐pregnancy] | Mean (SD): 20.44 (2.54); 20.74 (2.43) [pre‐pregnancy] | |
| Mean (SD): 31.5 (6.0) [pre‐pregnancy] Mean (SD): 32.2 (5.9) [baseline] | Mean (SD): 32.0 (5.5) [pre‐pregnancy] Mean (SD): 32.3 (5.4) [baseline] | |
| Mean (SD): 27.3 (6.0) [baseline] | Mean (SD): 25.5 (3.4) [baseline] | |
| Mean (SD): 26.3 (4.9) [pre‐pregnancy] | Mean (SD): 26.4 (4.3) [pre‐pregnancy] | |
| Mean (SD): 32.1 (5) [baseline] | Mean (SD): 32.9 (6.2) [baseline] | |
| Mean (SD): 26.32 (5.6) [baseline] | Mean (SD): 26.48 (5.9) [baseline] | |
| Mean (SD) [pre‐pregnancy] Normal weight: 22.8 (1.9) Overweight: 31.4 (6.0) | Mean (SD) [pre‐pregnancy] Normal weight: 22.5 (2.0) Overweight: 34.1 (7.2) | |
| Mean (SD): 36.5 (4.7) [baseline] | Mean (SD): 36.1 (4.8) [baseline] | |
| Mean (SD): 36.3 (5.0) [baseline] | Mean (SD): 36.3 (4.6) [baseline] | |
| Median (IQR): 21.7 (19.9 ‐ 23.7) [pre‐pregnancy] Median (IQR): 22.2 (20.7 ‐ 24.3) [booking] | Median (IQR): 22.8 (20.6 ‐ 26.6) [pre‐pregnancy] Median (IQR): 23.3 (21.2 ‐ 26.8) [booking] | |
| Mean (SD): 23.8 (4.1) [pre‐pregnancy] | Mean (SD): 23.5 (3.7) [pre‐pregnancy] | |
| Median (IQR): 33.4 (31.7 ‐ 36.5) | Median (IQR): 33.3 (31.7 ‐ 36.9) | |
| Mean (SD): 22.95 (3.65) [pre‐pregnancy] | Mean (SD): 23.06 (3.63) [pre‐pregnancy] | |
| Abbreviations: BMI: body mass index; IQR: interquartile range; N: number; SD: standard deviation | ||
| Study ID | Diet and exercise intervention | Control |
| N (%) | N (%) | |
| N (%) Caucasian: 79 (82.3) | N (%) Caucasian: 78 (82.1) | |
| N (%) | N (%) White: 998 (91.0) | |
| Not reported (conducted in Egypt) | Not reported (conducted in Egypt) | |
| Country of birth, N (%) | Country of birth, N (%) | |
| N (%) Hispanic: 33 (100) | N (%) Hispanic: 35 (100) | |
| N (%) African American: 33 (100) | N (%) African American: 33 (100) | |
| Not reported | Not reported | |
| N (%) | N (%) | |
| First Nations (Canadian Aboriginals with First Nations status), N (%) BMI ≤ 24.9 kg/m²: 2 (6.7) BMI ≥ 25 kg/m²: 3 (11.1) | First Nations (Canadian Aboriginals with First Nations status), N (%) BMI ≤ 24.9 kg/m²: 1 (3.7) BMI ≥ 25 kg/m²: 4 (13.8) | |
| Not reported (conducted in China) | Not reported (conducted in China) | |
| Not reported (conducted in Finland) | Not reported (conducted in Finland) | |
| Not reported (conducted in Norway) | Not reported (conducted in Norway) | |
| Not reported (conducted in Finland) | Not reported (conducted in Finland) | |
| N (%) Caucasian: 28 (84.9) Maghreb: 4 (12.1) Other: 1 (3.0) | Caucasian: 20 (66.7) Maghreb: 6 (20) Other: 4 (13.3) | |
| N (%) Non‐Hispanic White: 138 (68.7) Latina and Hispanic: 39 (19.6) Non‐Hispanic African American: 14 (7.1) Other: 9 (4.6) | N (%) Latina and Hispanic: 39 (19.6) Non‐Hispanic African American: 19 (9.6) Other: 7 (3.3) | |
| N (%) Black: 47 (39) White 73 (61) | ||
| N (%) White: 52 (55) Black: 38 (40) Asian: 2 (2) Other: 2 (2) | N (%) White: 51 (57) Black: 32 (26) Asian: 1 (1) Other: 5 (6) | |
| N (%) White: 490 (63) Black: 202 (26) Asian: 47 (6) Other: 44 (6) | N (%) Black: 200 (26) Asian: 48 (6) Other: 41 (5) | |
| Country of birth, N (%) Germany: 140 (83.8) Others: 27 (16.2) | Country of birth, N (%) Germany: 68 (81.9) Others: 15 (18.1) | |
| Not reported (conducted in Norway) | Not reported (conducted in Norway) | |
| N (%) | N (%) Caucasian: 154 (100) | |
| Not reported (conducted in China) | Not reported (conducted in China) | |
| Abbreviations: N: number | ||
| Study ID | Diet and exercise intervention | Control |
| N (%) | N (%) | |
| N (%) 0: 53 (55.2) | N (%) 0: 59 (62.1) | |
| N (%) 0: 441 (40.2) | N (%) 0: 441 (40.2) | |
| Not reported | Not reported | |
| N (%) | N (%) | |
| N (%) | N (%) | |
| N (%): 0: 9 (27) | N (%): 0: 10 (30) | |
| Not reported | Not reported | |
| Not reported | Not reported | |
| Not reported | Not reported | |
| Not reported | Not reported | |
| Previous deliveries, N (%) | Previous deliveries, N (%) | |
| N (%) 0: 13 (50) | N (%) 0: 17 (63) | |
| N (%) 0: 103 (47.0) | N (%) 0: 73 (40.6) | |
| N (%) 0: 13 (39.4) | N (%) 0: 13 (43.3) | |
| N (%) 0: 153 (76.3) ≥ 1: 48 (23.7) | N (%) 0: 153 (76.6) ≥ 1: 47 (23.4) | |
| N (%) First pregnancy: 56 (47) Second pregnancy: 36 (30) Third pregnancy: 20 (17) > third pregnancy: 7 (6) | ||
| N (%) 0: 42 (45) 1: 29 (31) ≥ 2: 23 (24) | N (%) 0: 38 (43) 1: 36 (40) ≥ 2: 15 (17) | |
| N (%) 0: 336 (43) ≥ 1: 447 (57) | N (%) 0: 338 (44) ≥ 1: 434 (56) | |
| N (%) 0: 110 (65.9) 1: 50 (29.9) ≥ 2: 7 (4.2) | N (%) 0: 53 (63.9) 1: 23 (27.7) ≥ 2: 7 (8.4) | |
| N (%) 0: 303 (100) | N (%) 0: 303 (100) | |
| N (%) 0: 79 (52.7) | N (%) 0: 84 (54.6) | |
| Not reported | Not reported | |
| Abbreviations: N: number | ||
| Study ID | Timing | Screening/diagnosis test(s) and glucose threshold(s) used for diagnosis | Reference(s) | Notes |
| Not reported | Not reported | Not provided | Data not provided in format suitable for meta‐analysis | |
| 16th to 18th weeks; repeated in 24th to 28th weeks for women negative at first test | 75 g 2‐hour OGTT Thresholds: fasting ≥ 5.1 mmol/L and/or 1‐hour ≥ 10.0 mmol/L and/or 2‐hour ≥ 8.5 mmol/L | "IADPSG criteria" (no reference provided) | ||
| Not reported | "all women were encouraged to undergo screening" 75 g 2‐hour OGTT Thresholds: fasting ≥ 5.5 mmol/L or 2‐hour ≥ 7.8 mmol/L | South Australian Perinatal Practice Guidelines 2013 (South Australian Perinatal Practice Guidelines: diabetes mellitus and abnormal glucose tolerance Government of Australia, SA Health, 2013. www.health.sa.gov.au/ppg/Default. | ||
| 24 to 28 weeks | "All women underwent routine GDM screening" | Not provided | Data not provided in format suitable for meta‐analysis | |
| 28 weeks | 2‐hour OGTT Thresholds: fasting ≥ 5.5 mmol/L and/or 2‐hour ≥ 8.0 mmol/L OR Thresholds: fasting ≥ 5.1 mmol/L and/or 1‐hour ≥ 10.0 mmol/L and/or 2‐hour ≥ 8.5 mmol/L | ADIPS 1998 (Hoffmann L, Nolan C, Wilson JD, Oats JJN, Simmons D. Gestational diabetes mellitus: management guidelines. MJA 1998;169:93–7.) OR IADPSG 2010 (Metzger BE, Gabbe SG, Persson B, et al. International association of diabetes and pregnancy study groups recommendations on the diagnosis and classification of hyperglycaemia in pregnancy. Diabetes Care 2010;33:676–82.) | Data in meta‐analysis according to IADPSG 2010 criteria [groups Ns not reported for ADIPS 1998 criteria] | |
| 24 to 28 weeks gestation | 50 g 1‐hour OGTT Thresholds: 1‐hour > 7.493 mmol/L 100 g 3‐hour OGTT Thresholds: not reported | American Diabetes Association 2012 (American Diabetes Association. Standards of medical care in diabetes–2012. Diabetes Care 2012; 35(Suppl. 1): S11–63.) | Data not provided in format suitable for meta‐analysis | |
| Not reported | Not reported | Not provided | ||
| Not reported | Not reported | Not provided | Data not provided in format suitable for meta‐analysis | |
| Not reported | Not reported | Canadian Diabetes Association 2008 (Canadian Diabetes Association. 2008 Clinical practice guidelines for the prevention and management of diabetes in Canada. Can J Diabetes 2008;32:S168–80.) | ||
| Not reported | Not reported | Canadian Diabetes Association 2008 (Canadian Diabetes Association, Clinical Practice Guidelines Committee, Canadian Diabetes Association: 2008 Clinical Practice Guidelines for the Prevention and Management of Diabetes in Canada. Can J Diabetes Care 2008, 32:S1:171.) | ||
| Not reported | Not reported | Not provided | ||
| 24 to 28 weeks | 75 g 2‐hour OGTT Thresholds: fasting ≥ 5.3 mmol/L and/or 1‐hour ≥ 10.0 mmol/L and/or 2‐hour ≥ 8.6 mmol/L | American Diabetes Association 2008 (Holcomb SS; American Diabetes Association. Update: standards of medical care in diabetes. Nurse Pract 2008;33:12–5.) | ||
| 26 to 28 weeks | 75 g 2‐hour OGTT Thresholds: fasting ≥ 5.6 mmol/L or 2‐hour ≥ 7.8 mmol/L | Modified from the World Health Organization 1998 (Alberti KG, Zimmet PZ: Definition, diagnosis and classification of diabetes mellitus and its complications. Part 1: diagnosis and classification of diabetes mellitus: provisional report of WHO consultation. Diabet Med 1998, 15:539‐53.) | All women also underwent 75 g 2 hour OGTT at 8 to 12 weeks; those diagnosed with GDM were excluded from the trial | |
| 26 to 28 weeks | 2‐hour OGTT Thresholds: fasting ≥ 5.3 mmol/L and/or 1‐hour > 10.0 mmol/L and/or 2‐hour > 8.6 mmol/L OR 1) Any of the above thresholds or newborn birthweight ≥ 4500 g or use of insulin or other diabetic medication 2) Any of the above thresholds or newborn birthweight ≥ 4000 g or use of insulin or other diabetic medication 3) Any of the above thresholds or use of insulin or other diabetic medication | American Diabetes Association 2010 ((2010) Diagnosis and classification of diabetes mellitus. Diabetes Care 33: S62–9.) | Data in meta‐analysis according to American Diabetes Association 2010 criteria [use of data according to other criteria did not change results] | |
| 16th to 18th week or 24th to 28th week "as recommend" | 75 g 2‐hour OGTT Thresholds: not reported | American Diabetes Association 2011 (American Diabetes Association. Standards of medical care in diabetes‐2011. Diabetes Care 2011;34:S11–61.) | ||
| Not reported | Not reported | Not provided | ||
| Not reported | Not reported | Not provided | ||
| 27 + 0 to 28 + 6 weeks | 75 g 2‐hour OGTT Thresholds: fasting ≥ 5.1 mmol/L and/or 1‐hour ≥ 10.0 mmol/L and/or 2‐hour ≥ 8.5 mmol/L | IADPSG 2010 (Metzger B, Gabbe SG, Persson B, Buchanan TA, Catalano PA, Damm P, Dyer AR, Leiva A, Hod M, Kitzmiler JL, Lowe LP, McIntyre HD, Oats JJ, Omori Y, Schmidt MI: International association of diabetes and pregnancy study groups recommendations on the diagnosis and classification of hyperglycaemia in pregnancy. Diabetes Care 2010, 33:676–82.) | ||
| 27 + 0 to 28 + 6 weeks | 75 g 2‐hour OGTT Thresholds: fasting ≥ 5.1 mmol/L and/or 1‐hour ≥ 10.0 mmol/L and/or 2‐hour ≥ 8.5 mmol/L | IADPSG 2010 (Metzger BE, Gabbe SG, Persson B, et al. International Association of Diabetes and Pregnancy Study Groups recommendations on the diagnosis and classification of hyperglycaemia in pregnancy. Diabetes Care 2010; 33: 676–82.) | ||
| 24th to 28th week | 2‐hour OGTT Thresholds: not reported | German Society of Gynecology and Obstetrics 2010 (Deutsche Gesellschaft für Gynäkologie und Geburtshilfe e.V.: Diagnostik und Therapie des Gestationsdiabetes. [http://www.dggg.de/leitlinien/].) | ||
| 30 weeks | 75 g 2‐hour OGTT Thresholds: 2‐hour ≥ 7.8 mmol/L | Norway national criteria 2008 (Tore HH, Torun C. Veileder i Fødselshjelp 2008 In) NGFNSfGaO, editor. Veileder i Fødselshjelp 2008; 2008. p. 112.); World Health Organization 2006 (World Health Organization. Definition and Diagnosis of Diabetes Mellitus and Intermediate Hyperglycaemia: Report of a WHO/IDF Consultation. Geneva, Switzerland: World Health Organization, 2006.) | ||
| 28 to 30 weeks and 34 to 36 weeks | 75 g 2‐hour OGTT Thresholds: 2‐hour ≥ 9 mmol/L OR Thresholds: 2‐hour ≥ 8.5 mmol/L | "Danish national recommendations" (no reference provided) OR IADPSG 2010 (Metzger BE, Gabbe SG, Persson B, Buchanan TA, Catalano PA, Damm P et al. International Association of Diabetes and Pregnancy Study Group’s recommendations on the diagnosis and classification of hyperglycaemia in pregnancy. Diabetes Care 2010; 33: 676–82.) | All women also underwent an OGTT at baseline (12 to 15 weeks); those diagnosed with GDM were excluded from the trial Data in meta‐analysis according to Danish national recommendations [use of data according to IADPSG 2010 criteria did not change results] | |
| 24 to 28 weeks | 75 g OGTT | "The International Association of Diabetes and Pregnancy Study Groups (IADPSG) criterion was used" (no reference provided) | ||
| Abbreviations: ADIPS: Australasian Diabetes in Pregnancy Society; g: gram; GDM: gestational diabetes mellitus; IADPSG: International Association of the Diabetes and Pregnancy Study Group; OGTT: oral glucose tolerance test; | ||||
| Outcome or subgroup title | No. of studies | No. of participants | Statistical method | Effect size |
| 1 Gestational diabetes Show forest plot | 19 | 6633 | Risk Ratio (M‐H, Random, 95% CI) | 0.85 [0.71, 1.01] |
| 2 Pre‐eclampsia Show forest plot | 8 | Risk Ratio (M‐H, Fixed, 95% CI) | Subtotals only | |
| 2.1 Pre‐eclampsia | 8 | 5366 | Risk Ratio (M‐H, Fixed, 95% CI) | 0.98 [0.79, 1.22] |
| 2.2 Severe pre‐eclampsia/HELLP/eclampsia | 2 | 2088 | Risk Ratio (M‐H, Fixed, 95% CI) | 0.72 [0.35, 1.46] |
| 3 Pregnancy‐induced hypertension and/or hypertension Show forest plot | 6 | Risk Ratio (M‐H, Random, 95% CI) | Subtotals only | |
| 3.1 Pregnancy‐induced hypertension and/or hypertension | 6 | 3073 | Risk Ratio (M‐H, Random, 95% CI) | 0.78 [0.47, 1.27] |
| 3.2 Pregnancy‐induced hypertension | 4 | 810 | Risk Ratio (M‐H, Random, 95% CI) | 0.46 [0.16, 1.29] |
| 3.3 Hypertension | 3 | 2532 | Risk Ratio (M‐H, Random, 95% CI) | 1.07 [0.84, 1.38] |
| 4 Caesarean section Show forest plot | 14 | 6089 | Risk Ratio (M‐H, Fixed, 95% CI) | 0.95 [0.88, 1.02] |
| 5 Perinatal mortality Show forest plot | 2 | 3757 | Risk Ratio (M‐H, Fixed, 95% CI) | 0.82 [0.42, 1.63] |
| 6 Large‐for‐gestational age Show forest plot | 11 | 5353 | Risk Ratio (M‐H, Fixed, 95% CI) | 0.93 [0.81, 1.07] |
| 7 Operative vaginal birth Show forest plot | 3 | 2164 | Risk Ratio (M‐H, Fixed, 95% CI) | 1.07 [0.86, 1.34] |
| 8 Induction of labour Show forest plot | 5 | 3907 | Risk Ratio (M‐H, Random, 95% CI) | 0.92 [0.79, 1.06] |
| 9 Perineal trauma Show forest plot | 2 | 2733 | Risk Ratio (M‐H, Fixed, 95% CI) | 1.27 [0.78, 2.05] |
| 10 Placental abruption Show forest plot | 1 | 1555 | Risk Ratio (M‐H, Fixed, 95% CI) | 2.96 [0.12, 72.50] |
| 11 Postpartum haemorrhage Show forest plot | 3 | 4235 | Risk Ratio (M‐H, Fixed, 95% CI) | 1.03 [0.89, 1.18] |
| 12 Postpartum infection Show forest plot | 2 | Risk Ratio (M‐H, Fixed, 95% CI) | Subtotals only | |
| 12.1 Endometritis | 1 | 2142 | Risk Ratio (M‐H, Fixed, 95% CI) | 1.19 [0.52, 2.74] |
| 12.2 Wound infection | 1 | 2142 | Risk Ratio (M‐H, Fixed, 95% CI) | 1.06 [0.65, 1.73] |
| 12.3 Postpartum antibiotics | 1 | 2142 | Risk Ratio (M‐H, Fixed, 95% CI) | 1.00 [0.77, 1.31] |
| 12.4 Postpartum sepsis | 1 | 1555 | Risk Ratio (M‐H, Fixed, 95% CI) | 0.33 [0.01, 8.06] |
| 13 Gestational weight gain (kg) Show forest plot | 16 | 5052 | Mean Difference (IV, Random, 95% CI) | ‐0.89 [‐1.39, ‐0.40] |
| 14 Gestational weight gain (various times reported) (kg) Show forest plot | 4 | Mean Difference (IV, Fixed, 95% CI) | Subtotals only | |
| 14.1 First trimester | 1 | 272 | Mean Difference (IV, Fixed, 95% CI) | ‐0.03 [‐0.62, 0.56] |
| 14.2 Second trimester | 2 | 541 | Mean Difference (IV, Fixed, 95% CI) | ‐0.38 [‐0.77, 0.02] |
| 14.3 Third trimester | 1 | 269 | Mean Difference (IV, Fixed, 95% CI) | ‐0.10 [‐1.17, 0.97] |
| 14.4 At 20‐24 weeks gestation | 1 | 221 | Mean Difference (IV, Fixed, 95% CI) | ‐0.45 [‐1.48, 0.58] |
| 14.5 At 26‐28 weeks gestation | 1 | 203 | Mean Difference (IV, Fixed, 95% CI) | ‐0.90 [‐1.75, ‐0.05] |
| 15 Gestational weight gain (kg/week) Show forest plot | 4 | 2772 | Mean Difference (IV, Random, 95% CI) | ‐0.03 [‐0.06, ‐0.00] |
| 16 Gestational weight gain (above IOM recommendations) Show forest plot | 11 | 4556 | Risk Ratio (M‐H, Random, 95% CI) | 0.87 [0.79, 0.96] |
| 17 Gestational weight gain (within IOM recommendations) Show forest plot | 9 | 3730 | Risk Ratio (M‐H, Fixed, 95% CI) | 1.02 [0.93, 1.11] |
| 18 Gestational weight gain (below IOM recommendations) Show forest plot | 7 | 3499 | Risk Ratio (M‐H, Fixed, 95% CI) | 1.10 [0.98, 1.24] |
| 19 Behaviour changes associated with the intervention Show forest plot | Other data | No numeric data | ||
| 20 Relevant biomarker changes associated with the intervention Show forest plot | Other data | No numeric data | ||
| 21 Sense of well‐being and quality of life Show forest plot | Other data | No numeric data | ||
| 22 Breastfeeding (exclusive) Show forest plot | 3 | Risk Ratio (M‐H, Fixed, 95% CI) | Subtotals only | |
| 22.1 3 days postpartum | 1 | 695 | Risk Ratio (M‐H, Fixed, 95% CI) | 1.02 [0.91, 1.15] |
| 22.2 6 weeks postpartum | 1 | 202 | Risk Ratio (M‐H, Fixed, 95% CI) | 0.93 [0.76, 1.13] |
| 22.3 6 months postpartum | 2 | 921 | Risk Ratio (M‐H, Fixed, 95% CI) | 0.91 [0.61, 1.36] |
| 23 Breastfeeding (partial) Show forest plot | 3 | Risk Ratio (M‐H, Fixed, 95% CI) | Subtotals only | |
| 23.1 3 days postpartum | 1 | 695 | Risk Ratio (M‐H, Fixed, 95% CI) | 0.51 [0.40, 0.66] |
| 23.2 6 weeks postpartum | 1 | 202 | Risk Ratio (M‐H, Fixed, 95% CI) | 1.44 [0.80, 2.60] |
| 23.3 6 months postpartum | 2 | 921 | Risk Ratio (M‐H, Fixed, 95% CI) | 0.98 [0.82, 1.18] |
| 24 Breastfeeding Show forest plot | Other data | No numeric data | ||
| 25 Postnatal weight retention (latest time reported) (kg) Show forest plot | 6 | 1673 | Mean Difference (IV, Fixed, 95% CI) | ‐0.94 [‐1.52, ‐0.37] |
| 26 Return to pre‐pregnancy weight (latest time reported) Show forest plot | 3 | 960 | Risk Ratio (M‐H, Fixed, 95% CI) | 1.25 [1.08, 1.45] |
| 27 Postnatal BMI (latest time reported) Show forest plot | 2 | Mean Difference (IV, Fixed, 95% CI) | Subtotals only | |
| 27.1 BMI | 2 | 902 | Mean Difference (IV, Fixed, 95% CI) | ‐0.15 [‐0.85, 0.55] |
| 27.2 BMI change from baseline to 6 weeks postpartum | 1 | 202 | Mean Difference (IV, Fixed, 95% CI) | ‐0.56 [‐1.12, ‐0.00] |
| 28 Maternal cardiovascular health (latest time reported) Show forest plot | Other data | No numeric data | ||
| 29 Stillbirth Show forest plot | 5 | 4783 | Risk Ratio (M‐H, Fixed, 95% CI) | 0.69 [0.35, 1.36] |
| 30 Neonatal mortality Show forest plot | 2 | Risk Ratio (M‐H, Fixed, 95% CI) | Subtotals only | |
| 30.1 Total | 2 | 3756 | Risk Ratio (M‐H, Fixed, 95% CI) | 2.31 [0.60, 8.90] |
| 30.2 No lethal anomalies | 1 | 2202 | Risk Ratio (M‐H, Fixed, 95% CI) | 0.99 [0.06, 15.85] |
| 30.3 Lethal anomalies | 1 | 2202 | Risk Ratio (M‐H, Fixed, 95% CI) | 6.95 [0.36, 134.38] |
| 31 Gestational age at birth (weeks) Show forest plot | 11 | 5658 | Mean Difference (IV, Fixed, 95% CI) | 0.05 [‐0.05, 0.15] |
| 32 Gestational age at birth (days or weeks) Show forest plot | Other data | No numeric data | ||
| 33 Preterm birth Show forest plot | 11 | 5398 | Risk Ratio (M‐H, Fixed, 95% CI) | 0.80 [0.65, 0.98] |
| 34 Apgar score less than seven at five minutes Show forest plot | 3 | 2864 | Risk Ratio (M‐H, Fixed, 95% CI) | 0.80 [0.48, 1.32] |
| 35 Macrosomia Show forest plot | 10 | Risk Ratio (M‐H, Fixed, 95% CI) | Subtotals only | |
| 35.1 > 4000 g | 9 | 5368 | Risk Ratio (M‐H, Fixed, 95% CI) | 0.89 [0.78, 1.01] |
| 35.2 > 4500 g | 4 | 3061 | Risk Ratio (M‐H, Fixed, 95% CI) | 0.63 [0.42, 0.94] |
| 36 Small‐for‐gestational age Show forest plot | 6 | 2434 | Risk Ratio (M‐H, Fixed, 95% CI) | 1.20 [0.95, 1.52] |
| 37 Birthweight (g) Show forest plot | 13 | 5763 | Mean Difference (IV, Fixed, 95% CI) | ‐17.67 [‐46.28, 10.94] |
| 38 Birthweight (g) Show forest plot | Other data | No numeric data | ||
| 39 Birthweight z score Show forest plot | 4 | 2661 | Mean Difference (IV, Fixed, 95% CI) | ‐0.05 [‐0.13, 0.03] |
| 40 Head circumference (cm) Show forest plot | 4 | 4229 | Mean Difference (IV, Fixed, 95% CI) | ‐0.01 [‐0.11, 0.10] |
| 41 Head circumference z score Show forest plot | 1 | 2142 | Mean Difference (IV, Fixed, 95% CI) | ‐0.05 [‐0.14, 0.04] |
| 42 Length (cm) Show forest plot | 6 | 3303 | Mean Difference (IV, Fixed, 95% CI) | ‐0.09 [‐0.26, 0.09] |
| 43 Length z score Show forest plot | 2 | 2235 | Mean Difference (IV, Fixed, 95% CI) | ‐0.08 [‐0.15, ‐0.02] |
| 44 Ponderal index (kg/m3) Show forest plot | 3 | 2826 | Mean Difference (IV, Fixed, 95% CI) | 0.04 [‐0.16, 0.25] |
| 45 Adiposity (sum of skinfold thickness) (mm) Show forest plot | 2 | 1472 | Mean Difference (IV, Fixed, 95% CI) | 0.09 [‐0.33, 0.50] |
| 45.1 Sum of biceps, triceps, subscapular, suprailiac, abdominal and thigh skinfold thickness | 1 | 970 | Mean Difference (IV, Fixed, 95% CI) | 0.03 [‐0.86, 0.92] |
| 45.2 Sum of triceps and subscapular skinfold thickness (mm) | 1 | 502 | Mean Difference (IV, Fixed, 95% CI) | 0.10 [‐0.36, 0.56] |
| 46 Adiposity (abdominal circumference) (cm) Show forest plot | 2 | 1566 | Mean Difference (IV, Fixed, 95% CI) | ‐0.01 [‐0.23, 0.22] |
| 47 Adiposity Show forest plot | Other data | No numeric data | ||
| 48 Shoulder dystocia Show forest plot | 2 | 2733 | Risk Ratio (M‐H, Fixed, 95% CI) | 1.20 [0.79, 1.83] |
| 49 Nerve palsy Show forest plot | 1 | 2142 | Risk Ratio (M‐H, Fixed, 95% CI) | 1.99 [0.36, 10.82] |
| 50 Bone fracture Show forest plot | 1 | 2142 | Risk Ratio (M‐H, Fixed, 95% CI) | 1.99 [0.36, 10.82] |
| 51 Respiratory distress syndrome Show forest plot | 2 | 2411 | Risk Ratio (M‐H, Fixed, 95% CI) | 0.56 [0.33, 0.97] |
| 52 Hypoglycaemia Show forest plot | 2 | 3653 | Risk Ratio (M‐H, Random, 95% CI) | 1.42 [0.67, 2.98] |
| 53 Hyperbilirubinaemia Show forest plot | 1 | 2142 | Risk Ratio (M‐H, Fixed, 95% CI) | 0.82 [0.61, 1.11] |
| 54 Childhood weight (latest time reported) (kg) Show forest plot | 3 | 882 | Mean Difference (IV, Random, 95% CI) | ‐0.05 [‐0.33, 0.22] |
| 54.1 6 months | 1 | 677 | Mean Difference (IV, Random, 95% CI) | ‐0.10 [‐0.26, 0.06] |
| 54.2 10‐12 months | 1 | 48 | Mean Difference (IV, Random, 95% CI) | ‐0.36 [‐0.96, 0.24] |
| 54.3 2.8 years | 1 | 157 | Mean Difference (IV, Random, 95% CI) | 0.30 [‐0.19, 0.79] |
| 55 Childhood weight z score (latest time reported) Show forest plot | 1 | 643 | Mean Difference (IV, Fixed, 95% CI) | ‐0.09 [‐0.26, 0.08] |
| 56 Childhood height (latest time reported) (cm) Show forest plot | 2 | 816 | Mean Difference (IV, Fixed, 95% CI) | 0.33 [‐0.58, 1.25] |
| 56.1 6 months | 1 | 659 | Mean Difference (IV, Fixed, 95% CI) | 1.04 [‐0.58, 2.66] |
| 56.2 2.8 years | 1 | 157 | Mean Difference (IV, Fixed, 95% CI) | 0.0 [‐1.11, 1.11] |
| 57 Childhood height z score (latest time reported) Show forest plot | 1 | 622 | Mean Difference (IV, Fixed, 95% CI) | ‐0.02 [‐0.31, 0.27] |
| 58 Childhood head circumference (latest time reported) (cm) Show forest plot | 1 | 670 | Mean Difference (IV, Fixed, 95% CI) | ‐0.12 [‐0.70, 0.46] |
| 59 Childhood adiposity (latest time reported) (BMI z score) Show forest plot | 2 | 794 | Mean Difference (IV, Random, 95% CI) | 0.05 [‐0.29, 0.40] |
| 59.1 6 months | 1 | 637 | Mean Difference (IV, Random, 95% CI) | ‐0.11 [‐0.39, 0.17] |
| 59.2 2.8 years | 1 | 157 | Mean Difference (IV, Random, 95% CI) | 0.24 [‐0.10, 0.58] |
| 60 Childhood adiposity (latest time reported) (abdominal circumference) (cm) Show forest plot | 2 | 833 | Mean Difference (IV, Fixed, 95% CI) | 0.26 [‐0.37, 0.90] |
| 60.1 6 months | 1 | 676 | Mean Difference (IV, Fixed, 95% CI) | 0.02 [‐0.81, 0.85] |
| 60.2 2.8 years | 1 | 157 | Mean Difference (IV, Fixed, 95% CI) | 0.60 [‐0.38, 1.58] |
| 61 Childhood adiposity (latest time reported) (subscapular skinfold thickness) (mm) Show forest plot | 2 | 705 | Mean Difference (IV, Random, 95% CI) | ‐0.17 [‐0.66, 0.32] |
| 61.1 6 months | 1 | 548 | Mean Difference (IV, Random, 95% CI) | ‐0.40 [‐0.73, ‐0.07] |
| 61.2 2.8 years | 1 | 157 | Mean Difference (IV, Random, 95% CI) | 0.10 [‐0.33, 0.53] |
| 62 Childhood adiposity (latest time reported) (triceps skinfold thickness) (mm) Show forest plot | 2 | 784 | Mean Difference (IV, Fixed, 95% CI) | ‐0.12 [‐0.48, 0.23] |
| 62.1 6 months | 1 | 627 | Mean Difference (IV, Fixed, 95% CI) | ‐0.18 [‐0.61, 0.25] |
| 62.2 2.8 years | 1 | 157 | Mean Difference (IV, Fixed, 95% CI) | 0.0 [‐0.63, 0.63] |
| 63 Childhood adiposity (latest time reported) (total body fat) (%) Show forest plot | 2 | 614 | Mean Difference (IV, Fixed, 95% CI) | ‐0.74 [‐1.56, 0.07] |
| 63.1 6 months | 1 | 547 | Mean Difference (IV, Fixed, 95% CI) | ‐0.80 [‐1.64, 0.04] |
| 63.2 2.8 years | 1 | 67 | Mean Difference (IV, Fixed, 95% CI) | 0.0 [‐3.03, 3.03] |
| 64 Childhood adiposity (latest time reported) Show forest plot | Other data | No numeric data | ||
| 65 Childhood cardiovascular health (latest time reported) Show forest plot | Other data | No numeric data | ||
| 66 Antenatal visits Show forest plot | 1 | 269 | Mean Difference (IV, Fixed, 95% CI) | 0.0 [‐0.36, 0.36] |
| 67 Antenatal admissions Show forest plot | 1 | 2153 | Risk Ratio (M‐H, Fixed, 95% CI) | 0.86 [0.71, 1.04] |
| 68 Length of antenatal stay (days) Show forest plot | 2 | Mean Difference (IV, Fixed, 95% CI) | Subtotals only | |
| 68.1 Antenatal stay (days) | 1 | 2153 | Mean Difference (IV, Fixed, 95% CI) | ‐0.27 [‐0.49, ‐0.05] |
| 68.2 Antenatal inpatient stay (nights), if admitted | 1 | 139 | Mean Difference (IV, Fixed, 95% CI) | 0.0 [‐1.00, 1.00] |
| 69 Neonatal intensive care unit admission Show forest plot | 4 | 4549 | Risk Ratio (M‐H, Fixed, 95% CI) | 1.03 [0.93, 1.14] |
| 70 Length of postnatal stay (mother) (days) Show forest plot | 2 | 3511 | Mean Difference (IV, Random, 95% CI) | 0.01 [‐0.14, 0.17] |
| 71 Length of postnatal stay (baby) (days) Show forest plot | 2 | 3618 | Mean Difference (IV, Fixed, 95% CI) | ‐0.35 [‐0.90, 0.20] |
| 72 Costs to families associated with the management provided (unit cost, €) Show forest plot | 1 | Mean Difference (IV, Fixed, 95% CI) | Subtotals only | |
| 72.1 Delivery cost to the patient | 1 | 93 | Mean Difference (IV, Fixed, 95% CI) | 3.0 [‐10.82, 16.82] |
| 72.2 Neonatal care cost to the patient | 1 | 93 | Mean Difference (IV, Fixed, 95% CI) | 3.00 [‐13.67, 19.67] |
| 73 Costs associated with the intervention (unit cost, €) Show forest plot | 1 | 93 | Mean Difference (IV, Fixed, 95% CI) | 769.0 [‐1032.23, 2570.23] |
| 73.1 Total costs | 1 | 93 | Mean Difference (IV, Fixed, 95% CI) | 769.0 [‐1032.23, 2570.23] |
| 74 Cost of maternal care (unit cost, €) Show forest plot | 1 | Mean Difference (IV, Fixed, 95% CI) | Subtotals only | |
| 74.1 Visits for primary health care | 1 | 93 | Mean Difference (IV, Fixed, 95% CI) | ‐43.0 [‐127.61, 41.61] |
| 74.2 Visits for specialist health care | 1 | 93 | Mean Difference (IV, Fixed, 95% CI) | ‐47.0 [‐195.33, 101.33] |
| 74.3 Visits to a diabetes nurse | 1 | 93 | Mean Difference (IV, Fixed, 95% CI) | 6.00 [‐7.02, 19.02] |
| 74.4 Visits to a dietitian | 1 | 93 | Mean Difference (IV, Fixed, 95% CI) | 0.0 [0.0, 0.0] |
| 74.5 Use of insulin/other diabetes medication | 1 | 93 | Mean Difference (IV, Fixed, 95% CI) | ‐1.0 [‐7.83, 5.83] |
| 74.6 Hospital days before and after delivery | 1 | 93 | Mean Difference (IV, Fixed, 95% CI) | 101.00 [‐206.71, 408.71] |
| 74.7 Delivery cost to the municipality | 1 | 93 | Mean Difference (IV, Fixed, 95% CI) | 22.0 [‐234.43, 278.43] |
| 74.8 Absence from work | 1 | 93 | Mean Difference (IV, Fixed, 95% CI) | 128.0 [‐1295.58, 1551.58] |
| 75 Cost of infant care (unit cost, €) Show forest plot | 1 | 93 | Mean Difference (IV, Fixed, 95% CI) | 453.0 [‐298.20, 1204.20] |
| 75.1 Neonatal care cost to municipality | 1 | 93 | Mean Difference (IV, Fixed, 95% CI) | 453.0 [‐298.20, 1204.20] |
| Outcome or subgroup title | No. of studies | No. of participants | Statistical method | Effect size |
| 1 Gestational diabetes Show forest plot | 19 | 6633 | Risk Ratio (M‐H, Random, 95% CI) | 0.85 [0.71, 1.01] |
| 1.1 Individually‐randomised | 17 | 6492 | Risk Ratio (M‐H, Random, 95% CI) | 0.84 [0.70, 1.01] |
| 1.2 Cluster‐randomised | 2 | 141 | Risk Ratio (M‐H, Random, 95% CI) | 1.05 [0.42, 2.60] |
| 2 Pre‐eclampsia Show forest plot | 8 | 5366 | Risk Ratio (M‐H, Fixed, 95% CI) | 0.98 [0.79, 1.22] |
| 2.1 Individually‐randomised | 7 | 5273 | Risk Ratio (M‐H, Fixed, 95% CI) | 0.97 [0.78, 1.21] |
| 2.2 Cluster‐randomised | 1 | 93 | Risk Ratio (M‐H, Fixed, 95% CI) | 1.24 [0.22, 7.05] |
| 3 Caesarean section Show forest plot | 14 | 6089 | Risk Ratio (M‐H, Fixed, 95% CI) | 0.95 [0.88, 1.02] |
| 3.1 Individually‐randomised | 13 | 6038 | Risk Ratio (M‐H, Fixed, 95% CI) | 0.95 [0.88, 1.02] |
| 3.2 Cluster‐randomised | 1 | 51 | Risk Ratio (M‐H, Fixed, 95% CI) | 0.71 [0.33, 1.54] |
| 4 Large‐for‐gestational age Show forest plot | 11 | 5353 | Risk Ratio (M‐H, Fixed, 95% CI) | 0.93 [0.81, 1.07] |
| 4.1 Individually‐randomised | 9 | 5209 | Risk Ratio (M‐H, Fixed, 95% CI) | 0.94 [0.82, 1.08] |
| 4.2 Cluster‐randomised | 2 | 144 | Risk Ratio (M‐H, Fixed, 95% CI) | 0.59 [0.25, 1.40] |
| Outcome or subgroup title | No. of studies | No. of participants | Statistical method | Effect size |
| 1 Gestational diabetes Show forest plot | 19 | 6633 | Risk Ratio (M‐H, Random, 95% CI) | 0.86 [0.72, 1.02] |
| 1.1 Normal weight women (BMI < 25 kg/m²) | 3 | 300 | Risk Ratio (M‐H, Random, 95% CI) | 0.91 [0.19, 4.24] |
| 1.2 Overweight or obese women (BMI ≥ 25kg/m²) | 8 | 2901 | Risk Ratio (M‐H, Random, 95% CI) | 0.77 [0.50, 1.20] |
| 1.3 Obese women (BMI ≥ 30kg/m²) | 3 | 1738 | Risk Ratio (M‐H, Random, 95% CI) | 0.96 [0.81, 1.13] |
| 1.4 Any women | 8 | 1694 | Risk Ratio (M‐H, Random, 95% CI) | 0.80 [0.63, 1.03] |
| 2 Pre‐eclampsia Show forest plot | 8 | 5366 | Risk Ratio (M‐H, Fixed, 95% CI) | 0.98 [0.79, 1.21] |
| 2.1 Normal weight women (BMI < 25 kg/m²) | 2 | 243 | Risk Ratio (M‐H, Fixed, 95% CI) | 0.34 [0.10, 1.22] |
| 2.2 Overweight or obese women (BMI ≥ 25kg/m²) | 3 | 2369 | Risk Ratio (M‐H, Fixed, 95% CI) | 1.12 [0.82, 1.54] |
| 2.3 Obese women (BMI ≥ 30kg/m²) | 2 | 1809 | Risk Ratio (M‐H, Fixed, 95% CI) | 0.92 [0.64, 1.32] |
| 2.4 Any women | 3 | 945 | Risk Ratio (M‐H, Fixed, 95% CI) | 0.94 [0.51, 1.73] |
| 3 Pregnancy‐induced hypertension or hypertension Show forest plot | 6 | 3073 | Risk Ratio (M‐H, Random, 95% CI) | 0.71 [0.41, 1.25] |
| 3.1 Underweight women | 1 | 110 | Risk Ratio (M‐H, Random, 95% CI) | 0.70 [0.26, 1.88] |
| 3.2 Normal weight women (BMI < 25 kg/m²) | 1 | 182 | Risk Ratio (M‐H, Random, 95% CI) | 0.28 [0.08, 0.97] |
| 3.3 Overweight or obese women (BMI ≥ 25kg/m²) | 5 | 2781 | Risk Ratio (M‐H, Random, 95% CI) | 0.82 [0.43, 1.58] |
| 4 Caesarean section Show forest plot | 14 | 6089 | Risk Ratio (M‐H, Fixed, 95% CI) | 0.95 [0.88, 1.02] |
| 4.1 Normal weight women (BMI < 25 kg/m²) | 3 | 300 | Risk Ratio (M‐H, Fixed, 95% CI) | 0.92 [0.58, 1.45] |
| 4.2 Overweight or obese women (BMI ≥ 25kg/m²) | 7 | 2662 | Risk Ratio (M‐H, Fixed, 95% CI) | 0.91 [0.83, 1.01] |
| 4.3 Obese women (BMI ≥ 30kg/m²) | 2 | 1826 | Risk Ratio (M‐H, Fixed, 95% CI) | 0.99 [0.87, 1.12] |
| 4.4 Any women | 5 | 1301 | Risk Ratio (M‐H, Fixed, 95% CI) | 0.98 [0.75, 1.28] |
| 5 Perinatal mortality Show forest plot | 2 | 3757 | Risk Ratio (M‐H, Fixed, 95% CI) | 0.82 [0.42, 1.63] |
| 5.1 Overweight or obese women (BMI ≥ 25kg/m²) | 1 | 2202 | Risk Ratio (M‐H, Fixed, 95% CI) | 0.99 [0.32, 3.07] |
| 5.2 Obese women (BMI ≥ 30 kg/m²) | 1 | 1555 | Risk Ratio (M‐H, Fixed, 95% CI) | 0.74 [0.31, 1.74] |
| 6 Large‐for‐gestational age Show forest plot | 11 | 5353 | Risk Ratio (M‐H, Fixed, 95% CI) | 0.93 [0.81, 1.07] |
| 6.1 Normal weight women (BMI < 25 kg/m²) | 1 | 57 | Risk Ratio (M‐H, Fixed, 95% CI) | 0.6 [0.11, 3.32] |
| 6.2 Overweight or obese women (BMI ≥ 25kg/m²) | 4 | 2385 | Risk Ratio (M‐H, Fixed, 95% CI) | 0.89 [0.76, 1.06] |
| 6.3 Obese women (BMI ≥ 30kg/m²) | 3 | 1986 | Risk Ratio (M‐H, Fixed, 95% CI) | 1.17 [0.89, 1.54] |
| 6.4 Any women | 4 | 925 | Risk Ratio (M‐H, Fixed, 95% CI) | 0.64 [0.40, 1.03] |
| Outcome or subgroup title | No. of studies | No. of participants | Statistical method | Effect size |
| 1 Gestational diabetes Show forest plot | 19 | 6633 | Risk Ratio (M‐H, Random, 95% CI) | 0.85 [0.71, 1.01] |
| 1.1 Majority 'low risk' ethnicities | 5 | 2998 | Risk Ratio (M‐H, Random, 95% CI) | 0.85 [0.50, 1.43] |
| 1.2 Majority 'high risk' ethnicities | 1 | 56 | Risk Ratio (M‐H, Random, 95% CI) | 1.07 [0.07, 16.33] |
| 1.3 Mixed ethnicities | 7 | 2123 | Risk Ratio (M‐H, Random, 95% CI) | 0.89 [0.76, 1.05] |
| 1.4 Unclear | 6 | 1456 | Risk Ratio (M‐H, Random, 95% CI) | 0.83 [0.61, 1.12] |
| 2 Pre‐eclampsia Show forest plot | 8 | 5366 | Risk Ratio (M‐H, Fixed, 95% CI) | 0.98 [0.79, 1.22] |
| 2.1 Majority 'low risk' ethnicities | 3 | 2806 | Risk Ratio (M‐H, Fixed, 95% CI) | 0.99 [0.76, 1.29] |
| 2.2 Mixed ethnicities | 2 | 1615 | Risk Ratio (M‐H, Fixed, 95% CI) | 0.96 [0.58, 1.58] |
| 2.3 Unclear | 3 | 945 | Risk Ratio (M‐H, Fixed, 95% CI) | 0.94 [0.51, 1.73] |
| 3 Pregnancy‐induced hypertension or hypertension Show forest plot | 6 | 3073 | Risk Ratio (M‐H, Random, 95% CI) | 0.78 [0.47, 1.27] |
| 3.1 Majority 'low risk' ethnicities | 5 | 2804 | Risk Ratio (M‐H, Random, 95% CI) | 0.64 [0.34, 1.17] |
| 3.2 Unclear | 1 | 269 | Risk Ratio (M‐H, Random, 95% CI) | 1.37 [0.70, 2.72] |
| 4 Caesarean section Show forest plot | 14 | 6089 | Risk Ratio (M‐H, Fixed, 95% CI) | 0.95 [0.88, 1.02] |
| 4.1 Majority 'low risk' ethnicities | 5 | 2987 | Risk Ratio (M‐H, Fixed, 95% CI) | 0.93 [0.84, 1.03] |
| 4.2 Majority 'high risk' ethnicities | 2 | 156 | Risk Ratio (M‐H, Fixed, 95% CI) | 0.87 [0.54, 1.42] |
| 4.3 Mixed ethnicities | 5 | 1986 | Risk Ratio (M‐H, Fixed, 95% CI) | 0.94 [0.82, 1.07] |
| 4.4 Unclear | 2 | 960 | Risk Ratio (M‐H, Fixed, 95% CI) | 1.15 [0.84, 1.56] |
| 5 Perinatal mortality Show forest plot | 2 | 3757 | Risk Ratio (M‐H, Fixed, 95% CI) | 0.82 [0.42, 1.63] |
| 5.1 Majority 'low risk' ethnicities | 1 | 2202 | Risk Ratio (M‐H, Fixed, 95% CI) | 0.99 [0.32, 3.07] |
| 5.2 Mixed ethnicities | 1 | 1555 | Risk Ratio (M‐H, Fixed, 95% CI) | 0.74 [0.31, 1.74] |
| 6 Large‐for‐gestational age Show forest plot | 11 | 5353 | Risk Ratio (M‐H, Fixed, 95% CI) | 0.93 [0.81, 1.07] |
| 6.1 Majority 'low risk' ethnicities | 3 | 2577 | Risk Ratio (M‐H, Fixed, 95% CI) | 0.91 [0.77, 1.07] |
| 6.2 Majority 'high risk' ethnicities | 1 | 56 | Risk Ratio (M‐H, Fixed, 95% CI) | 3.21 [0.14, 75.68] |
| 6.3 Mixed ethnicities | 5 | 2036 | Risk Ratio (M‐H, Fixed, 95% CI) | 1.05 [0.80, 1.38] |
| 6.4 Unclear | 2 | 684 | Risk Ratio (M‐H, Fixed, 95% CI) | 0.63 [0.32, 1.23] |
| Outcome or subgroup title | No. of studies | No. of participants | Statistical method | Effect size |
| 1 Gestational diabetes Show forest plot | 11 | 5019 | Risk Ratio (M‐H, Random, 95% CI) | 0.86 [0.68, 1.09] |
| 2 Pre‐eclampsia Show forest plot | 4 | 4311 | Risk Ratio (M‐H, Fixed, 95% CI) | 0.99 [0.78, 1.26] |
| 3 Pregnancy‐induced hypertension Show forest plot | 4 | 2694 | Risk Ratio (M‐H, Random, 95% CI) | 0.58 [0.27, 1.25] |
| 4 Caesarean section Show forest plot | 10 | 4968 | Risk Ratio (M‐H, Fixed, 95% CI) | 0.94 [0.87, 1.02] |
| 5 Perinatal mortality Show forest plot | 2 | 3757 | Risk Ratio (M‐H, Fixed, 95% CI) | 0.82 [0.42, 1.63] |
| 6 Large‐for‐gestational age Show forest plot | 8 | 4618 | Risk Ratio (M‐H, Fixed, 95% CI) | 0.95 [0.83, 1.09] |