Tratamiento de primera línea del cáncer de pulmón no microcítico (células no pequeñas) no escamocelular avanzado con pruebas positivas para la mutación del receptor del factor de crecimiento epidérmico (RFCE)
Resumen
Antecedentes
La mutación positiva (M+) del receptor del factor de crecimiento epidérmico (RFCE) en el cáncer de pulmón no microcítico (células no pequeñas [CPCNP]) ha surgido como un subtipo importante de cáncer de pulmón que incluye del 10% al 15% de los tumores no escamocelulares. Este subtipo es más frecuente en las mujeres que en los hombres y tiene una menor asociación con el tabaquismo.
Objetivos
Evaluar la efectividad clínica de tratamientos con un agente único o en combinación dirigidos al RFCE utilizados en el tratamiento de primera línea de los pacientes con CPCNP M+ RFCE localmente avanzado o metastásico en comparación con otros agentes quimioterapéuticos citotóxicos administrados solos o en combinación, o la mejor atención de apoyo (MAA). El resultado primario fue la supervivencia general. Los resultados secundarios incluyeron la supervivencia libre de progresión, la tasa de respuesta, la toxicidad y la calidad de vida.
Métodos de búsqueda
Se hicieron búsquedas electrónicas en el Registro Cochrane de Ensayos Controlados (Cochrane Register of Controlled Trials) (CENTRAL) (2015, número 6), MEDLINE (1946 hasta 1 junio 2015), EMBASE (1980 hasta 1 junio 2015), y en ISI Web of Science (1899 hasta 1 junio 2015). También se hicieron búsquedas en los resúmenes de congresos de la American Society for Clinical Oncology y en la European Society for Medical Oncology (1 junio 2015); las presentaciones del Evidence Review Group al National Institute for Health and Care Excellence; y en las listas de referencias de los artículos recuperados.
Criterios de selección
Ensayos controlados aleatorios paralelos que compararon agentes dirigidos al RFCE (solos o en combinación con agentes citotóxicos o la MAA) con la quimioterapia citotóxica (única o doble) o la MAA en pacientes que nunca habían recibido quimioterapia con CPCNP M+ RFCE localmente avanzado o metastásico (estadio IIIB o IV) no apropiados para el tratamiento con intención curativa.
Obtención y análisis de los datos
Dos autores de la revisión, de forma independiente, identificaron los artículos, extrajeron los datos y realizaron la evaluación del riesgo de sesgo. Los metanálisis se realizaron mediante un modelo de efectos fijos a menos que hubiera una heterogeneidad significativa, y en ese caso también se realizó un análisis de efectos aleatorios como un análisis de sensibilidad.
Resultados principales
Diecinueve ensayos cumplieron los criterios de inclusión. Siete de estos ensayos reclutaron exclusivamente a pacientes con CPCNP M+ RFCE; los ensayos restantes reclutaron a una población mixta y presentaron resultados para los pacientes con CPCNP M+ RFCE como análisis de subgrupos. El número de participantes con tumores M+ RFCE incluyó 2317, de los que 1700 fueron de origen asiático.
Los datos de la supervivencia general (SG) mostraron resultados inconsistentes entre los ensayos incluidos que compararon tratamientos dirigidos al RFCE versus quimioterapia citotóxica o placebo.
Erlotinib fue el tratamiento de intervención utilizado en ocho ensayos, gefitinib en siete ensayos, afatinib en dos ensayos y cetuximab en dos ensayos. Los resultados de un ensayo (FASTACT 2) informaron un efecto beneficioso estadísticamente significativo en la SG en los participantes tratados con erlotinib más quimioterapia citotóxica en comparación con quimioterapia citotóxica sola, pero este resultado se basó en un número pequeño de participantes (n = 97). Para la supervivencia libre de progresión (SLP), un análisis agrupado de tres ensayos (n = 378) demostró un efecto beneficioso estadísticamente significativo del erlotinib en comparación con la quimioterapia citotóxica (cociente de riesgos instantáneos [CRI] 0,30; intervalo de confianza [IC] del 95%: 0,24 a 0,38).
En un análisis agrupado con 491 participantes a los que se les administró gefitinib, dos ensayos (IPASS y NEJSG) demostraron un efecto beneficioso estadísticamente significativo en la SLP del gefitinib en comparación con la quimioterapia citotóxica (CRI 0,39; IC del 95%: 0,32 a 0,48).
Afatinib (n = 709) mostró un efecto beneficioso estadísticamente significativo en la SLP en comparación con la quimioterapia en un análisis agrupado de dos ensayos (CRI 0,42; IC del 95%: 0,34 a 0,53).
Habitualmente los eventos adversos grado 3/4 informados con la monoterapia con afatinib, erlotinib y gefitinib fueron erupción cutánea y diarrea. La mielosupresión fue sistemáticamente peor en los brazos de quimioterapia, y la fatiga y la anorexia también se asociaron con algunas quimioterapias.
En ninguno de los dos ensayos se informaron efectos beneficiosos estadísticamente significativos en la SLP o la SG de cetuximab más quimioterapia citotóxica (n = 81) en comparación con quimioterapia sola.
Seis ensayos informaron sobre la calidad de vida y la mejoría de los síntomas mediante metodologías diferentes. Para erlotinib, gefitinib, y afatinib, dos ensayos mostraron mejoría en uno o más índices para el inhibidor de la tirosina‐quinasa (ITK) en comparación con la quimioterapia.
La calidad de las pruebas fue alta para las comparaciones de erlotinib y gefitinib con quimioterapia citotóxica y para la comparación de afatinib con quimioterapia citotóxica.
Conclusiones de los autores
Erlotinib, gefitinib y afatinib son agentes activos en los pacientes con CPCNP M+ RFCE y demostraron aumentar la tasa de respuesta tumoral y prolongar la supervivencia libre de progresión en comparación con la quimioterapia citotóxica. También se encontró un efecto beneficioso del ITK en comparación con la quimioterapia citotóxica. Sin embargo, no se encontró un aumento en la supervivencia general para el ITK en comparación con la quimioterapia estándar. La quimioterapia citotóxica es menos eficaz en el CPCNP M+ RFCE que erlotinib, gefitinib, o afatinib y se asocia con mayor toxicidad. No hubo datos que apoyaran la administración del tratamiento con anticuerpos monoclonales.
PICO
Resumen en términos sencillos
Tratamiento de primera línea del cáncer de pulmón de células no pequeñas avanzado identificado como positivo para la mutación del RFCE
Antecedentes
El cáncer de pulmón es el cáncer más común en el mundo. Como muestra pocos síntomas, a menudo se ha diseminado cuando se diagnostica. Por lo tanto, en general no es posible la cirugía y habitualmente se requiere farmacoterapia.
El tipo más común de cáncer de pulmón es el cáncer de pulmón de células no pequeñas (CPCNP). Alrededor del 10% al 15% de los pacientes con CPCNP tendrá una clase específica de cáncer conocido como receptor del factor de crecimiento epidérmico positivo (M+ RFCE), en el que hay cambios específicos en las células cancerosas en los genes que controlan el crecimiento tumoral. En esta revisión se analizaron los nuevos tratamientos que se pueden dirigir al CPCNP M+ RFCE para determinar cuán bien funcionan.
Objetivos
El objetivo de esta revisión fue determinar si los pacientes a los que se les administraron tratamientos dirigidos al CPCNP M+ RFCE viven más tiempo y tienen una mejor calidad de vida que los que reciben quimioterapia estándar.
Características de los ensayos
Se encontraron 19 ensayos que analizaron cuatro fármacos diferentes dirigidos al RFCE: erlotinib, gefitinib, afatinib y el anticuerpo cetuximab. Se incluyeron ensayos que informaron resultados hasta junio de 2015.
Resultados
Los resultados mostraron que los pacientes a los que se les administró erlotinib, gefitinib o afatinib tienen un tiempo más largo antes de que el cáncer progrese y presentan menos efectos secundarios que los pacientes que reciben quimioterapia estándar, con mayor frecuencia cisplatino más otro fármaco. Sin embargo, los pacientes a los que se les administró erlotinib, gefitinib o afatinib no vivieron más tiempo que los que recibieron quimioterapia estándar. El tratamiento con cetuximab combinado con quimioterapia no retrasó la diseminación adicional del cáncer de pulmón y no prolongó la vida en comparación con la quimioterapia sola.
Conclusión
Erlotinib, gefitinib y afatinib retrasan la diseminación adicional del cáncer de pulmón de M+ RFCE y mejoran la calidad de vida, pero no prolongan la vida. Proporcionar cetuximab con quimioterapia no mejora el control de este tipo de cáncer ni prolonga la vida en comparación con la quimioterapia sola.
Conclusiones de los autores
Summary of findings
| First‐line treatment of advanced epidermal growth factor receptor (EGFR) mutation positive (M+) non‐squamous non‐small cell lung cancer (NSCLC): erlotinib comparisons | ||||||
| Patient or population: EGFR M+ patients with NSCLC Settings: oncology Intervention: erlotinib Comparison: control (cytotoxic chemotherapy) | ||||||
| Outcomes | Illustrative comparative risks* (95% CI) | Relative effect | No of participants | Quality of the evidence | Comments | |
| Assumed risk | Corresponding risk | |||||
| Control | Erlotinib | |||||
| Overall survival | 56 per 100 | 54 per 100 (46 to 63) | HR 0.95 (0.75, 1.22) | 429 (3 studies) | High | All trials were open label but included blinded independent review |
| Progression‐free survival | 73 per 100 | 33 per 100 (27 to 40) | HR 0.30 (0.24, 0.38) | 595 (4 studies) | High | All trials were open label but included blinded independent review |
| *The basis for the assumed risk is calculated as the event rate in the treatment group | ||||||
| GRADE Working Group grades of evidence | ||||||
| First‐line treatment of advanced epidermal growth factor receptor (EGFR) mutation positive (M+) non‐squamous non‐small cell lung cancer (NSCLC): gefitinib comparisons | ||||||
| Patient or population: EGFR M+ patients with NSCLC Settings: oncology Intervention: gefitinib Comparison: paclitaxel + carboplatin | ||||||
| Outcomes | Illustrative comparative risks* (95% CI) | Relative effect | No of participants | Quality of the evidence | Comments | |
| Assumed risk | Corresponding risk | |||||
| Paclitaxel + carboplatin | Gefitinib | |||||
| Overall survival | 67 per 100 | 66 per 100 (58 to 73) | HR 0.95 (0.77 to 1.18) | 489 (2 studies) | High | Both trials were open label. IPASS did not report independent blinded review |
| Progression‐free survival | 89 per 100 | 57 per 100 (50 to 65) | HR 0.39 (0.32 to 0.48) | 485 (2 studies) | High | Both trials were open label. IPASS did not report independent blinded review |
| *The basis for the assumed risk is calculated as the event rate in the treatment group | ||||||
| GRADE Working Group grades of evidence | ||||||
| First‐line treatment of advanced epidermal growth factor receptor (EGFR) mutation positive (M+) non‐squamous non‐small cell lung cancer (NSCLC): afatinib comparisons | ||||||
| Patient or population: EGFR M+ patients with NSCLC Settings: oncology Intervention: afatinib Comparison: cytotoxic chemotherapy | ||||||
| Outcomes | Illustrative comparative risks* (95% CI) | Relative effect | No of participants | Quality of the evidence | Comments | |
| Assumed risk | Corresponding risk | |||||
| Cytotoxic chemotherapy | Afatinib | |||||
| Overall survival | 46 per 100 | 44 per 100 (37 to 52) | HR 0.93 (0.74 to 1.17) | 709 (2 studies) | High | Both trials were open label but included blinded independent central review |
| Progression‐free survival | 56 per 100 | 29 per 100 (24 to 35) | HR 0.42 (0.34 to 0.53) | 709 (2 studies) | High | Both trials were open label but included blinded independent central review |
| *The basis for the assumed risk is calculated as the event rate in the treatment group | ||||||
| GRADE Working Group grades of evidence | ||||||
Antecedentes
Descripción de la afección
El cáncer de pulmón es el cáncer más común en el mundo y el segundo cáncer más común diagnosticado en el Reino Unido (Cancer Research UK). A nivel global, en 2012 a 1 800 000 personas se les diagnosticó cáncer de pulmón, lo que representa el 12,9% de todos los cánceres (GLOBOCAN 2012). En el Reino Unido, en 2012 se diagnosticaron 45 000 nuevos casos de cáncer de pulmón, el 13% de todos los cánceres nuevos (Cancer Research UK 2012b). En los hombres como en las mujeres, el tabaquismo es la causa primaria de cáncer de pulmón (Cancer Research UK 2013). El pronóstico es deficiente, ya que el cáncer de pulmón en estadio inicial a menudo es asintomático y la mayoría de los pacientes se diagnostican en un estadio tardío. (Cancer Research UK 2012b). En el Reino Unido, en 2012 35 000 pacientes murieron de cáncer de pulmón, lo que representa el 22% de todas las muertes por cáncer en el Reino Unido (Cancer Research UK 2012a).
El cáncer de pulmón de células no pequeñas (CPCNP) representa la mayoría (85% al 90%) de los casos de cáncer de pulmón en el Reino Unido e incluye dos subgrupos histológicos principales: carcinoma escamocelular y carcinoma no escamocelular (Cancer Research UK 2012c). El carcinoma escamocelular representa el 25% al 30% de todos los casos de CPCNP, aunque el carcinoma no escamocelular (que incluye el adenocarcinoma carcinoma de células grandes) representa el 29% de los casos de CPCNP. Aproximadamente del 12% al 13% de los pacientes presentan CPCNP "sin otra especificación" con un diagnóstico basado en la citología sola (NLCA 2015; Schiller 2002). El pronóstico de los pacientes con CPCNP es deficiente, con una supervivencia mediana de alrededor de seis meses.
El tratamiento de los pacientes con CPCNP depende no sólo del subtipo histológico y del subtipo genético del tumor, sino también del estadio de la enfermedad, la comorbilidad y el estado funcional. En la mayoría de los casos la quimioterapia, que incluye cisplatino doble, para la enfermedad avanzada puede prolongar la supervivencia general durante varios meses en comparación con la mejor atención de apoyo y mejora la calidad de vida (Brown 2013).
En años recientes los subtipos biológicos de CPCNP se han vuelto relevantes para la selección de los regímenes de tratamiento. La atención se ha dirigido a los tumores que portan la mutación del receptor del factor de crecimiento epidérmico (M+ RFCE). El RFCE, una proteína localizada en la superficie celular, se une y activa el factor de crecimiento epidérmico. Esta unión induce la dimerización del receptor y la autofosforilación de la tirosina‐quinasa, lo que provoca la proliferación celular a través de una señal de transducción(Han 2012; NCBI). Se calcula que del 10% al 15% de los pacientes con CPCNP no escamocelular presentan tumores que son M+ RFCE (Peters 2012; Rosell 2012). La mutación del RFCE se observa con mayor frecuencia en las personas que nunca fumaron con respecto a los que algunas vez fumaron (51% versus 10%), en los adenocarcinomas en comparación con los cánceres de otras histologías (40% versus 3%), en personas de grupo étnico de Asia Oriental versus otros grupos étnicos (30% versus 8%) y en mujeres en lugar de hombres (42% versus 14%) (Rosell 2009; Scoccianti 2012; Ulivi 2012).
La identificación de los pacientes con tumores M+ RFCE ha dado lugar al desarrollo de tratamientos dirigidos que incluyen los inhibidores de la molécula pequeña de tirosina‐quinasa (ITK) dirigidos a la vía de la señal de transducción entre la membrana celular y el núcleo, mientras que los anticuerpos monoclonales se unen e inactivan el receptor en la membrana celular. Desde que la mayoría de los ensayos de fase III en esta revisión comenzaron, se ha vuelto evidente que la activación de las mutaciones de los exones 19 y 21 se asocia con respuesta a los ITK, mientras que el 1% de los tumores con mutación T790M del exon 20 son resistentes. Los ITK se administran por vía oral, mientras que los anticuerpos monoclonales se administran por vía intravenosa. Los pacientes de interés a esta revisión fueron los que no habían recibido quimioterapia con CPCNP M+ RFCE localmente avanzado o metastásico (estadio IIIB o IV) y no fueron apropiados para el tratamiento con intención curativa, como la cirugía o la radioterapia radical.
Descripción de la intervención
En Europa hay tres tratamientos autorizados dirigidos al CPCNP M+ RFCE: afatinib, erlotinib, y gefitinib. Estos fármacos son ITK de RFCE y proteínas dirigidas a las células cancerosas relacionadas con la activación de la vía de la señal de transducción. Estos tratamientos se administran por vía oral (comprimidos) diariamente hasta que progresa la enfermedad. Otros fármacos, por ejemplo el ITK dacomitinib y el anticuerpo monoclonal cetuximab, actualmente están bajo investigación clínica y todavía no se han autorizado para el tratamiento de primera línea de los pacientes con CPCNP M+ RFCE. En esta revisión no se evaluaron los fármacos más nuevos dirigidos a la mutación T790M del exon 20.
En el Reino Unido, el National Institute for Health and Care Excellence ha recomendado el uso de la monoterapia con erlotinib, NICE 2012, la monoterapia con gefitinib, NICE 2010 y más recientemente, la monoterapia con afatinib, NICE 2014, para el tratamiento de primera línea del CPCNP M+ RFCE. En Europa, las guías de la European Society for Medical Oncology recomiendan el tratamiento de primera línea con la monoterapia con afatinib, erlotinib, o gefitinib (Reck 2014). En los EE.UU., la Food and Drug Administration ha aprobado la administración de monoterapia con erlotinib y la monoterapia con afatinib (FDA 2013; FDA 2014). A nivel global hay una variación considerable en la administración de cada uno de estos fármacos para tratar a los pacientes con CPCNP y en la disponibilidad y el control de calidad de las pruebas de las mutaciones, que determina la selección de los pacientes.
Por qué es importante realizar esta revisión
Los tratamientos de los pacientes con CPCNP han evolucionado rápidamente después del metanálisis del Medical Research Council que demostró una mejoría en la supervivencia con la quimioterapia en comparación con el mejor tratamiento médico de apoyo(MRC 1995). Hasta principios del 2000, a los pacientes con CPCNP se les ofrecían tratamientos estándar con quimioterapia citotóxica (por ejemplo cisplatino, docetaxel, vinorelbina, paclitaxel y gemcitabina), a menudo administrados en combinaciones de dos fármacos con platino (Brown 2013). Sin embargo, en años recientes los pacientes se han tratado con fármacos según el subtipo histológico (por ejemplo, pemetrexed más cisplatino para la enfermedad no escamocelular). Incluso más recientemente, como el conocimiento acerca del CPCNP ha evolucionado, los tratamientos dirigidos se han desarrollado para tratar grupos específicos de pacientes según criterios moleculares, por ejemplo ITK y anticuerpos monoclonales. Se calcula que alrededor del 10% (n = 4000 anualmente) de todos los pacientes con cáncer de pulmón en el Reino Unido presentan CPCNP M+ RFCE localmente avanzado o metastásico (NICE 2010), con una prevalencia mayor en las poblaciones asiáticas. Por lo tanto, es importante sintetizar las pruebas de la efectividad clínica y la toxicidad de estos nuevos tratamientos para asegurar que los pacientes sean tratados con fármacos clínicamente más efectivos para el subtipo específico de la enfermedad.
Objetivos
Evaluar la efectividad clínica de los tratamientos con un agente único o en combinación dirigidos al RFCE utilizados en el tratamiento de primera línea de los pacientes con CPCNP M+ RFCE localmente avanzado o metastásico en comparación con otros agentes de quimioterapia citotóxica utilizados solos o en la combinación o la mejor atención de apoyo (MAA). El resultado primario fue la supervivencia general. Los resultados secundarios incluyeron la supervivencia libre de progresión, la tasa de respuesta, la toxicidad y la calidad de vida.
Métodos
Criterios de inclusión de estudios para esta revisión
Tipos de estudios
Ensayos controlados aleatorios (ECA) paralelos.
Tipos de participantes
Pacientes que no han recibido quimioterapia con CPCNP M+ RFCE localmente avanzado o metastásico (estadio IIIB o IV) no apropiados para el tratamiento con intención curativa con cirugía o radioterapia radical. Se incluyeron los estudios que incluyeron o excluyeron la T790 del exon 20 en la revisión.
Tipos de intervenciones
Agentes dirigidos al RFCE M+, solos o en combinación con agentes citotóxicos, en comparación con agentes citotóxicos administrados solos o en combinación o la MAA.
Se excluyeron los ensayos que compararon un agente único o en combinación de quimioterapia citotóxica sin un tratamiento dirigido en cualquier brazo y los ensayos con tratamientos dirigidos en ambos brazos, y no se evaluaron estrategias de mantenimiento o de segunda línea. Se excluyeron los ensayos cruzados.
Tipos de medida de resultado
Resultados primarios
-
Supervivencia global
Resultados secundarios
-
Supervivencia libre de progresión
-
Respuesta tumoral
-
Toxicidad y efectos adversos del tratamiento
-
Calidad de vida (p.ej., Functional Assessment of Cancer Therapy ‐ Lung [FACT‐L] y Trial Outcome Index [TOI])
-
Alivio de los síntomas
Results
Description of studies
Results of the search
The database search strategy yielded 7674 non‐duplicate papers. Of these, we screened 336 full‐text records for inclusion in the review. We identified a further seven records via handsearching of reference lists and found two other records from our search of conference abstracts. We screened all of the potentially relevant references and included 19 eligible RCTs (reported in 56 publications) comparing EGFR‐targeted therapy to chemotherapy as first‐line treatment in NSCLC patients in our review (Figure 1).

Study flow diagram.
We classified three trials as awaiting assessment and have not yet included them in the review (INSPIRE; TALENT; TRIBUTE). We contacted the authors of TALENT and TRIBUTE and asked them to provide data on the EGFR M+ population. We have not received a response. We await the publication of outcomes for the EGFR M+ subgroup from INSPIRE. We found one ongoing trial (ARCHER).
Included studies
See Characteristics of included studies.
The 19 trials that met the inclusion criteria were published or updated between 2003 and 2015 (BMSO99; CHEN; ENSURE; EURTAC; FASTACT 2; First‐SIGNAL; FLEX; GTOWG; INTACT 1; INTACT 2; IPASS; LUX‐Lung 3; LUX‐Lung 6; NEJSG; OPTIMAL; TOPICAL; TORCH; WJTOG3405; Yu 2014). With the exception of GTOWG, all trials were published as peer‐reviewed papers. The overall number of people recruited to the trials ranged between 113, in CHEN, and 1217, in IPASS, with an overall trial population of 9414. The median length of follow‐up (where reported) ranged from 15.9 months, in INTACT 1, to 59 months, in WJTOG3405.
Seven trials included EGFR M+ participants only (ENSURE; EURTAC; LUX‐Lung 3; LUX‐Lung 6; NEJSG; OPTIMAL; WJTOG3405). The number of participants recruited to the EGFR M+ only trials ranged from 165, in OPTIMAL, to 364, in LUX‐Lung 6, with a total population of 1672. The remaining 12 trials recruited a 'mixed' population of participants, that is participants were not selected for inclusion in the trial on the basis of their EGFR mutation status. These latter trials reported results for the subgroup of participants with EGFR M+ mutation status. The numbers of participants reported in these subgroups ranged from 10, in GTOWG, to 261, in IPASS, with a combined total of 645. The combined total of participants with EGFR M+ NSCLC was 2317.
Three trials were conducted exclusively in Europe (EURTAC; GTOWG; TOPICAL); 10 were conducted exclusively in Asia (CHEN; ENSURE; FASTACT 2; First‐SIGNAL; IPASS; LUX‐Lung 6; NEJSG; OPTIMAL; WJTOG3405; Yu 2014); and one was conducted in the USA (BMSO99). The remaining trials were more international, (TORCH), (INTACT 2). LUX‐Lung 3, INTACT 1, and FLEX. The seven trials that recruited exclusively EGFR M+ patients were conducted in Asia, ENSURE, LUX‐Lung 6, NEJSG, OPTIMAL, and WJTOG3405, and Europe, EURTAC, with one international trial (LUX‐Lung 3).
Four of the trials were placebo controlled and double blinded (FASTACT 2; INTACT 1; INTACT 2; TOPICAL); the remainder were specifically reported as being open label or did not report blinding status. In the latter case, we assumed these to be open label due to the nature of the interventions and comparator (that is oral versus intravenous treatments). Three of the 19 included trials were phase II (CHEN; GTOWG; Yu 2014), whilst the others were phase III. Fifteen of the 19 trials were partially or totally funded by a pharmaceutical company (BMSO99; CHEN; ENSURE; EURTAC; FASTACT 2; First‐SIGNAL; FLEX; INTACT 1; INTACT 2; IPASS; LUX‐Lung 3; LUX‐Lung 6; OPTIMAL; TOPICAL; TORCH); the NEJSG and WJTOG3405 trials were funded by scientific groups. The funding source for the GTOWG and Yu 2014 trials was not reported.
Four categories of comparisons for all four agents were described:
-
targeted agent versus established platinum‐based combinations (e.g. cisplatin or carboplatin and gemcitabine or docetaxel) ‐ the term platinum‐based refers to cisplatin or carboplatin based combinations, both drugs being metabolised to the same active moiety;
-
targeted agent versus single‐agent chemotherapy drug vinorelbine, for which clinical interest is limited to the elderly population due to its favourable toxicity profile;
-
cytotoxic chemotherapy with the targeted agent versus chemotherapy alone; and
-
erlotinib versus placebo.
Population characteristics
All trials provided data for age, sex, performance status, and smoking status except for the INTACT 1, INTACT 2, and GTOWG trials (no details of smoking history). The median age of the overall population of all participants in the included trials ranged from 56 to 77 years; the median age of participants in the EGFR M+ only trials ranged from 56 to 65 years. Two trials only included people aged over 70 years (CHEN; GTOWG), and NEJSG and Yu 2014 only reported mean age. There were more females in nine trials (ENSURE; EURTAC; First‐SIGNAL; IPASS; LUX‐Lung 3; LUX‐Lung 6; NEJSG; OPTIMAL; WJTOG3405), and more males in seven trials (BMSO99; CHEN; FLEX; GTOWG; INTACT 1; INTACT 2; TORCH). The majority of participants were of good performance status (ECOG or WHO 0 or 1). The GTOWG abstract did not report performance status.
It is notable that in all of the trials that recruited EGFR M+ patients only, the proportion of females was greater than males (ENSURE; EURTAC; LUX‐Lung 3; LUX‐Lung 6; NEJSG; OPTIMAL; WJTOG3405).
Interventions
Erlotinib
Eight trials used erlotinib (n = 754 EGFR M+) as the EGFR‐targeted therapy (CHEN; ENSURE; EURTAC; FASTACT 2; GTOWG; OPTIMAL; TOPICAL; TORCH). CHEN and GTOWG used the drug vinorelbine as a single agent or with carboplatin, respectively, in elderly populations. In FASTACT 2, erlotinib was used in combination with a platinum doublet containing gemcitabine. We classified trials using erlotinib into the following comparison groups.
-
Erlotinib versus platinum‐based chemotherapy: One trial compared erlotinib versus gemcitabine plus carboplatin (OPTIMAL), two trials compared erlotinib versus gemcitabine plus cisplatin (ENSURE; TORCH), and one trial compared erlotinib versus docetaxel plus cisplatin or gemcitabine plus cisplatin (EURTAC).
-
Erlotinib versus vinorelbine +/‐ chemotherapy: One trial compared erlotinib versus vinorelbine (CHEN), one trial compared erlotinib versus carboplatin plus vinorelbine (GTOWG).
-
Erlotinib plus chemotherapy versus chemotherapy plus placebo: One trial compared erlotinib plus gemcitabine plus carboplatin or cisplatin versus gemcitabine plus carboplatin or cisplatin plus placebo (FASTACT 2).
-
Erlotinib versus placebo: One trial considered this comparison (TOPICAL).
Gefitinib
Seven trials used gefitinib (n = 773 EGFR M+) as the EGFR‐targeted therapy (First‐SIGNAL; INTACT 1; INTACT 2; IPASS; NEJSG; WJTOG3405; Yu 2014). Three trials used gefitinib in combination with chemotherapy (INTACT 1; INTACT 2; Yu 2014). We classified trials using gefitinib into the following comparison groups.
-
Gefitinib versus gemcitabine plus cisplatin: One trial considered this comparison (First‐SIGNAL).
-
Gefitinib versus paclitaxel plus carboplatin: Two trials considered this comparison (IPASS; NEJSG).
-
Gefitinib versus docetaxel plus cisplatin: One trial considered this comparison (WJTOG3405).
-
Gefitinib and carboplatin plus paclitaxel or cisplatin plus gemcitabine versus cytotoxic chemotherapy alone: Two trials considered this comparison (INTACT 1; INTACT 2). However, as EGFR M+ specific data from both trials was analysed as though from one trial, and data were only presented narratively.
-
Gefitinib plus pemetrexed and cisplatin versus pemetrexed plus cisplatin: One trial considered this comparison (Yu 2014).
Afatinib
Two trials compared afatinib (n = 709) with cytotoxic chemotherapy (LUX‐Lung 3; LUX‐Lung 6). These trials differed principally in the selection of the cytotoxic chemotherapy comparator, LUX‐Lung 3 comparing afatinib with cisplatin and pemetrexed in an ethnically diverse population, and LUX‐Lung 6 comparing afatinib with cisplatin and gemcitabine in an Asian population. We combined these trials in a meta‐analysis for progression‐free survival, overall survival, and response.
Cetuximab
Two trials (n = 81) compared cetuximab plus chemotherapy with combination chemotherapy (BMSO99; FLEX).
Of the seven trials that recruited only people with EGFR M+ NSCLC, two trials used afatinib (LUX‐Lung 3; LUX‐Lung 6), three used erlotinib (ENSURE: EURTAC; OPTIMAL), and two used gefitinib (NEJSG; WJTOG3405). All seven EGFR M+ only trials compared targeted treatment with cytotoxic chemotherapy (ENSURE; EURTAC; LUX‐Lung 3; LUX‐Lung 6; NEJSG; OPTIMAL; WJTOG3405).
Outcomes
The primary outcome for the majority of trials was progression‐free survival with secondary outcomes of overall survival, tumour response rate, symptom palliation, quality of life, and safety. Overall survival was the primary outcome in six trials (First‐SIGNAL; FLEX; INTACT 1; INTACT 2; TOPICAL; TORCH).
Excluded studies
See Characteristics of excluded studies.
We excluded 280 records after the selection procedure (Figure 1). The main reasons for exclusion were the use of non‐randomised designs (including systematic reviews and reports from conferences), non‐assessment of participants' EGFR mutation status, and non‐administration of treatments as first‐line therapy. We excluded other trials if they were designed to assess maintenance treatment, or if an EGFR‐targeted therapy was used in both trial arms. We were unable to easily exclude articles at the screening stage, as we could not be certain from the abstract whether subgroup analyses of outcomes of participants with EGFR M+ tumours were reported. In the Characteristics of excluded studies table we have listed the 20 trials that appeared to meet the inclusion criteria, but on closer examination were not a complete match. Participants in five trials were not tested for EGFR mutations (Crino 2008; Gatzemeier 2003; Goss 2009; Lilenbaum 2008; Rosell 2004). Two trials tested for EGFR expression only (Rosell 2008; Thatcher 2014). Three trials included too few participants with EGFR M+ tumours to warrant analysis (FASTACT; Heigener 2014; White), and in eight trials tyrosine kinase inhibitors treatment was included in both trial arms (Hirsh 2011; Janne 2012; JO25567; Massuti 2014; NEJ005 2014; NEJ009; Xie 2015; Yang 2015). One trial only assessed outcomes of patients who had survived at one year (Boutsikou 2013), and in another trial there were insufficient samples available for testing (ECOG 4508).
Risk of bias in included studies
Allocation
Of the 19 included trials, 11 reported adequate information about the methods used to generate the randomisation sequence and the allocation concealment procedure; we considered these trials to be at low risk of bias (EURTAC; FASTACT 2; FLEX; IPASS; LUX‐Lung 3; LUX‐Lung 6; NEJSG; OPTIMAL; TOPICAL; TORCH; WJTOG3405). We considered the risk of bias for the remaining eight trials to be unclear due to lack of reported information (BMSO99; CHEN; ENSURE; First‐SIGNAL; GTOWG; INTACT 1; INTACT 2; Yu 2014).
Blinding
Performance bias
Only 4 of the 19 included trials reported employing blinding procedures (INTACT 1; INTACT 2; NEJSG; TOPICAL). The remaining trials explicitly stated they were open label or did not report blinding status. In the latter case, we assumed these trials were open label due to the differences between interventions and comparator (that is oral versus intravenous).
Detection bias
We considered 11 of the trials to be at low risk of detection bias for the outcome of progression‐free survival, as they incorporated independent verification procedures, in BMSO99, ENSURE, EURTAC, FASTACT 2, First‐SIGNAL, LUX‐Lung 3, LUX‐Lung 6, and NEJSG, or blinded outcome assessment, in INTACT 1, INTACT 2, and TOPICAL. None of the remaining trials reported any independent assessment procedures and were considered to be at high risk of bias for the outcome of progression‐free survival.
Incomplete outcome data
In all trials, all participants were accounted for in the analyses. There did not appear to be any major imbalances in drop‐out rates between trial arms in any of the trials, therefore we considered all trials to be at low risk of bias.
Selective reporting
We considered only one trial to be at high risk of reporting bias (CHEN). The trial protocol stated time to progression as a secondary outcome of the trial, however the published paper did not report this outcome. We considered two trials to be at unclear risk of bias as the available information was insufficient to judge selective reporting (FLEX; GTOWG). We considered all other trials to be at a low risk of bias, as either trial protocols were available, or all outcomes stated in the methods section of the papers were reported.
Other potential sources of bias
Fifteen trials were sponsored fully or in part by pharmaceutical companies. One trial was terminated early as the non‐inferiority of the intervention arm was demonstrated by the first planned interim analysis (TORCH). Two trials were terminated early for benefit (ENSURE; EURTAC).
Effects of interventions
See: Summary of findings for the main comparison Erlotinib vs control; Summary of findings 2 Gefitinib vs paclitaxel + carboplatin; Summary of findings 3 Afatinib vs chemotherapy
Pairwise meta‐analysis
Erlotinib versus placebo, platinum‐based chemotherapy, or other cytotoxic agents
Primary outcome: Overall survival
Data from five trials were available for overall survival (OS) (CHEN; ENSURE; EURTAC; FASTACT 2; TORCH). Three trials presented limited data (OPTIMAL; TOPICAL), and one trial presented no data (GTOWG).
Erlotinib versus platinum‐based chemotherapy: The pooled treatment effect estimate for three trials, hazard ratio (HR) of 0.95 (95% confidence interval (CI) 0.75 to 1.22; I2 = 0; 71%) indicated no significant difference in OS between the groups (ENSURE; EURTAC; TORCH). OPTIMAL reported that OS did not differ significantly between the two treatment arms (HR = 1.065, P = 0.6849). No standard error was reported, so the results could not be entered into a meta‐analysis.
Erlotinib versus vinorelbine: CHEN reported a HR of 2.16 (95% CI 0.58 to 8.10) for OS comparing erlotinib versus vinorelbine in elderly patients, indicating no significant difference in OS between the groups.
Erlotinib plus cytotoxic chemotherapy versus cytotoxic chemotherapy plus placebo: FASTACT 2 reported a HR of 0.48 (95% CI 0.27 to 0.85) for OS indicating a significant difference in OS favouring erlotinib plus cytotoxic chemotherapy in a trial of 91 participants (Analysis 1.1).
Erlotinib versus placebo: TOPICAL reported the median overall survival, which was 10.4 months (95% CI 5.5 to 15.1) for erlotinib (n = 17) versus 3.7 months (95% CI 0.3 to 49.3) for placebo (n = 11).
Secondary outcomes
1. Progression‐free survival
Six trials reported progression‐free survival (PFS) (CHEN; ENSURE; EURTAC; FASTACT 2; OPTIMAL; TORCH). One trial did not report hazard ratios and only presented limited data (TOPICAL), and one trial reported no data (GTOWG).
Erlotinib versus chemotherapy: The pooled treatment effect estimate for four trials (HR 0.30, 95% CI 0.24 to 0.38; fixed‐effect; I2 = 74%) favoured erlotinib (ENSURE; EURTAC; OPTIMAL; TORCH). As there was a substantial amount of heterogeneity, we performed a sensitivity analysis using the random‐effects model, and results were similar to the main analysis (HR 0.31, 95% CI 0.20 to 0.50).
Erlotinib versus vinorelbine: CHEN reported a HR of 0.55 (95% CI 0.21 to 1.46) for PFS indicating no significant difference between the groups.
Erlotinib plus cytotoxic chemotherapy versus cytotoxic chemotherapy plus placebo: FASTACT 2 reported a significant difference in PFS favouring erlotinib plus cytotoxic chemotherapy (HR 0.25, 95% CI 0.16 to 0.39) (Analysis 1.2).
Erlotinib versus placebo: TOPICAL reported the median PFS, which was 4.8 months (95% CI 1.6 to 8.8) for erlotinib (n = 17) and 2.9 months (95% CI 0.3 to 10.1) for placebo (n = 11).
ENSURE, EURTAC, and OPTIMAL showed an improvement in PFS for the exon 19 deletion in favour of erlotinib. We did not perform meta‐analysis of this preliminary data.
2. Tumour response
Erlotinib versus platinum‐based chemotherapy: The pooled treatment effect estimate for five trials favoured erlotinib (risk ratio (RR) 2.26, 95% CI 1.85 to 2.76; I2 = 57%) (ENSURE; EURTAC; GTOWG; OPTIMAL; TORCH). As there was a substantial amount of heterogeneity, we performed a sensitivity analysis using a random‐effects model, and results were similar (RR 2.20, 95% CI 1.53 to 3.17) (Analysis 1.3).
Erlotinib versus vinorelbine: CHEN reported a RR of 0.83 (95% CI 0.19 to 3.67; 24 participants) for tumour response, indicating no significant differences in tumour response between the groups.
FASTACT 2 observed an objective response in 41 (84%) of 49 participants with EGFR‐activating mutations in the erlotinib plus cytotoxic chemotherapy group, and 7 (15%) of 48 participants in the chemotherapy plus placebo group (RR 5.74, 95% CI 2.86 to 11.50).
TOPICAL did not report tumour response for EGFR M+ participants.
3. Toxicity and adverse effects of treatment.
The most commonly reported adverse effects of treatment (AEs) in participants treated with erlotinib as a monotherapy were rash, diarrhoea, and fatigue (CHEN; ENSURE; EURTAC; GTOWG; OPTIMAL; TOPICAL; TORCH) (Table 1). Other AEs included mouth ulcers, constitutional symptoms, nausea, increased alanine aminotransferase , dyspnoea, and pulmonary toxicities. Cytotoxic chemotherapy was associated with greater grade 3/4 myelosuppression, fatigue (two trials) and anorexia (one trial). Commonly reported AEs in the trial that administered erlotinib in combination with cytotoxic chemotherapy were neutropenia, thrombocytopenia, and anorexia (FASTACT 2).
| Study | Definition of AE | Population | Top AE (listed according to intervention) | Second top AE (listed according to intervention) | Third top AE (listed according to intervention) | Top 3 AEs (listed according to comparator) |
| Afatinib trials | ||||||
| Grade >= 3 CTC (V3) AEs that were reported in > 10% of participants in either group and if there was a >= 10% difference between the groups | EGFR M+ only | Rash/acne: 16.2% (AFA) vs 0% (cytotoxic chemotherapy) | Diarrhoea: 14.4% (AFA) vs 0% (cytotoxic chemotherapy) | Paronychia: 11.4% (AFA) vs 0% (cytotoxic chemotherapy) | Neutropenia: 18% vs 0.4% Fatigue: 12.6% vs 1.3% Leukopenia: 8.1% vs 0.4% | |
| CTC (V3) Events are included if reported for >= 1% of participants in any treatment group | EGFR M+ only | Rash/acne: 14.6% (AFA) vs 0% (cytotoxic chemotherapy) | Diarrhoea: 5.4% (AFA) vs 0% (cytotoxic chemotherapy) | Stomatitis/mucositis: 5.4% (AFA) vs 0% (cytotoxic chemotherapy) | Neutropenia: 26.5% vs 0.4% Vomiting: 19.4% vs 0.8% Leukopenia: 15.1% vs 0.4% | |
| Erlotinib trials | ||||||
| Incidence rate >= 10% | Unselected population | Rash: 64.9% (ERL) vs NR (cytotoxic chemotherapy) | Diarrhoea: 29.8% (ERL) vs NR (cytotoxic chemotherapy) | Mouth ulceration: 14% (ERL) vs NR (cytotoxic chemotherapy) | Anorexia: 26.3% vs NR Diarrhoea: 12.3% vs NR Vomiting: 10.5% vs NR | |
| Grade ≥ 3 ≥ 5% in either arm | EGFR M+ only | Rash: 6.4% (ERL) vs 1% (cytotoxic chemotherapy) | Neutropenia, leukopenia, anaemia: All 0.9% (ERL) vs 25%, 14.4%, 12.5% respectively (cytotoxic chemotherapy) | ‐ | Neutropenia: 25% vs 0.9% Leukopenia: 14.4% vs 0.9% Anaemia: 12.5% vs 0.9% | |
| Grade 3/4 CTC (V3) Common AEs | EGFR M+ only | Rash: 13% (ERL) vs 0% (cytotoxic chemotherapy) | Fatigue: 6% (ERL) vs 20% (cytotoxic chemotherapy) | Diarrhoea: 5% (ERL) vs 0% (cytotoxic chemotherapy) | Neutropenia: 22% vs 0% Fatigue: 20% vs 6% Thrombocytopenia: 14% vs 0% | |
| Grade 3/4 CTC (V3) Most commonly reported | Unselected population | Neutropenia: 29% (ERL) vs 25% (cytotoxic chemotherapy) | Thrombocytopenia 14% (ERL) vs 14% (cytotoxic chemotherapy) | Anaemia: 11% (ERL) vs 9% (cytotoxic chemotherapy) | Neutropenia: 25% vs 29% Thrombocytopenia: 14% vs 14% Anaemia: 9% vs 11% | |
| Grade 3/4 | Unselected population | Rash: 12% (ERL) vs 0% (cytotoxic chemotherapy) | Diarrhoea: 6% (ERL) vs 2% (cytotoxic chemotherapy) | Constitutional symptoms: 3% (ERL) vs 5% (cytotoxic chemotherapy) | Neutropenia: 36% vs 0% Leukocytes: 33% vs 0% Haemoglobin: 11% vs 0.7% | |
| Grade 3/4 CTC (V3) AEs occurred in 3% or more in either treatment group | EGFR M+ only | Increased ALT: 4% (ERL) vs 1% (cytotoxic chemotherapy) | Skin rash: 2% (ERL) vs 0% (cytotoxic chemotherapy) | Diarrhoea: 1% (ERL) vs 0% (cytotoxic chemotherapy) | Neutropenia: 42% vs 0% Thrombocytopenia: 40% vs 0% Anaemia: 13% vs 0% | |
| CTC (V3) Specific AEs grade 3 or 4 | Unselected population | Dyspnoea: 59% (ERL) vs 64% (PLA) | Fatigue: 23% (ERL) vs 23% (PLA) | Diarrhoea: 8% (ERL) vs 1% (cytotoxic chemotherapy) | Dyspnoea: 64% vs 59% Fatigue: 23% vs 23% Anorexia: 5% vs 5% | |
| Worst toxicity experienced with first‐line treatment alone | Unselected population | Skin rash: 11% (ERL) vs 0% (cytotoxic chemotherapy) | Pulmonary toxicity: 9% (ERL) vs 6% (cytotoxic chemotherapy) | Fatigue: 8% (ERL) vs 12% (cytotoxic chemotherapy) | Neutropenia: 21% vs 0% Thrombocytopenia: 12% vs 0% Fatigue: 12% vs 8% | |
| Gefitinib trials | ||||||
| Grade 3 or 4 CTC (V3) | Unselected population | Rash: 29.3% (GEF) vs 2% (cytotoxic chemotherapy) | Anorexia: 13.8% (GEF) vs 57.3% (cytotoxic chemotherapy) | AST: 11.3% (GEF) vs 2% (cytotoxic chemotherapy) | Anorexia: 57.3% vs 13.9% Neutropenia: 54% vs 1.9% Fatigue: 45.3% vs 10.1% | |
| Grade 3/4 CTC Commonly occurring AEs | Unselected population | Thrombocytopenia*: 5.8% (GEF + cytotoxic chemotherapy) vs 5.6% (cytotoxic chemotherapy) | Rash: 3.6% (GEF + cytotoxic chemotherapy) vs 1.1% (cytotoxic chemotherapy) | Diarrhoea: 3.6% (GEF + cytotoxic chemotherapy) vs 2.3% (cytotoxic chemotherapy) | Thrombocytopenia*: 5.6% vs 5.8% Leukopenia: 2.5% vs 3.3% Diarrhoea: 2.3% vs 3.6% | |
| Grade 3/4 CTC (V2) Common drug‐related AEs | Unselected population | Diarrhoea: 9.9% (GEF + cytotoxic chemotherapy) vs 2.9% (cytotoxic chemotherapy) | Neutropenia: 6.7% (GEF + cytotoxic chemotherapy) vs 5.9% (cytotoxic chemotherapy) | Rash: 3.2% (GEF + cytotoxic chemotherapy) vs 1.5% (cytotoxic chemotherapy) | Neutropenia: 5.9% vs 6.7% Diarrhoea: 2.9% vs 9.9% Vomiting: 2.3% vs 2% | |
| Grade 3, 4, or 5 CTC (V3) At least 10% of participants in either treatment group and at least a 5% difference between arms | Unselected population | Diarrhoea: 3.8% (GEF) vs 1.4% (cytotoxic chemotherapy) | Any neutropenia: 3.7% (GEF) vs 67.1% (cytotoxic chemotherapy) | Rash: 3.1% (GEF) vs 0.8% (cytotoxic chemotherapy) | Any neutropenia: 67.1% vs 3.7% Leukopenia: 35% vs 1.5% Anaemia: 10.6% vs 2.2% | |
| Grade >= 3 CTC (V3) At least 10% of participants in either treatment group and at least a 5% difference between arms | EGFR M+ only | ATE: 26.3% (GEF) vs 0.9% (cytotoxic chemotherapy) | Rash: 5.3% (GEF) vs 2.7% (cytotoxic chemotherapy) | Appetite loss: 5.3% (GEF) vs 6.2% (cytotoxic chemotherapy) | Neutropenia: 65.5% vs 0.9% Arthralgia: 7.1% vs 0.9% Neuropathy: 6.2% vs 0% Appetite loss: 6.2% vs 5.3% | |
| Grade >= 3 CTC (V3) AEs occurred in 10% of either of the treatment groups | EGFR M+ only | ALT/AST: 27.5% (GEF) vs 2.3% (cytotoxic chemotherapy) | Rash: 2.3% (GEF) vs 0% (cytotoxic chemotherapy) | Fatigue: 2.3% (GEF) vs 2.3% (cytotoxic chemotherapy) | Neutropenia: 84% vs 0% Leucocytopenia: 50% vs 0% Anaemia: 17% vs 0% | |
| Grade 3+ Participants with at least 1 AE | Unselected population | Rash: 16% (GEF + cytotoxic chemotherapy) vs 0% (cytotoxic chemotherapy) | Vomiting: 10% (GEF) vs 8% (cytotoxic chemotherapy) | Neutropenia: 10% (GEF) vs 12% (cytotoxic chemotherapy) | Neutropenia: 12% vs 10% Nausea: 8% vs 5% Vomiting: 8% vs 10% | |
| Cetuximab trials | ||||||
| Grade 3/4 CTC (V3) Most frequent and relevant grade 3/4 AEs | Unselected population | Neutropenia: 62.5% (CET + cytotoxic chemotherapy) vs 56% (cytotoxic chemotherapy) | Leukopenia: 43.8% (CET + cytotoxic chemotherapy) vs 30.7% (cytotoxic chemotherapy) | Fatigue: 15.1% (CET + cytotoxic chemotherapy) vs 12.2% (cytotoxic chemotherapy) | Same AEs as intervention | |
| Grade 3/4 CTC (V2) AEs that were reported in > 5% of participants (G3/G4) or > 1% (G4) or AEs of special interest in either group | EGFR M+ expressing | Neutropenia: 53% (CET + cytotoxic chemotherapy) vs 51% (cytotoxic chemotherapy) | Leukopenia: 25% (CET + cytotoxic chemotherapy) vs 19% (cytotoxic chemotherapy) | Febrile neutropenia: 22% (CET + cytotoxic chemotherapy) vs 15% (cytotoxic chemotherapy) | Neutropenia: 52% (cytotoxic chemotherapy) vs 52% CET + cytotoxic chemotherapy Leukopenia: 19% (cytotoxic chemotherapy) vs 25% (CET vs cytotoxic chemotherapy) Anaemia: 16% (cytotoxic chemotherapy) vs 1% (CET + cytotoxic chemotherapy) | |
AE: adverse event
AFA: afatinib
ATE: aminotransferase elevation
ALT: alanine aminotransferase
AST: aspartate aminotransferase
CET: cetuximab
CTC: common toxicity criteria
ERL: erlotinib
EGFR M+: epidermal growth factor receptor mutation positive
GEF: gefitinib
NR: not reported
PLA: placebo
*Neutropenia was also reported as 5.8% for G3/4; as this rate was higher than the rate for all participants (5%) it was not included in the table.
4. Quality of life
Two trials reported on the quality of life (QoL) of EGFR M+ participants (OPTIMAL; TORCH). One trial used the Lung Cancer Symptom Scale (LCSS) to measure QoL, but compliance was so poor that the authors regarded the analysis as inconclusive (EURTAC).
QoL was measured but not reported in the trial reports in GTOWG, and was not available for the EGFR M+ subgroup in three trials (CHEN; FASTACT 2; TOPICAL).
TORCH used the the European Organisation for Research and Treatment of Cancer (EORTC) Quality of Life Questionnaire ‐ Core 30 (QLQ‐C30) and the lung cancer‐specific module (EORTC QLQ‐LC13) to evaluate QoL. The number of participants improved/stable/worse was reported for selected and unselected participants receiving erlotinib and chemotherapy. Improvement in terms of global QoL and physical functioning was particularly evident in the small numbers of EGFR M+ participants (n = 36/39 available for analysis) for erlotinib compared to cytotoxic chemotherapy.
OPTIMAL used the Functional Assessment of Cancer Therapy‐Lung (FACT‐L), LCSS, and Trial Outcome Index (TOI) to assess QoL. The odds ratios (ORs) (with covariates EGFR mutation type, smoking history, and histological type) were in favour of erlotinib and were 6.69 (95% CI 3.01 to 14.85; P = 0.0001), 7.54 (95% CI 3.38 to 16.85; P = 0.0001), and 8.07 (95% CI 3.57 to 18.26; P = 0.0001), respectively.
In the ENSURE trial, deterioration in TOI was 11.4 months for erlotinib compared to 4.2 months for chemotherapy (HR 0.51, 95% CI 0.34 to 0.76; P = 0.0006), and time to deterioration in QoL was 8.2 months for erlotinib compared to 2.8 months for chemotherapy (HR 0.64, 95% CI 0.44 to 0.93; P = 0.0168).
5. Symptom palliation
In the TORCH trial, the time to deterioration curves for cough, dyspnoea, and pain in the first 20 weeks were visually assessed for erlotinib versus chemotherapy, and no major differences were observed. No statistical analyses were provided by the authors.
The OPTIMAL trial reported that the time to improvement of symptoms on the FACT‐L, TOI, and LCSS (sometimes abbreviated to Lung Cancer Subscale (LCSS)) was significantly shorter for erlotinib compared to chemotherapy: FACT‐L 1.51 versus 3.19 months (P = 0.0067); TOI 2.79 versus 3.48 months (P = 0.003); LCSS 1.48 versus 3.15 months (P = 0.0010). There was also significant correlation between overall response and improvement in symptom scores (P = 0.0006, 0.0002, and 0.0213 for FACT‐L, TOI, and LCSS, respectively).
In the ENSURE trial, preliminary data using the FACT‐L showed that time to symptomatic progression was 13.8 months for erlotinib compared to 5.5 months for chemotherapy (HR 0.56, 95% CI 0.36 to 0.87; P = 0.0076).
Gefitinib versus cytotoxic chemotherapy
Primary outcome: Overall survival
We could not combine data for all four trials comparing gefitinib to platinum‐based chemotherapy (First‐SIGNAL; IPASS; NEJSG; WJTOG3405), as two trials reported only adjusted analyses (IPASS; NEJSG). It is not advisable to combine adjusted and unadjusted estimates.
Gefitinib versus gemcitabine plus cisplatin: One trial, First‐SIGNAL, reported a HR of 1.04 (95% CI 0.50 to 2.20)
Gefitinib versus carboplatin and paclitaxel: Pooled analysis of the two trials indicated no significant difference in OS between the groups (HR 0.95, 95% CI 0.77 to 1.18; I2 = 0) (IPASS; NEJSG).
Gefitinib versus docetaxel plus cisplatin: WJTOG3405 reported a HR of 1.25 (95% CI 0.88 to 1.78), indicating no significant difference in OS between the groups (Analysis 2.1).
Gefitinib and platinum‐based chemotherapy versus platinum‐based chemotherapy. INTACT 1 and INTACT 2 reported a combined HR of 1.77 (95% CI 0.50 to 6.23), indicating no significant difference in OS between the groups. Yu 2014 did not report on OS.
Secondary outcomes
1. Progression‐free survival
Gefitinib versus gemcitabine plus cisplatin: First‐SIGNAL reported a HR of 0.54 (95% CI 0.27 to 1.10), indicating no significant difference in PFS between the groups.
Gefitinib versus paclitaxel plus carboplatin: The pooled treatment effect estimate for two trials showed a significant difference in PFS between the groups, favouring gefitinib (HR 0.39, 95% CI 0.32 to 0.48; I2 = 73%) (IPASS; NEJSG). As there was a substantial amount of heterogeneity, we performed a sensitivity analysis using a random‐effects model, and results were similar (HR 0.39, 95% CI 0.26 to 0.59).
Gefitinib versus docetaxel plus cisplatin: WJTOG3405 reported a significant difference in PFS favouring gefitinib (HR 0.49, 95% CI 0.34 to 0.71) (Analysis 2.2).
Gefitinib and cytotoxic chemotherapy versus cytotoxic chemotherapy: INTACT 1 and INTACT 2 reported a HR of 0.55 (95% CI 0.19 to 1.60), indicating no significant difference in PFS between the groups in a combined total of 32 participants.
Yu 2014 reported a HR of 0.20 (95% CI 0.05 to 0.75) for PFS for comparison of gefitinib plus pemetrexed and cisplatin vs pemetrexed plus cisplatin.
IPASS and NEJSG both showed an improvement in PFS for the exon 19 deletion in the gefitinib population.
2. Tumour response
The pooled treatment effect estimate for four trials, First‐SIGNAL, IPASS, NEJSG, and WJTOG3405, favoured gefitinib (RR 1.87, 95% CI 1.60 to 2.19; I2 = 58%) (Analysis 2.3). As there was a substantial amount of heterogeneity, we performed a sensitivity analysis using a random‐effects model, and results were similar (RR 1.92, 95% CI 1.46 to 2.52).
INTACT 1 and INTACT 2 showed the response rates for gefitinib plus cytotoxic chemotherapy were the same as for cytotoxic chemotherapy alone (30.4% versus 28.7%). Yu 2014 reported a response rate of 77% for cytotoxic chemotherapy plus gefitinib compared to cytotoxic chemotherapy alone (P = 0.13).
Response at cross‐over after progression on first‐line treatment
NEJSG reported that 28.2% of 52 participants responded to carboplatin and paclitaxel after progressing on gefitinib, and 58.5% of 106 participants responded to gefitinib after progressing on carboplatin and paclitaxel.
INTACT 1 and INTACT 2 reported that 13 out of 18 (72%) of EGFR M+ participants responded to gefitinib plus cytotoxic chemotherapy, while 2 out of 5 (40%) of EGFR M+ participants responded to cytotoxic chemotherapy alone.
3. Toxicity and adverse effects of treatment
The most commonly reported AE for gefitinib monotherapy was rash, followed by liver toxicity, anorexia, and diarrhoea (First‐SIGNAL; IPASS; NEJSG; WJTOG3405) (Table 1). Cytoxic chemotherapy was associated with greater grade 3/4 myelosuppression in all comparisons and greater anorexia in one trial. The commonly reported AEs for gefitinib plus cytotoxic chemotherapy were thrombocytopenia, rash, diarrhoea and neutropenia (INTACT 1; INTACT 2).
4. Quality of life
Two trials reported on QoL (IPASS; NEJSG). QoL was measured but not reported in the trial reports in one trial (INTACT 2), not measured in two trials (INTACT 1; WJTOG3405), and not available for the EGFR M+ subgroup in one trial (First‐SIGNAL).
IPASS used the FACT‐L and TOI symptom improvement by the LCSS and achieved 89.5% compliance for the cytotoxic chemotherapy group and 94.8% for the gefitinib group. Gefitinib was significantly favoured over carboplatin plus paclitaxel in the proportion of participants showing improvement in FACT‐L total score, TOI, and LCSS (FACT‐L total score 70.2% versus 44.5% (OR 3.01, 95% CI 1.79 to 5.07), TOI 70.2% versus 38.3% (OR 3.96, 95% CI 2.33 to 6.71), LCSS 75.6% versus 53.9% (OR 2.70, 95% CI 1.58 to 4.62)). The time‐to‐deterioration data showed a median of 15.6 months for gefitinib compared to 3.0 months for cytotoxic chemotherapy for FACT‐L; 16.6 months for gefitinib compared to 2.9 months for cytotoxic chemotherapy for TOI; and 11.3 months for gefitinib compared to 2.9 months for cytotoxic chemotherapy for LCSS. In the 131 participants in the gefitinib group who improved, the median time to improvement in all three scores was either 8 or 11 days.
NEJSG assessed QoL weekly using the Care Notebook and achieved compliance in 72 participants (63%) on chemotherapy and 76 participants (69%) on gefitinib. They used three categories of physical, mental, and "life" well‐being, each of which had three subcategories. The number of participants improved/stable/worse was also reported, and there was no difference between the treatment arms in mental well‐being. However, the physical and life scales were all better for gefitinib than for cytotoxic chemotherapy. The data for daily functioning was quoted as HR 0.32 (95% CI 0.17 to 0.59; P<0001).
5. Symptom palliation
In the NEJSG trial, participants who received gefitinib had a significantly longer time to deterioration up to 20 weeks than participants who received paclitaxel plus carboplatin using both 9.1% and 27.3% levels of deterioration. The data for 27.3% deterioration for pain and shortness of breath showed HR 0.28 (95% CI 0.17 to 0.46; P = 0.0001) in favour of gefitinib.
Afatinib versus cisplatin‐based chemotherapy
Afatinib versus pemetrexed plus cisplatin: One trial considered this comparison (LUX‐Lung 3).
Afatinib versus gemcitabine plus cisplatin: One trial considered this comparison (LUX‐Lung 6).
Primary outcome: Overall survival
The pooled treatment effect estimate indicated no significant difference in OS between the groups (HR 0.93, 95% CI 0.74 to 1.17; I2 = 0; 2 trials) (Analysis 3.1), although data for LUX‐Lung 6 were immature. A preliminary report of a pooled analysis of participants with an exon 19 deletion or L858R mutation showed improved survival for afatinib compared to cytotoxic chemotherapy in participants with an exon 19 deletion (HR 0.81, 95% CI 0.66 to 0.99; P= 0.037) (Yang 2014). We did not formally assess analysis of mutation site in this review.
Secondary outcomes
1. Progression‐free survival
The pooled treatment effect estimate showed a significant difference in PFS between the groups favouring afatinib (HR 0.42, 95% CI 0.34 to 0.53; I2 = 90%; 2 trials) (Analysis 3.2). As there was a substantial amount of heterogeneity, we performed a sensitivity analysis using a random‐effects model, and results were similar (HR 0.41, 95% CI 0.20 to 0.83).
2. Tumour response
The pooled treatment effect estimate favoured afatinib (RR 2.71, 95% CI 2.12 to 3.46; I2 = 0%; 2 trials) (Analysis 3.3).
3. Toxicity and adverse effects of treatment
The most commonly reported grade 3/4 AEs in the afatinib‐treated participants were rash and diarrhoea, paronychia, and stomatitis/mucositis (LUX‐Lung 3; LUX‐Lung 6) (Table 1). Myelosuppression was consistently greater in the chemotherapy arms, while greater fatigue was seen in one comparison. Diarrhoea was worse with afatinib in both trials.
4. Quality of life
In LUX‐Lung 3, improvement was noted using the EORTC QLQ‐C30 scale in global health, physical, cognitive, and role function in favour of afatinib over cisplatin plus pemetrexed chemotherapy.
LUX‐Lung 6 also used the EORTC QLQ‐C30 scale and the lung cancer‐specific module QLQ‐LC13 with greater than 90% compliance. A greater percentage of participants showed improvement in global health scores/QoL scores (P < 0.0001), physical function (P < 0.0001), and social function (P < 0.0001) with afatinib when compared to cisplatin plus gemcitabine. Subgroup analysis showed delay in time to deterioration in cough, dyspnoea, and pain.
5. Symptom palliation
In the LUX‐Lung 3 trial, time‐to‐deterioration curves for cough and dyspnoea showed a significant effect in favour of afatinib (HR 0.60, 95% CI 0.41 to 0.87; P = 0.007) and (HR 0.68, 95% CI 0.50 to 0.93; P = 0.02), respectively. The HR for pain 0.83 (95% CI 0.62 to 1.10) was not statistically significant (P = 0.19).
In the LUX‐Lung 6 trial, time to deterioration for cough (HR 0.45; P = 0.0003), dyspnoea (HR 0.54; P < 0.0001), and pain (HR 0.70; P = 0.003) showed a significant effect in favour of afatinib (HR 0.56, 95% CI 0.41 to 0.77; P = 0.0002).
Cetuximab plus cytotoxic chemotherapy versus cytotoxic chemotherapy
Cetuximab plus paclitaxel or docetaxel plus carboplatin versus paclitaxel or docetaxel plus carboplatin: One trial considered this comparison (BMSO99).
Cetuximab plus vinorelbine plus cisplatin versus vinorelbine plus cisplatin: One trial considered this comparison (FLEX).
Primary outcome: Overall survival
We could not pool data for the two trials comparing cetuximab plus cytotoxic chemotherapy to cytotoxic chemotherapy, as one trial reported only an adjusted analysis (FLEX).
BMSO99 reported a HR of 1.62 (95% CI 0.54 to 4.84), indicating no significant difference in OS between the groups (Analysis 4.1).
FLEX reported a HR of 1.48 (95% CI 0.77 to 2.82), indicating no significant difference in OS between the groups (Analysis 4.1).
Secondary outcomes
1. Progression‐free survival
We could not pool data for the two trials comparing cetuximab plus cytotoxic chemotherapy to cytotoxic chemotherapy, as one trial reported only an adjusted analysis (FLEX).
BMSO99 reported a HR of 1.17 (95% CI 0.36 to 3.80), indicating no significant difference in PFS between the groups (Analysis 4.2).
FLEX reported a HR of 0.92 (95% CI 0.53 to 1.60), indicating no significant difference in PFS between the groups (Analysis 4.2).
2. Tumour response
The pooled treatment effect estimate (RR 1.43, 95% CI 0.83 to 2.47; I2 = 40%; 2 trials) indicated no significant difference between the groups (Analysis 4.3).
3. Toxicity and adverse effects of treatment
The most commonly reported AEs in the cetuximab‐treated participants were neutropenia, leukopenia, febrile neutropenia, and fatigue (BMSO99; FLEX) (Table 1).
4. Quality of life
FLEX used the EORTC QLQ‐C30 and LCSS, and found no difference in QoL between the groups.
QoL was not available for the EGFR M+ subgroup in BMSO99.
5. Symptom palliation
Neither trial reported specifically on symptom palliation.
Toxicity and adverse effects of treatment ‐ general comments
The reporting of AEs differed across the 19 included trials. We described in Table 1 the trial‐defined reporting of AEs, and tabulated the three most frequently occurring grade 3 or 4 AE for both the intervention and comparator arms of each trial. The data reported were for overall trial populations, and therefore include non‐EGFR M+ participants in trials where these were unselected. The trials are grouped according to the EGFR‐targeted treatment employed (erlotinib, gefitinib, afatinib, cetuximab).
LUX‐Lung 3 and LUX‐Lung 6 reported three and two participants with interstitial lung disease, respectively (1%) in the afatinib arms.
The AEs associated with cytotoxic chemotherapy in all comparisons were neutropenia, fatigue, leukopenia, vomiting, anaemia, decreased appetite, diarrhoea, anorexia, thrombocytopenia, arthralgia, neuropathy, and dyspnoea.
Assessment of reporting biases
We have not included a funnel plot in the current review as we did not include a sufficient number of trials (n = 10) in any meta‐analysis. However, we devised and carried out a thorough search strategy to reduce the impact of publication bias.
Subgroup analyses
We did not include sufficient trials to allow subgroup analyses of smoking history, age, sex, ethnicity, type of mutation, or performance status.
Sensitivity analyses
We did not include sufficient trials in any one meta‐analysis to allow us to undertake the sensitivity analyses specified in the Methods section. However, where we detected moderate heterogeneity, we used a random‐effects model as a sensitivity analysis to compare results with the fixed‐effect model. We have reported these in the Effects of interventions section.
Network meta‐analysis
We considered that network meta‐analysis was not appropriate because of the different populations aross the included trials. We identified other barriers to conducting network meta‐analysis: two trials reported adjusted analyses (IPASS; NEJSG), whereas all other trials reported unadjusted analyses; participants in all trials were allowed to switch treatment after progression, and we had no information regarding how this was handled in the analysis for OS; and finally, the Kaplan‐Meier plots shown in the trial reports crossed in four trials, indicating that using a Cox proportional hazards model may not be appropriate.
Summary of findings table
We have presented tables for pooled analyses for the outcomes of OS and PFS: summary of findings Table for the main comparison; summary of findings Table 2; summary of findings Table 3.
Discusión
Resumen de los resultados principales
Esta revisión incluyó 19 ECA con un total combinado de 2317 participantes con CPCNP M+ RFCE. Se identificaron cuatro tratamientos dirigidos al RFCE: erlotinib (ocho ensayos); gefitinib (siete ensayos); afatinib (dos ensayos); y cetuximab (dos ensayos). No se consideró que el metanálisis de redes fuera apropiado debido a las diferentes poblaciones de los ensayos incluidos, el informe de los análisis ajustados versus los análisis no ajustados y el uso inapropiado del Modelo de Riesgos Instantáneos Proporcionales de Cox en algunos ensayos.
La variable principal de evaluación fue la supervivencia general (SG) y solamente un ensayo pequeño (n = 97) informó un efecto beneficioso estadísticamente significativo en la SG (en los participantes tratados con erlotinib más quimioterapia citotóxica versus quimioterapia citotóxica sola) (FASTACT 2). Ninguno de los 18 ensayos restantes incluidos demostró un efecto beneficioso sobre la SG del tratamiento dirigido en comparación con la quimioterapia citotóxica. No se demostraron efectos en la SG en los análisis agrupados de erlotinib en ENSURE, EURTAC y OPTIMAL. El análisis agrupado de dos ensayos de gefitinib, IPASS y NEJSG, y los dos ensayos de afatinib, LUX‐Lung 3 y LUX‐Lung 6, tampoco mostró un efecto beneficioso en la SG. Es importante señalar que en su mayoría los ensayos incluidos de monoterapia anti‐RFCE permitieron que los participantes cambiaran los tratamientos según la progresión de la enfermedad, lo que tendrá un efecto de confusión sobre cualquier análisis de la SG.
Para la variable secundaria de evaluación supervivencia libre de progresión (SLP), un análisis agrupado de cuatro ensayos de erlotinib demostró un efecto beneficioso estadísticamente significativo en comparación con la quimioterapia citotóxica (CRI 0,30; IC del 95%: 0,24 a 0,38; 595 participantes) (ENSURE; EURTAC; OPTIMAL; TORCH). De los ensayos no agrupados de erlotinib versus quimioterapia citotóxica, CHEN informó un efecto no significativo en la SLP del erlotinib (n = 24), y FASTACT 2 (n = 97) informó un efecto significativo en la SLP del erlotinib (CRI 0,25; IC del 95%: 0,16 a 0,39). El análisis agrupado de los ensayos de gefitinib IPASS y NEJSG (n = 491) demostró un efecto beneficioso significativo del gefitinib en comparación con paclitaxel con carboplatino (CRI 0,39; IC del 95%: 0,32 a 0,48). Un ensayo único, WJTOG3405, también demostró una diferencia significativa en la SLP que favoreció al gefitinib (CRI 0,49; IC del 95%: 0,34 a 0,71). Otro ensayo, First‐SIGNAL, no demostró efectos beneficiosos estadísticamente significativos del gefitinib en comparación con gemcitabina más cisplatino (n = 42). Los dos ensayos restantes que analizaron al gefitinib, INTACT 1 e INTACT 2, no informaron diferencias entre un régimen de gefitinib más quimioterapia citotóxica en comparación con quimioterapia citotóxica más placebo (n = 32). En los análisis agrupados de erlotinib y de gefitinib la heterogeneidad fue alta. Cinco ensayos mostraron una mejoría significativa en la SLP para el inhibidor de la tirosina‐quinasa (ITK) en los tumores que portaban la mutación Del19 en comparación con la quimioterapia (EURTAC; IPASS; LUX‐Lung 3; NEJSG; OPTIMAL). No se realizó un metanálisis de estos datos específicos del lugar de la mutación.
En el análisis de la respuesta tumoral, un análisis agrupado de cuatro ensayos de erlotinib con 387 participantes favoreció al tratamiento con erlotinib (CR 2,57; IC del 95%: 1,97 a 3,34) (EURTAC; GTOWG; OPTIMAL; TORCH). Un ensayo de erlotinib más quimioterapia citotóxica (n = 97) también favoreció al tratamiento con erlotinib (FASTACT 2), mientras que otro ensayo pequeño de erlotinib versus quimioterapia citotóxica no informó un efecto beneficioso del erlotinib (n = 24) (CHEN). Para gefitinib, los siete ensayos demostraron un efecto beneficioso estadísticamente significativo del gefitinib en comparación con la quimioterapia citotóxica: un análisis agrupado de cuatro ensayos con 648 participantes produjo un CR de 1,87 (IC del 95%: 1,60 a 2,19) (First‐SIGNAL; IPASS; NEJSG; WJTOG3405). Ambos ensayos de afatinib (n = 709) informaron un efecto beneficioso estadísticamente significativo del afatinib en comparación con la quimioterapia citotóxica (LUX‐Lung 3; LUX‐Lung 6); el análisis agrupado produjo un CR de 2,71 (IC del 95%: 2,12 a 3,46). En cuanto a los análisis de la SLP, la heterogeneidad fue alta para las comparaciones agrupadas de erlotinib y gefitinib y baja para los dos ensayos de afatinib. Ningún ensayo informó efectos beneficiosos del cetuximab (BMSO99; FLEX).
Los efectos adversos informados con más frecuencia en los pacientes tratados con monoterapia con ITK fueron erupción cutánea, diarrea, paroniquia, estomatitis / mucositis (afatinib) y erupción cutánea, diarrea y fatiga (erlotinib y gefitinib). Estos efectos adversos son consistentes con los enumerados en el Resumen de las Características del Producto para estos productos, que incluyen diarrea, erupción cutánea, enfermedad pulmonar intersticial, deficiencia hepática y trastornos oculares. Los participantes tratados con quimioterapia citotóxica presentaron efectos adversos generalmente asociados con este tratamiento, como neutropenia, neutropenia febril, leucopenia y fatiga. Sin embargo, fue difícil de caracterizar con exactitud este aspecto, así como comparar los efectos adversos entre los ensayos, debido a los diferentes métodos de información (definiciones utilizadas y estilos de informe). Este hecho es particularmente relevante para los efectos adversos poco frecuentes pero graves como la enfermedad pulmonar intersticial. Un metanálisis reciente de los ensayos de erlotinib y gefitinib informó una incidencia del 1,2% para la enfermedad pulmonar intersticial, con una tasa de mortalidad del 22,8% (Shi 2014). Los datos presentados de afatinib indican que esta complicación ocurre con igual frecuencia en los tres ITK, aunque no se proporcionaron datos sobre la duración del tratamiento. Además, se debe observar que los efectos adversos informados son relevantes para la población general de los ensayos, y en los 12 ensayos donde el estado de M+ RFCE no fue un criterio de inclusión, se basan en una población mucho más grande. Sin embargo, las comparaciones destacan las diferencias en los efectos adversos asociados con los ITK y con la quimioterapia citotóxica (Pilkington 2012).
Seis ensayos midieron la calidad de vida de los participantes con tumores M+ RFCE mediante algunos métodos diferentes (dos compararon afatinib con quimioterapia citotóxica, dos compararon erlotinib con quimioterapia citotóxica y dos compararon gefitinib con quimioterapia citotóxica); los seis ensayos informaron un efecto beneficioso del ITK en comparación con la quimioterapia citotóxica. Los tres ITK mostraron una paliación de los síntomas de tos, dolor y disnea, aunque la metodología utilizada no se estandarizó.
Cualquier efecto beneficioso en la supervivencia tiene que ser sopesado contra el aumento en la toxicidad. La mediana del número de ciclos de quimioterapia administrados en los brazos control fue cuatro de seis ciclos planificados cada tres semanas. En general los agentes orales se administraron hasta la progresión y parecieron ser mejor tolerados. Se calculó que la mediana de la duración del tratamiento fue de alrededor de nueve a 12 meses. En los dos ensayos donde se presentaron datos de gefitinib, el número de participantes que interrumpieron el tratamiento fue similar en los dos grupos, mientras que en el ensayo EURTAC una proporción mayor de participantes con quimioterapia interrumpieron debido a la toxicidad en comparación con los que recibieron erlotinib.
Compleción y aplicabilidad general de las pruebas
La supervivencia mediana de los pacientes con CPCNP avanzado estadios III, IV es alrededor de 12 meses, y para los adenocarcinomas es 18 meses. Actualmente no hay pruebas de que los aumentos en la SLP se traduzcan completamente en efectos beneficiosos en la SG, lo que es consistente con las pruebas bibliográficas actuales (Booth 2012). Sin embargo, hubo una variación amplia en los criterios de selección de los ensayos incluidos que incluyeron la edad, el sexo, el hábito de fumar y el método de secuenciación del RFCE. Los ensayos posteriores reclutaron solamente a participantes con mutaciones del RFCE comprobadas y observaron períodos de supervivencia más prolongados. Sin embargo, con la supervivencia relativamente corta del CPCNP, los efectos adversos y la calidad de vida con los tratamientos de primera o de segunda línea son importantes. En la mayoría de los ensayos la interpretación de la SG estuvo limitada por el cruzamiento. A partir de los datos limitados disponibles sobre el cruzamiento según la progresión de la enfermedad, al parecer los agentes dirigidos y los cototóxicos actúan sobre diferentes poblaciones de células.
La mutaciones del RFCE se pueden evaluar por varios métodos que incluyen la secuenciación directa de los tumores, las células tumorales circulantes (Maheswaran 2008), o el ADN acelular (Bai 2013). En primer lugar, la heterogeneidad en la proporción de células malignas y normales / estromales en los tejidos de muestra puede contribuir a la variación en la clasificación de los tumores como M+ RFCE o RFCE tipo agresivo según la localización de la muestra, como en la mayoría de los ensayos de esta revisión (Tsiatis 2010), y hay pruebas preliminares de la heterogeneidad del análisis de las mutaciones con la toma de muestras tisulares múltiples (Bai 2013). En segundo lugar, los aspectos metodológicos en la evaluación de las mutaciones del RFCE pueden contribuir a resultados falsos negativos (Vogelstein 2013). La clasificación solamente inmunohistoquímica de la mutación se excluyó de esta revisión.
Los datos sobre los tipos de mutaciones con respecto a la sensibilidad al tratamiento dirigido son limitados (EURTAC). De los tres sitios frecuentes de mutación, hay pruebas de que los tumores con mutaciones del codón 20 son resistentes al ITK para el RFCE, mientras que los tumores con mutaciones del exon 19 o L858R del codón 21 son sensibles al ITK para el RFCEYasuda 2011). La mejoría en la supervivencia de los pacientes con supresión del exon 19 que reciben afatinib en comparación con la quimioterapia citotóxica indica que se desarrollarán datos adicionales sobre la base de la caracterización molecular más detallada del CPCNP M+ RFCE (Yang 2014). Los ensayos de cetuximab evaluaron las mutaciones K‐RAS y HER‐2 y no demostraron un efecto predictivo de los marcadores biológicos (Linardou 2008). Ensayos no aleatorios han indicado que algunas mutaciones, principalmente la T790M del codón 20, pueden contribuir al desarrollo de resistencia adquirida a estos agentes (Kosaka 2006; Rosell 2011; Su 2012). Algunos ensayos no incluyeron la evaluación de las mutaciones de los exones 18 y 20, aunque sólo cuatro de los ensayos incluidos excluyeron las mutaciones T790M (FLEX; LUX‐Lung 3; LUX‐Lung 6; NEJSG).
Con la mejoraría de los datos sobre la individualización del tratamiento según los criterios morfológicos y moleculares, la elección del paciente puede ser un factor en la decisión de aceptar la toxicidad significativa (por ejemplo, de la quimioterapia citotóxica) en la etapa anterior o posterior al tratamiento del CPCNP. Esta revisión proporciona datos fuertes que apoyan al ITK de primera línea para el RFCE en los pacientes en los que se sabe que el estado de la mutación del RFCE es positivo. Como la prueba de la mutación no está universalmente disponible y el tiempo de respuesta del informe puede ser prolongado, la quimioterapia puede ser una opción de primera línea aceptable cuando se conocen el subtipo histológico y los antecedentes de tabaquismo en pacientes con buen estado funcional. El control de la calidad de la metodología para definir la mutación y un acuerdo internacional sobre la estandarización mejorarían la confianza en el uso de ITK para el RFCE en los pacientes con M+ RFCE.
Hay algunas pruebas publicadas de las diferencias étnicas en la toxicidad hematológica con platino, pues los pacientes asiáticos tienen una incidencia mayor de neutropenia grado 3/4 en comparación con los pacientes no asiáticos, según un análisis agrupado de 11 271 participantes en 50 ensayos de fase II y III (Hasegawa 2011). No está tan bien establecido si existen diferencias étnicas en la respuesta a las terapias dirigidas en el subgrupo con M+ RFCE, y hubo una variación amplia en la composición étnica de los ensayos informados. La mayoría de los datos provino de pacientes asiáticos, cuyos tumores pueden diferir en la composición genética, ya sea heredados o adquiridos a partir de la exposición a carcinógenos, con respecto a los tumores de los pacientes no asiáticos.
Calidad de la evidencia
Todos los ensayos incluidos fueron aleatorios y el número general de participantes (n = 2317) en los 19 ensayos proporciona un poder estadístico razonable para apoyar las conclusiones. Los participantes se distribuyeron entre cuatro farmacoterapias diferentes (erlotinib, gefitinib, afatinib y cetuximab), lo que reduce el número que proporcionó datos de cada tratamiento.
Se consideró que la calidad de las pruebas fue alta para todas las comparaciones (Resumen de los hallazgos para la comparación principal; Resumen de los hallazgos 2; Resumen de los hallazgos 3). Con la excepción de FASTACT 2, todos los ensayos fueron tuvieron un diseño abierto; sin embargo, todos excepto un ensayo, IPASS, informaron de manera independiente los resultados del examen radiográfico.
La tabla "Riesgo de sesgo" indica un riesgo mixto de sesgo entre los ensayos incluidos en la mayoría de los criterios de evaluación, y la mayoría de los ensayos tuvo riesgo incierto o alto de sesgo (Figura 2; Figura 3). Los dos ítems considerados con alto riesgo de sesgo entre los ensayos estuvieron relacionados con el cegamiento de la asignación al tratamiento de los participantes y el personal y el cegamiento de la evaluación de los resultados. El cegamiento de los participantes y los administradores es difícil de lograr en los ensayos que comparan tratamiento oral con tratamientos con quimioterapia intravenosa; incluso si el cegamiento de los procedimientos se realiza, la aparición de una erupción cutánea (un efecto secundario frecuente del tratamiento con un ITK) indicaría el régimen de tratamiento utilizado. FASTACT 2 se cegó en ambas asignaciones al tratamiento y la evaluación de imagenología. El cegamiento de la evaluación de los resultados es importante cuando los resultados del tiempo hasta el fracaso del tratamiento, como la SLP, son indicadores de la eficacia de tratamiento y la evaluación cegada de los resultados o la revisión cegada de la evaluación deben formar parte del protocolo del ensayo. De los ensayos grandes patrocinados por la industria, OPTIMAL no informó el cegamiento de la evaluación de los resultados para el erlotinib y tampoco lo hicieron IPASS o WJTOG3405 para el gefitinib. Se reconoce que algunos ensayos pueden haber realizado dichos procedimientos pero no lo informaron.
Las comparaciones con quimioterapia citotóxica en general fueron directas, pero hubo una variación amplia en la elección de la quimioterapia citotóxica en el brazo de comparación. Este hecho refleja la variación en la práctica clínica, en el estado funcional y la comorbilidad particulares de las poblaciones con CPCNP. Por ejemplo, el agente único vinorelbina, utilizado como comparador en dos de los ensayos más pequeños de erlotinib (CHEN; GTOWG), se asoció con una toxicidad inferior que las combinaciones de quimioterapia doble más utilizadas en los otros ensayos y los participantes de CHEN y GTOWG fueron seleccionados sobre la base de la edad (mayores de 70 años) y no precisamente por el estado funcional. Los ensayos también variaron en el grado en el que incluyeron pacientes que nunca fumaron o exfumadores, y en el cociente hombre/mujer. El factor principal que más contribuyó a la heterogeneidad fue el grupo étnico, ya que los ocho ensayos que reclutaron exclusivamente en Asia contribuyeron con el 64% de los participantes. Todos estos factores pueden contribuir a la variación en los fármacos de la quimioterapia citotóxica y del tratamiento dirigido. La heterogeneidad fue alta para la evaluación de la SLP en las comparaciones de erlotinib, gefitinib y afatinib en los datos agrupados.
Los resultados de esta revisión deben interpretarse con cautela. Sólo siete de los ensayos incluidos reclutaron solamente pacientes con mutaciones del RFCE (n = 1672). Lo anterior significa que los datos extraídos de los 12 ensayos restantes (n = 645) se derivaron de subgrupos, con todos los problemas que implica la interpretación de los datos de subgrupos. Sin embargo, vale la pena señalar que el subgrupo de pacientes con M+ RFCE en el ensayo IPASS, de 261, fue mayor que la población total de cuatro de los ensayos de solamente M+ RFCE (EURTAC; NEJSG; OPTIMAL; WJTOG3405). Se debe señalar adicionalmente que en cuatro ensayos los análisis de los tejidos se realizaron de forma retrospectiva en un número limitado de muestras que estuvieron disponibles al final del ensayo (BMSO99; FLEX; INTACT 1; INTACT 2). Sin embargo, estos cuatro ensayos proporcionaron datos de sólo 113 participantes, y 80 de estos participantes fueron de los ensayos de cetuximab. No se considera que este factor tenga una repercusión sobre las conclusiones generales con respecto a los tres ITK.
Los límites de confianza de los diagramas de SLP y SG fueron estrechos, con la excepción del ensayo pequeño de erlotinib (CHEN), e indican que los datos son precisos. Se observaron límites de confianza más amplios para la respuesta, lo que puede reflejar la naturaleza subjetiva de la evaluación, incluso con la revisión externa, así como las inquietudes actuales acerca de si la SLP es la mejor variable para la evaluación en los ensayos donde el cruzamiento es un factor (Booth 2012).
Hay pruebas de que los pacientes asiáticos tienen una proporción diferente de M+ RFCE y una relación dispar con el tabaquismo, lo que puede dar a entender que hay diferencias en la biología del CPCNP entre los individuos del grupo étnico asiático y no asiático. De los 2317 participantes informados en esta revisión, 1591 se reclutaron exclusivamente en ensayos realizados en países asiáticos. No se encontraron pruebas de que haya un grupo diferente de mutaciones en los pacientes asiáticos y blancos, o diferencias en sus perfiles de toxicidad para los brazos de tratamiento dirigido o de quimioterapia de los ensayos incluidos.
Sesgos potenciales en el proceso de revisión
Se excluyeron los ensayos que utilizaron tratamientos dirigidos al RFCE pero no informaron pruebas de mutaciones del RFCE en los participantes. Sin embargo, la inspección de los artículos de revisión y las listas de referencias indicó que en cuatro de estos ensayos (BMSO99; FLEX; INTACT 1; INTACT 2), se habían realizado análisis retrospectivos de las muestras de los tejidos de los participantes y los resultados se informaron en artículos separados de la publicación original de los ensayos. Es posible que haya otros análisis retrospectivos que no se identificaron; sin embargo, es probable que la población de pacientes de dichos análisis sea pequeña.
Acuerdos y desacuerdos con otros estudios o revisiones
Los resultados coinciden con el metanálisis de Ku 2011, que comparó gefitinib con quimioterapia de primera línea. Un metanálisis más reciente de 14 570 participantes que recibieron ITK en ECA de primera línea, de segunda línea y de mantenimiento también apoyó el efecto beneficioso en la SLP en los participantes M+ RFCE tratados con erlotinib y gefitinib (Lee 2013). Este análisis incluyó datos sobre subgrupos de participantes (n = 67) de TALENT, TOPICAL y TRIBUTE que no estaban disponibles al momento del análisis de esta revisión. La revisión Lee no analizó datos sobre las características de los participantes, la toxicidad y la calidad de vida (Lee 2013). Su análisis combinó los datos de diez ensayos de primera línea en un metanálisis de la SG y la SLP y mostró un CRI general de 0,43 (IC del 95%: 0,38 a 0,49; p < 0,001) para la SLP y ningún efecto en la SG. Como se describe anteriormente, este agrupamiento no se consideró apropiado desde el punto de vista estadístico, ya que se combinaron datos ajustados y no ajustados. Un metanálisis actualizado por el mismo grupo se centró en siete ensayos (ENSURE; EURTAC; LUX‐Lung 3; LUX‐Lung 6; NEJSG; OPTIMAL; WJTOG3405), y concluyó que los pacientes que nunca fumaron, los que presentan tumores con delecciones del exon 19 y las mujeres tuvieron un mayor efecto beneficioso con erlotinib que con quimioterapia (Lee 2015). Otras revisiones han combinado los datos de siete ensayos de fase III, en Hasegawa 2015, y ocho ensayos de fase III en Haaland 2014, para la quimioterapia de primera línea, y confirmaron el efecto beneficioso sobre la SLP y la respuesta. Los datos sobre el efecto beneficioso en los no fumadores son difíciles de interpretar en estos estudios. Un metanálisis de redes de 12 ensayos combinó los tratamientos de primera y segunda línea y concluyó que erlotinib, gefitinib y afatinib compartieron una eficacia similar (Liang 2014). La presente revisión de participantes de 19 ensayos incluye ensayos y datos comparables adicionales de los participantes con M+ RFCE 2317 que recibieron afatinib, erlotinib y gefitinib. Un metanálisis reciente de pacientes individuales de cuatro ECA de cetuximab, Pujol 2014, (que incluyó BMSO99 y FLEX) en el CPCNP informó una mejoría en la SLP en los cánceres de células escamosas (según un análisis de subgrupos) pero no en los carcinomas no escamocelulares, aunque estos datos no se analizaron por el estado de la mutación.
El análisis preespecificado del subgrupo Del19 mediante el análisis agrupado de ambos ensayos de afatinib demostró una ventaja en la SG del afatinib en comparación con la quimioterapia en ese subgrupo, mientras el subgrupo L858R (mutación del codón 21) no mostró efectos beneficiosos en la SG (Yang 2014). En particular, no se permitió el cruzamiento a afatinib en el brazo control, mientras que en la mayoría de las comparaciones de erlotinib y gefitinib con quimioterapia citotóxica se permitió el cruzamiento al ITK correspondiente. En general hubo una falta de datos sobre el efecto beneficioso en la SG de los inhibidores del RFCE, pero con una confianza baja debido a la inconsistencia y la imprecisión de los resultados.

Study flow diagram.

Risk of bias graph: review authors' judgements about each risk of bias item presented as percentages across all included studies.
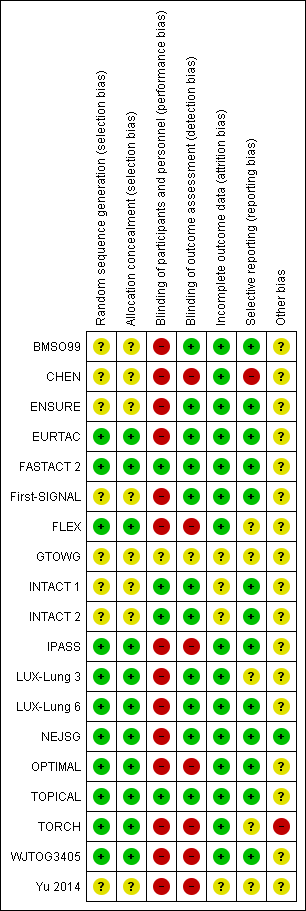
Risk of bias summary: review authors' judgements about each risk of bias item for each included trial.
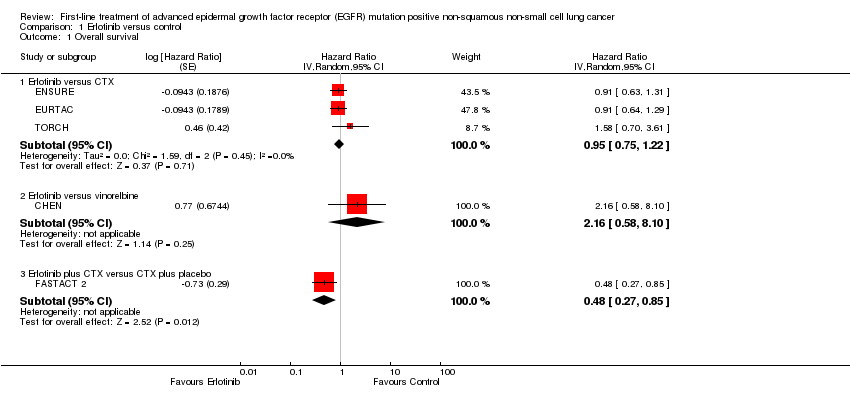
Comparison 1 Erlotinib versus control, Outcome 1 Overall survival.

Comparison 1 Erlotinib versus control, Outcome 2 Progression‐free survival.
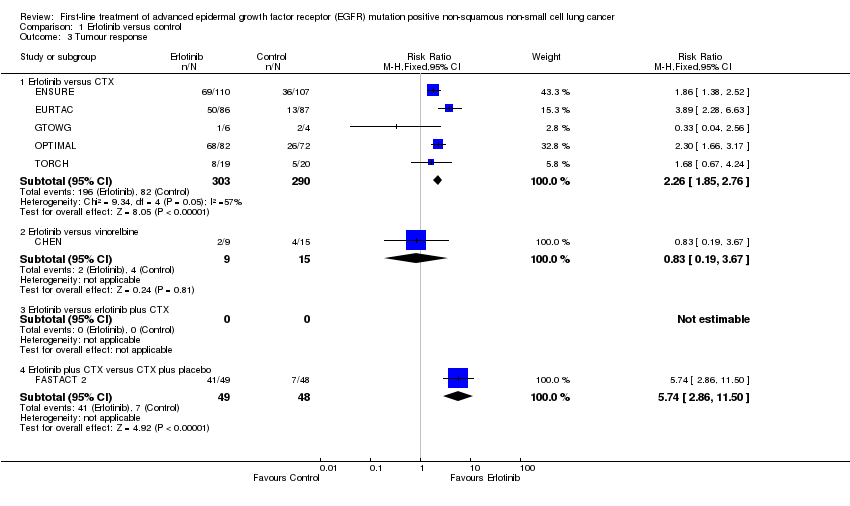
Comparison 1 Erlotinib versus control, Outcome 3 Tumour response.
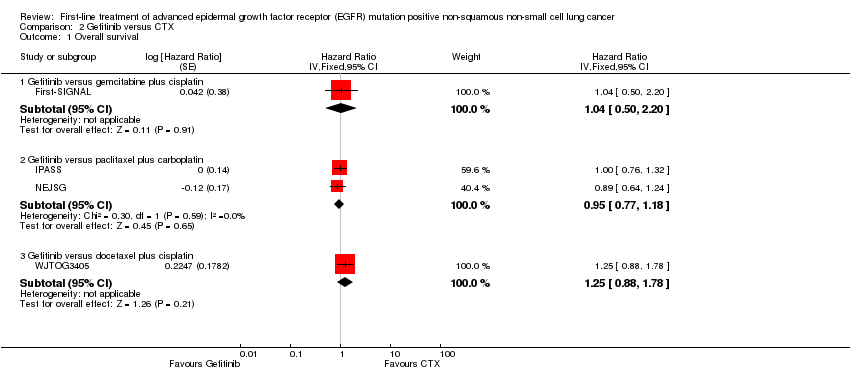
Comparison 2 Gefitinib versus CTX, Outcome 1 Overall survival.

Comparison 2 Gefitinib versus CTX, Outcome 2 Progression‐free survival.
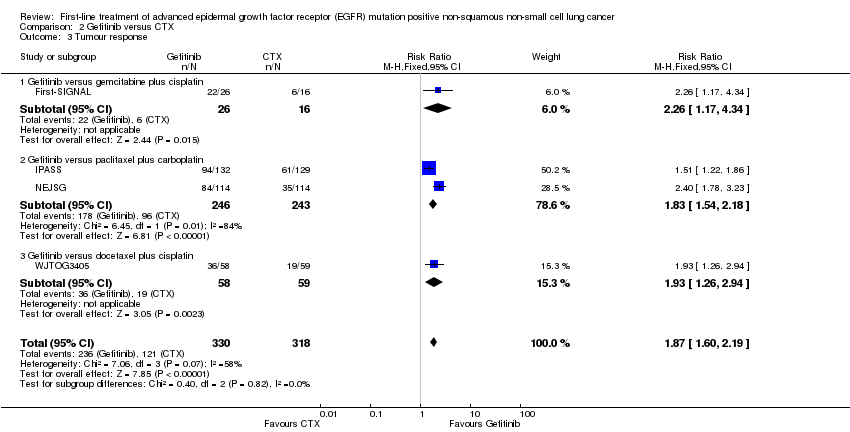
Comparison 2 Gefitinib versus CTX, Outcome 3 Tumour response.

Comparison 3 Afatinib versus CTX, Outcome 1 Overall survival.

Comparison 3 Afatinib versus CTX, Outcome 2 Progression‐free survival.
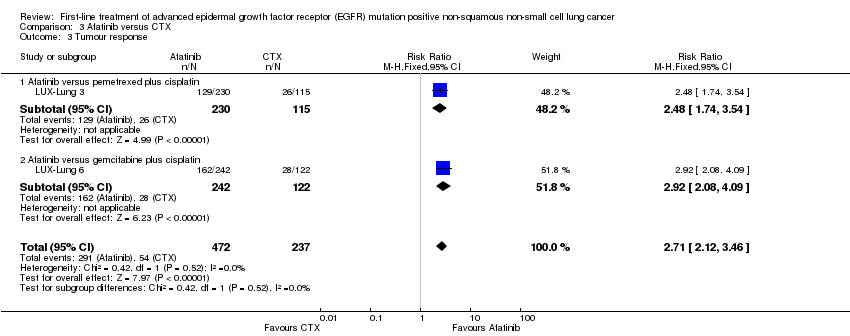
Comparison 3 Afatinib versus CTX, Outcome 3 Tumour response.
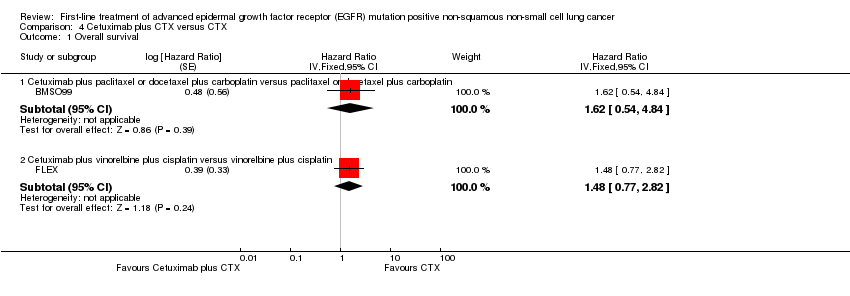
Comparison 4 Cetuximab plus CTX versus CTX, Outcome 1 Overall survival.

Comparison 4 Cetuximab plus CTX versus CTX, Outcome 2 Progression‐free survival.

Comparison 4 Cetuximab plus CTX versus CTX, Outcome 3 Tumour response.

Comparison 5 Gefitinib plus CTX versus CTX, Outcome 1 Progression‐free survival.
| First‐line treatment of advanced epidermal growth factor receptor (EGFR) mutation positive (M+) non‐squamous non‐small cell lung cancer (NSCLC): erlotinib comparisons | ||||||
| Patient or population: EGFR M+ patients with NSCLC Settings: oncology Intervention: erlotinib Comparison: control (cytotoxic chemotherapy) | ||||||
| Outcomes | Illustrative comparative risks* (95% CI) | Relative effect | No of participants | Quality of the evidence | Comments | |
| Assumed risk | Corresponding risk | |||||
| Control | Erlotinib | |||||
| Overall survival | 56 per 100 | 54 per 100 (46 to 63) | HR 0.95 (0.75, 1.22) | 429 (3 studies) | High | All trials were open label but included blinded independent review |
| Progression‐free survival | 73 per 100 | 33 per 100 (27 to 40) | HR 0.30 (0.24, 0.38) | 595 (4 studies) | High | All trials were open label but included blinded independent review |
| *The basis for the assumed risk is calculated as the event rate in the treatment group | ||||||
| GRADE Working Group grades of evidence | ||||||
| First‐line treatment of advanced epidermal growth factor receptor (EGFR) mutation positive (M+) non‐squamous non‐small cell lung cancer (NSCLC): gefitinib comparisons | ||||||
| Patient or population: EGFR M+ patients with NSCLC Settings: oncology Intervention: gefitinib Comparison: paclitaxel + carboplatin | ||||||
| Outcomes | Illustrative comparative risks* (95% CI) | Relative effect | No of participants | Quality of the evidence | Comments | |
| Assumed risk | Corresponding risk | |||||
| Paclitaxel + carboplatin | Gefitinib | |||||
| Overall survival | 67 per 100 | 66 per 100 (58 to 73) | HR 0.95 (0.77 to 1.18) | 489 (2 studies) | High | Both trials were open label. IPASS did not report independent blinded review |
| Progression‐free survival | 89 per 100 | 57 per 100 (50 to 65) | HR 0.39 (0.32 to 0.48) | 485 (2 studies) | High | Both trials were open label. IPASS did not report independent blinded review |
| *The basis for the assumed risk is calculated as the event rate in the treatment group | ||||||
| GRADE Working Group grades of evidence | ||||||
| First‐line treatment of advanced epidermal growth factor receptor (EGFR) mutation positive (M+) non‐squamous non‐small cell lung cancer (NSCLC): afatinib comparisons | ||||||
| Patient or population: EGFR M+ patients with NSCLC Settings: oncology Intervention: afatinib Comparison: cytotoxic chemotherapy | ||||||
| Outcomes | Illustrative comparative risks* (95% CI) | Relative effect | No of participants | Quality of the evidence | Comments | |
| Assumed risk | Corresponding risk | |||||
| Cytotoxic chemotherapy | Afatinib | |||||
| Overall survival | 46 per 100 | 44 per 100 (37 to 52) | HR 0.93 (0.74 to 1.17) | 709 (2 studies) | High | Both trials were open label but included blinded independent central review |
| Progression‐free survival | 56 per 100 | 29 per 100 (24 to 35) | HR 0.42 (0.34 to 0.53) | 709 (2 studies) | High | Both trials were open label but included blinded independent central review |
| *The basis for the assumed risk is calculated as the event rate in the treatment group | ||||||
| GRADE Working Group grades of evidence | ||||||
| Study | Definition of AE | Population | Top AE (listed according to intervention) | Second top AE (listed according to intervention) | Third top AE (listed according to intervention) | Top 3 AEs (listed according to comparator) |
| Afatinib trials | ||||||
| Grade >= 3 CTC (V3) AEs that were reported in > 10% of participants in either group and if there was a >= 10% difference between the groups | EGFR M+ only | Rash/acne: 16.2% (AFA) vs 0% (cytotoxic chemotherapy) | Diarrhoea: 14.4% (AFA) vs 0% (cytotoxic chemotherapy) | Paronychia: 11.4% (AFA) vs 0% (cytotoxic chemotherapy) | Neutropenia: 18% vs 0.4% Fatigue: 12.6% vs 1.3% Leukopenia: 8.1% vs 0.4% | |
| CTC (V3) Events are included if reported for >= 1% of participants in any treatment group | EGFR M+ only | Rash/acne: 14.6% (AFA) vs 0% (cytotoxic chemotherapy) | Diarrhoea: 5.4% (AFA) vs 0% (cytotoxic chemotherapy) | Stomatitis/mucositis: 5.4% (AFA) vs 0% (cytotoxic chemotherapy) | Neutropenia: 26.5% vs 0.4% Vomiting: 19.4% vs 0.8% Leukopenia: 15.1% vs 0.4% | |
| Erlotinib trials | ||||||
| Incidence rate >= 10% | Unselected population | Rash: 64.9% (ERL) vs NR (cytotoxic chemotherapy) | Diarrhoea: 29.8% (ERL) vs NR (cytotoxic chemotherapy) | Mouth ulceration: 14% (ERL) vs NR (cytotoxic chemotherapy) | Anorexia: 26.3% vs NR Diarrhoea: 12.3% vs NR Vomiting: 10.5% vs NR | |
| Grade ≥ 3 ≥ 5% in either arm | EGFR M+ only | Rash: 6.4% (ERL) vs 1% (cytotoxic chemotherapy) | Neutropenia, leukopenia, anaemia: All 0.9% (ERL) vs 25%, 14.4%, 12.5% respectively (cytotoxic chemotherapy) | ‐ | Neutropenia: 25% vs 0.9% Leukopenia: 14.4% vs 0.9% Anaemia: 12.5% vs 0.9% | |
| Grade 3/4 CTC (V3) Common AEs | EGFR M+ only | Rash: 13% (ERL) vs 0% (cytotoxic chemotherapy) | Fatigue: 6% (ERL) vs 20% (cytotoxic chemotherapy) | Diarrhoea: 5% (ERL) vs 0% (cytotoxic chemotherapy) | Neutropenia: 22% vs 0% Fatigue: 20% vs 6% Thrombocytopenia: 14% vs 0% | |
| Grade 3/4 CTC (V3) Most commonly reported | Unselected population | Neutropenia: 29% (ERL) vs 25% (cytotoxic chemotherapy) | Thrombocytopenia 14% (ERL) vs 14% (cytotoxic chemotherapy) | Anaemia: 11% (ERL) vs 9% (cytotoxic chemotherapy) | Neutropenia: 25% vs 29% Thrombocytopenia: 14% vs 14% Anaemia: 9% vs 11% | |
| Grade 3/4 | Unselected population | Rash: 12% (ERL) vs 0% (cytotoxic chemotherapy) | Diarrhoea: 6% (ERL) vs 2% (cytotoxic chemotherapy) | Constitutional symptoms: 3% (ERL) vs 5% (cytotoxic chemotherapy) | Neutropenia: 36% vs 0% Leukocytes: 33% vs 0% Haemoglobin: 11% vs 0.7% | |
| Grade 3/4 CTC (V3) AEs occurred in 3% or more in either treatment group | EGFR M+ only | Increased ALT: 4% (ERL) vs 1% (cytotoxic chemotherapy) | Skin rash: 2% (ERL) vs 0% (cytotoxic chemotherapy) | Diarrhoea: 1% (ERL) vs 0% (cytotoxic chemotherapy) | Neutropenia: 42% vs 0% Thrombocytopenia: 40% vs 0% Anaemia: 13% vs 0% | |
| CTC (V3) Specific AEs grade 3 or 4 | Unselected population | Dyspnoea: 59% (ERL) vs 64% (PLA) | Fatigue: 23% (ERL) vs 23% (PLA) | Diarrhoea: 8% (ERL) vs 1% (cytotoxic chemotherapy) | Dyspnoea: 64% vs 59% Fatigue: 23% vs 23% Anorexia: 5% vs 5% | |
| Worst toxicity experienced with first‐line treatment alone | Unselected population | Skin rash: 11% (ERL) vs 0% (cytotoxic chemotherapy) | Pulmonary toxicity: 9% (ERL) vs 6% (cytotoxic chemotherapy) | Fatigue: 8% (ERL) vs 12% (cytotoxic chemotherapy) | Neutropenia: 21% vs 0% Thrombocytopenia: 12% vs 0% Fatigue: 12% vs 8% | |
| Gefitinib trials | ||||||
| Grade 3 or 4 CTC (V3) | Unselected population | Rash: 29.3% (GEF) vs 2% (cytotoxic chemotherapy) | Anorexia: 13.8% (GEF) vs 57.3% (cytotoxic chemotherapy) | AST: 11.3% (GEF) vs 2% (cytotoxic chemotherapy) | Anorexia: 57.3% vs 13.9% Neutropenia: 54% vs 1.9% Fatigue: 45.3% vs 10.1% | |
| Grade 3/4 CTC Commonly occurring AEs | Unselected population | Thrombocytopenia*: 5.8% (GEF + cytotoxic chemotherapy) vs 5.6% (cytotoxic chemotherapy) | Rash: 3.6% (GEF + cytotoxic chemotherapy) vs 1.1% (cytotoxic chemotherapy) | Diarrhoea: 3.6% (GEF + cytotoxic chemotherapy) vs 2.3% (cytotoxic chemotherapy) | Thrombocytopenia*: 5.6% vs 5.8% Leukopenia: 2.5% vs 3.3% Diarrhoea: 2.3% vs 3.6% | |
| Grade 3/4 CTC (V2) Common drug‐related AEs | Unselected population | Diarrhoea: 9.9% (GEF + cytotoxic chemotherapy) vs 2.9% (cytotoxic chemotherapy) | Neutropenia: 6.7% (GEF + cytotoxic chemotherapy) vs 5.9% (cytotoxic chemotherapy) | Rash: 3.2% (GEF + cytotoxic chemotherapy) vs 1.5% (cytotoxic chemotherapy) | Neutropenia: 5.9% vs 6.7% Diarrhoea: 2.9% vs 9.9% Vomiting: 2.3% vs 2% | |
| Grade 3, 4, or 5 CTC (V3) At least 10% of participants in either treatment group and at least a 5% difference between arms | Unselected population | Diarrhoea: 3.8% (GEF) vs 1.4% (cytotoxic chemotherapy) | Any neutropenia: 3.7% (GEF) vs 67.1% (cytotoxic chemotherapy) | Rash: 3.1% (GEF) vs 0.8% (cytotoxic chemotherapy) | Any neutropenia: 67.1% vs 3.7% Leukopenia: 35% vs 1.5% Anaemia: 10.6% vs 2.2% | |
| Grade >= 3 CTC (V3) At least 10% of participants in either treatment group and at least a 5% difference between arms | EGFR M+ only | ATE: 26.3% (GEF) vs 0.9% (cytotoxic chemotherapy) | Rash: 5.3% (GEF) vs 2.7% (cytotoxic chemotherapy) | Appetite loss: 5.3% (GEF) vs 6.2% (cytotoxic chemotherapy) | Neutropenia: 65.5% vs 0.9% Arthralgia: 7.1% vs 0.9% Neuropathy: 6.2% vs 0% Appetite loss: 6.2% vs 5.3% | |
| Grade >= 3 CTC (V3) AEs occurred in 10% of either of the treatment groups | EGFR M+ only | ALT/AST: 27.5% (GEF) vs 2.3% (cytotoxic chemotherapy) | Rash: 2.3% (GEF) vs 0% (cytotoxic chemotherapy) | Fatigue: 2.3% (GEF) vs 2.3% (cytotoxic chemotherapy) | Neutropenia: 84% vs 0% Leucocytopenia: 50% vs 0% Anaemia: 17% vs 0% | |
| Grade 3+ Participants with at least 1 AE | Unselected population | Rash: 16% (GEF + cytotoxic chemotherapy) vs 0% (cytotoxic chemotherapy) | Vomiting: 10% (GEF) vs 8% (cytotoxic chemotherapy) | Neutropenia: 10% (GEF) vs 12% (cytotoxic chemotherapy) | Neutropenia: 12% vs 10% Nausea: 8% vs 5% Vomiting: 8% vs 10% | |
| Cetuximab trials | ||||||
| Grade 3/4 CTC (V3) Most frequent and relevant grade 3/4 AEs | Unselected population | Neutropenia: 62.5% (CET + cytotoxic chemotherapy) vs 56% (cytotoxic chemotherapy) | Leukopenia: 43.8% (CET + cytotoxic chemotherapy) vs 30.7% (cytotoxic chemotherapy) | Fatigue: 15.1% (CET + cytotoxic chemotherapy) vs 12.2% (cytotoxic chemotherapy) | Same AEs as intervention | |
| Grade 3/4 CTC (V2) AEs that were reported in > 5% of participants (G3/G4) or > 1% (G4) or AEs of special interest in either group | EGFR M+ expressing | Neutropenia: 53% (CET + cytotoxic chemotherapy) vs 51% (cytotoxic chemotherapy) | Leukopenia: 25% (CET + cytotoxic chemotherapy) vs 19% (cytotoxic chemotherapy) | Febrile neutropenia: 22% (CET + cytotoxic chemotherapy) vs 15% (cytotoxic chemotherapy) | Neutropenia: 52% (cytotoxic chemotherapy) vs 52% CET + cytotoxic chemotherapy Leukopenia: 19% (cytotoxic chemotherapy) vs 25% (CET vs cytotoxic chemotherapy) Anaemia: 16% (cytotoxic chemotherapy) vs 1% (CET + cytotoxic chemotherapy) | |
| AE: adverse event PLA: placebo *Neutropenia was also reported as 5.8% for G3/4; as this rate was higher than the rate for all participants (5%) it was not included in the table. | ||||||
| Outcome or subgroup title | No. of studies | No. of participants | Statistical method | Effect size |
| 1 Overall survival Show forest plot | 5 | Hazard Ratio (Random, 95% CI) | Subtotals only | |
| 1.1 Erlotinib versus CTX | 3 | Hazard Ratio (Random, 95% CI) | 0.95 [0.75, 1.22] | |
| 1.2 Erlotinib versus vinorelbine | 1 | Hazard Ratio (Random, 95% CI) | 2.16 [0.58, 8.10] | |
| 1.3 Erlotinib plus CTX versus CTX plus placebo | 1 | Hazard Ratio (Random, 95% CI) | 0.48 [0.27, 0.85] | |
| 2 Progression‐free survival Show forest plot | 6 | Hazard Ratio (Fixed, 95% CI) | Subtotals only | |
| 2.1 Erlotinib versus CTX | 4 | Hazard Ratio (Fixed, 95% CI) | 0.30 [0.24, 0.38] | |
| 2.2 Erlotinib versus vinorelbine | 1 | Hazard Ratio (Fixed, 95% CI) | 0.55 [0.21, 1.46] | |
| 2.3 Erlotinib plus CTX versus CTX plus placebo | 1 | Hazard Ratio (Fixed, 95% CI) | 0.25 [0.16, 0.39] | |
| 3 Tumour response Show forest plot | 7 | Risk Ratio (M‐H, Fixed, 95% CI) | Subtotals only | |
| 3.1 Erlotinib versus CTX | 5 | 593 | Risk Ratio (M‐H, Fixed, 95% CI) | 2.26 [1.85, 2.76] |
| 3.2 Erlotinib versus vinorelbine | 1 | 24 | Risk Ratio (M‐H, Fixed, 95% CI) | 0.83 [0.19, 3.67] |
| 3.3 Erlotinib versus erlotinib plus CTX | 0 | 0 | Risk Ratio (M‐H, Fixed, 95% CI) | 0.0 [0.0, 0.0] |
| 3.4 Erlotinib plus CTX versus CTX plus placebo | 1 | 97 | Risk Ratio (M‐H, Fixed, 95% CI) | 5.74 [2.86, 11.50] |
| Outcome or subgroup title | No. of studies | No. of participants | Statistical method | Effect size |
| 1 Overall survival Show forest plot | 4 | Hazard Ratio (Fixed, 95% CI) | Subtotals only | |
| 1.1 Gefitinib versus gemcitabine plus cisplatin | 1 | Hazard Ratio (Fixed, 95% CI) | 1.04 [0.50, 2.20] | |
| 1.2 Gefitinib versus paclitaxel plus carboplatin | 2 | Hazard Ratio (Fixed, 95% CI) | 0.95 [0.77, 1.18] | |
| 1.3 Gefitinib versus docetaxel plus cisplatin | 1 | Hazard Ratio (Fixed, 95% CI) | 1.25 [0.88, 1.78] | |
| 2 Progression‐free survival Show forest plot | 4 | Hazard Ratio (Fixed, 95% CI) | Subtotals only | |
| 2.1 Gefitinib versus gemcitabine plus cisplatin | 1 | Hazard Ratio (Fixed, 95% CI) | 0.54 [0.27, 1.10] | |
| 2.2 Gefitinib versus paclitaxel plus carboplatin | 2 | Hazard Ratio (Fixed, 95% CI) | 0.39 [0.32, 0.48] | |
| 2.3 Gefitinib versus docetaxel plus cisplatin | 1 | Hazard Ratio (Fixed, 95% CI) | 0.49 [0.34, 0.71] | |
| 3 Tumour response Show forest plot | 4 | 648 | Risk Ratio (M‐H, Fixed, 95% CI) | 1.87 [1.60, 2.19] |
| 3.1 Gefitinib versus gemcitabine plus cisplatin | 1 | 42 | Risk Ratio (M‐H, Fixed, 95% CI) | 2.26 [1.17, 4.34] |
| 3.2 Gefitinib versus paclitaxel plus carboplatin | 2 | 489 | Risk Ratio (M‐H, Fixed, 95% CI) | 1.83 [1.54, 2.18] |
| 3.3 Gefitinib versus docetaxel plus cisplatin | 1 | 117 | Risk Ratio (M‐H, Fixed, 95% CI) | 1.93 [1.26, 2.94] |
| Outcome or subgroup title | No. of studies | No. of participants | Statistical method | Effect size |
| 1 Overall survival Show forest plot | 2 | Hazard Ratio (Fixed, 95% CI) | 0.93 [0.74, 1.17] | |
| 1.1 Afatinib versus pemetrexed plus cisplatin | 1 | Hazard Ratio (Fixed, 95% CI) | 0.91 [0.66, 1.25] | |
| 1.2 Afatinib versus gemcitabine plus cisplatin | 1 | Hazard Ratio (Fixed, 95% CI) | 0.95 [0.68, 1.33] | |
| 2 Progression‐free survival Show forest plot | 2 | Hazard Ratio (Fixed, 95% CI) | 0.42 [0.34, 0.53] | |
| 2.1 Afatinib versus pemetrexed plus cisplatin | 1 | Hazard Ratio (Fixed, 95% CI) | 0.58 [0.43, 0.78] | |
| 2.2 Afatinib versus gemcitabine plus cisplatin | 1 | Hazard Ratio (Fixed, 95% CI) | 0.28 [0.20, 0.39] | |
| 3 Tumour response Show forest plot | 2 | 709 | Risk Ratio (M‐H, Fixed, 95% CI) | 2.71 [2.12, 3.46] |
| 3.1 Afatinib versus pemetrexed plus cisplatin | 1 | 345 | Risk Ratio (M‐H, Fixed, 95% CI) | 2.48 [1.74, 3.54] |
| 3.2 Afatinib versus gemcitabine plus cisplatin | 1 | 364 | Risk Ratio (M‐H, Fixed, 95% CI) | 2.92 [2.08, 4.09] |
| Outcome or subgroup title | No. of studies | No. of participants | Statistical method | Effect size |
| 1 Overall survival Show forest plot | 2 | Hazard Ratio (Fixed, 95% CI) | Subtotals only | |
| 1.1 Cetuximab plus paclitaxel or docetaxel plus carboplatin versus paclitaxel or docetaxel plus carboplatin | 1 | Hazard Ratio (Fixed, 95% CI) | 1.62 [0.54, 4.84] | |
| 1.2 Cetuximab plus vinorelbine plus cisplatin versus vinorelbine plus cisplatin | 1 | Hazard Ratio (Fixed, 95% CI) | 1.48 [0.77, 2.82] | |
| 2 Progression‐free survival Show forest plot | 2 | Hazard Ratio (Fixed, 95% CI) | Subtotals only | |
| 2.1 Cetuximab plus paclitaxel or docetaxel plus carboplatin versus paclitaxel or docetaxel plus carboplatin | 1 | Hazard Ratio (Fixed, 95% CI) | 1.17 [0.36, 3.80] | |
| 2.2 Cetuximab plus vinorelbine plus cisplatin versus vinorelbine plus cisplatin | 1 | Hazard Ratio (Fixed, 95% CI) | 0.92 [0.53, 1.60] | |
| 3 Tumour response Show forest plot | 2 | 81 | Risk Ratio (M‐H, Fixed, 95% CI) | 1.43 [0.83, 2.47] |
| 3.1 Cetuximab plus paclitaxel or docetaxel plus carboplatin versus paclitaxel or docetaxel plus carboplatin | 1 | 17 | Risk Ratio (M‐H, Fixed, 95% CI) | 4.5 [0.63, 32.38] |
| 3.2 Cetuximab plus vinorelbine plus cisplatin versus vinorelbine plus cisplatin | 1 | 64 | Risk Ratio (M‐H, Fixed, 95% CI) | 1.19 [0.67, 2.11] |
| Outcome or subgroup title | No. of studies | No. of participants | Statistical method | Effect size |
| 1 Progression‐free survival Show forest plot | 1 | Hazard Ratio (Fixed, 95% CI) | 0.20 [0.05, 0.75] | |