Tratamiento de primera línea del cáncer de pulmón no microcítico (células no pequeñas) no escamocelular avanzado con pruebas positivas para la mutación del receptor del factor de crecimiento epidérmico (RFCE)
Appendices
Appendix 1. Cochrane Central Register of Controlled Trials, Issue 6 of 12, June 2015
#1 MeSH descriptor: [Carcinoma, Non‐Small‐Cell Lung] explode all trees
#2 lung:ti,ab
#3 (cancer* or carcin* or neoplasm* or tumour* or tumor*):ti,ab
#4 (non‐small or nonsmall):ti,ab 4
#5 #2 and #3 and #4
#6 nsclc:ti,ab
#7 #1 or #5 or #6
#8 (tyrosine kinase inhibit* or monoclonal antibod* or EGFR or TKI*):ti,ab
#9 (erlotinib or tarceva):ti,ab
#10 (gefitinib or iressa):ti,ab
#11 (afatinib or gilotrif):ti,ab
#12 #8 or #9 or #10 or #11
#13 #7 and #12
Appendix 2. Ovid MEDLINE (R) from 1946 to 1 June 2015
1 exp Carcinoma, Non‐Small‐Cell Lung/
2 (lung and (cancer$ or carcin$ or neoplasm$ or tumour$ or tumor$) and ((non‐small or nonsmall) and cell)).ti,ab.
3 nsclc.ti,ab.
4 1 or 2 or 3
5 (tyrosine kinase inhibit$ or monoclonal antibod$ or EGFR or TKI$).tw.
6 (erlotinib or tarceva).af.
7 (gefitinib or iressa).af.
8 (afatinib or gilotrif).af.
9 5 or 6 or 7 or 8
10 4 and 9
11 randomized controlled trial.pt.
12 controlled clinical trial.pt.
13 randomized.ab.
14 placebo.ab.
15 drug therapy.fs.
16 randomly.ab.
17 trial.ab.
18 groups.ab.
19 11 or 12 or 13 or 14 or 15 or 16 or 17 or 18
20 exp animals/
21 humans.sh.
22 20 not 21
23 19 not 22
24 10 and 23
25 10 and 23
Appendix 3. Ovid EMBASE from 1980 to 1 June 2015
1 exp lung non small cell cancer/
2 (lung and (cancer$ or carcin$ or neoplasm$ or tumour$ or tumor$) and ((non‐small or nonsmall) and cell)).ti,ab.
3 nsclc.ti,ab.
4 1 or 2 or 3
5 (tyrosine kinase inhibit$ or monoclonal antibod$ or EGFR or TKI$).tw.
6 (erlotinib or tarceva).af.
7 (gefitinib or iressa).af.
8 (afatinib or gilotrif).af.
9 5 or 6 or 7 or 8
10 4 and 9
11 random:.tw. or placebo:.mp. or double‐blind:.mp.
12 10 and 11
13 10 and 11
Appendix 4. ISI Web of Science
Topic=(non small cell lung) AND Topic=((erlotinib or tarceva or gefitinib or iressa or tyrosine kinase inhibit* or monoclonal antibod* or EGFR)) AND Topic=(random*)
Timespan=All Years. Databases= Science Citation Index Expanded (SCI‐ EXPANDED): 1899‐present; Conference Proceedings Citation Index‐ Science (CPCI‐S): 1990‐present. Refined by: Document Types=( Article Or Meeting Abstract Or Review Or Proceedings Paper)

Study flow diagram.

Risk of bias graph: review authors' judgements about each risk of bias item presented as percentages across all included studies.
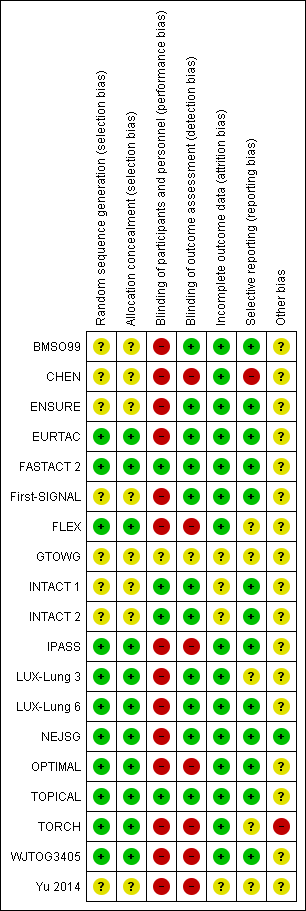
Risk of bias summary: review authors' judgements about each risk of bias item for each included trial.
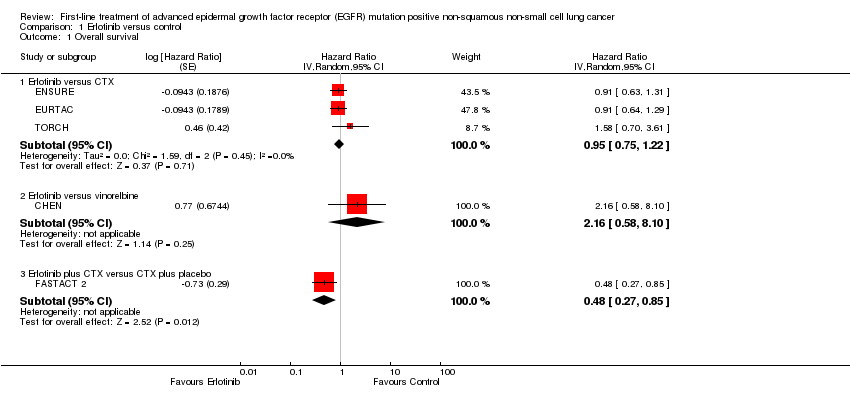
Comparison 1 Erlotinib versus control, Outcome 1 Overall survival.

Comparison 1 Erlotinib versus control, Outcome 2 Progression‐free survival.
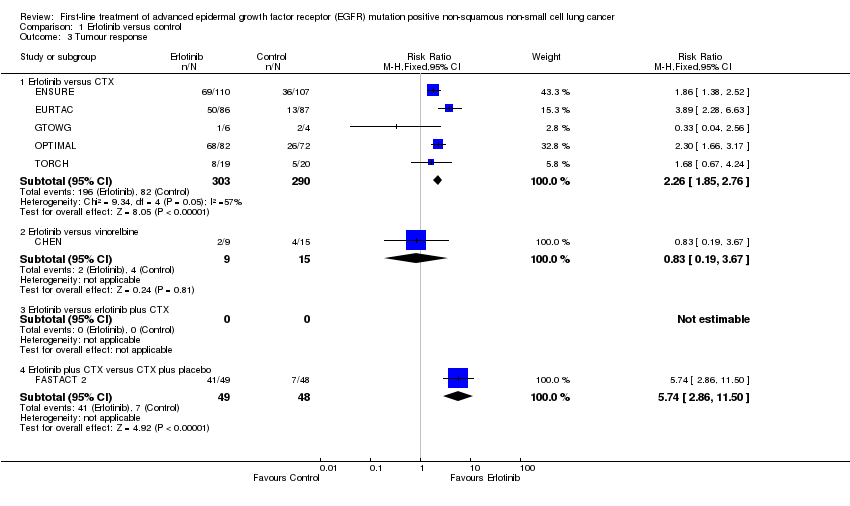
Comparison 1 Erlotinib versus control, Outcome 3 Tumour response.
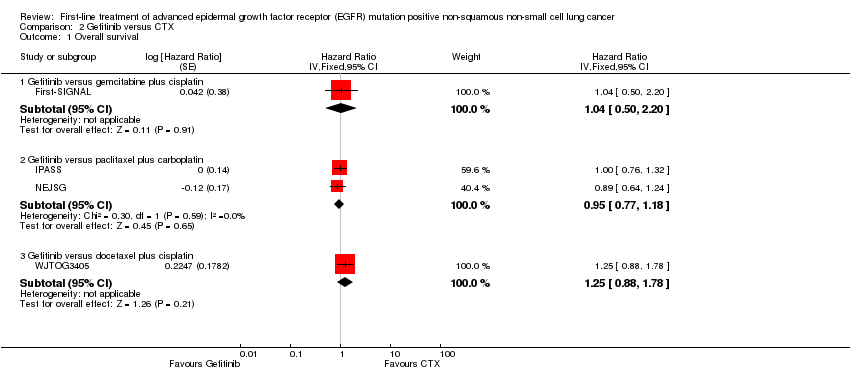
Comparison 2 Gefitinib versus CTX, Outcome 1 Overall survival.

Comparison 2 Gefitinib versus CTX, Outcome 2 Progression‐free survival.
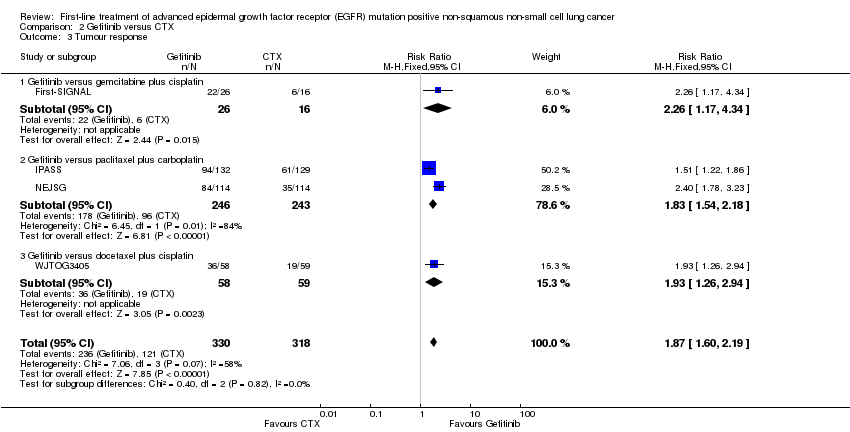
Comparison 2 Gefitinib versus CTX, Outcome 3 Tumour response.

Comparison 3 Afatinib versus CTX, Outcome 1 Overall survival.

Comparison 3 Afatinib versus CTX, Outcome 2 Progression‐free survival.
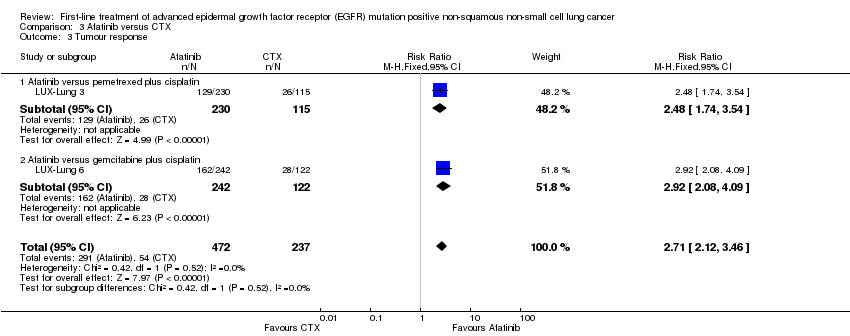
Comparison 3 Afatinib versus CTX, Outcome 3 Tumour response.
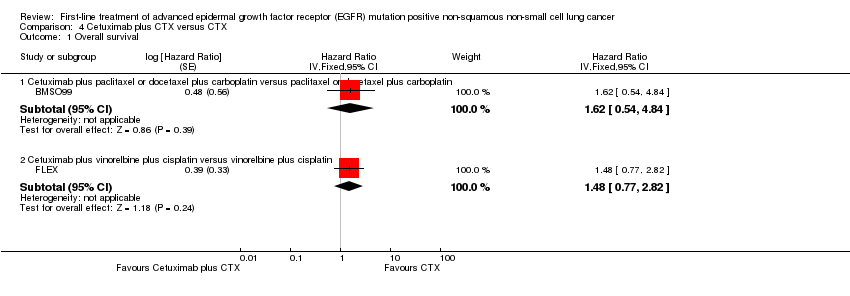
Comparison 4 Cetuximab plus CTX versus CTX, Outcome 1 Overall survival.

Comparison 4 Cetuximab plus CTX versus CTX, Outcome 2 Progression‐free survival.

Comparison 4 Cetuximab plus CTX versus CTX, Outcome 3 Tumour response.

Comparison 5 Gefitinib plus CTX versus CTX, Outcome 1 Progression‐free survival.
| First‐line treatment of advanced epidermal growth factor receptor (EGFR) mutation positive (M+) non‐squamous non‐small cell lung cancer (NSCLC): erlotinib comparisons | ||||||
| Patient or population: EGFR M+ patients with NSCLC Settings: oncology Intervention: erlotinib Comparison: control (cytotoxic chemotherapy) | ||||||
| Outcomes | Illustrative comparative risks* (95% CI) | Relative effect | No of participants | Quality of the evidence | Comments | |
| Assumed risk | Corresponding risk | |||||
| Control | Erlotinib | |||||
| Overall survival | 56 per 100 | 54 per 100 (46 to 63) | HR 0.95 (0.75, 1.22) | 429 (3 studies) | High | All trials were open label but included blinded independent review |
| Progression‐free survival | 73 per 100 | 33 per 100 (27 to 40) | HR 0.30 (0.24, 0.38) | 595 (4 studies) | High | All trials were open label but included blinded independent review |
| *The basis for the assumed risk is calculated as the event rate in the treatment group | ||||||
| GRADE Working Group grades of evidence | ||||||
| First‐line treatment of advanced epidermal growth factor receptor (EGFR) mutation positive (M+) non‐squamous non‐small cell lung cancer (NSCLC): gefitinib comparisons | ||||||
| Patient or population: EGFR M+ patients with NSCLC Settings: oncology Intervention: gefitinib Comparison: paclitaxel + carboplatin | ||||||
| Outcomes | Illustrative comparative risks* (95% CI) | Relative effect | No of participants | Quality of the evidence | Comments | |
| Assumed risk | Corresponding risk | |||||
| Paclitaxel + carboplatin | Gefitinib | |||||
| Overall survival | 67 per 100 | 66 per 100 (58 to 73) | HR 0.95 (0.77 to 1.18) | 489 (2 studies) | High | Both trials were open label. IPASS did not report independent blinded review |
| Progression‐free survival | 89 per 100 | 57 per 100 (50 to 65) | HR 0.39 (0.32 to 0.48) | 485 (2 studies) | High | Both trials were open label. IPASS did not report independent blinded review |
| *The basis for the assumed risk is calculated as the event rate in the treatment group | ||||||
| GRADE Working Group grades of evidence | ||||||
| First‐line treatment of advanced epidermal growth factor receptor (EGFR) mutation positive (M+) non‐squamous non‐small cell lung cancer (NSCLC): afatinib comparisons | ||||||
| Patient or population: EGFR M+ patients with NSCLC Settings: oncology Intervention: afatinib Comparison: cytotoxic chemotherapy | ||||||
| Outcomes | Illustrative comparative risks* (95% CI) | Relative effect | No of participants | Quality of the evidence | Comments | |
| Assumed risk | Corresponding risk | |||||
| Cytotoxic chemotherapy | Afatinib | |||||
| Overall survival | 46 per 100 | 44 per 100 (37 to 52) | HR 0.93 (0.74 to 1.17) | 709 (2 studies) | High | Both trials were open label but included blinded independent central review |
| Progression‐free survival | 56 per 100 | 29 per 100 (24 to 35) | HR 0.42 (0.34 to 0.53) | 709 (2 studies) | High | Both trials were open label but included blinded independent central review |
| *The basis for the assumed risk is calculated as the event rate in the treatment group | ||||||
| GRADE Working Group grades of evidence | ||||||
| Study | Definition of AE | Population | Top AE (listed according to intervention) | Second top AE (listed according to intervention) | Third top AE (listed according to intervention) | Top 3 AEs (listed according to comparator) |
| Afatinib trials | ||||||
| Grade >= 3 CTC (V3) AEs that were reported in > 10% of participants in either group and if there was a >= 10% difference between the groups | EGFR M+ only | Rash/acne: 16.2% (AFA) vs 0% (cytotoxic chemotherapy) | Diarrhoea: 14.4% (AFA) vs 0% (cytotoxic chemotherapy) | Paronychia: 11.4% (AFA) vs 0% (cytotoxic chemotherapy) | Neutropenia: 18% vs 0.4% Fatigue: 12.6% vs 1.3% Leukopenia: 8.1% vs 0.4% | |
| CTC (V3) Events are included if reported for >= 1% of participants in any treatment group | EGFR M+ only | Rash/acne: 14.6% (AFA) vs 0% (cytotoxic chemotherapy) | Diarrhoea: 5.4% (AFA) vs 0% (cytotoxic chemotherapy) | Stomatitis/mucositis: 5.4% (AFA) vs 0% (cytotoxic chemotherapy) | Neutropenia: 26.5% vs 0.4% Vomiting: 19.4% vs 0.8% Leukopenia: 15.1% vs 0.4% | |
| Erlotinib trials | ||||||
| Incidence rate >= 10% | Unselected population | Rash: 64.9% (ERL) vs NR (cytotoxic chemotherapy) | Diarrhoea: 29.8% (ERL) vs NR (cytotoxic chemotherapy) | Mouth ulceration: 14% (ERL) vs NR (cytotoxic chemotherapy) | Anorexia: 26.3% vs NR Diarrhoea: 12.3% vs NR Vomiting: 10.5% vs NR | |
| Grade ≥ 3 ≥ 5% in either arm | EGFR M+ only | Rash: 6.4% (ERL) vs 1% (cytotoxic chemotherapy) | Neutropenia, leukopenia, anaemia: All 0.9% (ERL) vs 25%, 14.4%, 12.5% respectively (cytotoxic chemotherapy) | ‐ | Neutropenia: 25% vs 0.9% Leukopenia: 14.4% vs 0.9% Anaemia: 12.5% vs 0.9% | |
| Grade 3/4 CTC (V3) Common AEs | EGFR M+ only | Rash: 13% (ERL) vs 0% (cytotoxic chemotherapy) | Fatigue: 6% (ERL) vs 20% (cytotoxic chemotherapy) | Diarrhoea: 5% (ERL) vs 0% (cytotoxic chemotherapy) | Neutropenia: 22% vs 0% Fatigue: 20% vs 6% Thrombocytopenia: 14% vs 0% | |
| Grade 3/4 CTC (V3) Most commonly reported | Unselected population | Neutropenia: 29% (ERL) vs 25% (cytotoxic chemotherapy) | Thrombocytopenia 14% (ERL) vs 14% (cytotoxic chemotherapy) | Anaemia: 11% (ERL) vs 9% (cytotoxic chemotherapy) | Neutropenia: 25% vs 29% Thrombocytopenia: 14% vs 14% Anaemia: 9% vs 11% | |
| Grade 3/4 | Unselected population | Rash: 12% (ERL) vs 0% (cytotoxic chemotherapy) | Diarrhoea: 6% (ERL) vs 2% (cytotoxic chemotherapy) | Constitutional symptoms: 3% (ERL) vs 5% (cytotoxic chemotherapy) | Neutropenia: 36% vs 0% Leukocytes: 33% vs 0% Haemoglobin: 11% vs 0.7% | |
| Grade 3/4 CTC (V3) AEs occurred in 3% or more in either treatment group | EGFR M+ only | Increased ALT: 4% (ERL) vs 1% (cytotoxic chemotherapy) | Skin rash: 2% (ERL) vs 0% (cytotoxic chemotherapy) | Diarrhoea: 1% (ERL) vs 0% (cytotoxic chemotherapy) | Neutropenia: 42% vs 0% Thrombocytopenia: 40% vs 0% Anaemia: 13% vs 0% | |
| CTC (V3) Specific AEs grade 3 or 4 | Unselected population | Dyspnoea: 59% (ERL) vs 64% (PLA) | Fatigue: 23% (ERL) vs 23% (PLA) | Diarrhoea: 8% (ERL) vs 1% (cytotoxic chemotherapy) | Dyspnoea: 64% vs 59% Fatigue: 23% vs 23% Anorexia: 5% vs 5% | |
| Worst toxicity experienced with first‐line treatment alone | Unselected population | Skin rash: 11% (ERL) vs 0% (cytotoxic chemotherapy) | Pulmonary toxicity: 9% (ERL) vs 6% (cytotoxic chemotherapy) | Fatigue: 8% (ERL) vs 12% (cytotoxic chemotherapy) | Neutropenia: 21% vs 0% Thrombocytopenia: 12% vs 0% Fatigue: 12% vs 8% | |
| Gefitinib trials | ||||||
| Grade 3 or 4 CTC (V3) | Unselected population | Rash: 29.3% (GEF) vs 2% (cytotoxic chemotherapy) | Anorexia: 13.8% (GEF) vs 57.3% (cytotoxic chemotherapy) | AST: 11.3% (GEF) vs 2% (cytotoxic chemotherapy) | Anorexia: 57.3% vs 13.9% Neutropenia: 54% vs 1.9% Fatigue: 45.3% vs 10.1% | |
| Grade 3/4 CTC Commonly occurring AEs | Unselected population | Thrombocytopenia*: 5.8% (GEF + cytotoxic chemotherapy) vs 5.6% (cytotoxic chemotherapy) | Rash: 3.6% (GEF + cytotoxic chemotherapy) vs 1.1% (cytotoxic chemotherapy) | Diarrhoea: 3.6% (GEF + cytotoxic chemotherapy) vs 2.3% (cytotoxic chemotherapy) | Thrombocytopenia*: 5.6% vs 5.8% Leukopenia: 2.5% vs 3.3% Diarrhoea: 2.3% vs 3.6% | |
| Grade 3/4 CTC (V2) Common drug‐related AEs | Unselected population | Diarrhoea: 9.9% (GEF + cytotoxic chemotherapy) vs 2.9% (cytotoxic chemotherapy) | Neutropenia: 6.7% (GEF + cytotoxic chemotherapy) vs 5.9% (cytotoxic chemotherapy) | Rash: 3.2% (GEF + cytotoxic chemotherapy) vs 1.5% (cytotoxic chemotherapy) | Neutropenia: 5.9% vs 6.7% Diarrhoea: 2.9% vs 9.9% Vomiting: 2.3% vs 2% | |
| Grade 3, 4, or 5 CTC (V3) At least 10% of participants in either treatment group and at least a 5% difference between arms | Unselected population | Diarrhoea: 3.8% (GEF) vs 1.4% (cytotoxic chemotherapy) | Any neutropenia: 3.7% (GEF) vs 67.1% (cytotoxic chemotherapy) | Rash: 3.1% (GEF) vs 0.8% (cytotoxic chemotherapy) | Any neutropenia: 67.1% vs 3.7% Leukopenia: 35% vs 1.5% Anaemia: 10.6% vs 2.2% | |
| Grade >= 3 CTC (V3) At least 10% of participants in either treatment group and at least a 5% difference between arms | EGFR M+ only | ATE: 26.3% (GEF) vs 0.9% (cytotoxic chemotherapy) | Rash: 5.3% (GEF) vs 2.7% (cytotoxic chemotherapy) | Appetite loss: 5.3% (GEF) vs 6.2% (cytotoxic chemotherapy) | Neutropenia: 65.5% vs 0.9% Arthralgia: 7.1% vs 0.9% Neuropathy: 6.2% vs 0% Appetite loss: 6.2% vs 5.3% | |
| Grade >= 3 CTC (V3) AEs occurred in 10% of either of the treatment groups | EGFR M+ only | ALT/AST: 27.5% (GEF) vs 2.3% (cytotoxic chemotherapy) | Rash: 2.3% (GEF) vs 0% (cytotoxic chemotherapy) | Fatigue: 2.3% (GEF) vs 2.3% (cytotoxic chemotherapy) | Neutropenia: 84% vs 0% Leucocytopenia: 50% vs 0% Anaemia: 17% vs 0% | |
| Grade 3+ Participants with at least 1 AE | Unselected population | Rash: 16% (GEF + cytotoxic chemotherapy) vs 0% (cytotoxic chemotherapy) | Vomiting: 10% (GEF) vs 8% (cytotoxic chemotherapy) | Neutropenia: 10% (GEF) vs 12% (cytotoxic chemotherapy) | Neutropenia: 12% vs 10% Nausea: 8% vs 5% Vomiting: 8% vs 10% | |
| Cetuximab trials | ||||||
| Grade 3/4 CTC (V3) Most frequent and relevant grade 3/4 AEs | Unselected population | Neutropenia: 62.5% (CET + cytotoxic chemotherapy) vs 56% (cytotoxic chemotherapy) | Leukopenia: 43.8% (CET + cytotoxic chemotherapy) vs 30.7% (cytotoxic chemotherapy) | Fatigue: 15.1% (CET + cytotoxic chemotherapy) vs 12.2% (cytotoxic chemotherapy) | Same AEs as intervention | |
| Grade 3/4 CTC (V2) AEs that were reported in > 5% of participants (G3/G4) or > 1% (G4) or AEs of special interest in either group | EGFR M+ expressing | Neutropenia: 53% (CET + cytotoxic chemotherapy) vs 51% (cytotoxic chemotherapy) | Leukopenia: 25% (CET + cytotoxic chemotherapy) vs 19% (cytotoxic chemotherapy) | Febrile neutropenia: 22% (CET + cytotoxic chemotherapy) vs 15% (cytotoxic chemotherapy) | Neutropenia: 52% (cytotoxic chemotherapy) vs 52% CET + cytotoxic chemotherapy Leukopenia: 19% (cytotoxic chemotherapy) vs 25% (CET vs cytotoxic chemotherapy) Anaemia: 16% (cytotoxic chemotherapy) vs 1% (CET + cytotoxic chemotherapy) | |
| AE: adverse event PLA: placebo *Neutropenia was also reported as 5.8% for G3/4; as this rate was higher than the rate for all participants (5%) it was not included in the table. | ||||||
| Outcome or subgroup title | No. of studies | No. of participants | Statistical method | Effect size |
| 1 Overall survival Show forest plot | 5 | Hazard Ratio (Random, 95% CI) | Subtotals only | |
| 1.1 Erlotinib versus CTX | 3 | Hazard Ratio (Random, 95% CI) | 0.95 [0.75, 1.22] | |
| 1.2 Erlotinib versus vinorelbine | 1 | Hazard Ratio (Random, 95% CI) | 2.16 [0.58, 8.10] | |
| 1.3 Erlotinib plus CTX versus CTX plus placebo | 1 | Hazard Ratio (Random, 95% CI) | 0.48 [0.27, 0.85] | |
| 2 Progression‐free survival Show forest plot | 6 | Hazard Ratio (Fixed, 95% CI) | Subtotals only | |
| 2.1 Erlotinib versus CTX | 4 | Hazard Ratio (Fixed, 95% CI) | 0.30 [0.24, 0.38] | |
| 2.2 Erlotinib versus vinorelbine | 1 | Hazard Ratio (Fixed, 95% CI) | 0.55 [0.21, 1.46] | |
| 2.3 Erlotinib plus CTX versus CTX plus placebo | 1 | Hazard Ratio (Fixed, 95% CI) | 0.25 [0.16, 0.39] | |
| 3 Tumour response Show forest plot | 7 | Risk Ratio (M‐H, Fixed, 95% CI) | Subtotals only | |
| 3.1 Erlotinib versus CTX | 5 | 593 | Risk Ratio (M‐H, Fixed, 95% CI) | 2.26 [1.85, 2.76] |
| 3.2 Erlotinib versus vinorelbine | 1 | 24 | Risk Ratio (M‐H, Fixed, 95% CI) | 0.83 [0.19, 3.67] |
| 3.3 Erlotinib versus erlotinib plus CTX | 0 | 0 | Risk Ratio (M‐H, Fixed, 95% CI) | 0.0 [0.0, 0.0] |
| 3.4 Erlotinib plus CTX versus CTX plus placebo | 1 | 97 | Risk Ratio (M‐H, Fixed, 95% CI) | 5.74 [2.86, 11.50] |
| Outcome or subgroup title | No. of studies | No. of participants | Statistical method | Effect size |
| 1 Overall survival Show forest plot | 4 | Hazard Ratio (Fixed, 95% CI) | Subtotals only | |
| 1.1 Gefitinib versus gemcitabine plus cisplatin | 1 | Hazard Ratio (Fixed, 95% CI) | 1.04 [0.50, 2.20] | |
| 1.2 Gefitinib versus paclitaxel plus carboplatin | 2 | Hazard Ratio (Fixed, 95% CI) | 0.95 [0.77, 1.18] | |
| 1.3 Gefitinib versus docetaxel plus cisplatin | 1 | Hazard Ratio (Fixed, 95% CI) | 1.25 [0.88, 1.78] | |
| 2 Progression‐free survival Show forest plot | 4 | Hazard Ratio (Fixed, 95% CI) | Subtotals only | |
| 2.1 Gefitinib versus gemcitabine plus cisplatin | 1 | Hazard Ratio (Fixed, 95% CI) | 0.54 [0.27, 1.10] | |
| 2.2 Gefitinib versus paclitaxel plus carboplatin | 2 | Hazard Ratio (Fixed, 95% CI) | 0.39 [0.32, 0.48] | |
| 2.3 Gefitinib versus docetaxel plus cisplatin | 1 | Hazard Ratio (Fixed, 95% CI) | 0.49 [0.34, 0.71] | |
| 3 Tumour response Show forest plot | 4 | 648 | Risk Ratio (M‐H, Fixed, 95% CI) | 1.87 [1.60, 2.19] |
| 3.1 Gefitinib versus gemcitabine plus cisplatin | 1 | 42 | Risk Ratio (M‐H, Fixed, 95% CI) | 2.26 [1.17, 4.34] |
| 3.2 Gefitinib versus paclitaxel plus carboplatin | 2 | 489 | Risk Ratio (M‐H, Fixed, 95% CI) | 1.83 [1.54, 2.18] |
| 3.3 Gefitinib versus docetaxel plus cisplatin | 1 | 117 | Risk Ratio (M‐H, Fixed, 95% CI) | 1.93 [1.26, 2.94] |
| Outcome or subgroup title | No. of studies | No. of participants | Statistical method | Effect size |
| 1 Overall survival Show forest plot | 2 | Hazard Ratio (Fixed, 95% CI) | 0.93 [0.74, 1.17] | |
| 1.1 Afatinib versus pemetrexed plus cisplatin | 1 | Hazard Ratio (Fixed, 95% CI) | 0.91 [0.66, 1.25] | |
| 1.2 Afatinib versus gemcitabine plus cisplatin | 1 | Hazard Ratio (Fixed, 95% CI) | 0.95 [0.68, 1.33] | |
| 2 Progression‐free survival Show forest plot | 2 | Hazard Ratio (Fixed, 95% CI) | 0.42 [0.34, 0.53] | |
| 2.1 Afatinib versus pemetrexed plus cisplatin | 1 | Hazard Ratio (Fixed, 95% CI) | 0.58 [0.43, 0.78] | |
| 2.2 Afatinib versus gemcitabine plus cisplatin | 1 | Hazard Ratio (Fixed, 95% CI) | 0.28 [0.20, 0.39] | |
| 3 Tumour response Show forest plot | 2 | 709 | Risk Ratio (M‐H, Fixed, 95% CI) | 2.71 [2.12, 3.46] |
| 3.1 Afatinib versus pemetrexed plus cisplatin | 1 | 345 | Risk Ratio (M‐H, Fixed, 95% CI) | 2.48 [1.74, 3.54] |
| 3.2 Afatinib versus gemcitabine plus cisplatin | 1 | 364 | Risk Ratio (M‐H, Fixed, 95% CI) | 2.92 [2.08, 4.09] |
| Outcome or subgroup title | No. of studies | No. of participants | Statistical method | Effect size |
| 1 Overall survival Show forest plot | 2 | Hazard Ratio (Fixed, 95% CI) | Subtotals only | |
| 1.1 Cetuximab plus paclitaxel or docetaxel plus carboplatin versus paclitaxel or docetaxel plus carboplatin | 1 | Hazard Ratio (Fixed, 95% CI) | 1.62 [0.54, 4.84] | |
| 1.2 Cetuximab plus vinorelbine plus cisplatin versus vinorelbine plus cisplatin | 1 | Hazard Ratio (Fixed, 95% CI) | 1.48 [0.77, 2.82] | |
| 2 Progression‐free survival Show forest plot | 2 | Hazard Ratio (Fixed, 95% CI) | Subtotals only | |
| 2.1 Cetuximab plus paclitaxel or docetaxel plus carboplatin versus paclitaxel or docetaxel plus carboplatin | 1 | Hazard Ratio (Fixed, 95% CI) | 1.17 [0.36, 3.80] | |
| 2.2 Cetuximab plus vinorelbine plus cisplatin versus vinorelbine plus cisplatin | 1 | Hazard Ratio (Fixed, 95% CI) | 0.92 [0.53, 1.60] | |
| 3 Tumour response Show forest plot | 2 | 81 | Risk Ratio (M‐H, Fixed, 95% CI) | 1.43 [0.83, 2.47] |
| 3.1 Cetuximab plus paclitaxel or docetaxel plus carboplatin versus paclitaxel or docetaxel plus carboplatin | 1 | 17 | Risk Ratio (M‐H, Fixed, 95% CI) | 4.5 [0.63, 32.38] |
| 3.2 Cetuximab plus vinorelbine plus cisplatin versus vinorelbine plus cisplatin | 1 | 64 | Risk Ratio (M‐H, Fixed, 95% CI) | 1.19 [0.67, 2.11] |
| Outcome or subgroup title | No. of studies | No. of participants | Statistical method | Effect size |
| 1 Progression‐free survival Show forest plot | 1 | Hazard Ratio (Fixed, 95% CI) | 0.20 [0.05, 0.75] | |