Intervenciones para prevenir la progresión de la poliquistosis renal autosómica dominante
Referencias
Referencias de los estudios incluidos en esta revisión
Referencias de los estudios excluidos de esta revisión
Referencias de los estudios en espera de evaluación
Referencias de los estudios en curso
Referencias adicionales
Referencias de otras versiones publicadas de esta revisión
Characteristics of studies
Characteristics of included studies [ordered by study ID]
| Methods |
| |
| Participants |
| |
| Interventions | Treatment group
Control group
Duration of intervention
| |
| Outcomes |
| |
| Notes |
| |
| Risk of bias | ||
| Bias | Authors' judgement | Support for judgement |
| Random sequence generation (selection bias) | Unclear risk | Insufficient information to permit judgement |
| Allocation concealment (selection bias) | Unclear risk | Insufficient information to permit judgement |
| Blinding of participants and personnel (performance bias) | Low risk | Double blind |
| Blinding of outcome assessment (detection bias) | Unclear risk | Insufficient information to permit judgement |
| Incomplete outcome data (attrition bias) | High risk | "Sixty‐eight patients in the benazepril group and 61 in the placebo group did not complete the study be cause of death, other adverse events, lack of cooperation, or protocol violations" |
| Selective reporting (reporting bias) | Unclear risk | Insufficient information to permit judgement |
| Other bias | Unclear risk | Insufficient information to permit judgement |
| Methods |
| |
| Participants |
| |
| Interventions | Treatment group
Control group
Duration of intervention
| |
| Outcomes |
| |
| Notes |
| |
| Risk of bias | ||
| Bias | Authors' judgement | Support for judgement |
| Random sequence generation (selection bias) | Low risk | Randomisation according to a computer‐generated randomisation list |
| Allocation concealment (selection bias) | Unclear risk | Insufficient information to permit judgement |
| Blinding of participants and personnel (performance bias) | Unclear risk | Participants were blinded to treatment but study physicians and nurses were aware of the allocated group |
| Blinding of outcome assessment (detection bias) | Low risk | Outcome assessors blinded to allocation |
| Incomplete outcome data (attrition bias) | Low risk | 6/79 (7.5%) patients did not complete the study. Data were analysed on a modified ITT basis |
| Selective reporting (reporting bias) | Low risk | All defined outcomes were reported |
| Other bias | Low risk | The study was partly funded by Novartis; however, the authors state that "....the sponsor of the study had no role in study design, data collection, data analysis, data interpretation, or writing of the report. The corresponding author had full access to all the data in the study and had final responsibility for the decision to submit for publication" |
| Methods |
| |
| Participants |
| |
| Interventions | Treatment group
Control group
Duration of intervention
| |
| Outcomes |
| |
| Notes |
| |
| Risk of bias | ||
| Bias | Authors' judgement | Support for judgement |
| Random sequence generation (selection bias) | Unclear risk | Insufficient information to permit judgement |
| Allocation concealment (selection bias) | Unclear risk | Insufficient information to permit judgement |
| Blinding of participants and personnel (performance bias) | Unclear risk | Insufficient information to permit judgement |
| Blinding of outcome assessment (detection bias) | Unclear risk | Insufficient information to permit judgement |
| Incomplete outcome data (attrition bias) | Unclear risk | Insufficient information to permit judgement |
| Selective reporting (reporting bias) | Unclear risk | Insufficient information to permit judgement |
| Other bias | Unclear risk | Insufficient information to permit judgement |
| Methods |
| |
| Participants |
| |
| Interventions | Treatment group
Control group
Duration of intervention
| |
| Outcomes |
| |
| Notes |
| |
| Risk of bias | ||
| Bias | Authors' judgement | Support for judgement |
| Random sequence generation (selection bias) | Low risk | Computerised random number generator |
| Allocation concealment (selection bias) | Low risk | Block randomisation using a sealed, numbered envelope |
| Blinding of participants and personnel (performance bias) | Unclear risk | Insufficient information to permit judgement |
| Blinding of outcome assessment (detection bias) | Unclear risk | Insufficient information to permit judgement |
| Incomplete outcome data (attrition bias) | High risk | 22/85 (26%) patients withdrew. Data were not analysed on ITT basis |
| Selective reporting (reporting bias) | Unclear risk | Insufficient information to permit judgement |
| Other bias | Unclear risk | Insufficient information to permit judgement |
| Methods |
| |
| Participants |
| |
| Interventions | Treatment group
Control group
Duration of intervention
| |
| Outcomes |
| |
| Notes |
| |
| Risk of bias | ||
| Bias | Authors' judgement | Support for judgement |
| Random sequence generation (selection bias) | Unclear risk | Insufficient information to permit judgement |
| Allocation concealment (selection bias) | Unclear risk | Insufficient information to permit judgement |
| Blinding of participants and personnel (performance bias) | Unclear risk | Insufficient information to permit judgement |
| Blinding of outcome assessment (detection bias) | Unclear risk | Insufficient information to permit judgement |
| Incomplete outcome data (attrition bias) | Unclear risk | Insufficient information to permit judgement |
| Selective reporting (reporting bias) | Unclear risk | Insufficient information to permit judgement |
| Other bias | Unclear risk | Insufficient information to permit judgement |
| Methods |
| |
| Participants |
| |
| Interventions | Treatment group
Control group
Duration of intervention
| |
| Outcomes |
| |
| Notes |
| |
| Risk of bias | ||
| Bias | Authors' judgement | Support for judgement |
| Random sequence generation (selection bias) | Low risk | Computerised generated randomisation list |
| Allocation concealment (selection bias) | Low risk | "A computer generated randomisation list is made by an independent biostatistics unit using a permuted block design with a random block size of 4 to guarantee a balanced allocation" |
| Blinding of participants and personnel (performance bias) | High risk | Open‐label study |
| Blinding of outcome assessment (detection bias) | High risk | Open‐label study |
| Incomplete outcome data (attrition bias) | Low risk | 5/39 (11%) patients dropped from the study. Unclear how many were ADPKD. The authors performed both ITT and PP analyses on the primary outcome measure |
| Selective reporting (reporting bias) | Unclear risk | Insufficient information to permit judgement |
| Other bias | Low risk | "Novartis provided the drug everolimus and partially funded the study. They did not have any influence on the execution of the trial or the preparation of the manuscript, since this was an investigator‐initiated trial" |
| Methods |
| |
| Participants |
| |
| Interventions | Treatment group
Control group
Duration of intervention
| |
| Outcomes |
| |
| Notes |
| |
| Risk of bias | ||
| Bias | Authors' judgement | Support for judgement |
| Random sequence generation (selection bias) | Low risk | Computer‐generated random number list |
| Allocation concealment (selection bias) | Low risk | Repeating blocks of 10 |
| Blinding of participants and personnel (performance bias) | High risk | Open‐label study |
| Blinding of outcome assessment (detection bias) | High risk | Open‐label study |
| Incomplete outcome data (attrition bias) | Unclear risk | Insufficient information to permit judgement |
| Selective reporting (reporting bias) | Unclear risk | Insufficient information to permit judgement |
| Other bias | Unclear risk | Insufficient information to permit judgement |
| Methods |
| |
| Participants |
| |
| Interventions | Treatment group
Control group
Duration of intervention
| |
| Outcomes |
| |
| Notes |
| |
| Risk of bias | ||
| Bias | Authors' judgement | Support for judgement |
| Random sequence generation (selection bias) | High risk | "...using the dynamic balancing method to ensure equal distributions" |
| Allocation concealment (selection bias) | Unclear risk | Insufficient information to permit judgement |
| Blinding of participants and personnel (performance bias) | Unclear risk | Insufficient information to permit judgement, presumably open‐label study |
| Blinding of outcome assessment (detection bias) | Unclear risk | Insufficient information to permit judgement, presumably open‐label study |
| Incomplete outcome data (attrition bias) | Unclear risk | Insufficient information to permit judgement |
| Selective reporting (reporting bias) | Unclear risk | Insufficient information to permit judgement |
| Other bias | High risk | Sponsored by Mochida Pharmaceutical Co. Ltd |
| Methods |
| |
| Participants |
| |
| Interventions | Treatment group
Control group
Duration of intervention
| |
| Outcomes |
| |
| Notes |
| |
| Risk of bias | ||
| Bias | Authors' judgement | Support for judgement |
| Random sequence generation (selection bias) | Unclear risk | "Randomization assignment to octreotide or matching placebo treatment was independently managed by the research pharmacy" |
| Allocation concealment (selection bias) | Unclear risk | Insufficient information to permit judgement |
| Blinding of participants and personnel (performance bias) | Low risk | Double blind |
| Blinding of outcome assessment (detection bias) | Unclear risk | Insufficient information to permit judgement |
| Incomplete outcome data (attrition bias) | High risk | All patients completed the study but 13 were excluded from kidney outcomes (volume and function) assessment |
| Selective reporting (reporting bias) | Low risk | All defined outcomes were reported |
| Other bias | High risk | Novartis supported the study |
| Methods |
| |
| Participants |
| |
| Interventions | Treatment group
Control group
Duration of intervention
| |
| Outcomes |
| |
| Notes |
| |
| Risk of bias | ||
| Bias | Authors' judgement | Support for judgement |
| Random sequence generation (selection bias) | Low risk | Computer‐generated random number list |
| Allocation concealment (selection bias) | Low risk | "Randomization was performed by an un‐blinded investigational pharmacist in blocks of 4, and the 2 treatment arms were allocated in a 1:1 ratio within each block" |
| Blinding of participants and personnel (performance bias) | Low risk | Double‐blind |
| Blinding of outcome assessment (detection bias) | Low risk | "All CT scans were blinded to patient identity and date of birth as well as date of scan" |
| Incomplete outcome data (attrition bias) | Unclear risk | Analyses were performed on an ITT basis. Unclear whether all the 32 ADPKD patients completed the established follow‐up |
| Selective reporting (reporting bias) | Unclear risk | Computer‐generated random number list |
| Other bias | Low risk | The study was sponsored by Ipsen. The authors state that "The sponsor of the study had no role in the study design, data collection, data analysis, interpretation of the study results, or writing of the manuscript" |
| Methods |
| |
| Participants |
| |
| Interventions | Treatment group
Control group
Duration of intervention
| |
| Outcomes |
| |
| Notes |
| |
| Risk of bias | ||
| Bias | Authors' judgement | Support for judgement |
| Random sequence generation (selection bias) | Unclear risk | Randomised 2:1. Sequence generation not defined |
| Allocation concealment (selection bias) | Unclear risk | Insufficient information to permit judgement |
| Blinding of participants and personnel (performance bias) | High risk | Open‐label study |
| Blinding of outcome assessment (detection bias) | High risk | Open‐label study |
| Incomplete outcome data (attrition bias) | High risk | 6/40 (15%) patients in the mTOR group dropped or were lost to follow up. Unclear whether the study was analysed on ITT or PP basis |
| Selective reporting (reporting bias) | Unclear risk | Insufficient information to permit judgement |
| Other bias | Unclear risk | Insufficient information to permit judgement |
| Methods |
| |
| Participants |
| |
| Interventions | Treatment group
Control group
Duration of intervention
| |
| Outcomes |
| |
| Notes |
| |
| Risk of bias | ||
| Bias | Authors' judgement | Support for judgement |
| Random sequence generation (selection bias) | Unclear risk | Insufficient information to permit judgement |
| Allocation concealment (selection bias) | Unclear risk | Insufficient information to permit judgement |
| Blinding of participants and personnel (performance bias) | Unclear risk | Insufficient information to permit judgement |
| Blinding of outcome assessment (detection bias) | Unclear risk | Insufficient information to permit judgement |
| Incomplete outcome data (attrition bias) | Unclear risk | Insufficient information to permit judgement |
| Selective reporting (reporting bias) | Unclear risk | Insufficient information to permit judgement |
| Other bias | Unclear risk | Insufficient information to permit judgement |
| Methods |
| |
| Participants |
| |
| Interventions | Treatment group
Control group
Duration of intervention
| |
| Outcomes |
| |
| Notes |
| |
| Risk of bias | ||
| Bias | Authors' judgement | Support for judgement |
| Random sequence generation (selection bias) | Unclear risk | Insufficient information to permit judgement |
| Allocation concealment (selection bias) | Unclear risk | Insufficient information to permit judgement |
| Blinding of participants and personnel (performance bias) | Low risk | Double‐blind |
| Blinding of outcome assessment (detection bias) | Unclear risk | Insufficient information to permit judgement |
| Incomplete outcome data (attrition bias) | Unclear risk | Insufficient information to permit judgement |
| Selective reporting (reporting bias) | Unclear risk | Insufficient information to permit judgement |
| Other bias | Unclear risk | Insufficient information to permit judgement |
| Methods |
| |
| Participants |
| |
| Interventions | Treatment group
Control group
Duration of intervention
| |
| Outcomes |
| |
| Notes |
| |
| Risk of bias | ||
| Bias | Authors' judgement | Support for judgement |
| Random sequence generation (selection bias) | High risk | "...using the dynamic balancing method to ensure equal distributions" |
| Allocation concealment (selection bias) | Unclear risk | Insufficient information to permit judgement |
| Blinding of participants and personnel (performance bias) | Unclear risk | Insufficient information to permit judgement |
| Blinding of outcome assessment (detection bias) | Unclear risk | Insufficient information to permit judgement |
| Incomplete outcome data (attrition bias) | High risk | 12/49 (24.4%) patients analysed on ITT basis |
| Selective reporting (reporting bias) | Unclear risk | Insufficient information to permit judgement |
| Other bias | Unclear risk | Insufficient information to permit judgement |
| Methods |
| |
| Participants |
| |
| Interventions | Treatment group 1
Treatment group 2
Control group
Duration of intervention
| |
| Outcomes |
| |
| Notes |
| |
| Risk of bias | ||
| Bias | Authors' judgement | Support for judgement |
| Random sequence generation (selection bias) | Low risk | Randomisation by random number tables |
| Allocation concealment (selection bias) | Low risk | Block randomisation land adequately concealed |
| Blinding of participants and personnel (performance bias) | High risk | Open‐label study |
| Blinding of outcome assessment (detection bias) | High risk | Open‐label study |
| Incomplete outcome data (attrition bias) | Low risk | 2/55 (3.6%) patients analysed on ITT basis |
| Selective reporting (reporting bias) | Unclear risk | Insufficient information to permit judgement |
| Other bias | High risk | Sponsored by Wyeth and Pfizer |
| Methods |
| |
| Participants |
| |
| Interventions | Treatment group 1
Treatment group 2
Control group
Duration of intervention
| |
| Outcomes |
| |
| Notes |
| |
| Risk of bias | ||
| Bias | Authors' judgement | Support for judgement |
| Random sequence generation (selection bias) | Low risk | Randomisation using random number tables |
| Allocation concealment (selection bias) | Low risk | Block randomisation and adequately concealed |
| Blinding of participants and personnel (performance bias) | High risk | Open‐label study |
| Blinding of outcome assessment (detection bias) | High risk | Open‐label study |
| Incomplete outcome data (attrition bias) | Low risk | 2/55 (3.6%) patients were analysed on ITT basis |
| Selective reporting (reporting bias) | Unclear risk | Insufficient information to permit judgement |
| Other bias | High risk | Sponsored by Wyeth and Pfizer |
| Methods |
| |
| Participants |
| |
| Interventions | Treatment group 1
Treatment group 2
Control group
Duration of intervention
| |
| Outcomes |
| |
| Notes |
| |
| Risk of bias | ||
| Bias | Authors' judgement | Support for judgement |
| Random sequence generation (selection bias) | Low risk | Randomisation using random number tables |
| Allocation concealment (selection bias) | Low risk | Block randomisation and adequately concealed |
| Blinding of participants and personnel (performance bias) | High risk | Open‐label study |
| Blinding of outcome assessment (detection bias) | High risk | Open‐label study |
| Incomplete outcome data (attrition bias) | Low risk | 2/55 (3.6%) patients analysed on ITT basis |
| Selective reporting (reporting bias) | Unclear risk | Insufficient information to permit judgement |
| Other bias | High risk | Sponsored by Wyeth and Pfizer |
| Methods |
| |
| Participants |
| |
| Interventions | Treatment group
Control group
Duration of intervention
| |
| Outcomes |
| |
| Notes |
| |
| Risk of bias | ||
| Bias | Authors' judgement | Support for judgement |
| Random sequence generation (selection bias) | Low risk | Computer‐generated randomisation |
| Allocation concealment (selection bias) | Low risk | Blocks of four using a 1:1 allocation ratio |
| Blinding of participants and personnel (performance bias) | Low risk | Double‐blind |
| Blinding of outcome assessment (detection bias) | Low risk | Outcome assessors analysing liver and kidney volumes were blinded to treatment |
| Incomplete outcome data (attrition bias) | Low risk | All subjects completed the study |
| Selective reporting (reporting bias) | Unclear risk | Insufficient information to permit judgement |
| Other bias | Unclear risk | Insufficient information to permit judgement |
| Methods |
| |
| Participants |
| |
| Interventions | Treatment group
Control group
Duration of intervention
| |
| Outcomes |
| |
| Notes |
| |
| Risk of bias | ||
| Bias | Authors' judgement | Support for judgement |
| Random sequence generation (selection bias) | Unclear risk | Insufficient information to permit judgement |
| Allocation concealment (selection bias) | Unclear risk | Insufficient information to permit judgement |
| Blinding of participants and personnel (performance bias) | Unclear risk | Insufficient information to permit judgement |
| Blinding of outcome assessment (detection bias) | Low risk | "Kidneys were first manually outlined on all acquired digital images by a trained operator (AC), who was blind to the treatment phase" |
| Incomplete outcome data (attrition bias) | High risk | 6/21 patients withdrew. These patients were not included in final analyses |
| Selective reporting (reporting bias) | Unclear risk | Insufficient information to permit judgement |
| Other bias | High risk | Wyeth‐Lederle S.p.A. supplied the study drug |
| Methods |
| |
| Participants |
| |
| Interventions | Treatment group
Control group
Duration of intervention
| |
| Outcomes |
| |
| Notes |
| |
| Risk of bias | ||
| Bias | Authors' judgement | Support for judgement |
| Random sequence generation (selection bias) | Unclear risk | Insufficient information to permit judgement |
| Allocation concealment (selection bias) | Unclear risk | Insufficient information to permit judgement |
| Blinding of participants and personnel (performance bias) | High risk | Single blind |
| Blinding of outcome assessment (detection bias) | Low risk | "...observers were blinded to all clinical and radiologic data, as well as their first measurements and the results of the other observer" |
| Incomplete outcome data (attrition bias) | Low risk | All participants completed the study |
| Selective reporting (reporting bias) | Unclear risk | Insufficient information to permit judgement |
| Other bias | Unclear risk | Insufficient information to permit judgement |
| Methods |
| |
| Participants |
| |
| Interventions | Treatment group
Control group
Duration of intervention
| |
| Outcomes |
| |
| Notes |
| |
| Risk of bias | ||
| Bias | Authors' judgement | Support for judgement |
| Random sequence generation (selection bias) | Low risk | Randomisation by biostatistics unit independent of study team |
| Allocation concealment (selection bias) | Low risk | Sealed sequentially numbered opaque envelopes were used |
| Blinding of participants and personnel (performance bias) | High risk | Open‐label study |
| Blinding of outcome assessment (detection bias) | Low risk | "Each observer was unaware of all clinical data and the findings of the other observer, and the measurements were performed in random order" |
| Incomplete outcome data (attrition bias) | Low risk | 4/100 (4%) patients withdrew. These patients were analysed on ITT basis |
| Selective reporting (reporting bias) | Low risk | All defined outcomes were reported |
| Other bias | Low risk | "Wyeth Switzerland (now Pfizer), provided the study drug and an unrestricted research grant. The company had no role in the design of the trial or in the collection, analysis, or interpretation of the data or the writing of the manuscript" |
| Methods |
| |
| Participants |
| |
| Interventions | Treatment group
Control group
Duration of intervention
| |
| Outcomes |
| |
| Notes |
| |
| Risk of bias | ||
| Bias | Authors' judgement | Support for judgement |
| Random sequence generation (selection bias) | Unclear risk | Insufficient information to permit judgement |
| Allocation concealment (selection bias) | Unclear risk | Insufficient information to permit judgement |
| Blinding of participants and personnel (performance bias) | Unclear risk | Insufficient information to permit judgement |
| Blinding of outcome assessment (detection bias) | Unclear risk | Insufficient information to permit judgement |
| Incomplete outcome data (attrition bias) | Unclear risk | Insufficient information to permit judgement |
| Selective reporting (reporting bias) | Unclear risk | Insufficient information to permit judgement |
| Other bias | Unclear risk | Insufficient information to permit judgement |
| Methods |
| |
| Participants |
| |
| Interventions | Treatment group
Control group
Duration of intervention
| |
| Outcomes |
| |
| Notes |
| |
| Risk of bias | ||
| Bias | Authors' judgement | Support for judgement |
| Random sequence generation (selection bias) | Unclear risk | Insufficient information to permit judgement |
| Allocation concealment (selection bias) | Unclear risk | Insufficient information to permit judgement |
| Blinding of participants and personnel (performance bias) | Unclear risk | Insufficient information to permit judgement |
| Blinding of outcome assessment (detection bias) | Unclear risk | Insufficient information to permit judgement |
| Incomplete outcome data (attrition bias) | Unclear risk | Insufficient information to permit judgement |
| Selective reporting (reporting bias) | Unclear risk | Insufficient information to permit judgement |
| Other bias | High risk | Sponsored by Otsuka pharmaceutical |
| Methods |
| |
| Participants |
| |
| Interventions | Treatment group 1
Treatment group 2
Duration of intervention
| |
| Outcomes |
| |
| Notes |
| |
| Risk of bias | ||
| Bias | Authors' judgement | Support for judgement |
| Random sequence generation (selection bias) | Unclear risk | Insufficient information to permit judgement |
| Allocation concealment (selection bias) | Unclear risk | Insufficient information to permit judgement |
| Blinding of participants and personnel (performance bias) | Unclear risk | Insufficient information to permit judgement |
| Blinding of outcome assessment (detection bias) | Unclear risk | Insufficient information to permit judgement |
| Incomplete outcome data (attrition bias) | Unclear risk | Insufficient information to permit judgement |
| Selective reporting (reporting bias) | Unclear risk | Insufficient information to permit judgement |
| Other bias | High risk | Sponsored by Otsuka pharmaceutical |
| Methods |
| |
| Participants |
| |
| Interventions | Treatment group
Control group
Duration of intervention
| |
| Outcomes |
| |
| Notes |
| |
| Risk of bias | ||
| Bias | Authors' judgement | Support for judgement |
| Random sequence generation (selection bias) | Unclear risk | Insufficient information to permit judgement |
| Allocation concealment (selection bias) | Low risk | Allocation was performed in a 2:1 ratio to receive tolvaptan or placebo, and with stratification |
| Blinding of participants and personnel (performance bias) | Low risk | Double‐blind |
| Blinding of outcome assessment (detection bias) | Unclear risk | Insufficient information to permit judgement |
| Incomplete outcome data (attrition bias) | High risk | Data analysed on ITT basis. 221/961 (22.9%) and 67/483 (13.8%) patients, in the intervention and control group respectively, discontinued the study |
| Selective reporting (reporting bias) | Low risk | All selected outcomes were reported |
| Other bias | High risk | Supported by Otsuka Pharmaceuticals and Otsuka Pharmaceutical Development and Commercialization |
| Methods |
| |
| Participants |
| |
| Interventions | Treatment group
Control group
Duration of intervention
| |
| Outcomes |
| |
| Notes |
| |
| Risk of bias | ||
| Bias | Authors' judgement | Support for judgement |
| Random sequence generation (selection bias) | Unclear risk | Insufficient information to permit judgement |
| Allocation concealment (selection bias) | Unclear risk | Insufficient information to permit judgement |
| Blinding of participants and personnel (performance bias) | Unclear risk | Insufficient information to permit judgement |
| Blinding of outcome assessment (detection bias) | Unclear risk | Insufficient information to permit judgement |
| Incomplete outcome data (attrition bias) | Unclear risk | Insufficient information to permit judgement |
| Selective reporting (reporting bias) | Unclear risk | Insufficient information to permit judgement |
| Other bias | Unclear risk | Insufficient information to permit judgement |
| Methods |
| |
| Participants |
| |
| Interventions | Treatment group
Control group
Duration of intervention
| |
| Outcomes |
| |
| Notes |
| |
| Risk of bias | ||
| Bias | Authors' judgement | Support for judgement |
| Random sequence generation (selection bias) | Unclear risk | Insufficient information to permit judgement |
| Allocation concealment (selection bias) | Unclear risk | Insufficient information to permit judgement |
| Blinding of participants and personnel (performance bias) | Low risk | Double‐blind |
| Blinding of outcome assessment (detection bias) | Unclear risk | Insufficient information to permit judgement |
| Incomplete outcome data (attrition bias) | Unclear risk | Insufficient information to permit judgement |
| Selective reporting (reporting bias) | Unclear risk | Insufficient information to permit judgement |
| Other bias | Unclear risk | Insufficient information to permit judgement |
| Methods |
| |
| Participants |
| |
| Interventions | Treatment group
Control group
Duration of intervention
| |
| Outcomes |
| |
| Notes |
| |
| Risk of bias | ||
| Bias | Authors' judgement | Support for judgement |
| Random sequence generation (selection bias) | Unclear risk | "Randomization was performed for each patient in the pharmacy of our hospital" |
| Allocation concealment (selection bias) | Unclear risk | Insufficient information to permit judgement |
| Blinding of participants and personnel (performance bias) | Unclear risk | The normotensive group (72) participated in a randomised double‐blind placebo‐controlled study while the hypertensive group (35) was randomised for open‐label |
| Blinding of outcome assessment (detection bias) | Unclear risk | Insufficient information to permit judgement |
| Incomplete outcome data (attrition bias) | High risk | 10/72 normotensive and 7/35 hypertensive patients did not complete the 36 months follow‐up and were not included in the final analysis. Complete data were available in 89/106 (83.9%) patients |
| Selective reporting (reporting bias) | Unclear risk | Insufficient information to permit judgement |
| Other bias | High risk | "Enalapril and placebo were provided by Merck, Sharp and Dohme" |
| Methods |
| |
| Participants |
| |
| Interventions | Treatment group
Control group
Duration of intervention
| |
| Outcomes |
| |
| Notes |
| |
| Risk of bias | ||
| Bias | Authors' judgement | Support for judgement |
| Random sequence generation (selection bias) | Unclear risk | Insufficient information to permit judgement |
| Allocation concealment (selection bias) | Low risk | 1:1 ratio |
| Blinding of participants and personnel (performance bias) | Low risk | Double‐blind |
| Blinding of outcome assessment (detection bias) | Unclear risk | Insufficient information to permit judgement |
| Incomplete outcome data (attrition bias) | Low risk | 5/213 and 6/216 patients in the intervention and control groups respectively withdrew |
| Selective reporting (reporting bias) | Low risk | All defined outcomes were reported |
| Other bias | High risk | "Data collection and management were the responsibility of the sponsor" |
| Methods |
| |
| Participants |
| |
| Interventions | Treatment group
Control group
Duration of intervention
| |
| Outcomes |
| |
| Notes |
| |
| Risk of bias | ||
| Bias | Authors' judgement | Support for judgement |
| Random sequence generation (selection bias) | Unclear risk | Insufficient information to permit judgement |
| Allocation concealment (selection bias) | Unclear risk | Insufficient information to permit judgement |
| Blinding of participants and personnel (performance bias) | Unclear risk | Insufficient information to permit judgement |
| Blinding of outcome assessment (detection bias) | Unclear risk | Insufficient information to permit judgement |
| Incomplete outcome data (attrition bias) | Unclear risk | Insufficient information to permit judgement |
| Selective reporting (reporting bias) | Unclear risk | Insufficient information to permit judgement |
| Other bias | Unclear risk | Insufficient information to permit judgement |
| Methods |
| |
| Participants |
| |
| Interventions | Treatment group
Control group
Duration of intervention
| |
| Outcomes |
| |
| Notes |
| |
| Risk of bias | ||
| Bias | Authors' judgement | Support for judgement |
| Random sequence generation (selection bias) | Unclear risk | Insufficient information to permit judgement |
| Allocation concealment (selection bias) | Unclear risk | Insufficient information to permit judgement |
| Blinding of participants and personnel (performance bias) | Low risk | Insufficient information to permit judgement |
| Blinding of outcome assessment (detection bias) | Low risk | Outcome assessors (echo‐data) were blinded to patients |
| Incomplete outcome data (attrition bias) | High risk | 7/23 (30.4%) and 2/23 (8.6%) of patients in the intervention and control group respectively withdrew |
| Selective reporting (reporting bias) | Low risk | All defined outcomes were reported |
| Other bias | Unclear risk | "This research was supported by Astra‐Zeneca who provided the study medication" |
ACEi ‐ angiotensin‐converting enzyme inhibitor; ADPKD ‐ autosomal dominant polycystic kidney disease; AST ‐ aminotransferase; AVP ‐ arginine vasopressin; BP ‐ blood pressure; CHF ‐ congestive heart failure; CrCl ‐ creatinine clearance; CVA ‐ cerebrovascular accident; DBP ‐ DBP; DM ‐ diabetes mellitus; ESKD ‐ end‐stage kidney disease; eGFR ‐ estimated glomerular filtration rate; GFR ‐ glomerular filtration rate; HD ‐ haemodialysis; IHD ‐ Ischaemic heart disease; IM ‐ intramuscular; ITT ‐ intention‐to‐treat; LVMI ‐ left ventricular mass index; M/F ‐ male/female; MDRD ‐ Modification of Diet in Renal Disease; mGFR ‐ measured glomerular filtration rate; MI ‐ myocardial infarction; magnetic nuclear imaging ‐ magnetic resonance imaging; mTOR ‐ mammalian target of rapamycin; NSAID ‐ nonsteroidal anti‐inflammatory drug; NYHA ‐ New York Heart Association; PLD ‐ polycystic liver disease; PP ‐ per protocol; PVD ‐ peripheral vascular disease; RCT ‐ randomised control trial; RRT ‐ renal replacement therapy; SBP ‐ systolic blood pressure; SCr ‐ serum creatinine; SD ‐ standard deviation; UAE ‐ urinary albumin excretion; UPE ‐ urinary protein excretion
Characteristics of excluded studies [ordered by study ID]
| Study | Reason for exclusion |
| Outcome not relevant | |
| Halted in 2008 due to lack of funding; no results published | |
| Not RCT | |
| Wrong outcome | |
| Not RCT |
Characteristics of studies awaiting assessment [ordered by study ID]
| Methods | |
| Participants | |
| Interventions | |
| Outcomes | |
| Notes |
| Methods |
|
| Participants |
|
| Interventions | Treatment group
Control group
Duration of intervention
Co‐interventions
|
| Outcomes | Combined endpoint of 20% or greater change in:
Overall change in:
|
| Notes |
| Methods |
|
| Participants |
|
| Interventions | Study A
Study B
Co‐interventions
|
| Outcomes | Study A
Study B
|
| Notes |
| Methods | |
| Participants | |
| Interventions | |
| Outcomes | |
| Notes |
| Methods | |
| Participants | |
| Interventions | |
| Outcomes | |
| Notes |
Characteristics of ongoing studies [ordered by study ID]
| Trial name or title | Study of lanreotide to treat polycystic kidney disease (DIPAK1) |
| Methods |
|
| Participants |
|
| Interventions | Treatment group
Control group
|
| Outcomes |
|
| Starting date | June 2012 |
| Contact information | Dr Esther Meijer, Dr Ron Gansevoort; University Medical Centre Groningen, Netherlands |
| Notes | This study is ongoing, but not recruiting participants |
| Trial name or title | Effects of systemic NO‐inhibition on renal hemodynamics in patients with polycystic kidney disease and chronic glomerulonephritis |
| Methods |
|
| Participants |
|
| Interventions | Treatment group
Control
|
| Outcomes |
|
| Starting date | 2006 |
| Contact information | Prof Erling B Pedersen, Dept. of Medicine, Holstebro Hospital, 7500 Holstebro, Denmark |
| Notes | This study is ongoing, but not recruiting participants |
| Trial name or title | |
| Methods | |
| Participants | |
| Interventions | |
| Outcomes | |
| Starting date | |
| Contact information | |
| Notes | This study is currently recruiting patients |
ACEi ‐ angiotensin‐converting enzyme inhibitors; ACR ‐ albumin creatinine ratio; ADPKD ‐ autosomal dominant polycystic kidney disease; ARB ‐ angiotensin receptor blocker; BP ‐ blood pressure; eGFR ‐ estimated glomerular filtration rate; LVMI ‐ left ventricular mass index; MI ‐ myocardial infarction; NSAID ‐ nonsteroidal anti‐inflammatory drug; RCT ‐ randomised controlled trial; SCR ‐ serum creatinine; UAE ‐ urinary albumin excretion
Data and analyses
| Outcome or subgroup title | No. of studies | No. of participants | Statistical method | Effect size |
| 1 Serum creatinine Show forest plot | 2 | 42 | Mean Difference (IV, Random, 95% CI) | ‐0.02 [‐0.14, 0.09] |
| Analysis 1.1  Comparison 1 ACEi versus no treatment, Outcome 1 Serum creatinine. | ||||
| 2 GFR [mL/min/1.73 m²] Show forest plot | 3 | 103 | Mean Difference (IV, Random, 95% CI) | ‐3.41 [‐15.83, 9.01] |
| Analysis 1.2 ![Comparison 1 ACEi versus no treatment, Outcome 2 GFR [mL/min/1.73 m²].](/cdsr/doi/10.1002/14651858.CD010294.pub2/media/CDSR/CD010294/image_n/nCD010294-CMP-001-02.png) Comparison 1 ACEi versus no treatment, Outcome 2 GFR [mL/min/1.73 m²]. | ||||
| 3 Doubling of serum creatinine Show forest plot | 1 | Risk Ratio (M‐H, Random, 95% CI) | Totals not selected | |
| Analysis 1.3  Comparison 1 ACEi versus no treatment, Outcome 3 Doubling of serum creatinine. | ||||
| 4 Total kidney volume Show forest plot | 2 | 42 | Mean Difference (IV, Random, 95% CI) | ‐42.50 [‐115.68, 30.67] |
| Analysis 1.4  Comparison 1 ACEi versus no treatment, Outcome 4 Total kidney volume. | ||||
| 5 Albuminuria Show forest plot | 3 | 103 | Std. Mean Difference (IV, Random, 95% CI) | ‐0.12 [‐0.51, 0.26] |
| Analysis 1.5  Comparison 1 ACEi versus no treatment, Outcome 5 Albuminuria. | ||||
| 6 Systolic blood pressure Show forest plot | 2 | 42 | Mean Difference (IV, Random, 95% CI) | ‐5.44 [‐14.26, 3.38] |
| Analysis 1.6  Comparison 1 ACEi versus no treatment, Outcome 6 Systolic blood pressure. | ||||
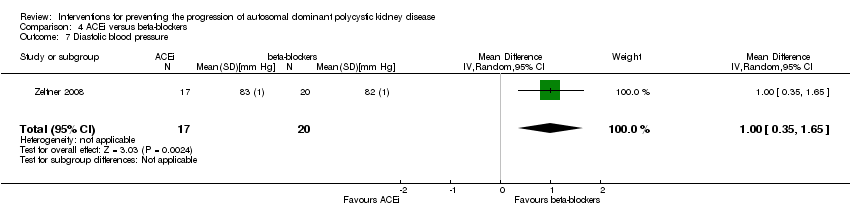
| 7 Diastolic blood pressure Show forest plot | 2 | 42 | Mean Difference (IV, Random, 95% CI) | ‐4.96 [‐8.88, ‐1.04] |
| Analysis 1.7  Comparison 1 ACEi versus no treatment, Outcome 7 Diastolic blood pressure. | ||||
| 8 Mean arterial pressure Show forest plot | 1 | 61 | Mean Difference (IV, Random, 95% CI) | ‐5.0 [‐6.29, ‐3.71] |
| Analysis 1.8  Comparison 1 ACEi versus no treatment, Outcome 8 Mean arterial pressure. | ||||
| Outcome or subgroup title | No. of studies | No. of participants | Statistical method | Effect size |
| 1 Creatinine Show forest plot | 1 | Mean Difference (IV, Random, 95% CI) | Totals not selected | |
| Analysis 2.1  Comparison 2 ACEi versus CCB, Outcome 1 Creatinine. | ||||
| 2 GFR [mL/min/1.73 m²] Show forest plot | 1 | 24 | Mean Difference (IV, Random, 95% CI) | ‐13.00 [‐17.56, ‐8.44] |
| Analysis 2.2 ![Comparison 2 ACEi versus CCB, Outcome 2 GFR [mL/min/1.73 m²].](/cdsr/doi/10.1002/14651858.CD010294.pub2/media/CDSR/CD010294/image_n/nCD010294-CMP-002-02.png) Comparison 2 ACEi versus CCB, Outcome 2 GFR [mL/min/1.73 m²]. | ||||
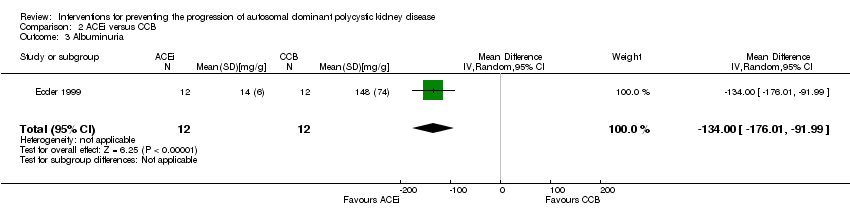
| 3 Albuminuria Show forest plot | 1 | 24 | Mean Difference (IV, Random, 95% CI) | ‐134.0 [‐176.01, ‐91.99] |
| Analysis 2.3  Comparison 2 ACEi versus CCB, Outcome 3 Albuminuria. | ||||
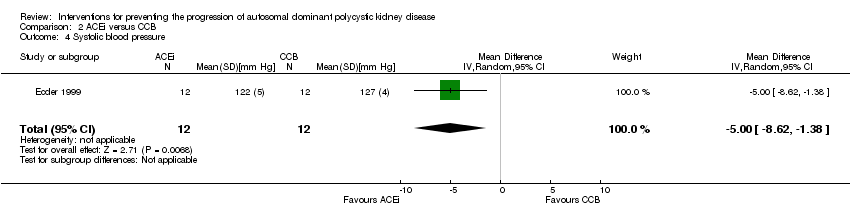
| 4 Systolic blood pressure Show forest plot | 1 | 24 | Mean Difference (IV, Random, 95% CI) | ‐5.0 [‐8.62, ‐1.38] |
| Analysis 2.4  Comparison 2 ACEi versus CCB, Outcome 4 Systolic blood pressure. | ||||
| 5 Diastolic blood pressure Show forest plot | 1 | 24 | Mean Difference (IV, Random, 95% CI) | ‐3.0 [‐5.40, ‐0.60] |
| Analysis 2.5  Comparison 2 ACEi versus CCB, Outcome 5 Diastolic blood pressure. | ||||
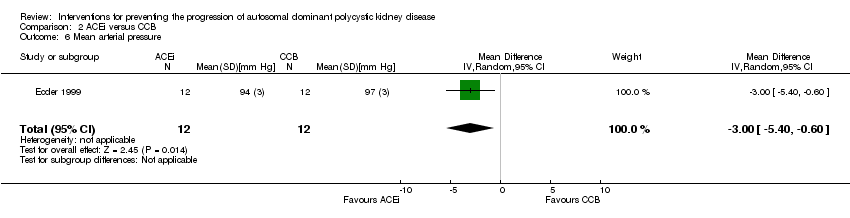
| 6 Mean arterial pressure Show forest plot | 1 | 24 | Mean Difference (IV, Random, 95% CI) | ‐3.0 [‐5.40, ‐0.60] |
| Analysis 2.6  Comparison 2 ACEi versus CCB, Outcome 6 Mean arterial pressure. | ||||
| Outcome or subgroup title | No. of studies | No. of participants | Statistical method | Effect size |
| 1 Serum creatinine Show forest plot | 2 | 52 | Mean Difference (IV, Random, 95% CI) | 0.00 [‐0.09, 0.10] |
| Analysis 3.1  Comparison 3 ACEi versus ARB, Outcome 1 Serum creatinine. | ||||
| 2 GFR [mL/min/1.73 m²] Show forest plot | 1 | 32 | Mean Difference (IV, Random, 95% CI) | ‐3.40 [‐22.69, 15.89] |
| Analysis 3.2 ![Comparison 3 ACEi versus ARB, Outcome 2 GFR [mL/min/1.73 m²].](/cdsr/doi/10.1002/14651858.CD010294.pub2/media/CDSR/CD010294/image_n/nCD010294-CMP-003-02.png) Comparison 3 ACEi versus ARB, Outcome 2 GFR [mL/min/1.73 m²]. | ||||
| 3 Systolic blood pressure Show forest plot | 1 | 32 | Mean Difference (IV, Random, 95% CI) | ‐3.5 [‐9.75, 2.75] |
| Analysis 3.3  Comparison 3 ACEi versus ARB, Outcome 3 Systolic blood pressure. | ||||
| 4 Diastolic blood pressure Show forest plot | 1 | 32 | Mean Difference (IV, Random, 95% CI) | ‐1.80 [‐5.23, 1.63] |
| Analysis 3.4  Comparison 3 ACEi versus ARB, Outcome 4 Diastolic blood pressure. | ||||
| 5 Mean arterial pressure Show forest plot | 1 | 32 | Mean Difference (IV, Random, 95% CI) | ‐2.20 [‐6.41, 2.01] |
| Analysis 3.5  Comparison 3 ACEi versus ARB, Outcome 5 Mean arterial pressure. | ||||
| Outcome or subgroup title | No. of studies | No. of participants | Statistical method | Effect size | ||||||
| 1 Creatinine Show forest plot | 1 | Mean Difference (IV, Random, 95% CI) | Totals not selected | |||||||
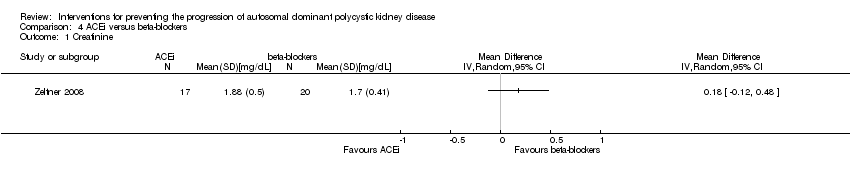
| Analysis 4.1  Comparison 4 ACEi versus beta‐blockers, Outcome 1 Creatinine. | ||||||||||
| 2 GFR [mL/min/1.73 m²] Show forest plot | 2 | 65 | Mean Difference (IV, Random, 95% CI) | ‐8.06 [‐29.62, 13.50] | ||||||
| Analysis 4.2 ![Comparison 4 ACEi versus beta‐blockers, Outcome 2 GFR [mL/min/1.73 m²].](/cdsr/doi/10.1002/14651858.CD010294.pub2/media/CDSR/CD010294/image_n/nCD010294-CMP-004-02.png) Comparison 4 ACEi versus beta‐blockers, Outcome 2 GFR [mL/min/1.73 m²]. | ||||||||||
| 3 GFR descriptive data Show forest plot | Other data | No numeric data | ||||||||
| Analysis 4.3
Comparison 4 ACEi versus beta‐blockers, Outcome 3 GFR descriptive data. | ||||||||||
| 4 Need for renal replacement therapy Show forest plot | 1 | 37 | Risk Ratio (M‐H, Random, 95% CI) | 0.39 [0.02, 8.97] | ||||||
| Analysis 4.4  Comparison 4 ACEi versus beta‐blockers, Outcome 4 Need for renal replacement therapy. | ||||||||||
| 5 Albuminuria Show forest plot | 2 | 65 | Std. Mean Difference (IV, Random, 95% CI) | ‐0.19 [‐1.77, 1.39] | ||||||
| Analysis 4.5  Comparison 4 ACEi versus beta‐blockers, Outcome 5 Albuminuria. | ||||||||||
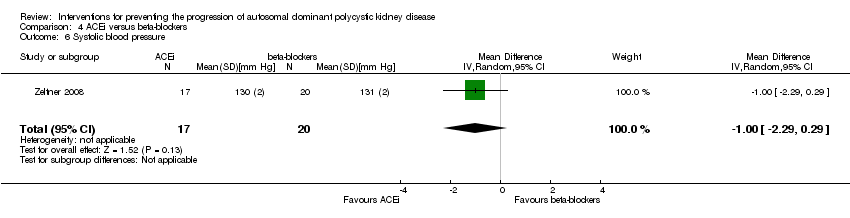
| 6 Systolic blood pressure Show forest plot | 1 | 37 | Mean Difference (IV, Random, 95% CI) | ‐1.0 [‐2.29, 0.29] | ||||||
| Analysis 4.6  Comparison 4 ACEi versus beta‐blockers, Outcome 6 Systolic blood pressure. | ||||||||||
| 7 Diastolic blood pressure Show forest plot | 1 | 37 | Mean Difference (IV, Random, 95% CI) | 1.0 [0.35, 1.65] | ||||||
| Analysis 4.7  Comparison 4 ACEi versus beta‐blockers, Outcome 7 Diastolic blood pressure. | ||||||||||
| 8 Mean arterial pressure Show forest plot | 1 | 28 | Mean Difference (IV, Random, 95% CI) | ‐3.0 [‐4.92, ‐1.08] | ||||||
| Analysis 4.8  Comparison 4 ACEi versus beta‐blockers, Outcome 8 Mean arterial pressure. | ||||||||||
| 9 Blood pressure descriptive data Show forest plot | Other data | No numeric data | ||||||||
| Analysis 4.9
Comparison 4 ACEi versus beta‐blockers, Outcome 9 Blood pressure descriptive data. | ||||||||||
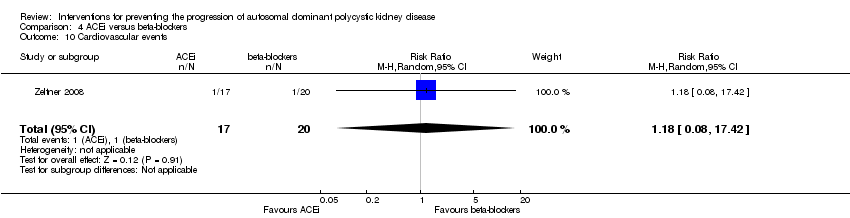
| 10 Cardiovascular events Show forest plot | 1 | 37 | Risk Ratio (M‐H, Random, 95% CI) | 1.18 [0.08, 17.42] | ||||||
| Analysis 4.10  Comparison 4 ACEi versus beta‐blockers, Outcome 10 Cardiovascular events. | ||||||||||
| Outcome or subgroup title | No. of studies | No. of participants | Statistical method | Effect size |
| 1 GFR [mL/min/1.73 m²] Show forest plot | 2 | 69 | Mean Difference (IV, Random, 95% CI) | ‐5.42 [‐15.04, 4.20] |
| Analysis 5.1 ![Comparison 5 ACEi alone versus ACEi + mTOR inhibitors, Outcome 1 GFR [mL/min/1.73 m²].](/cdsr/doi/10.1002/14651858.CD010294.pub2/media/CDSR/CD010294/image_n/nCD010294-CMP-005-01.png) Comparison 5 ACEi alone versus ACEi + mTOR inhibitors, Outcome 1 GFR [mL/min/1.73 m²]. | ||||
| 2 Total kidney volume Show forest plot | 2 | 69 | Mean Difference (IV, Random, 95% CI) | 285.79 [‐21.92, 593.50] |
| Analysis 5.2  Comparison 5 ACEi alone versus ACEi + mTOR inhibitors, Outcome 2 Total kidney volume. | ||||
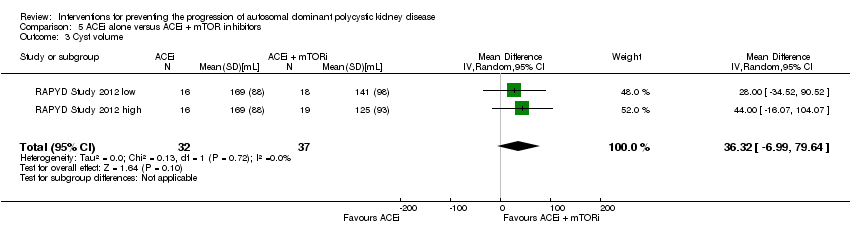
| 3 Cyst volume Show forest plot | 2 | 69 | Mean Difference (IV, Random, 95% CI) | 36.32 [‐6.99, 79.64] |
| Analysis 5.3  Comparison 5 ACEi alone versus ACEi + mTOR inhibitors, Outcome 3 Cyst volume. | ||||
| 4 Proteinuria Show forest plot | 2 | 69 | Mean Difference (IV, Random, 95% CI) | ‐0.26 [‐0.65, 0.12] |
| Analysis 5.4  Comparison 5 ACEi alone versus ACEi + mTOR inhibitors, Outcome 4 Proteinuria. | ||||
| 5 Mean arterial pressure Show forest plot | 2 | 69 | Mean Difference (IV, Random, 95% CI) | 0.64 [‐6.21, 7.50] |
| Analysis 5.5  Comparison 5 ACEi alone versus ACEi + mTOR inhibitors, Outcome 5 Mean arterial pressure. | ||||
| 6 Adverse events Show forest plot | 1 | Risk Ratio (M‐H, Random, 95% CI) | Subtotals only | |
| Analysis 5.6  Comparison 5 ACEi alone versus ACEi + mTOR inhibitors, Outcome 6 Adverse events. | ||||
| 6.1 Anaemia | 1 | 53 | Risk Ratio (M‐H, Random, 95% CI) | 0.45 [0.02, 8.82] |
| 6.2 Hyperlipidaemia | 1 | 53 | Risk Ratio (M‐H, Random, 95% CI) | 0.10 [0.01, 1.56] |
| 6.3 Infection | 1 | 53 | Risk Ratio (M‐H, Random, 95% CI) | 0.45 [0.02, 8.82] |
| 6.4 Oral ulcers | 1 | 53 | Risk Ratio (M‐H, Random, 95% CI) | 0.13 [0.01, 2.15] |
| Outcome or subgroup title | No. of studies | No. of participants | Statistical method | Effect size | ||||||
| 1 GFR [mL/min/1.73 m²] Show forest plot | 1 | 16 | Mean Difference (IV, Random, 95% CI) | ‐9.60 [‐28.18, 8.98] | ||||||
| Analysis 6.1 ![Comparison 6 ARB alone versus ARB + mTOR inhibitors, Outcome 1 GFR [mL/min/1.73 m²].](/cdsr/doi/10.1002/14651858.CD010294.pub2/media/CDSR/CD010294/image_n/nCD010294-CMP-006-01.png) Comparison 6 ARB alone versus ARB + mTOR inhibitors, Outcome 1 GFR [mL/min/1.73 m²]. | ||||||||||
| 2 Doubling of serum creatinine Show forest plot | 1 | Risk Ratio (M‐H, Random, 95% CI) | Totals not selected | |||||||
| Analysis 6.2  Comparison 6 ARB alone versus ARB + mTOR inhibitors, Outcome 2 Doubling of serum creatinine. | ||||||||||
| 3 Total kidney volume Show forest plot | 1 | 16 | Mean Difference (IV, Random, 95% CI) | 0.37 [0.04, 0.70] | ||||||
| Analysis 6.3  Comparison 6 ARB alone versus ARB + mTOR inhibitors, Outcome 3 Total kidney volume. | ||||||||||
| 4 Blood pressure descriptive data Show forest plot | Other data | No numeric data | ||||||||
| Analysis 6.4
Comparison 6 ARB alone versus ARB + mTOR inhibitors, Outcome 4 Blood pressure descriptive data. | ||||||||||
| 5 Infection Show forest plot | 1 | 16 | Risk Ratio (M‐H, Random, 95% CI) | 0.5 [0.13, 2.00] | ||||||
| Analysis 6.5  Comparison 6 ARB alone versus ARB + mTOR inhibitors, Outcome 5 Infection. | ||||||||||
| Outcome or subgroup title | No. of studies | No. of participants | Statistical method | Effect size |
| 1 Creatinine Show forest plot | 1 | Mean Difference (IV, Random, 95% CI) | Totals not selected | |
| Analysis 7.1  Comparison 7 ARB versus CCB, Outcome 1 Creatinine. | ||||
| 2 GFR [mL/min/1.73 m²] Show forest plot | 1 | 31 | Mean Difference (IV, Random, 95% CI) | 6.30 [‐8.49, 21.09] |
| Analysis 7.2 ![Comparison 7 ARB versus CCB, Outcome 2 GFR [mL/min/1.73 m²].](/cdsr/doi/10.1002/14651858.CD010294.pub2/media/CDSR/CD010294/image_n/nCD010294-CMP-007-02.png) Comparison 7 ARB versus CCB, Outcome 2 GFR [mL/min/1.73 m²]. | ||||
| 3 Doubling of serum creatinine Show forest plot | 1 | Risk Ratio (M‐H, Random, 95% CI) | Totals not selected | |
| Analysis 7.3  Comparison 7 ARB versus CCB, Outcome 3 Doubling of serum creatinine. | ||||
| 4 Proteinuria Show forest plot | 1 | 25 | Mean Difference (IV, Random, 95% CI) | ‐304.0 [‐578.54, ‐29.46] |
| Analysis 7.4  Comparison 7 ARB versus CCB, Outcome 4 Proteinuria. | ||||
| 5 Albuminuria Show forest plot | 1 | 24 | Mean Difference (IV, Random, 95% CI) | ‐238.0 [‐394.61, ‐81.39] |
| Analysis 7.5  Comparison 7 ARB versus CCB, Outcome 5 Albuminuria. | ||||
| Outcome or subgroup title | No. of studies | No. of participants | Statistical method | Effect size | ||||||
| 1 Creatinine Show forest plot | 1 | Mean Difference (IV, Random, 95% CI) | Totals not selected | |||||||
| Analysis 8.1  Comparison 8 V2R antagonists versus placebo, Outcome 1 Creatinine. | ||||||||||
| 2 GFR descriptive data Show forest plot | Other data | No numeric data | ||||||||
| Analysis 8.2
Comparison 8 V2R antagonists versus placebo, Outcome 2 GFR descriptive data. | ||||||||||
| 3 Doubling of serum creatinine Show forest plot | 1 | Risk Ratio (M‐H, Random, 95% CI) | Totals not selected | |||||||
| Analysis 8.3  Comparison 8 V2R antagonists versus placebo, Outcome 3 Doubling of serum creatinine. | ||||||||||
| 4 Total kidney volume descriptive data Show forest plot | Other data | No numeric data | ||||||||
| Analysis 8.4
Comparison 8 V2R antagonists versus placebo, Outcome 4 Total kidney volume descriptive data. | ||||||||||
| 5 Albuminuria Show forest plot | 1 | 1157 | Mean Difference (IV, Random, 95% CI) | ‐1.60 [‐3.95, 0.75] | ||||||
| Analysis 8.5  Comparison 8 V2R antagonists versus placebo, Outcome 5 Albuminuria. | ||||||||||
| 6 Kidney pain Show forest plot | 1 | 1444 | Risk Ratio (M‐H, Random, 95% CI) | 0.77 [0.66, 0.90] | ||||||
| Analysis 8.6  Comparison 8 V2R antagonists versus placebo, Outcome 6 Kidney pain. | ||||||||||
| 7 Adverse events Show forest plot | 2 | Risk Ratio (M‐H, Random, 95% CI) | Subtotals only | |||||||
| Analysis 8.7  Comparison 8 V2R antagonists versus placebo, Outcome 7 Adverse events. | ||||||||||
| 7.1 Headache | 2 | 1455 | Risk Ratio (M‐H, Random, 95% CI) | 1.03 [0.85, 1.25] | ||||||
| 7.2 Diarrhoea | 1 | 1444 | Risk Ratio (M‐H, Random, 95% CI) | 1.21 [0.90, 1.64] | ||||||
| 7.3 Dizziness | 1 | 1444 | Risk Ratio (M‐H, Random, 95% CI) | 1.30 [0.93, 1.83] | ||||||
| 7.4 Dry mouth | 2 | 1455 | Risk Ratio (M‐H, Random, 95% CI) | 1.33 [1.01, 1.76] | ||||||
| 7.5 Nausea | 1 | 1444 | Risk Ratio (M‐H, Random, 95% CI) | 0.86 [0.64, 1.18] | ||||||
| 7.6 Thirst | 1 | 1444 | Risk Ratio (M‐H, Random, 95% CI) | 2.70 [2.24, 3.24] | ||||||
| 7.7 Transaminase elevation | 1 | 1444 | Risk Ratio (M‐H, Random, 95% CI) | 2.26 [0.49, 10.43] | ||||||
| Outcome or subgroup title | No. of studies | No. of participants | Statistical method | Effect size |
| 1 Creatinine Show forest plot | 1 | Mean Difference (IV, Random, 95% CI) | Totals not selected | |
| Analysis 9.1  Comparison 9 High versus low dose V2R antagonists, Outcome 1 Creatinine. | ||||
| 2 Systolic blood pressure Show forest plot | 1 | 46 | Mean Difference (IV, Random, 95% CI) | ‐9.0 [‐16.98, ‐1.02] |
| Analysis 9.2  Comparison 9 High versus low dose V2R antagonists, Outcome 2 Systolic blood pressure. | ||||
| 3 Diastolic blood pressure Show forest plot | 1 | 46 | Mean Difference (IV, Random, 95% CI) | ‐6.0 [‐11.21, ‐0.79] |
| Analysis 9.3  Comparison 9 High versus low dose V2R antagonists, Outcome 3 Diastolic blood pressure. | ||||
| Outcome or subgroup title | No. of studies | No. of participants | Statistical method | Effect size | ||||||||||
| 1 GFR [mL/min/1.73 m²] Show forest plot | 2 | 115 | Mean Difference (IV, Random, 95% CI) | 4.45 [‐3.20, 12.11] | ||||||||||
| Analysis 10.1 ![Comparison 10 mTOR inhibitors versus no treatment, Outcome 1 GFR [mL/min/1.73 m²].](/cdsr/doi/10.1002/14651858.CD010294.pub2/media/CDSR/CD010294/image_n/nCD010294-CMP-010-01.png) Comparison 10 mTOR inhibitors versus no treatment, Outcome 1 GFR [mL/min/1.73 m²]. | ||||||||||||||
| 2 GFR descriptive data Show forest plot | Other data | No numeric data | ||||||||||||
| Analysis 10.2
Comparison 10 mTOR inhibitors versus no treatment, Outcome 2 GFR descriptive data. | ||||||||||||||
| 3 Need for renal replacement therapy Show forest plot | 1 | 431 | Risk Ratio (M‐H, Random, 95% CI) | 3.04 [0.12, 74.26] | ||||||||||
| Analysis 10.3  Comparison 10 mTOR inhibitors versus no treatment, Outcome 3 Need for renal replacement therapy. | ||||||||||||||
| 4 Need for transplantation Show forest plot | 1 | 431 | Risk Ratio (M‐H, Random, 95% CI) | 1.01 [0.06, 16.11] | ||||||||||
| Analysis 10.4  Comparison 10 mTOR inhibitors versus no treatment, Outcome 4 Need for transplantation. | ||||||||||||||
| 5 Total kidney volume Show forest plot | 2 | 115 | Mean Difference (IV, Random, 95% CI) | ‐0.08 [‐0.75, 0.59] | ||||||||||
| Analysis 10.5  Comparison 10 mTOR inhibitors versus no treatment, Outcome 5 Total kidney volume. | ||||||||||||||
| 6 Total kidney volume descriptive data Show forest plot | Other data | No numeric data | ||||||||||||
| Analysis 10.6
Comparison 10 mTOR inhibitors versus no treatment, Outcome 6 Total kidney volume descriptive data. | ||||||||||||||
| 7 Cyst volume Show forest plot | 1 | 15 | Mean Difference (IV, Random, 95% CI) | ‐55.0 [‐862.98, 752.98] | ||||||||||
| Analysis 10.7  Comparison 10 mTOR inhibitors versus no treatment, Outcome 7 Cyst volume. | ||||||||||||||
| 8 Cyst volume descriptive data Show forest plot | Other data | No numeric data | ||||||||||||
| Analysis 10.8
Comparison 10 mTOR inhibitors versus no treatment, Outcome 8 Cyst volume descriptive data. | ||||||||||||||
| 9 Parenchymal volume Show forest plot | 1 | 15 | Mean Difference (IV, Random, 95% CI) | 15.0 [‐75.44, 105.44] | ||||||||||
| Analysis 10.9  Comparison 10 mTOR inhibitors versus no treatment, Outcome 9 Parenchymal volume. | ||||||||||||||
| 10 Parenchymal volume descriptive data Show forest plot | Other data | No numeric data | ||||||||||||
| Analysis 10.10
Comparison 10 mTOR inhibitors versus no treatment, Outcome 10 Parenchymal volume descriptive data. | ||||||||||||||
| 11 Proteinuria Show forest plot | 2 | 446 | Std. Mean Difference (IV, Random, 95% CI) | 0.34 [‐0.29, 0.98] | ||||||||||
| Analysis 10.11  Comparison 10 mTOR inhibitors versus no treatment, Outcome 11 Proteinuria. | ||||||||||||||
| 12 Proteinuria descriptive data Show forest plot | Other data | No numeric data | ||||||||||||
| Analysis 10.12
Comparison 10 mTOR inhibitors versus no treatment, Outcome 12 Proteinuria descriptive data. | ||||||||||||||
| 13 Albuminuria Show forest plot | 2 | 115 | Std. Mean Difference (IV, Random, 95% CI) | 0.25 [‐0.27, 0.78] | ||||||||||
| Analysis 10.13  Comparison 10 mTOR inhibitors versus no treatment, Outcome 13 Albuminuria. | ||||||||||||||
| 14 Systolic blood pressure Show forest plot | 2 | 112 | Mean Difference (IV, Random, 95% CI) | 2.48 [‐2.07, 7.03] | ||||||||||
| Analysis 10.14  Comparison 10 mTOR inhibitors versus no treatment, Outcome 14 Systolic blood pressure. | ||||||||||||||
| 15 Diastolic blood pressure Show forest plot | 2 | 112 | Mean Difference (IV, Random, 95% CI) | 0.27 [‐3.30, 3.85] | ||||||||||
| Analysis 10.15  Comparison 10 mTOR inhibitors versus no treatment, Outcome 15 Diastolic blood pressure. | ||||||||||||||
| 16 Blood pressure descriptive data Show forest plot | Other data | No numeric data | ||||||||||||
| Analysis 10.16
Comparison 10 mTOR inhibitors versus no treatment, Outcome 16 Blood pressure descriptive data. | ||||||||||||||
| 17 All‐cause mortality Show forest plot | 1 | 431 | Risk Ratio (M‐H, Random, 95% CI) | 2.03 [0.19, 22.20] | ||||||||||
| Analysis 10.17  Comparison 10 mTOR inhibitors versus no treatment, Outcome 17 All‐cause mortality. | ||||||||||||||
| 18 Adverse effects Show forest plot | 3 | Risk Ratio (M‐H, Random, 95% CI) | Subtotals only | |||||||||||
| Analysis 10.18  Comparison 10 mTOR inhibitors versus no treatment, Outcome 18 Adverse effects. | ||||||||||||||
| 18.1 Anaemia | 1 | 431 | Risk Ratio (M‐H, Random, 95% CI) | 3.41 [1.79, 6.51] | ||||||||||
| 18.2 Angioedema | 3 | 560 | Risk Ratio (M‐H, Random, 95% CI) | 13.39 [2.56, 70.00] | ||||||||||
| 18.3 Diarrhoea | 3 | 560 | Risk Ratio (M‐H, Random, 95% CI) | 1.70 [1.26, 2.29] | ||||||||||
| 18.4 Hyperlipidaemia | 1 | 431 | Risk Ratio (M‐H, Random, 95% CI) | 5.68 [2.23, 14.43] | ||||||||||
| 18.5 Infection | 3 | 560 | Risk Ratio (M‐H, Random, 95% CI) | 1.14 [1.04, 1.25] | ||||||||||
| 18.6 Nausea | 1 | 431 | Risk Ratio (M‐H, Random, 95% CI) | 1.69 [0.85, 3.37] | ||||||||||
| 18.7 Oral ulcers | 3 | 560 | Risk Ratio (M‐H, Random, 95% CI) | 6.77 [4.42, 10.38] | ||||||||||
| Outcome or subgroup title | No. of studies | No. of participants | Statistical method | Effect size |
| 1 Creatinine Show forest plot | 2 | 91 | Mean Difference (IV, Random, 95% CI) | ‐0.43 [‐0.86, ‐0.01] |
| Analysis 11.1  Comparison 11 Somatostatin analogues versus placebo, Outcome 1 Creatinine. | ||||
| 2 GFR [mL/min/1.73 m²] Show forest plot | 2 | 79 | Mean Difference (IV, Random, 95% CI) | 9.50 [‐4.45, 23.44] |
| Analysis 11.2 ![Comparison 11 Somatostatin analogues versus placebo, Outcome 2 GFR [mL/min/1.73 m²].](/cdsr/doi/10.1002/14651858.CD010294.pub2/media/CDSR/CD010294/image_n/nCD010294-CMP-011-02.png) Comparison 11 Somatostatin analogues versus placebo, Outcome 2 GFR [mL/min/1.73 m²]. | ||||
| 3 Total kidney volume Show forest plot | 3 | 114 | Mean Difference (IV, Random, 95% CI) | ‐0.62 [‐1.22, ‐0.01] |
| Analysis 11.3  Comparison 11 Somatostatin analogues versus placebo, Outcome 3 Total kidney volume. | ||||
| 4 Cyst volume Show forest plot | 2 | 82 | Mean Difference (IV, Random, 95% CI) | ‐0.50 [‐1.18, 0.18] |
| Analysis 11.4  Comparison 11 Somatostatin analogues versus placebo, Outcome 4 Cyst volume. | ||||
| 5 Parenchymal volume Show forest plot | 2 | 82 | Mean Difference (IV, Random, 95% CI) | ‐67.67 [‐249.45, 114.12] |
| Analysis 11.5  Comparison 11 Somatostatin analogues versus placebo, Outcome 5 Parenchymal volume. | ||||
| 6 Proteinuria Show forest plot | 1 | 79 | Mean Difference (IV, Random, 95% CI) | ‐0.05 [‐0.17, 0.07] |
| Analysis 11.6  Comparison 11 Somatostatin analogues versus placebo, Outcome 6 Proteinuria. | ||||
| 7 Albuminuria Show forest plot | 2 | 91 | Std. Mean Difference (IV, Random, 95% CI) | ‐0.10 [‐0.51, 0.31] |
| Analysis 11.7  Comparison 11 Somatostatin analogues versus placebo, Outcome 7 Albuminuria. | ||||
| 8 Systolic blood pressure Show forest plot | 2 | 91 | Mean Difference (IV, Random, 95% CI) | 0.79 [‐3.54, 5.13] |
| Analysis 11.8  Comparison 11 Somatostatin analogues versus placebo, Outcome 8 Systolic blood pressure. | ||||
| 9 Diastolic blood pressure Show forest plot | 2 | 91 | Mean Difference (IV, Random, 95% CI) | ‐0.38 [‐3.68, 2.92] |
| Analysis 11.9  Comparison 11 Somatostatin analogues versus placebo, Outcome 9 Diastolic blood pressure. | ||||
| 10 Mean arterial pressure Show forest plot | 1 | 79 | Mean Difference (IV, Random, 95% CI) | ‐0.10 [‐3.66, 3.46] |
| Analysis 11.10  Comparison 11 Somatostatin analogues versus placebo, Outcome 10 Mean arterial pressure. | ||||
| 11 Adverse events Show forest plot | 2 | Risk Ratio (M‐H, Random, 95% CI) | Subtotals only | |
| Analysis 11.11  Comparison 11 Somatostatin analogues versus placebo, Outcome 11 Adverse events. | ||||
| 11.1 Alopecia | 1 | 79 | Risk Ratio (M‐H, Random, 95% CI) | 4.88 [0.24, 98.47] |
| 11.2 Anaemia | 1 | 79 | Risk Ratio (M‐H, Random, 95% CI) | 1.3 [0.50, 3.40] |
| 11.3 Diarrhoea | 2 | 91 | Risk Ratio (M‐H, Random, 95% CI) | 3.72 [1.43, 9.68] |
| 11.4 Dizziness | 1 | 79 | Risk Ratio (M‐H, Random, 95% CI) | 0.98 [0.06, 15.05] |
| 11.5 Infection | 1 | 79 | Risk Ratio (M‐H, Random, 95% CI) | 1.24 [0.64, 2.39] |
| Outcome or subgroup title | No. of studies | No. of participants | Statistical method | Effect size | ||||||
| 1 Total kidney volume descriptive data Show forest plot | Other data | No numeric data | ||||||||
| Analysis 12.1
Comparison 12 Somatostatin analogues + mTOR inhibitors versus somatostatin analogues alone, Outcome 1 Total kidney volume descriptive data. | ||||||||||
| Outcome or subgroup title | No. of studies | No. of participants | Statistical method | Effect size |
| 1 Creatinine Show forest plot | 2 | 22 | Mean Difference (IV, Random, 95% CI) | ‐0.13 [‐0.52, 0.26] |
| Analysis 13.1  Comparison 13 Antiplatelet agents versus placebo, Outcome 1 Creatinine. | ||||
| 2 GFR [mL/min/1.73 m²] Show forest plot | 2 | 22 | Mean Difference (IV, Random, 95% CI) | 2.24 [‐8.05, 12.53] |
| Analysis 13.2 ![Comparison 13 Antiplatelet agents versus placebo, Outcome 2 GFR [mL/min/1.73 m²].](/cdsr/doi/10.1002/14651858.CD010294.pub2/media/CDSR/CD010294/image_n/nCD010294-CMP-013-02.png) Comparison 13 Antiplatelet agents versus placebo, Outcome 2 GFR [mL/min/1.73 m²]. | ||||
| 3 Albuminuria Show forest plot | 2 | 22 | Mean Difference (IV, Random, 95% CI) | ‐60.53 [‐129.06, 8.01] |
| Analysis 13.3  Comparison 13 Antiplatelet agents versus placebo, Outcome 3 Albuminuria. | ||||
| 4 Systolic blood pressure Show forest plot | 2 | 22 | Mean Difference (IV, Random, 95% CI) | 5.04 [‐7.34, 17.43] |
| Analysis 13.4  Comparison 13 Antiplatelet agents versus placebo, Outcome 4 Systolic blood pressure. | ||||
| 5 Diastolic blood pressure Show forest plot | 2 | 22 | Mean Difference (IV, Random, 95% CI) | 6.24 [‐3.27, 15.74] |
| Analysis 13.5  Comparison 13 Antiplatelet agents versus placebo, Outcome 5 Diastolic blood pressure. | ||||
| Outcome or subgroup title | No. of studies | No. of participants | Statistical method | Effect size |
| 1 Creatinine Show forest plot | 1 | Mean Difference (IV, Random, 95% CI) | Totals not selected | |
| Analysis 14.1  Comparison 14 Eicosapentaenoic acids versus standard therapy, Outcome 1 Creatinine. | ||||
| 2 GFR [mL/min/1.73 m²] Show forest plot | 1 | 41 | Mean Difference (IV, Random, 95% CI) | 6.10 [‐11.16, 23.36] |
| Analysis 14.2 ![Comparison 14 Eicosapentaenoic acids versus standard therapy, Outcome 2 GFR [mL/min/1.73 m²].](/cdsr/doi/10.1002/14651858.CD010294.pub2/media/CDSR/CD010294/image_n/nCD010294-CMP-014-02.png) Comparison 14 Eicosapentaenoic acids versus standard therapy, Outcome 2 GFR [mL/min/1.73 m²]. | ||||
| 3 Total kidney volume Show forest plot | 1 | 41 | Mean Difference (IV, Random, 95% CI) | ‐209.0 [‐729.06, 311.06] |
| Analysis 14.3  Comparison 14 Eicosapentaenoic acids versus standard therapy, Outcome 3 Total kidney volume. | ||||
| 4 Albuminuria Show forest plot | 1 | 41 | Mean Difference (IV, Random, 95% CI) | 82.40 [‐162.09, 326.89] |
| Analysis 14.4  Comparison 14 Eicosapentaenoic acids versus standard therapy, Outcome 4 Albuminuria. | ||||
| Outcome or subgroup title | No. of studies | No. of participants | Statistical method | Effect size | ||||||
| 1 GFR descriptive data Show forest plot | Other data | No numeric data | ||||||||
| Analysis 15.1
Comparison 15 Statins versus no treatment, Outcome 1 GFR descriptive data. | ||||||||||
| 2 GFR descriptive data from cross‐over studies Show forest plot | Other data | No numeric data | ||||||||
| Analysis 15.2
Comparison 15 Statins versus no treatment, Outcome 2 GFR descriptive data from cross‐over studies. | ||||||||||
| 3 Proteinuria descriptive data Show forest plot | Other data | No numeric data | ||||||||
| Analysis 15.3
Comparison 15 Statins versus no treatment, Outcome 3 Proteinuria descriptive data. | ||||||||||
| 4 Systolic blood pressure Show forest plot | 1 | 49 | Mean Difference (IV, Random, 95% CI) | 1.70 [‐6.39, 9.79] | ||||||
| Analysis 15.4  Comparison 15 Statins versus no treatment, Outcome 4 Systolic blood pressure. | ||||||||||
| 5 Diastolic blood pressure Show forest plot | 1 | 49 | Mean Difference (IV, Random, 95% CI) | ‐1.40 [‐5.54, 2.74] | ||||||
| Analysis 15.5  Comparison 15 Statins versus no treatment, Outcome 5 Diastolic blood pressure. | ||||||||||
| Outcome or subgroup title | No. of studies | No. of participants | Statistical method | Effect size |
| 1 Creatinine Show forest plot | 1 | Mean Difference (IV, Random, 95% CI) | Totals not selected | |
| Analysis 16.1  Comparison 16 Vitamin D versus traditional Chinese herbal medicine, Outcome 1 Creatinine. | ||||
| 2 GFR Show forest plot | 1 | 34 | Mean Difference (IV, Random, 95% CI) | 22.60 [0.92, 44.28] |
| Analysis 16.2  Comparison 16 Vitamin D versus traditional Chinese herbal medicine, Outcome 2 GFR. | ||||

Study flow diagram
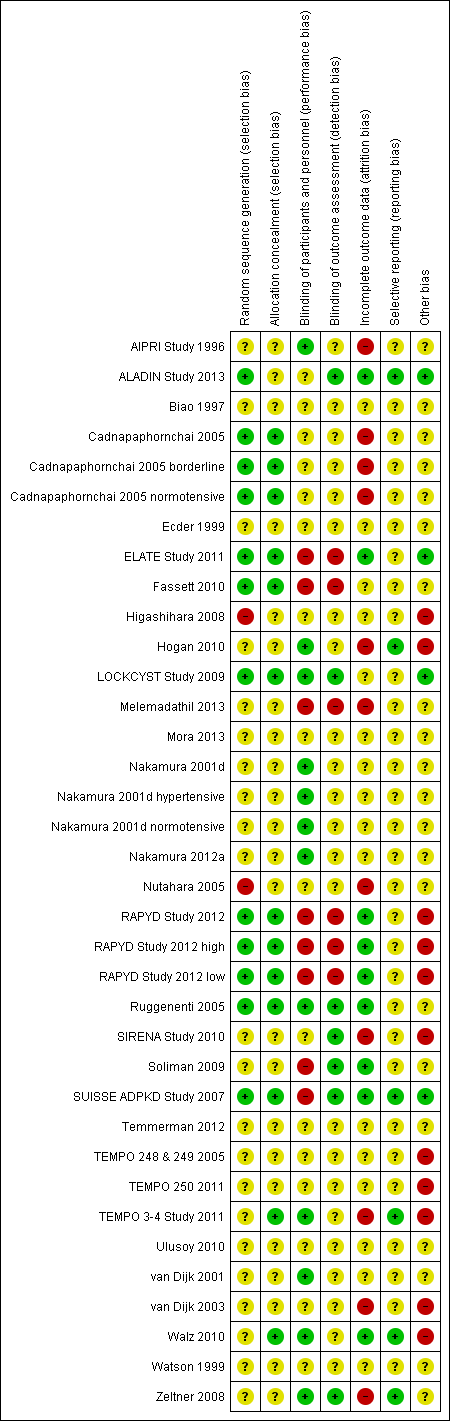
Risk of bias summary: review authors' judgements about each risk of bias item for each included study
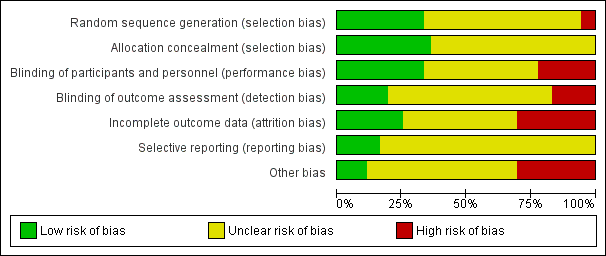
Risk of bias graph: review authors' judgements about each risk of bias item presented as percentages across all included studies

Comparison 1 ACEi versus no treatment, Outcome 1 Serum creatinine.
![Comparison 1 ACEi versus no treatment, Outcome 2 GFR [mL/min/1.73 m²].](/es/cdsr/doi/10.1002/14651858.CD010294.pub2/media/CDSR/CD010294/image_n/nCD010294-CMP-001-02.png)
Comparison 1 ACEi versus no treatment, Outcome 2 GFR [mL/min/1.73 m²].

Comparison 1 ACEi versus no treatment, Outcome 3 Doubling of serum creatinine.

Comparison 1 ACEi versus no treatment, Outcome 4 Total kidney volume.

Comparison 1 ACEi versus no treatment, Outcome 5 Albuminuria.

Comparison 1 ACEi versus no treatment, Outcome 6 Systolic blood pressure.
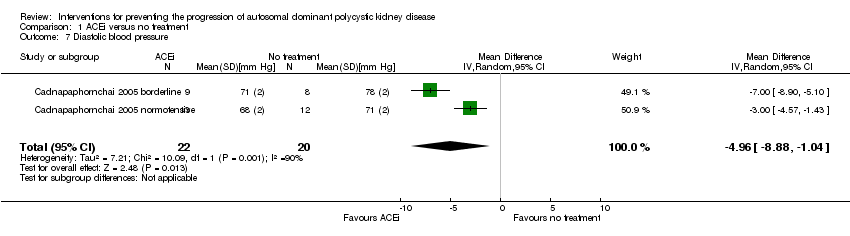
Comparison 1 ACEi versus no treatment, Outcome 7 Diastolic blood pressure.

Comparison 1 ACEi versus no treatment, Outcome 8 Mean arterial pressure.

Comparison 2 ACEi versus CCB, Outcome 1 Creatinine.
![Comparison 2 ACEi versus CCB, Outcome 2 GFR [mL/min/1.73 m²].](/es/cdsr/doi/10.1002/14651858.CD010294.pub2/media/CDSR/CD010294/image_n/nCD010294-CMP-002-02.png)
Comparison 2 ACEi versus CCB, Outcome 2 GFR [mL/min/1.73 m²].
Comparison 2 ACEi versus CCB, Outcome 3 Albuminuria.
Comparison 2 ACEi versus CCB, Outcome 4 Systolic blood pressure.

Comparison 2 ACEi versus CCB, Outcome 5 Diastolic blood pressure.
Comparison 2 ACEi versus CCB, Outcome 6 Mean arterial pressure.

Comparison 3 ACEi versus ARB, Outcome 1 Serum creatinine.
![Comparison 3 ACEi versus ARB, Outcome 2 GFR [mL/min/1.73 m²].](/es/cdsr/doi/10.1002/14651858.CD010294.pub2/media/CDSR/CD010294/image_n/nCD010294-CMP-003-02.png)
Comparison 3 ACEi versus ARB, Outcome 2 GFR [mL/min/1.73 m²].

Comparison 3 ACEi versus ARB, Outcome 3 Systolic blood pressure.

Comparison 3 ACEi versus ARB, Outcome 4 Diastolic blood pressure.

Comparison 3 ACEi versus ARB, Outcome 5 Mean arterial pressure.
Comparison 4 ACEi versus beta‐blockers, Outcome 1 Creatinine.
![Comparison 4 ACEi versus beta‐blockers, Outcome 2 GFR [mL/min/1.73 m²].](/es/cdsr/doi/10.1002/14651858.CD010294.pub2/media/CDSR/CD010294/image_n/nCD010294-CMP-004-02.png)
Comparison 4 ACEi versus beta‐blockers, Outcome 2 GFR [mL/min/1.73 m²].
| Study | |
| Watson 1999 | eGFR (Cockcroft‐Gault formula) significantly decreased in both groups over the 3 year period (ACEi: 19.3 mL/min/1.73 m2; beta‐blockers: 14.3 mL/min/1.73 m2) but there was no difference in the rate of decline between groups. |
Comparison 4 ACEi versus beta‐blockers, Outcome 3 GFR descriptive data.

Comparison 4 ACEi versus beta‐blockers, Outcome 4 Need for renal replacement therapy.

Comparison 4 ACEi versus beta‐blockers, Outcome 5 Albuminuria.
Comparison 4 ACEi versus beta‐blockers, Outcome 6 Systolic blood pressure.
Comparison 4 ACEi versus beta‐blockers, Outcome 7 Diastolic blood pressure.

Comparison 4 ACEi versus beta‐blockers, Outcome 8 Mean arterial pressure.
| Study | |
| Watson 1999 | Good blood pressure control was achieved in both groups (ACEi: 132.6/84.6 mm Hg; beta‐blockers: 130.9/84.5 mm Hg) |
Comparison 4 ACEi versus beta‐blockers, Outcome 9 Blood pressure descriptive data.
Comparison 4 ACEi versus beta‐blockers, Outcome 10 Cardiovascular events.
![Comparison 5 ACEi alone versus ACEi + mTOR inhibitors, Outcome 1 GFR [mL/min/1.73 m²].](/es/cdsr/doi/10.1002/14651858.CD010294.pub2/media/CDSR/CD010294/image_n/nCD010294-CMP-005-01.png)
Comparison 5 ACEi alone versus ACEi + mTOR inhibitors, Outcome 1 GFR [mL/min/1.73 m²].

Comparison 5 ACEi alone versus ACEi + mTOR inhibitors, Outcome 2 Total kidney volume.
Comparison 5 ACEi alone versus ACEi + mTOR inhibitors, Outcome 3 Cyst volume.

Comparison 5 ACEi alone versus ACEi + mTOR inhibitors, Outcome 4 Proteinuria.

Comparison 5 ACEi alone versus ACEi + mTOR inhibitors, Outcome 5 Mean arterial pressure.

Comparison 5 ACEi alone versus ACEi + mTOR inhibitors, Outcome 6 Adverse events.
![Comparison 6 ARB alone versus ARB + mTOR inhibitors, Outcome 1 GFR [mL/min/1.73 m²].](/es/cdsr/doi/10.1002/14651858.CD010294.pub2/media/CDSR/CD010294/image_n/nCD010294-CMP-006-01.png)
Comparison 6 ARB alone versus ARB + mTOR inhibitors, Outcome 1 GFR [mL/min/1.73 m²].

Comparison 6 ARB alone versus ARB + mTOR inhibitors, Outcome 2 Doubling of serum creatinine.

Comparison 6 ARB alone versus ARB + mTOR inhibitors, Outcome 3 Total kidney volume.
| Study | |
| Soliman 2009 | The mean diastolic pressure decreased by 2.5 to 4.0 mm Hg in the ARB + mTOR group and increased by 0.5 to 1.5 mm Hg in the ARB alone group The mean systolic pressure decreased by 2.5 to 5.0 mm Hg in the ARB + mTOR group and increased by 1.0 to 2.5 mm Hg in the ARB alone group |
Comparison 6 ARB alone versus ARB + mTOR inhibitors, Outcome 4 Blood pressure descriptive data.

Comparison 6 ARB alone versus ARB + mTOR inhibitors, Outcome 5 Infection.

Comparison 7 ARB versus CCB, Outcome 1 Creatinine.
![Comparison 7 ARB versus CCB, Outcome 2 GFR [mL/min/1.73 m²].](/es/cdsr/doi/10.1002/14651858.CD010294.pub2/media/CDSR/CD010294/image_n/nCD010294-CMP-007-02.png)
Comparison 7 ARB versus CCB, Outcome 2 GFR [mL/min/1.73 m²].
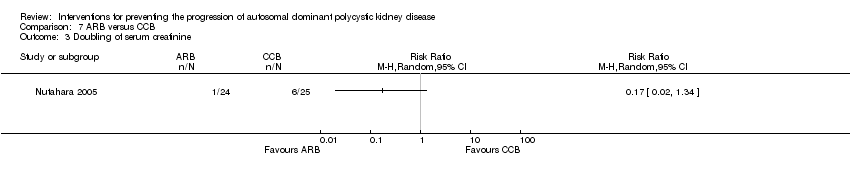
Comparison 7 ARB versus CCB, Outcome 3 Doubling of serum creatinine.

Comparison 7 ARB versus CCB, Outcome 4 Proteinuria.

Comparison 7 ARB versus CCB, Outcome 5 Albuminuria.
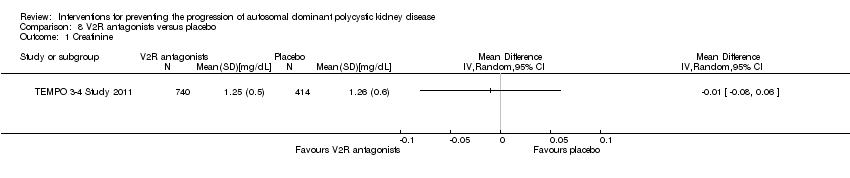
Comparison 8 V2R antagonists versus placebo, Outcome 1 Creatinine.
| Study | |
| TEMPO 3‐4 Study 2011 | The slope of kidney function (as assessed by means of the reciprocal of the SCr level) from the end of dose escalation to month 36, favoured V2R‐antagonists, with a slope of −2.61 (mg/mL)−1 per year, as compared with −3.81 (mg/mL)−1 per year with placebo; the treatment effect was an increase of 1.20 (mg/mL)−1 per year (95% CI 0.62 to 1.78; P < 0.001) |
Comparison 8 V2R antagonists versus placebo, Outcome 2 GFR descriptive data.

Comparison 8 V2R antagonists versus placebo, Outcome 3 Doubling of serum creatinine.
| Study | |
| TEMPO 3‐4 Study 2011 | quote: "Over the 3‐year period, total kidney volume increased by 2.8% per year (95% confidence interval [CI], 2.5 to 3.1) with V2R‐antagonists versus 5.5% per year (95% CI, 5.1 to 6.0) with placebo" |
Comparison 8 V2R antagonists versus placebo, Outcome 4 Total kidney volume descriptive data.
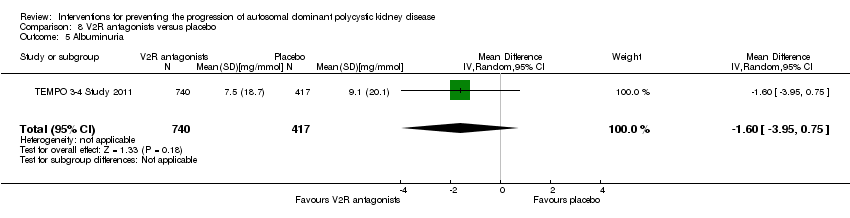
Comparison 8 V2R antagonists versus placebo, Outcome 5 Albuminuria.

Comparison 8 V2R antagonists versus placebo, Outcome 6 Kidney pain.
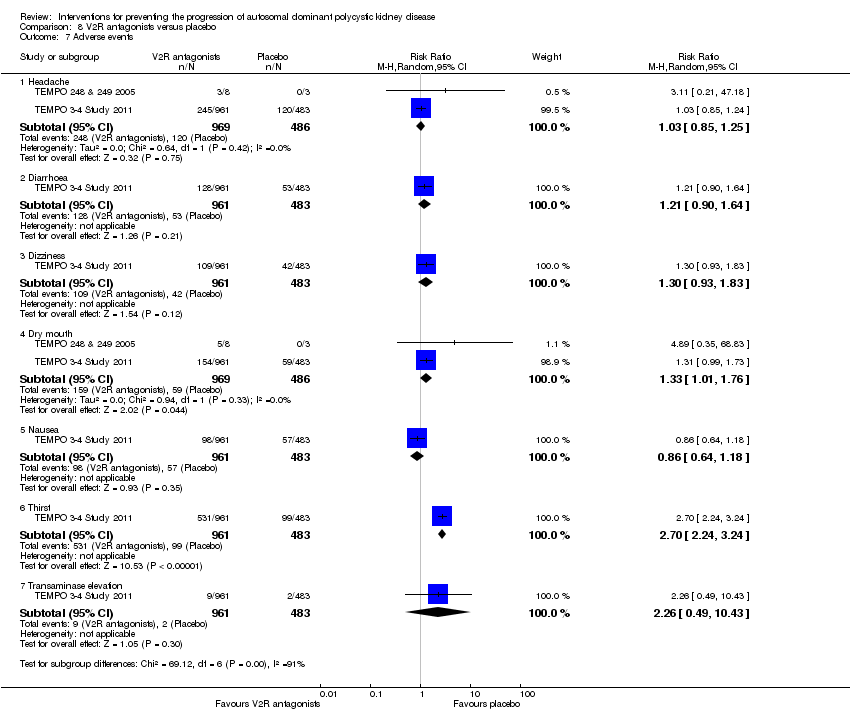
Comparison 8 V2R antagonists versus placebo, Outcome 7 Adverse events.
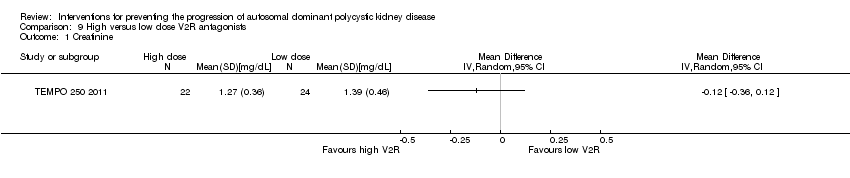
Comparison 9 High versus low dose V2R antagonists, Outcome 1 Creatinine.

Comparison 9 High versus low dose V2R antagonists, Outcome 2 Systolic blood pressure.

Comparison 9 High versus low dose V2R antagonists, Outcome 3 Diastolic blood pressure.
![Comparison 10 mTOR inhibitors versus no treatment, Outcome 1 GFR [mL/min/1.73 m²].](/es/cdsr/doi/10.1002/14651858.CD010294.pub2/media/CDSR/CD010294/image_n/nCD010294-CMP-010-01.png)
Comparison 10 mTOR inhibitors versus no treatment, Outcome 1 GFR [mL/min/1.73 m²].
| Study | |
| Walz 2010 | quote: "The estimated GFR decreased by 8.9 ml per minute in the mTOR‐inhibitors group and 7.7 ml per minute in the placebo group (P = 0.15) over the 2‐year study period" |
Comparison 10 mTOR inhibitors versus no treatment, Outcome 2 GFR descriptive data.

Comparison 10 mTOR inhibitors versus no treatment, Outcome 3 Need for renal replacement therapy.

Comparison 10 mTOR inhibitors versus no treatment, Outcome 4 Need for transplantation.

Comparison 10 mTOR inhibitors versus no treatment, Outcome 5 Total kidney volume.
| Study | |
| Melemadathil 2013 | quote: "there was a statistically significant reduction in total kidney volume when mTOR treatment was extended for 1 year" |
| Mora 2013 | quote: "the mTOR group showed a kidney volume growth of 9,4 ±1,2mL/year compared with 11 ± 1.4 mL/year in control group" |
| Walz 2010 | quote: "among patients receiving mTOR‐inhibitors, the mean total kidney volume increased from 2028 ml to 2063 ml at 1 year and to 2176 ml at 2 years, and among those receiving placebo, it increased from 1911 ml to 2061 ml and to 2287 ml, respectively" |
Comparison 10 mTOR inhibitors versus no treatment, Outcome 6 Total kidney volume descriptive data.

Comparison 10 mTOR inhibitors versus no treatment, Outcome 7 Cyst volume.
| Study | |
| Melemadathil 2013 | quote: "there was a statistically significant reduction in total cyst volume when mTOR treatment was extended for 1 year" |
| Walz 2010 | quote: "The cyst volume increased by 76 ml at 1 year and 181 ml at 2 years in the mTOR‐inhibitors group and by 98 ml and 215 ml, respectively, in the placebo group" |
Comparison 10 mTOR inhibitors versus no treatment, Outcome 8 Cyst volume descriptive data.

Comparison 10 mTOR inhibitors versus no treatment, Outcome 9 Parenchymal volume.
| Study | |
| Melemadathil 2013 | quote: "there was a small but significant increase in renal parenchymal volume in patients receiving mTOR" |
| Walz 2010 | quote: "The parenchymal volume increased by 26 ml at 1 year and by 56 ml at 2 years in the mTOR‐inhibitors group; the corresponding changes in the placebo group were 62 and 93 ml" |
Comparison 10 mTOR inhibitors versus no treatment, Outcome 10 Parenchymal volume descriptive data.

Comparison 10 mTOR inhibitors versus no treatment, Outcome 11 Proteinuria.
| Study | |
| Melemadathil 2013 | quote: "there was a statistically significant increase in proteinuria in the mTOR arm as compared to the standard treatment group at the end of 6 months" |
Comparison 10 mTOR inhibitors versus no treatment, Outcome 12 Proteinuria descriptive data.

Comparison 10 mTOR inhibitors versus no treatment, Outcome 13 Albuminuria.

Comparison 10 mTOR inhibitors versus no treatment, Outcome 14 Systolic blood pressure.

Comparison 10 mTOR inhibitors versus no treatment, Outcome 15 Diastolic blood pressure.
| Study | |
| Walz 2010 | quote: "The change from baseline in the systolic blood pressure at 24 months was −2.0 mm Hg in the mTOR‐inhibitors group and −1.5 mm Hg in the placebo group (P = 0.76); the corresponding changes in diastolic blood pressure were −2.7 mm Hg and −2.6 mm Hg (P = 0.89)" |
Comparison 10 mTOR inhibitors versus no treatment, Outcome 16 Blood pressure descriptive data.

Comparison 10 mTOR inhibitors versus no treatment, Outcome 17 All‐cause mortality.

Comparison 10 mTOR inhibitors versus no treatment, Outcome 18 Adverse effects.

Comparison 11 Somatostatin analogues versus placebo, Outcome 1 Creatinine.
![Comparison 11 Somatostatin analogues versus placebo, Outcome 2 GFR [mL/min/1.73 m²].](/es/cdsr/doi/10.1002/14651858.CD010294.pub2/media/CDSR/CD010294/image_n/nCD010294-CMP-011-02.png)
Comparison 11 Somatostatin analogues versus placebo, Outcome 2 GFR [mL/min/1.73 m²].
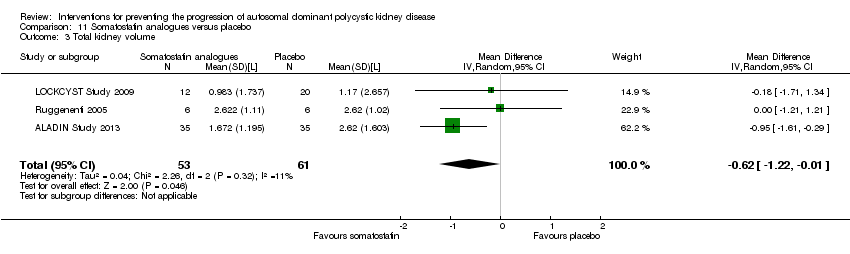
Comparison 11 Somatostatin analogues versus placebo, Outcome 3 Total kidney volume.

Comparison 11 Somatostatin analogues versus placebo, Outcome 4 Cyst volume.
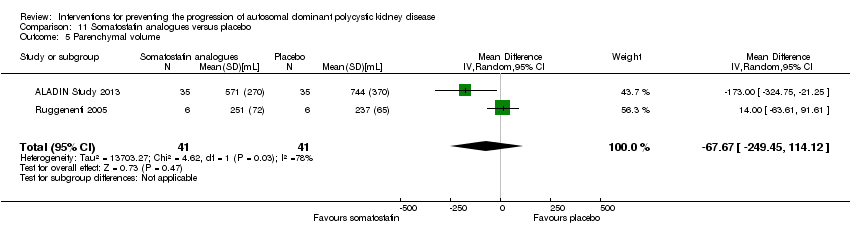
Comparison 11 Somatostatin analogues versus placebo, Outcome 5 Parenchymal volume.
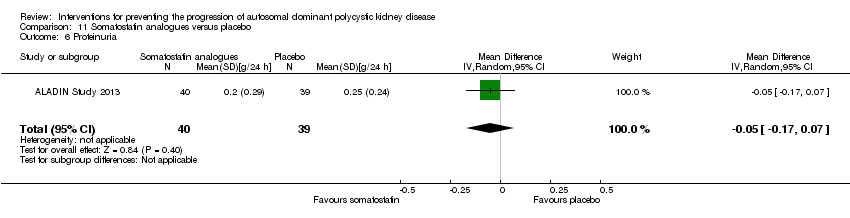
Comparison 11 Somatostatin analogues versus placebo, Outcome 6 Proteinuria.

Comparison 11 Somatostatin analogues versus placebo, Outcome 7 Albuminuria.

Comparison 11 Somatostatin analogues versus placebo, Outcome 8 Systolic blood pressure.

Comparison 11 Somatostatin analogues versus placebo, Outcome 9 Diastolic blood pressure.

Comparison 11 Somatostatin analogues versus placebo, Outcome 10 Mean arterial pressure.

Comparison 11 Somatostatin analogues versus placebo, Outcome 11 Adverse events.
| Study | |
| ELATE Study 2011 | quote: "The median kidney volume was not affected by octreotide and did not change significantly in the 6 patients through the course of the trial (from 798 mL (IQR 675–1960 mL) at baseline to 811 mL (IQR 653–1960 mL) after 48 weeks, p=0.75). Likewise, octreotide‐everolimus combination treatment (n=6) did not affect kidney volume over the course of 48 weeks (from 623 mL (IQR 483–1110 ml) to 602 mL (IQR 493–1259 mL), p=0.75). Change in kidney volume did not differ between treatment arms (p=1.00)" |
Comparison 12 Somatostatin analogues + mTOR inhibitors versus somatostatin analogues alone, Outcome 1 Total kidney volume descriptive data.

Comparison 13 Antiplatelet agents versus placebo, Outcome 1 Creatinine.
![Comparison 13 Antiplatelet agents versus placebo, Outcome 2 GFR [mL/min/1.73 m²].](/es/cdsr/doi/10.1002/14651858.CD010294.pub2/media/CDSR/CD010294/image_n/nCD010294-CMP-013-02.png)
Comparison 13 Antiplatelet agents versus placebo, Outcome 2 GFR [mL/min/1.73 m²].
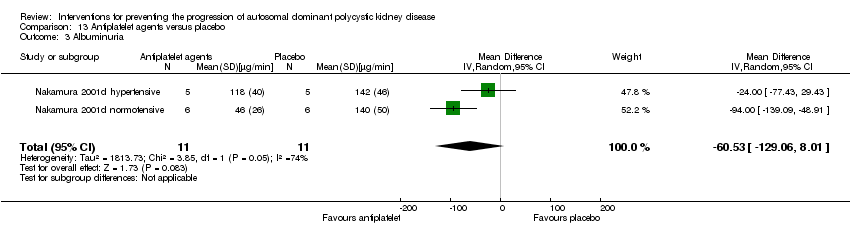
Comparison 13 Antiplatelet agents versus placebo, Outcome 3 Albuminuria.

Comparison 13 Antiplatelet agents versus placebo, Outcome 4 Systolic blood pressure.
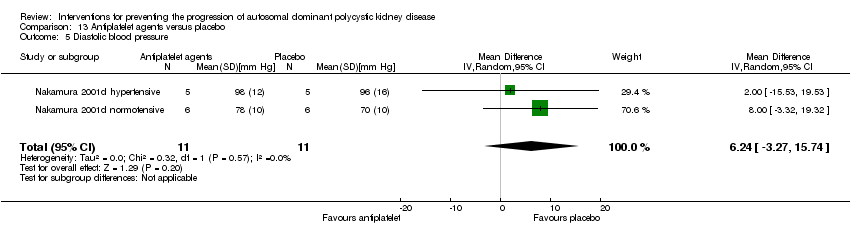
Comparison 13 Antiplatelet agents versus placebo, Outcome 5 Diastolic blood pressure.

Comparison 14 Eicosapentaenoic acids versus standard therapy, Outcome 1 Creatinine.
![Comparison 14 Eicosapentaenoic acids versus standard therapy, Outcome 2 GFR [mL/min/1.73 m²].](/es/cdsr/doi/10.1002/14651858.CD010294.pub2/media/CDSR/CD010294/image_n/nCD010294-CMP-014-02.png)
Comparison 14 Eicosapentaenoic acids versus standard therapy, Outcome 2 GFR [mL/min/1.73 m²].

Comparison 14 Eicosapentaenoic acids versus standard therapy, Outcome 3 Total kidney volume.

Comparison 14 Eicosapentaenoic acids versus standard therapy, Outcome 4 Albuminuria.
| Study | |
| Fassett 2010 | There was a 23% reduction in the rate of GFR change in statins‐treated patients compared with controls, although not statistically significant |
Comparison 15 Statins versus no treatment, Outcome 1 GFR descriptive data.
| Study | |
| van Dijk 2001 | Compared to placebo, treatment with statins significantly increased GFR from 124 ± 4 mL/min to 132 ± 6 mL/min (p < 0.05) |
Comparison 15 Statins versus no treatment, Outcome 2 GFR descriptive data from cross‐over studies.
| Study | |
| Fassett 2010 | Urinary protein excretion decreased by 2.8% in statins‐treated patients and increased by 21.2% in controls |
Comparison 15 Statins versus no treatment, Outcome 3 Proteinuria descriptive data.
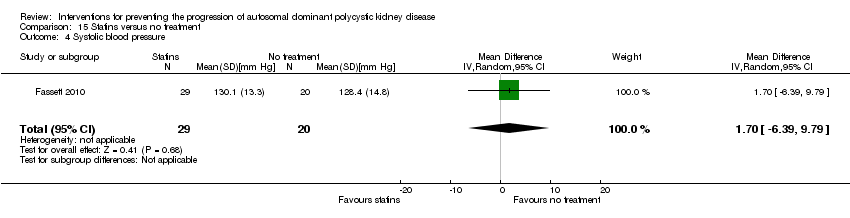
Comparison 15 Statins versus no treatment, Outcome 4 Systolic blood pressure.

Comparison 15 Statins versus no treatment, Outcome 5 Diastolic blood pressure.
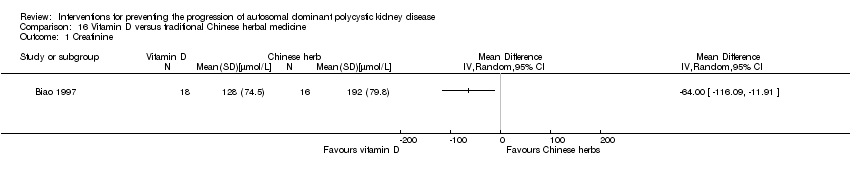
Comparison 16 Vitamin D versus traditional Chinese herbal medicine, Outcome 1 Creatinine.

Comparison 16 Vitamin D versus traditional Chinese herbal medicine, Outcome 2 GFR.
| Outcome or subgroup title | No. of studies | No. of participants | Statistical method | Effect size |
| 1 Serum creatinine Show forest plot | 2 | 42 | Mean Difference (IV, Random, 95% CI) | ‐0.02 [‐0.14, 0.09] |
| 2 GFR [mL/min/1.73 m²] Show forest plot | 3 | 103 | Mean Difference (IV, Random, 95% CI) | ‐3.41 [‐15.83, 9.01] |
| 3 Doubling of serum creatinine Show forest plot | 1 | Risk Ratio (M‐H, Random, 95% CI) | Totals not selected | |
| 4 Total kidney volume Show forest plot | 2 | 42 | Mean Difference (IV, Random, 95% CI) | ‐42.50 [‐115.68, 30.67] |
| 5 Albuminuria Show forest plot | 3 | 103 | Std. Mean Difference (IV, Random, 95% CI) | ‐0.12 [‐0.51, 0.26] |
| 6 Systolic blood pressure Show forest plot | 2 | 42 | Mean Difference (IV, Random, 95% CI) | ‐5.44 [‐14.26, 3.38] |
| 7 Diastolic blood pressure Show forest plot | 2 | 42 | Mean Difference (IV, Random, 95% CI) | ‐4.96 [‐8.88, ‐1.04] |
| 8 Mean arterial pressure Show forest plot | 1 | 61 | Mean Difference (IV, Random, 95% CI) | ‐5.0 [‐6.29, ‐3.71] |
| Outcome or subgroup title | No. of studies | No. of participants | Statistical method | Effect size |
| 1 Creatinine Show forest plot | 1 | Mean Difference (IV, Random, 95% CI) | Totals not selected | |
| 2 GFR [mL/min/1.73 m²] Show forest plot | 1 | 24 | Mean Difference (IV, Random, 95% CI) | ‐13.00 [‐17.56, ‐8.44] |
| 3 Albuminuria Show forest plot | 1 | 24 | Mean Difference (IV, Random, 95% CI) | ‐134.0 [‐176.01, ‐91.99] |
| 4 Systolic blood pressure Show forest plot | 1 | 24 | Mean Difference (IV, Random, 95% CI) | ‐5.0 [‐8.62, ‐1.38] |
| 5 Diastolic blood pressure Show forest plot | 1 | 24 | Mean Difference (IV, Random, 95% CI) | ‐3.0 [‐5.40, ‐0.60] |
| 6 Mean arterial pressure Show forest plot | 1 | 24 | Mean Difference (IV, Random, 95% CI) | ‐3.0 [‐5.40, ‐0.60] |
| Outcome or subgroup title | No. of studies | No. of participants | Statistical method | Effect size |
| 1 Serum creatinine Show forest plot | 2 | 52 | Mean Difference (IV, Random, 95% CI) | 0.00 [‐0.09, 0.10] |
| 2 GFR [mL/min/1.73 m²] Show forest plot | 1 | 32 | Mean Difference (IV, Random, 95% CI) | ‐3.40 [‐22.69, 15.89] |
| 3 Systolic blood pressure Show forest plot | 1 | 32 | Mean Difference (IV, Random, 95% CI) | ‐3.5 [‐9.75, 2.75] |
| 4 Diastolic blood pressure Show forest plot | 1 | 32 | Mean Difference (IV, Random, 95% CI) | ‐1.80 [‐5.23, 1.63] |
| 5 Mean arterial pressure Show forest plot | 1 | 32 | Mean Difference (IV, Random, 95% CI) | ‐2.20 [‐6.41, 2.01] |
| Outcome or subgroup title | No. of studies | No. of participants | Statistical method | Effect size |
| 1 Creatinine Show forest plot | 1 | Mean Difference (IV, Random, 95% CI) | Totals not selected | |
| 2 GFR [mL/min/1.73 m²] Show forest plot | 2 | 65 | Mean Difference (IV, Random, 95% CI) | ‐8.06 [‐29.62, 13.50] |
| 3 GFR descriptive data Show forest plot | Other data | No numeric data | ||
| 4 Need for renal replacement therapy Show forest plot | 1 | 37 | Risk Ratio (M‐H, Random, 95% CI) | 0.39 [0.02, 8.97] |
| 5 Albuminuria Show forest plot | 2 | 65 | Std. Mean Difference (IV, Random, 95% CI) | ‐0.19 [‐1.77, 1.39] |
| 6 Systolic blood pressure Show forest plot | 1 | 37 | Mean Difference (IV, Random, 95% CI) | ‐1.0 [‐2.29, 0.29] |
| 7 Diastolic blood pressure Show forest plot | 1 | 37 | Mean Difference (IV, Random, 95% CI) | 1.0 [0.35, 1.65] |
| 8 Mean arterial pressure Show forest plot | 1 | 28 | Mean Difference (IV, Random, 95% CI) | ‐3.0 [‐4.92, ‐1.08] |
| 9 Blood pressure descriptive data Show forest plot | Other data | No numeric data | ||
| 10 Cardiovascular events Show forest plot | 1 | 37 | Risk Ratio (M‐H, Random, 95% CI) | 1.18 [0.08, 17.42] |
| Outcome or subgroup title | No. of studies | No. of participants | Statistical method | Effect size |
| 1 GFR [mL/min/1.73 m²] Show forest plot | 2 | 69 | Mean Difference (IV, Random, 95% CI) | ‐5.42 [‐15.04, 4.20] |
| 2 Total kidney volume Show forest plot | 2 | 69 | Mean Difference (IV, Random, 95% CI) | 285.79 [‐21.92, 593.50] |
| 3 Cyst volume Show forest plot | 2 | 69 | Mean Difference (IV, Random, 95% CI) | 36.32 [‐6.99, 79.64] |
| 4 Proteinuria Show forest plot | 2 | 69 | Mean Difference (IV, Random, 95% CI) | ‐0.26 [‐0.65, 0.12] |
| 5 Mean arterial pressure Show forest plot | 2 | 69 | Mean Difference (IV, Random, 95% CI) | 0.64 [‐6.21, 7.50] |
| 6 Adverse events Show forest plot | 1 | Risk Ratio (M‐H, Random, 95% CI) | Subtotals only | |
| 6.1 Anaemia | 1 | 53 | Risk Ratio (M‐H, Random, 95% CI) | 0.45 [0.02, 8.82] |
| 6.2 Hyperlipidaemia | 1 | 53 | Risk Ratio (M‐H, Random, 95% CI) | 0.10 [0.01, 1.56] |
| 6.3 Infection | 1 | 53 | Risk Ratio (M‐H, Random, 95% CI) | 0.45 [0.02, 8.82] |
| 6.4 Oral ulcers | 1 | 53 | Risk Ratio (M‐H, Random, 95% CI) | 0.13 [0.01, 2.15] |
| Outcome or subgroup title | No. of studies | No. of participants | Statistical method | Effect size |
| 1 GFR [mL/min/1.73 m²] Show forest plot | 1 | 16 | Mean Difference (IV, Random, 95% CI) | ‐9.60 [‐28.18, 8.98] |
| 2 Doubling of serum creatinine Show forest plot | 1 | Risk Ratio (M‐H, Random, 95% CI) | Totals not selected | |
| 3 Total kidney volume Show forest plot | 1 | 16 | Mean Difference (IV, Random, 95% CI) | 0.37 [0.04, 0.70] |
| 4 Blood pressure descriptive data Show forest plot | Other data | No numeric data | ||
| 5 Infection Show forest plot | 1 | 16 | Risk Ratio (M‐H, Random, 95% CI) | 0.5 [0.13, 2.00] |
| Outcome or subgroup title | No. of studies | No. of participants | Statistical method | Effect size |
| 1 Creatinine Show forest plot | 1 | Mean Difference (IV, Random, 95% CI) | Totals not selected | |
| 2 GFR [mL/min/1.73 m²] Show forest plot | 1 | 31 | Mean Difference (IV, Random, 95% CI) | 6.30 [‐8.49, 21.09] |
| 3 Doubling of serum creatinine Show forest plot | 1 | Risk Ratio (M‐H, Random, 95% CI) | Totals not selected | |
| 4 Proteinuria Show forest plot | 1 | 25 | Mean Difference (IV, Random, 95% CI) | ‐304.0 [‐578.54, ‐29.46] |
| 5 Albuminuria Show forest plot | 1 | 24 | Mean Difference (IV, Random, 95% CI) | ‐238.0 [‐394.61, ‐81.39] |
| Outcome or subgroup title | No. of studies | No. of participants | Statistical method | Effect size |
| 1 Creatinine Show forest plot | 1 | Mean Difference (IV, Random, 95% CI) | Totals not selected | |
| 2 GFR descriptive data Show forest plot | Other data | No numeric data | ||
| 3 Doubling of serum creatinine Show forest plot | 1 | Risk Ratio (M‐H, Random, 95% CI) | Totals not selected | |
| 4 Total kidney volume descriptive data Show forest plot | Other data | No numeric data | ||
| 5 Albuminuria Show forest plot | 1 | 1157 | Mean Difference (IV, Random, 95% CI) | ‐1.60 [‐3.95, 0.75] |
| 6 Kidney pain Show forest plot | 1 | 1444 | Risk Ratio (M‐H, Random, 95% CI) | 0.77 [0.66, 0.90] |
| 7 Adverse events Show forest plot | 2 | Risk Ratio (M‐H, Random, 95% CI) | Subtotals only | |
| 7.1 Headache | 2 | 1455 | Risk Ratio (M‐H, Random, 95% CI) | 1.03 [0.85, 1.25] |
| 7.2 Diarrhoea | 1 | 1444 | Risk Ratio (M‐H, Random, 95% CI) | 1.21 [0.90, 1.64] |
| 7.3 Dizziness | 1 | 1444 | Risk Ratio (M‐H, Random, 95% CI) | 1.30 [0.93, 1.83] |
| 7.4 Dry mouth | 2 | 1455 | Risk Ratio (M‐H, Random, 95% CI) | 1.33 [1.01, 1.76] |
| 7.5 Nausea | 1 | 1444 | Risk Ratio (M‐H, Random, 95% CI) | 0.86 [0.64, 1.18] |
| 7.6 Thirst | 1 | 1444 | Risk Ratio (M‐H, Random, 95% CI) | 2.70 [2.24, 3.24] |
| 7.7 Transaminase elevation | 1 | 1444 | Risk Ratio (M‐H, Random, 95% CI) | 2.26 [0.49, 10.43] |
| Outcome or subgroup title | No. of studies | No. of participants | Statistical method | Effect size |
| 1 Creatinine Show forest plot | 1 | Mean Difference (IV, Random, 95% CI) | Totals not selected | |
| 2 Systolic blood pressure Show forest plot | 1 | 46 | Mean Difference (IV, Random, 95% CI) | ‐9.0 [‐16.98, ‐1.02] |
| 3 Diastolic blood pressure Show forest plot | 1 | 46 | Mean Difference (IV, Random, 95% CI) | ‐6.0 [‐11.21, ‐0.79] |
| Outcome or subgroup title | No. of studies | No. of participants | Statistical method | Effect size |
| 1 GFR [mL/min/1.73 m²] Show forest plot | 2 | 115 | Mean Difference (IV, Random, 95% CI) | 4.45 [‐3.20, 12.11] |
| 2 GFR descriptive data Show forest plot | Other data | No numeric data | ||
| 3 Need for renal replacement therapy Show forest plot | 1 | 431 | Risk Ratio (M‐H, Random, 95% CI) | 3.04 [0.12, 74.26] |
| 4 Need for transplantation Show forest plot | 1 | 431 | Risk Ratio (M‐H, Random, 95% CI) | 1.01 [0.06, 16.11] |
| 5 Total kidney volume Show forest plot | 2 | 115 | Mean Difference (IV, Random, 95% CI) | ‐0.08 [‐0.75, 0.59] |
| 6 Total kidney volume descriptive data Show forest plot | Other data | No numeric data | ||
| 7 Cyst volume Show forest plot | 1 | 15 | Mean Difference (IV, Random, 95% CI) | ‐55.0 [‐862.98, 752.98] |
| 8 Cyst volume descriptive data Show forest plot | Other data | No numeric data | ||
| 9 Parenchymal volume Show forest plot | 1 | 15 | Mean Difference (IV, Random, 95% CI) | 15.0 [‐75.44, 105.44] |
| 10 Parenchymal volume descriptive data Show forest plot | Other data | No numeric data | ||
| 11 Proteinuria Show forest plot | 2 | 446 | Std. Mean Difference (IV, Random, 95% CI) | 0.34 [‐0.29, 0.98] |
| 12 Proteinuria descriptive data Show forest plot | Other data | No numeric data | ||
| 13 Albuminuria Show forest plot | 2 | 115 | Std. Mean Difference (IV, Random, 95% CI) | 0.25 [‐0.27, 0.78] |
| 14 Systolic blood pressure Show forest plot | 2 | 112 | Mean Difference (IV, Random, 95% CI) | 2.48 [‐2.07, 7.03] |
| 15 Diastolic blood pressure Show forest plot | 2 | 112 | Mean Difference (IV, Random, 95% CI) | 0.27 [‐3.30, 3.85] |
| 16 Blood pressure descriptive data Show forest plot | Other data | No numeric data | ||
| 17 All‐cause mortality Show forest plot | 1 | 431 | Risk Ratio (M‐H, Random, 95% CI) | 2.03 [0.19, 22.20] |
| 18 Adverse effects Show forest plot | 3 | Risk Ratio (M‐H, Random, 95% CI) | Subtotals only | |
| 18.1 Anaemia | 1 | 431 | Risk Ratio (M‐H, Random, 95% CI) | 3.41 [1.79, 6.51] |
| 18.2 Angioedema | 3 | 560 | Risk Ratio (M‐H, Random, 95% CI) | 13.39 [2.56, 70.00] |
| 18.3 Diarrhoea | 3 | 560 | Risk Ratio (M‐H, Random, 95% CI) | 1.70 [1.26, 2.29] |
| 18.4 Hyperlipidaemia | 1 | 431 | Risk Ratio (M‐H, Random, 95% CI) | 5.68 [2.23, 14.43] |
| 18.5 Infection | 3 | 560 | Risk Ratio (M‐H, Random, 95% CI) | 1.14 [1.04, 1.25] |
| 18.6 Nausea | 1 | 431 | Risk Ratio (M‐H, Random, 95% CI) | 1.69 [0.85, 3.37] |
| 18.7 Oral ulcers | 3 | 560 | Risk Ratio (M‐H, Random, 95% CI) | 6.77 [4.42, 10.38] |
| Outcome or subgroup title | No. of studies | No. of participants | Statistical method | Effect size |
| 1 Creatinine Show forest plot | 2 | 91 | Mean Difference (IV, Random, 95% CI) | ‐0.43 [‐0.86, ‐0.01] |
| 2 GFR [mL/min/1.73 m²] Show forest plot | 2 | 79 | Mean Difference (IV, Random, 95% CI) | 9.50 [‐4.45, 23.44] |
| 3 Total kidney volume Show forest plot | 3 | 114 | Mean Difference (IV, Random, 95% CI) | ‐0.62 [‐1.22, ‐0.01] |
| 4 Cyst volume Show forest plot | 2 | 82 | Mean Difference (IV, Random, 95% CI) | ‐0.50 [‐1.18, 0.18] |
| 5 Parenchymal volume Show forest plot | 2 | 82 | Mean Difference (IV, Random, 95% CI) | ‐67.67 [‐249.45, 114.12] |
| 6 Proteinuria Show forest plot | 1 | 79 | Mean Difference (IV, Random, 95% CI) | ‐0.05 [‐0.17, 0.07] |
| 7 Albuminuria Show forest plot | 2 | 91 | Std. Mean Difference (IV, Random, 95% CI) | ‐0.10 [‐0.51, 0.31] |
| 8 Systolic blood pressure Show forest plot | 2 | 91 | Mean Difference (IV, Random, 95% CI) | 0.79 [‐3.54, 5.13] |
| 9 Diastolic blood pressure Show forest plot | 2 | 91 | Mean Difference (IV, Random, 95% CI) | ‐0.38 [‐3.68, 2.92] |
| 10 Mean arterial pressure Show forest plot | 1 | 79 | Mean Difference (IV, Random, 95% CI) | ‐0.10 [‐3.66, 3.46] |
| 11 Adverse events Show forest plot | 2 | Risk Ratio (M‐H, Random, 95% CI) | Subtotals only | |
| 11.1 Alopecia | 1 | 79 | Risk Ratio (M‐H, Random, 95% CI) | 4.88 [0.24, 98.47] |
| 11.2 Anaemia | 1 | 79 | Risk Ratio (M‐H, Random, 95% CI) | 1.3 [0.50, 3.40] |
| 11.3 Diarrhoea | 2 | 91 | Risk Ratio (M‐H, Random, 95% CI) | 3.72 [1.43, 9.68] |
| 11.4 Dizziness | 1 | 79 | Risk Ratio (M‐H, Random, 95% CI) | 0.98 [0.06, 15.05] |
| 11.5 Infection | 1 | 79 | Risk Ratio (M‐H, Random, 95% CI) | 1.24 [0.64, 2.39] |
| Outcome or subgroup title | No. of studies | No. of participants | Statistical method | Effect size |
| 1 Total kidney volume descriptive data Show forest plot | Other data | No numeric data | ||
| Outcome or subgroup title | No. of studies | No. of participants | Statistical method | Effect size |
| 1 Creatinine Show forest plot | 2 | 22 | Mean Difference (IV, Random, 95% CI) | ‐0.13 [‐0.52, 0.26] |
| 2 GFR [mL/min/1.73 m²] Show forest plot | 2 | 22 | Mean Difference (IV, Random, 95% CI) | 2.24 [‐8.05, 12.53] |
| 3 Albuminuria Show forest plot | 2 | 22 | Mean Difference (IV, Random, 95% CI) | ‐60.53 [‐129.06, 8.01] |
| 4 Systolic blood pressure Show forest plot | 2 | 22 | Mean Difference (IV, Random, 95% CI) | 5.04 [‐7.34, 17.43] |
| 5 Diastolic blood pressure Show forest plot | 2 | 22 | Mean Difference (IV, Random, 95% CI) | 6.24 [‐3.27, 15.74] |
| Outcome or subgroup title | No. of studies | No. of participants | Statistical method | Effect size |
| 1 Creatinine Show forest plot | 1 | Mean Difference (IV, Random, 95% CI) | Totals not selected | |
| 2 GFR [mL/min/1.73 m²] Show forest plot | 1 | 41 | Mean Difference (IV, Random, 95% CI) | 6.10 [‐11.16, 23.36] |
| 3 Total kidney volume Show forest plot | 1 | 41 | Mean Difference (IV, Random, 95% CI) | ‐209.0 [‐729.06, 311.06] |
| 4 Albuminuria Show forest plot | 1 | 41 | Mean Difference (IV, Random, 95% CI) | 82.40 [‐162.09, 326.89] |
| Outcome or subgroup title | No. of studies | No. of participants | Statistical method | Effect size |
| 1 GFR descriptive data Show forest plot | Other data | No numeric data | ||
| 2 GFR descriptive data from cross‐over studies Show forest plot | Other data | No numeric data | ||
| 3 Proteinuria descriptive data Show forest plot | Other data | No numeric data | ||
| 4 Systolic blood pressure Show forest plot | 1 | 49 | Mean Difference (IV, Random, 95% CI) | 1.70 [‐6.39, 9.79] |
| 5 Diastolic blood pressure Show forest plot | 1 | 49 | Mean Difference (IV, Random, 95% CI) | ‐1.40 [‐5.54, 2.74] |
| Outcome or subgroup title | No. of studies | No. of participants | Statistical method | Effect size |
| 1 Creatinine Show forest plot | 1 | Mean Difference (IV, Random, 95% CI) | Totals not selected | |
| 2 GFR Show forest plot | 1 | 34 | Mean Difference (IV, Random, 95% CI) | 22.60 [0.92, 44.28] |