Intervenciones para prevenir la progresión de la poliquistosis renal autosómica dominante
Información
- DOI:
- https://doi.org/10.1002/14651858.CD010294.pub2Copiar DOI

- Base de datos:
-
- Cochrane Database of Systematic Reviews
- Versión publicada:
-
- 14 julio 2015see what's new
- Tipo:
-
- Intervention
- Etapa:
-
- Review
- Grupo Editorial Cochrane:
-
Grupo Cochrane de Riñón y trasplante
- Copyright:
-
- Copyright © 2015 The Cochrane Collaboration. Published by John Wiley & Sons, Ltd.
Cifras del artículo
Altmetric:
Citado por:
Autores
Contributions of authors
-
Draft the protocol: DB, JC, GS
-
Study selection: DB, MR
-
Extract data from studies: DB, MR
-
Enter data into RevMan: DB, MR
-
Carry out the analysis: DB, MR, SP, GS
-
Interpret the analysis: DB, SP, GS
-
Draft the final review: DB, CZ, JC, SP, GS
-
Disagreement resolution: SP
-
Update the review: DB, MR, SP, GS
Declarations of interest
-
Davide Bolignano: none known
-
Suetonia C Palmer: none known
-
Marinella Ruospo: none known
-
Carmine Zoccali: none known
-
Jonathan C Craig: none known
-
Giovanni FM Strippoli: none known.
Acknowledgements
We would like to thank the Cochrane Renal Group for their valued support and the referees for their feedback and advice during the preparation of the review. We also thank Drs JP Drenth and A Soliman for providing additional details about their studies which were included in this review.
Version history
| Published | Title | Stage | Authors | Version |
| 2015 Jul 14 | Interventions for preventing the progression of autosomal dominant polycystic kidney disease | Review | Davide Bolignano, Suetonia C Palmer, Marinella Ruospo, Carmine Zoccali, Jonathan C Craig, Giovanni FM Strippoli | |
| 2013 Jan 31 | Interventions for preventing the progression of autosomal dominant polycystic kidney disease | Protocol | Davide Bolignano, Marinella Ruospo, Carmine Zoccali, Jonathan C Craig, Giovanni FM Strippoli | |
Keywords
MeSH
Medical Subject Headings (MeSH) Keywords
- *Disease Progression;
- Angiotensin‐Converting Enzyme Inhibitors [therapeutic use];
- Antidiuretic Hormone Receptor Antagonists [therapeutic use];
- Eicosapentaenoic Acid [therapeutic use];
- Platelet Aggregation Inhibitors [therapeutic use];
- Polycystic Kidney, Autosomal Dominant [*prevention & control];
- Randomized Controlled Trials as Topic;
- TOR Serine‐Threonine Kinases [antagonists & inhibitors];
Medical Subject Headings Check Words
Adult; Child; Humans;
PICO

Study flow diagram
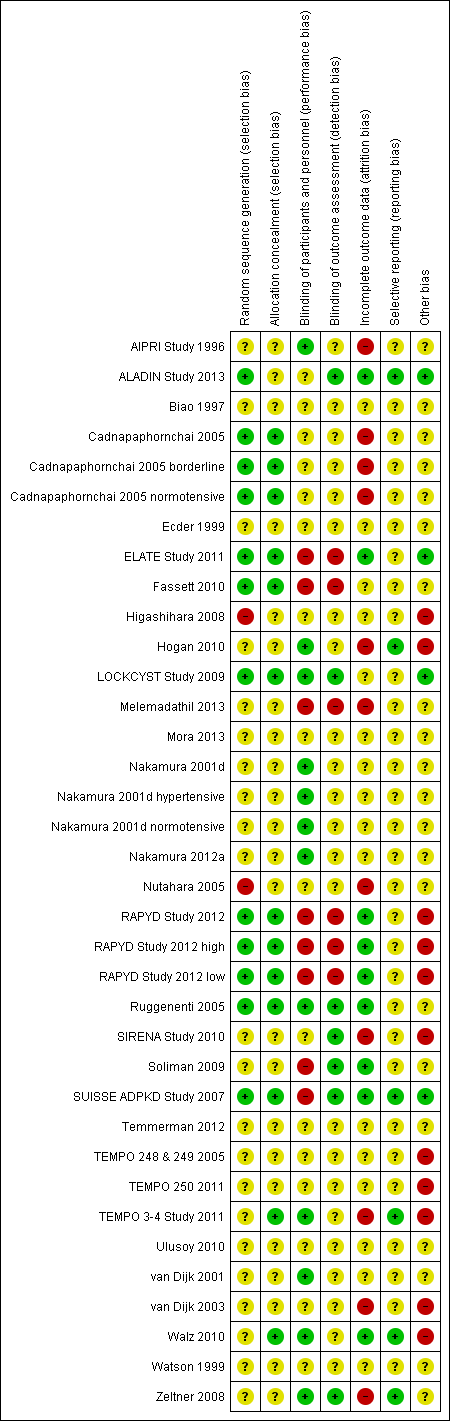
Risk of bias summary: review authors' judgements about each risk of bias item for each included study
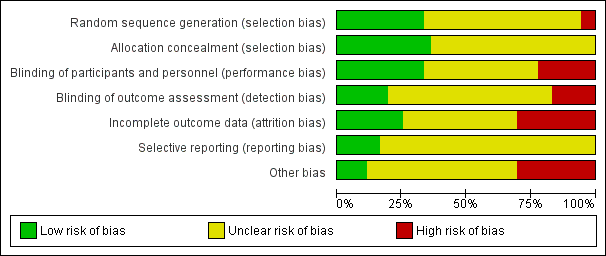
Risk of bias graph: review authors' judgements about each risk of bias item presented as percentages across all included studies

Comparison 1 ACEi versus no treatment, Outcome 1 Serum creatinine.
![Comparison 1 ACEi versus no treatment, Outcome 2 GFR [mL/min/1.73 m²].](/es/cdsr/doi/10.1002/14651858.CD010294.pub2/media/CDSR/CD010294/image_n/nCD010294-CMP-001-02.png)
Comparison 1 ACEi versus no treatment, Outcome 2 GFR [mL/min/1.73 m²].

Comparison 1 ACEi versus no treatment, Outcome 3 Doubling of serum creatinine.

Comparison 1 ACEi versus no treatment, Outcome 4 Total kidney volume.

Comparison 1 ACEi versus no treatment, Outcome 5 Albuminuria.

Comparison 1 ACEi versus no treatment, Outcome 6 Systolic blood pressure.
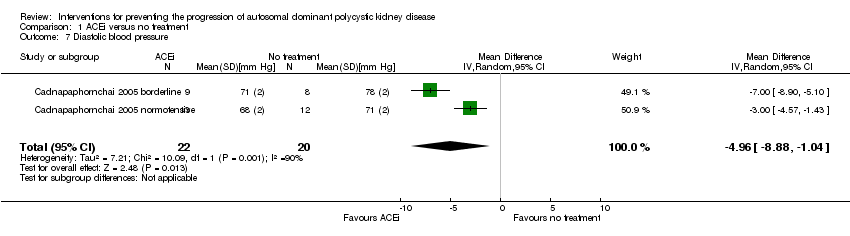
Comparison 1 ACEi versus no treatment, Outcome 7 Diastolic blood pressure.

Comparison 1 ACEi versus no treatment, Outcome 8 Mean arterial pressure.

Comparison 2 ACEi versus CCB, Outcome 1 Creatinine.
![Comparison 2 ACEi versus CCB, Outcome 2 GFR [mL/min/1.73 m²].](/es/cdsr/doi/10.1002/14651858.CD010294.pub2/media/CDSR/CD010294/image_n/nCD010294-CMP-002-02.png)
Comparison 2 ACEi versus CCB, Outcome 2 GFR [mL/min/1.73 m²].
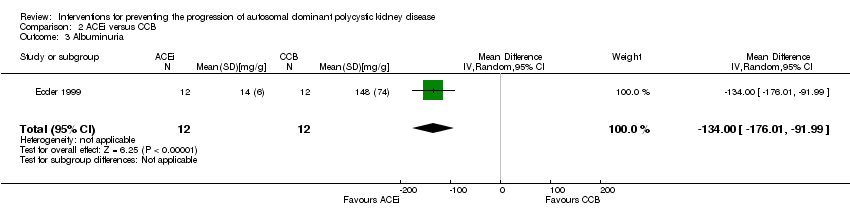
Comparison 2 ACEi versus CCB, Outcome 3 Albuminuria.
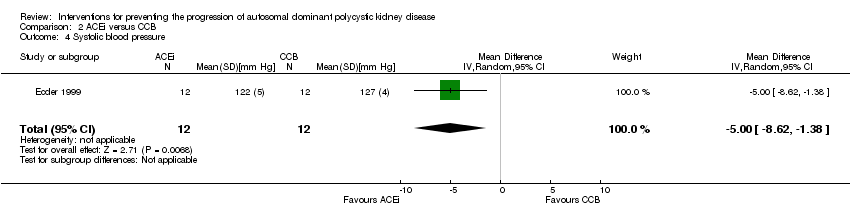
Comparison 2 ACEi versus CCB, Outcome 4 Systolic blood pressure.

Comparison 2 ACEi versus CCB, Outcome 5 Diastolic blood pressure.
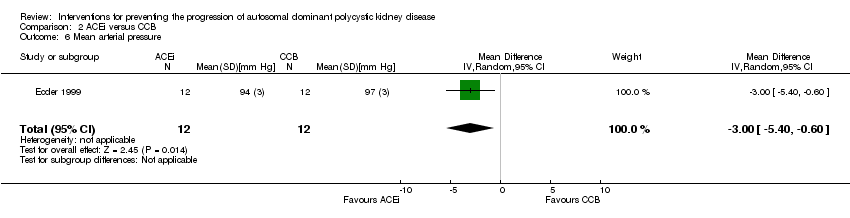
Comparison 2 ACEi versus CCB, Outcome 6 Mean arterial pressure.

Comparison 3 ACEi versus ARB, Outcome 1 Serum creatinine.
![Comparison 3 ACEi versus ARB, Outcome 2 GFR [mL/min/1.73 m²].](/es/cdsr/doi/10.1002/14651858.CD010294.pub2/media/CDSR/CD010294/image_n/nCD010294-CMP-003-02.png)
Comparison 3 ACEi versus ARB, Outcome 2 GFR [mL/min/1.73 m²].

Comparison 3 ACEi versus ARB, Outcome 3 Systolic blood pressure.

Comparison 3 ACEi versus ARB, Outcome 4 Diastolic blood pressure.

Comparison 3 ACEi versus ARB, Outcome 5 Mean arterial pressure.
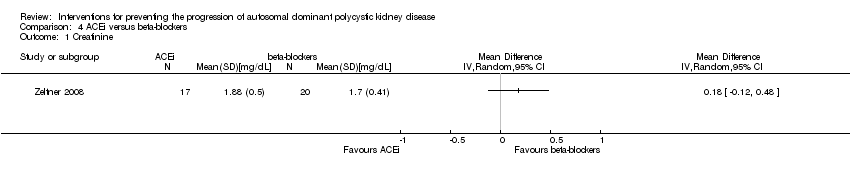
Comparison 4 ACEi versus beta‐blockers, Outcome 1 Creatinine.
![Comparison 4 ACEi versus beta‐blockers, Outcome 2 GFR [mL/min/1.73 m²].](/es/cdsr/doi/10.1002/14651858.CD010294.pub2/media/CDSR/CD010294/image_n/nCD010294-CMP-004-02.png)
Comparison 4 ACEi versus beta‐blockers, Outcome 2 GFR [mL/min/1.73 m²].
| Study | |
| Watson 1999 | eGFR (Cockcroft‐Gault formula) significantly decreased in both groups over the 3 year period (ACEi: 19.3 mL/min/1.73 m2; beta‐blockers: 14.3 mL/min/1.73 m2) but there was no difference in the rate of decline between groups. |
Comparison 4 ACEi versus beta‐blockers, Outcome 3 GFR descriptive data.

Comparison 4 ACEi versus beta‐blockers, Outcome 4 Need for renal replacement therapy.

Comparison 4 ACEi versus beta‐blockers, Outcome 5 Albuminuria.
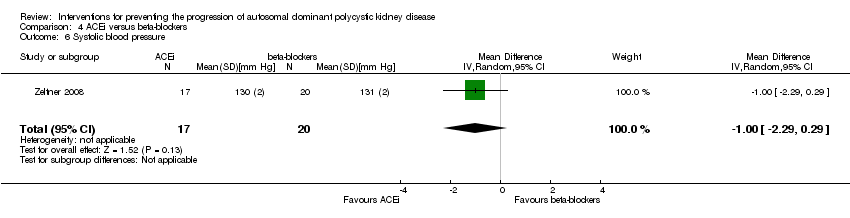
Comparison 4 ACEi versus beta‐blockers, Outcome 6 Systolic blood pressure.
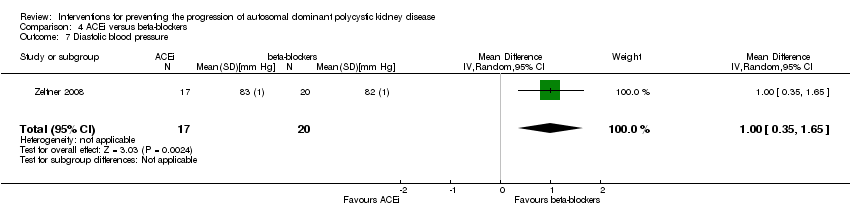
Comparison 4 ACEi versus beta‐blockers, Outcome 7 Diastolic blood pressure.

Comparison 4 ACEi versus beta‐blockers, Outcome 8 Mean arterial pressure.
| Study | |
| Watson 1999 | Good blood pressure control was achieved in both groups (ACEi: 132.6/84.6 mm Hg; beta‐blockers: 130.9/84.5 mm Hg) |
Comparison 4 ACEi versus beta‐blockers, Outcome 9 Blood pressure descriptive data.
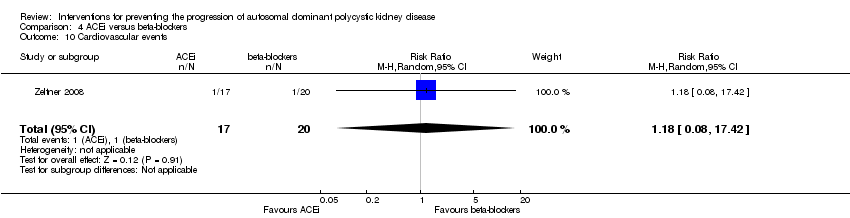
Comparison 4 ACEi versus beta‐blockers, Outcome 10 Cardiovascular events.
![Comparison 5 ACEi alone versus ACEi + mTOR inhibitors, Outcome 1 GFR [mL/min/1.73 m²].](/es/cdsr/doi/10.1002/14651858.CD010294.pub2/media/CDSR/CD010294/image_n/nCD010294-CMP-005-01.png)
Comparison 5 ACEi alone versus ACEi + mTOR inhibitors, Outcome 1 GFR [mL/min/1.73 m²].

Comparison 5 ACEi alone versus ACEi + mTOR inhibitors, Outcome 2 Total kidney volume.
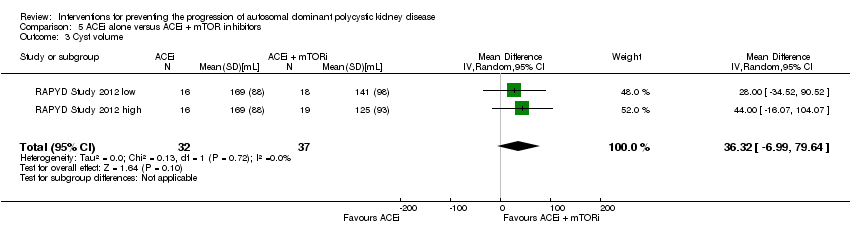
Comparison 5 ACEi alone versus ACEi + mTOR inhibitors, Outcome 3 Cyst volume.

Comparison 5 ACEi alone versus ACEi + mTOR inhibitors, Outcome 4 Proteinuria.

Comparison 5 ACEi alone versus ACEi + mTOR inhibitors, Outcome 5 Mean arterial pressure.

Comparison 5 ACEi alone versus ACEi + mTOR inhibitors, Outcome 6 Adverse events.
![Comparison 6 ARB alone versus ARB + mTOR inhibitors, Outcome 1 GFR [mL/min/1.73 m²].](/es/cdsr/doi/10.1002/14651858.CD010294.pub2/media/CDSR/CD010294/image_n/nCD010294-CMP-006-01.png)
Comparison 6 ARB alone versus ARB + mTOR inhibitors, Outcome 1 GFR [mL/min/1.73 m²].

Comparison 6 ARB alone versus ARB + mTOR inhibitors, Outcome 2 Doubling of serum creatinine.

Comparison 6 ARB alone versus ARB + mTOR inhibitors, Outcome 3 Total kidney volume.
| Study | |
| Soliman 2009 | The mean diastolic pressure decreased by 2.5 to 4.0 mm Hg in the ARB + mTOR group and increased by 0.5 to 1.5 mm Hg in the ARB alone group The mean systolic pressure decreased by 2.5 to 5.0 mm Hg in the ARB + mTOR group and increased by 1.0 to 2.5 mm Hg in the ARB alone group |
Comparison 6 ARB alone versus ARB + mTOR inhibitors, Outcome 4 Blood pressure descriptive data.

Comparison 6 ARB alone versus ARB + mTOR inhibitors, Outcome 5 Infection.

Comparison 7 ARB versus CCB, Outcome 1 Creatinine.
![Comparison 7 ARB versus CCB, Outcome 2 GFR [mL/min/1.73 m²].](/es/cdsr/doi/10.1002/14651858.CD010294.pub2/media/CDSR/CD010294/image_n/nCD010294-CMP-007-02.png)
Comparison 7 ARB versus CCB, Outcome 2 GFR [mL/min/1.73 m²].
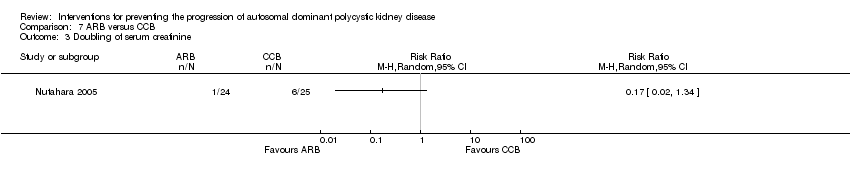
Comparison 7 ARB versus CCB, Outcome 3 Doubling of serum creatinine.

Comparison 7 ARB versus CCB, Outcome 4 Proteinuria.

Comparison 7 ARB versus CCB, Outcome 5 Albuminuria.
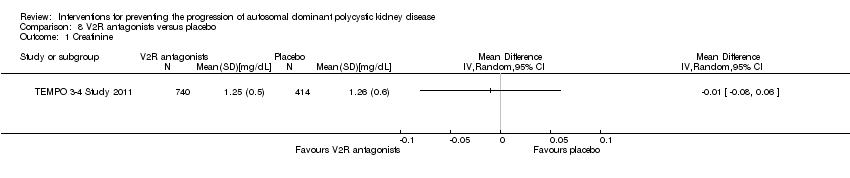
Comparison 8 V2R antagonists versus placebo, Outcome 1 Creatinine.
| Study | |
| TEMPO 3‐4 Study 2011 | The slope of kidney function (as assessed by means of the reciprocal of the SCr level) from the end of dose escalation to month 36, favoured V2R‐antagonists, with a slope of −2.61 (mg/mL)−1 per year, as compared with −3.81 (mg/mL)−1 per year with placebo; the treatment effect was an increase of 1.20 (mg/mL)−1 per year (95% CI 0.62 to 1.78; P < 0.001) |
Comparison 8 V2R antagonists versus placebo, Outcome 2 GFR descriptive data.

Comparison 8 V2R antagonists versus placebo, Outcome 3 Doubling of serum creatinine.
| Study | |
| TEMPO 3‐4 Study 2011 | quote: "Over the 3‐year period, total kidney volume increased by 2.8% per year (95% confidence interval [CI], 2.5 to 3.1) with V2R‐antagonists versus 5.5% per year (95% CI, 5.1 to 6.0) with placebo" |
Comparison 8 V2R antagonists versus placebo, Outcome 4 Total kidney volume descriptive data.
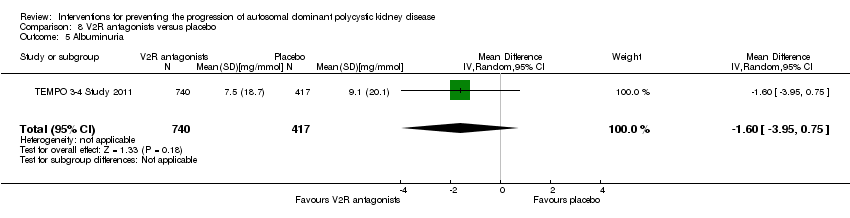
Comparison 8 V2R antagonists versus placebo, Outcome 5 Albuminuria.

Comparison 8 V2R antagonists versus placebo, Outcome 6 Kidney pain.
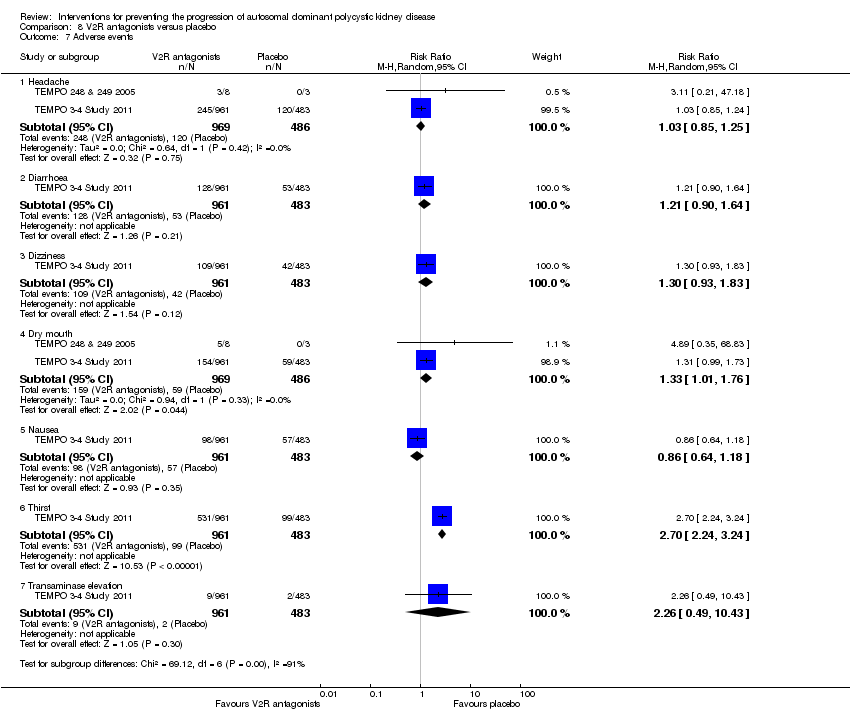
Comparison 8 V2R antagonists versus placebo, Outcome 7 Adverse events.
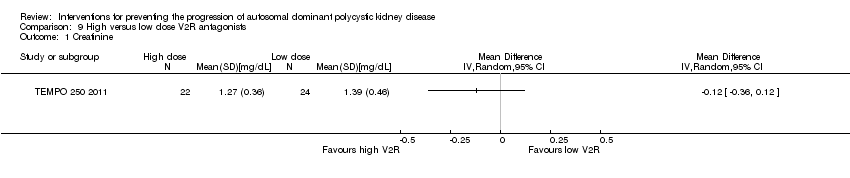
Comparison 9 High versus low dose V2R antagonists, Outcome 1 Creatinine.

Comparison 9 High versus low dose V2R antagonists, Outcome 2 Systolic blood pressure.

Comparison 9 High versus low dose V2R antagonists, Outcome 3 Diastolic blood pressure.
![Comparison 10 mTOR inhibitors versus no treatment, Outcome 1 GFR [mL/min/1.73 m²].](/es/cdsr/doi/10.1002/14651858.CD010294.pub2/media/CDSR/CD010294/image_n/nCD010294-CMP-010-01.png)
Comparison 10 mTOR inhibitors versus no treatment, Outcome 1 GFR [mL/min/1.73 m²].
| Study | |
| Walz 2010 | quote: "The estimated GFR decreased by 8.9 ml per minute in the mTOR‐inhibitors group and 7.7 ml per minute in the placebo group (P = 0.15) over the 2‐year study period" |
Comparison 10 mTOR inhibitors versus no treatment, Outcome 2 GFR descriptive data.

Comparison 10 mTOR inhibitors versus no treatment, Outcome 3 Need for renal replacement therapy.

Comparison 10 mTOR inhibitors versus no treatment, Outcome 4 Need for transplantation.

Comparison 10 mTOR inhibitors versus no treatment, Outcome 5 Total kidney volume.
| Study | |
| Melemadathil 2013 | quote: "there was a statistically significant reduction in total kidney volume when mTOR treatment was extended for 1 year" |
| Mora 2013 | quote: "the mTOR group showed a kidney volume growth of 9,4 ±1,2mL/year compared with 11 ± 1.4 mL/year in control group" |
| Walz 2010 | quote: "among patients receiving mTOR‐inhibitors, the mean total kidney volume increased from 2028 ml to 2063 ml at 1 year and to 2176 ml at 2 years, and among those receiving placebo, it increased from 1911 ml to 2061 ml and to 2287 ml, respectively" |
Comparison 10 mTOR inhibitors versus no treatment, Outcome 6 Total kidney volume descriptive data.

Comparison 10 mTOR inhibitors versus no treatment, Outcome 7 Cyst volume.
| Study | |
| Melemadathil 2013 | quote: "there was a statistically significant reduction in total cyst volume when mTOR treatment was extended for 1 year" |
| Walz 2010 | quote: "The cyst volume increased by 76 ml at 1 year and 181 ml at 2 years in the mTOR‐inhibitors group and by 98 ml and 215 ml, respectively, in the placebo group" |
Comparison 10 mTOR inhibitors versus no treatment, Outcome 8 Cyst volume descriptive data.

Comparison 10 mTOR inhibitors versus no treatment, Outcome 9 Parenchymal volume.
| Study | |
| Melemadathil 2013 | quote: "there was a small but significant increase in renal parenchymal volume in patients receiving mTOR" |
| Walz 2010 | quote: "The parenchymal volume increased by 26 ml at 1 year and by 56 ml at 2 years in the mTOR‐inhibitors group; the corresponding changes in the placebo group were 62 and 93 ml" |
Comparison 10 mTOR inhibitors versus no treatment, Outcome 10 Parenchymal volume descriptive data.

Comparison 10 mTOR inhibitors versus no treatment, Outcome 11 Proteinuria.
| Study | |
| Melemadathil 2013 | quote: "there was a statistically significant increase in proteinuria in the mTOR arm as compared to the standard treatment group at the end of 6 months" |
Comparison 10 mTOR inhibitors versus no treatment, Outcome 12 Proteinuria descriptive data.

Comparison 10 mTOR inhibitors versus no treatment, Outcome 13 Albuminuria.

Comparison 10 mTOR inhibitors versus no treatment, Outcome 14 Systolic blood pressure.

Comparison 10 mTOR inhibitors versus no treatment, Outcome 15 Diastolic blood pressure.
| Study | |
| Walz 2010 | quote: "The change from baseline in the systolic blood pressure at 24 months was −2.0 mm Hg in the mTOR‐inhibitors group and −1.5 mm Hg in the placebo group (P = 0.76); the corresponding changes in diastolic blood pressure were −2.7 mm Hg and −2.6 mm Hg (P = 0.89)" |
Comparison 10 mTOR inhibitors versus no treatment, Outcome 16 Blood pressure descriptive data.

Comparison 10 mTOR inhibitors versus no treatment, Outcome 17 All‐cause mortality.

Comparison 10 mTOR inhibitors versus no treatment, Outcome 18 Adverse effects.

Comparison 11 Somatostatin analogues versus placebo, Outcome 1 Creatinine.
![Comparison 11 Somatostatin analogues versus placebo, Outcome 2 GFR [mL/min/1.73 m²].](/es/cdsr/doi/10.1002/14651858.CD010294.pub2/media/CDSR/CD010294/image_n/nCD010294-CMP-011-02.png)
Comparison 11 Somatostatin analogues versus placebo, Outcome 2 GFR [mL/min/1.73 m²].
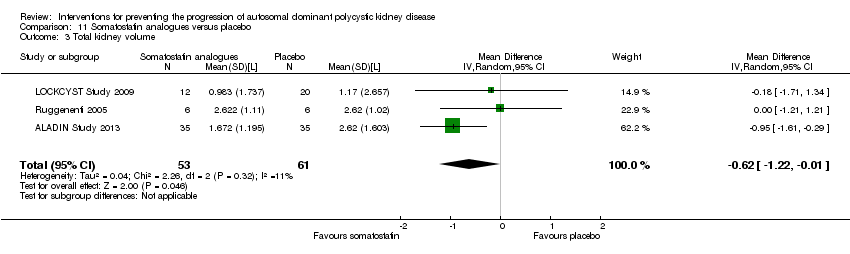
Comparison 11 Somatostatin analogues versus placebo, Outcome 3 Total kidney volume.

Comparison 11 Somatostatin analogues versus placebo, Outcome 4 Cyst volume.
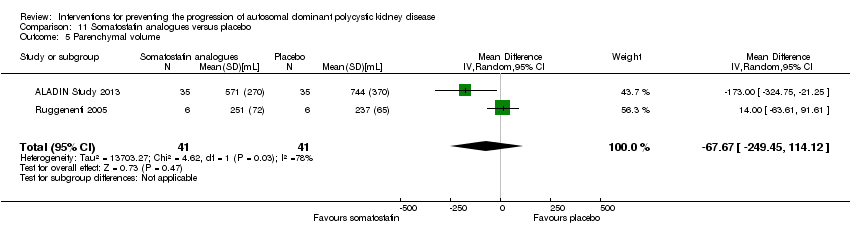
Comparison 11 Somatostatin analogues versus placebo, Outcome 5 Parenchymal volume.
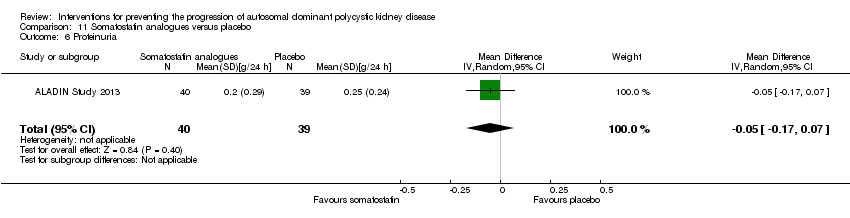
Comparison 11 Somatostatin analogues versus placebo, Outcome 6 Proteinuria.

Comparison 11 Somatostatin analogues versus placebo, Outcome 7 Albuminuria.

Comparison 11 Somatostatin analogues versus placebo, Outcome 8 Systolic blood pressure.

Comparison 11 Somatostatin analogues versus placebo, Outcome 9 Diastolic blood pressure.

Comparison 11 Somatostatin analogues versus placebo, Outcome 10 Mean arterial pressure.

Comparison 11 Somatostatin analogues versus placebo, Outcome 11 Adverse events.
| Study | |
| ELATE Study 2011 | quote: "The median kidney volume was not affected by octreotide and did not change significantly in the 6 patients through the course of the trial (from 798 mL (IQR 675–1960 mL) at baseline to 811 mL (IQR 653–1960 mL) after 48 weeks, p=0.75). Likewise, octreotide‐everolimus combination treatment (n=6) did not affect kidney volume over the course of 48 weeks (from 623 mL (IQR 483–1110 ml) to 602 mL (IQR 493–1259 mL), p=0.75). Change in kidney volume did not differ between treatment arms (p=1.00)" |
Comparison 12 Somatostatin analogues + mTOR inhibitors versus somatostatin analogues alone, Outcome 1 Total kidney volume descriptive data.

Comparison 13 Antiplatelet agents versus placebo, Outcome 1 Creatinine.
![Comparison 13 Antiplatelet agents versus placebo, Outcome 2 GFR [mL/min/1.73 m²].](/es/cdsr/doi/10.1002/14651858.CD010294.pub2/media/CDSR/CD010294/image_n/nCD010294-CMP-013-02.png)
Comparison 13 Antiplatelet agents versus placebo, Outcome 2 GFR [mL/min/1.73 m²].
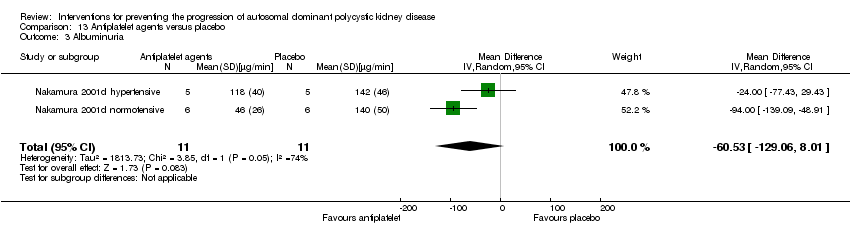
Comparison 13 Antiplatelet agents versus placebo, Outcome 3 Albuminuria.

Comparison 13 Antiplatelet agents versus placebo, Outcome 4 Systolic blood pressure.
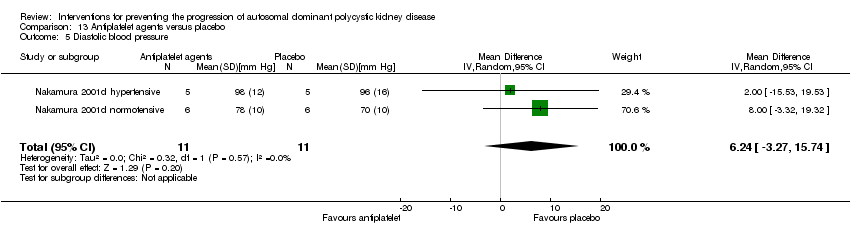
Comparison 13 Antiplatelet agents versus placebo, Outcome 5 Diastolic blood pressure.

Comparison 14 Eicosapentaenoic acids versus standard therapy, Outcome 1 Creatinine.
![Comparison 14 Eicosapentaenoic acids versus standard therapy, Outcome 2 GFR [mL/min/1.73 m²].](/es/cdsr/doi/10.1002/14651858.CD010294.pub2/media/CDSR/CD010294/image_n/nCD010294-CMP-014-02.png)
Comparison 14 Eicosapentaenoic acids versus standard therapy, Outcome 2 GFR [mL/min/1.73 m²].

Comparison 14 Eicosapentaenoic acids versus standard therapy, Outcome 3 Total kidney volume.

Comparison 14 Eicosapentaenoic acids versus standard therapy, Outcome 4 Albuminuria.
| Study | |
| Fassett 2010 | There was a 23% reduction in the rate of GFR change in statins‐treated patients compared with controls, although not statistically significant |
Comparison 15 Statins versus no treatment, Outcome 1 GFR descriptive data.
| Study | |
| van Dijk 2001 | Compared to placebo, treatment with statins significantly increased GFR from 124 ± 4 mL/min to 132 ± 6 mL/min (p < 0.05) |
Comparison 15 Statins versus no treatment, Outcome 2 GFR descriptive data from cross‐over studies.
| Study | |
| Fassett 2010 | Urinary protein excretion decreased by 2.8% in statins‐treated patients and increased by 21.2% in controls |
Comparison 15 Statins versus no treatment, Outcome 3 Proteinuria descriptive data.
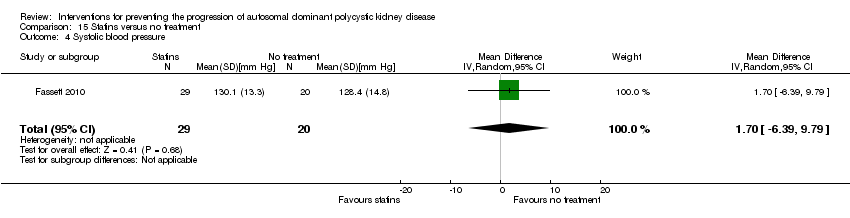
Comparison 15 Statins versus no treatment, Outcome 4 Systolic blood pressure.

Comparison 15 Statins versus no treatment, Outcome 5 Diastolic blood pressure.
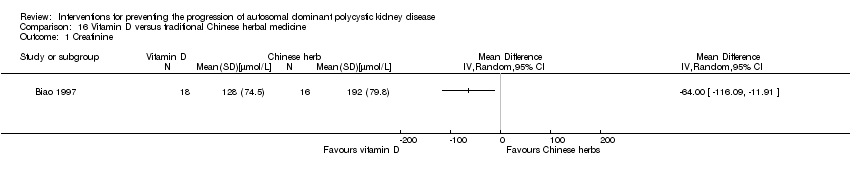
Comparison 16 Vitamin D versus traditional Chinese herbal medicine, Outcome 1 Creatinine.

Comparison 16 Vitamin D versus traditional Chinese herbal medicine, Outcome 2 GFR.
| Outcome or subgroup title | No. of studies | No. of participants | Statistical method | Effect size |
| 1 Serum creatinine Show forest plot | 2 | 42 | Mean Difference (IV, Random, 95% CI) | ‐0.02 [‐0.14, 0.09] |
| 2 GFR [mL/min/1.73 m²] Show forest plot | 3 | 103 | Mean Difference (IV, Random, 95% CI) | ‐3.41 [‐15.83, 9.01] |
| 3 Doubling of serum creatinine Show forest plot | 1 | Risk Ratio (M‐H, Random, 95% CI) | Totals not selected | |
| 4 Total kidney volume Show forest plot | 2 | 42 | Mean Difference (IV, Random, 95% CI) | ‐42.50 [‐115.68, 30.67] |
| 5 Albuminuria Show forest plot | 3 | 103 | Std. Mean Difference (IV, Random, 95% CI) | ‐0.12 [‐0.51, 0.26] |
| 6 Systolic blood pressure Show forest plot | 2 | 42 | Mean Difference (IV, Random, 95% CI) | ‐5.44 [‐14.26, 3.38] |
| 7 Diastolic blood pressure Show forest plot | 2 | 42 | Mean Difference (IV, Random, 95% CI) | ‐4.96 [‐8.88, ‐1.04] |
| 8 Mean arterial pressure Show forest plot | 1 | 61 | Mean Difference (IV, Random, 95% CI) | ‐5.0 [‐6.29, ‐3.71] |
| Outcome or subgroup title | No. of studies | No. of participants | Statistical method | Effect size |
| 1 Creatinine Show forest plot | 1 | Mean Difference (IV, Random, 95% CI) | Totals not selected | |
| 2 GFR [mL/min/1.73 m²] Show forest plot | 1 | 24 | Mean Difference (IV, Random, 95% CI) | ‐13.00 [‐17.56, ‐8.44] |
| 3 Albuminuria Show forest plot | 1 | 24 | Mean Difference (IV, Random, 95% CI) | ‐134.0 [‐176.01, ‐91.99] |
| 4 Systolic blood pressure Show forest plot | 1 | 24 | Mean Difference (IV, Random, 95% CI) | ‐5.0 [‐8.62, ‐1.38] |
| 5 Diastolic blood pressure Show forest plot | 1 | 24 | Mean Difference (IV, Random, 95% CI) | ‐3.0 [‐5.40, ‐0.60] |
| 6 Mean arterial pressure Show forest plot | 1 | 24 | Mean Difference (IV, Random, 95% CI) | ‐3.0 [‐5.40, ‐0.60] |
| Outcome or subgroup title | No. of studies | No. of participants | Statistical method | Effect size |
| 1 Serum creatinine Show forest plot | 2 | 52 | Mean Difference (IV, Random, 95% CI) | 0.00 [‐0.09, 0.10] |
| 2 GFR [mL/min/1.73 m²] Show forest plot | 1 | 32 | Mean Difference (IV, Random, 95% CI) | ‐3.40 [‐22.69, 15.89] |
| 3 Systolic blood pressure Show forest plot | 1 | 32 | Mean Difference (IV, Random, 95% CI) | ‐3.5 [‐9.75, 2.75] |
| 4 Diastolic blood pressure Show forest plot | 1 | 32 | Mean Difference (IV, Random, 95% CI) | ‐1.80 [‐5.23, 1.63] |
| 5 Mean arterial pressure Show forest plot | 1 | 32 | Mean Difference (IV, Random, 95% CI) | ‐2.20 [‐6.41, 2.01] |
| Outcome or subgroup title | No. of studies | No. of participants | Statistical method | Effect size |
| 1 Creatinine Show forest plot | 1 | Mean Difference (IV, Random, 95% CI) | Totals not selected | |
| 2 GFR [mL/min/1.73 m²] Show forest plot | 2 | 65 | Mean Difference (IV, Random, 95% CI) | ‐8.06 [‐29.62, 13.50] |
| 3 GFR descriptive data Show forest plot | Other data | No numeric data | ||
| 4 Need for renal replacement therapy Show forest plot | 1 | 37 | Risk Ratio (M‐H, Random, 95% CI) | 0.39 [0.02, 8.97] |
| 5 Albuminuria Show forest plot | 2 | 65 | Std. Mean Difference (IV, Random, 95% CI) | ‐0.19 [‐1.77, 1.39] |
| 6 Systolic blood pressure Show forest plot | 1 | 37 | Mean Difference (IV, Random, 95% CI) | ‐1.0 [‐2.29, 0.29] |
| 7 Diastolic blood pressure Show forest plot | 1 | 37 | Mean Difference (IV, Random, 95% CI) | 1.0 [0.35, 1.65] |
| 8 Mean arterial pressure Show forest plot | 1 | 28 | Mean Difference (IV, Random, 95% CI) | ‐3.0 [‐4.92, ‐1.08] |
| 9 Blood pressure descriptive data Show forest plot | Other data | No numeric data | ||
| 10 Cardiovascular events Show forest plot | 1 | 37 | Risk Ratio (M‐H, Random, 95% CI) | 1.18 [0.08, 17.42] |
| Outcome or subgroup title | No. of studies | No. of participants | Statistical method | Effect size |
| 1 GFR [mL/min/1.73 m²] Show forest plot | 2 | 69 | Mean Difference (IV, Random, 95% CI) | ‐5.42 [‐15.04, 4.20] |
| 2 Total kidney volume Show forest plot | 2 | 69 | Mean Difference (IV, Random, 95% CI) | 285.79 [‐21.92, 593.50] |
| 3 Cyst volume Show forest plot | 2 | 69 | Mean Difference (IV, Random, 95% CI) | 36.32 [‐6.99, 79.64] |
| 4 Proteinuria Show forest plot | 2 | 69 | Mean Difference (IV, Random, 95% CI) | ‐0.26 [‐0.65, 0.12] |
| 5 Mean arterial pressure Show forest plot | 2 | 69 | Mean Difference (IV, Random, 95% CI) | 0.64 [‐6.21, 7.50] |
| 6 Adverse events Show forest plot | 1 | Risk Ratio (M‐H, Random, 95% CI) | Subtotals only | |
| 6.1 Anaemia | 1 | 53 | Risk Ratio (M‐H, Random, 95% CI) | 0.45 [0.02, 8.82] |
| 6.2 Hyperlipidaemia | 1 | 53 | Risk Ratio (M‐H, Random, 95% CI) | 0.10 [0.01, 1.56] |
| 6.3 Infection | 1 | 53 | Risk Ratio (M‐H, Random, 95% CI) | 0.45 [0.02, 8.82] |
| 6.4 Oral ulcers | 1 | 53 | Risk Ratio (M‐H, Random, 95% CI) | 0.13 [0.01, 2.15] |
| Outcome or subgroup title | No. of studies | No. of participants | Statistical method | Effect size |
| 1 GFR [mL/min/1.73 m²] Show forest plot | 1 | 16 | Mean Difference (IV, Random, 95% CI) | ‐9.60 [‐28.18, 8.98] |
| 2 Doubling of serum creatinine Show forest plot | 1 | Risk Ratio (M‐H, Random, 95% CI) | Totals not selected | |
| 3 Total kidney volume Show forest plot | 1 | 16 | Mean Difference (IV, Random, 95% CI) | 0.37 [0.04, 0.70] |
| 4 Blood pressure descriptive data Show forest plot | Other data | No numeric data | ||
| 5 Infection Show forest plot | 1 | 16 | Risk Ratio (M‐H, Random, 95% CI) | 0.5 [0.13, 2.00] |
| Outcome or subgroup title | No. of studies | No. of participants | Statistical method | Effect size |
| 1 Creatinine Show forest plot | 1 | Mean Difference (IV, Random, 95% CI) | Totals not selected | |
| 2 GFR [mL/min/1.73 m²] Show forest plot | 1 | 31 | Mean Difference (IV, Random, 95% CI) | 6.30 [‐8.49, 21.09] |
| 3 Doubling of serum creatinine Show forest plot | 1 | Risk Ratio (M‐H, Random, 95% CI) | Totals not selected | |
| 4 Proteinuria Show forest plot | 1 | 25 | Mean Difference (IV, Random, 95% CI) | ‐304.0 [‐578.54, ‐29.46] |
| 5 Albuminuria Show forest plot | 1 | 24 | Mean Difference (IV, Random, 95% CI) | ‐238.0 [‐394.61, ‐81.39] |
| Outcome or subgroup title | No. of studies | No. of participants | Statistical method | Effect size |
| 1 Creatinine Show forest plot | 1 | Mean Difference (IV, Random, 95% CI) | Totals not selected | |
| 2 GFR descriptive data Show forest plot | Other data | No numeric data | ||
| 3 Doubling of serum creatinine Show forest plot | 1 | Risk Ratio (M‐H, Random, 95% CI) | Totals not selected | |
| 4 Total kidney volume descriptive data Show forest plot | Other data | No numeric data | ||
| 5 Albuminuria Show forest plot | 1 | 1157 | Mean Difference (IV, Random, 95% CI) | ‐1.60 [‐3.95, 0.75] |
| 6 Kidney pain Show forest plot | 1 | 1444 | Risk Ratio (M‐H, Random, 95% CI) | 0.77 [0.66, 0.90] |
| 7 Adverse events Show forest plot | 2 | Risk Ratio (M‐H, Random, 95% CI) | Subtotals only | |
| 7.1 Headache | 2 | 1455 | Risk Ratio (M‐H, Random, 95% CI) | 1.03 [0.85, 1.25] |
| 7.2 Diarrhoea | 1 | 1444 | Risk Ratio (M‐H, Random, 95% CI) | 1.21 [0.90, 1.64] |
| 7.3 Dizziness | 1 | 1444 | Risk Ratio (M‐H, Random, 95% CI) | 1.30 [0.93, 1.83] |
| 7.4 Dry mouth | 2 | 1455 | Risk Ratio (M‐H, Random, 95% CI) | 1.33 [1.01, 1.76] |
| 7.5 Nausea | 1 | 1444 | Risk Ratio (M‐H, Random, 95% CI) | 0.86 [0.64, 1.18] |
| 7.6 Thirst | 1 | 1444 | Risk Ratio (M‐H, Random, 95% CI) | 2.70 [2.24, 3.24] |
| 7.7 Transaminase elevation | 1 | 1444 | Risk Ratio (M‐H, Random, 95% CI) | 2.26 [0.49, 10.43] |
| Outcome or subgroup title | No. of studies | No. of participants | Statistical method | Effect size |
| 1 Creatinine Show forest plot | 1 | Mean Difference (IV, Random, 95% CI) | Totals not selected | |
| 2 Systolic blood pressure Show forest plot | 1 | 46 | Mean Difference (IV, Random, 95% CI) | ‐9.0 [‐16.98, ‐1.02] |
| 3 Diastolic blood pressure Show forest plot | 1 | 46 | Mean Difference (IV, Random, 95% CI) | ‐6.0 [‐11.21, ‐0.79] |
| Outcome or subgroup title | No. of studies | No. of participants | Statistical method | Effect size |
| 1 GFR [mL/min/1.73 m²] Show forest plot | 2 | 115 | Mean Difference (IV, Random, 95% CI) | 4.45 [‐3.20, 12.11] |
| 2 GFR descriptive data Show forest plot | Other data | No numeric data | ||
| 3 Need for renal replacement therapy Show forest plot | 1 | 431 | Risk Ratio (M‐H, Random, 95% CI) | 3.04 [0.12, 74.26] |
| 4 Need for transplantation Show forest plot | 1 | 431 | Risk Ratio (M‐H, Random, 95% CI) | 1.01 [0.06, 16.11] |
| 5 Total kidney volume Show forest plot | 2 | 115 | Mean Difference (IV, Random, 95% CI) | ‐0.08 [‐0.75, 0.59] |
| 6 Total kidney volume descriptive data Show forest plot | Other data | No numeric data | ||
| 7 Cyst volume Show forest plot | 1 | 15 | Mean Difference (IV, Random, 95% CI) | ‐55.0 [‐862.98, 752.98] |
| 8 Cyst volume descriptive data Show forest plot | Other data | No numeric data | ||
| 9 Parenchymal volume Show forest plot | 1 | 15 | Mean Difference (IV, Random, 95% CI) | 15.0 [‐75.44, 105.44] |
| 10 Parenchymal volume descriptive data Show forest plot | Other data | No numeric data | ||
| 11 Proteinuria Show forest plot | 2 | 446 | Std. Mean Difference (IV, Random, 95% CI) | 0.34 [‐0.29, 0.98] |
| 12 Proteinuria descriptive data Show forest plot | Other data | No numeric data | ||
| 13 Albuminuria Show forest plot | 2 | 115 | Std. Mean Difference (IV, Random, 95% CI) | 0.25 [‐0.27, 0.78] |
| 14 Systolic blood pressure Show forest plot | 2 | 112 | Mean Difference (IV, Random, 95% CI) | 2.48 [‐2.07, 7.03] |
| 15 Diastolic blood pressure Show forest plot | 2 | 112 | Mean Difference (IV, Random, 95% CI) | 0.27 [‐3.30, 3.85] |
| 16 Blood pressure descriptive data Show forest plot | Other data | No numeric data | ||
| 17 All‐cause mortality Show forest plot | 1 | 431 | Risk Ratio (M‐H, Random, 95% CI) | 2.03 [0.19, 22.20] |
| 18 Adverse effects Show forest plot | 3 | Risk Ratio (M‐H, Random, 95% CI) | Subtotals only | |
| 18.1 Anaemia | 1 | 431 | Risk Ratio (M‐H, Random, 95% CI) | 3.41 [1.79, 6.51] |
| 18.2 Angioedema | 3 | 560 | Risk Ratio (M‐H, Random, 95% CI) | 13.39 [2.56, 70.00] |
| 18.3 Diarrhoea | 3 | 560 | Risk Ratio (M‐H, Random, 95% CI) | 1.70 [1.26, 2.29] |
| 18.4 Hyperlipidaemia | 1 | 431 | Risk Ratio (M‐H, Random, 95% CI) | 5.68 [2.23, 14.43] |
| 18.5 Infection | 3 | 560 | Risk Ratio (M‐H, Random, 95% CI) | 1.14 [1.04, 1.25] |
| 18.6 Nausea | 1 | 431 | Risk Ratio (M‐H, Random, 95% CI) | 1.69 [0.85, 3.37] |
| 18.7 Oral ulcers | 3 | 560 | Risk Ratio (M‐H, Random, 95% CI) | 6.77 [4.42, 10.38] |
| Outcome or subgroup title | No. of studies | No. of participants | Statistical method | Effect size |
| 1 Creatinine Show forest plot | 2 | 91 | Mean Difference (IV, Random, 95% CI) | ‐0.43 [‐0.86, ‐0.01] |
| 2 GFR [mL/min/1.73 m²] Show forest plot | 2 | 79 | Mean Difference (IV, Random, 95% CI) | 9.50 [‐4.45, 23.44] |
| 3 Total kidney volume Show forest plot | 3 | 114 | Mean Difference (IV, Random, 95% CI) | ‐0.62 [‐1.22, ‐0.01] |
| 4 Cyst volume Show forest plot | 2 | 82 | Mean Difference (IV, Random, 95% CI) | ‐0.50 [‐1.18, 0.18] |
| 5 Parenchymal volume Show forest plot | 2 | 82 | Mean Difference (IV, Random, 95% CI) | ‐67.67 [‐249.45, 114.12] |
| 6 Proteinuria Show forest plot | 1 | 79 | Mean Difference (IV, Random, 95% CI) | ‐0.05 [‐0.17, 0.07] |
| 7 Albuminuria Show forest plot | 2 | 91 | Std. Mean Difference (IV, Random, 95% CI) | ‐0.10 [‐0.51, 0.31] |
| 8 Systolic blood pressure Show forest plot | 2 | 91 | Mean Difference (IV, Random, 95% CI) | 0.79 [‐3.54, 5.13] |
| 9 Diastolic blood pressure Show forest plot | 2 | 91 | Mean Difference (IV, Random, 95% CI) | ‐0.38 [‐3.68, 2.92] |
| 10 Mean arterial pressure Show forest plot | 1 | 79 | Mean Difference (IV, Random, 95% CI) | ‐0.10 [‐3.66, 3.46] |
| 11 Adverse events Show forest plot | 2 | Risk Ratio (M‐H, Random, 95% CI) | Subtotals only | |
| 11.1 Alopecia | 1 | 79 | Risk Ratio (M‐H, Random, 95% CI) | 4.88 [0.24, 98.47] |
| 11.2 Anaemia | 1 | 79 | Risk Ratio (M‐H, Random, 95% CI) | 1.3 [0.50, 3.40] |
| 11.3 Diarrhoea | 2 | 91 | Risk Ratio (M‐H, Random, 95% CI) | 3.72 [1.43, 9.68] |
| 11.4 Dizziness | 1 | 79 | Risk Ratio (M‐H, Random, 95% CI) | 0.98 [0.06, 15.05] |
| 11.5 Infection | 1 | 79 | Risk Ratio (M‐H, Random, 95% CI) | 1.24 [0.64, 2.39] |
| Outcome or subgroup title | No. of studies | No. of participants | Statistical method | Effect size |
| 1 Total kidney volume descriptive data Show forest plot | Other data | No numeric data | ||
| Outcome or subgroup title | No. of studies | No. of participants | Statistical method | Effect size |
| 1 Creatinine Show forest plot | 2 | 22 | Mean Difference (IV, Random, 95% CI) | ‐0.13 [‐0.52, 0.26] |
| 2 GFR [mL/min/1.73 m²] Show forest plot | 2 | 22 | Mean Difference (IV, Random, 95% CI) | 2.24 [‐8.05, 12.53] |
| 3 Albuminuria Show forest plot | 2 | 22 | Mean Difference (IV, Random, 95% CI) | ‐60.53 [‐129.06, 8.01] |
| 4 Systolic blood pressure Show forest plot | 2 | 22 | Mean Difference (IV, Random, 95% CI) | 5.04 [‐7.34, 17.43] |
| 5 Diastolic blood pressure Show forest plot | 2 | 22 | Mean Difference (IV, Random, 95% CI) | 6.24 [‐3.27, 15.74] |
| Outcome or subgroup title | No. of studies | No. of participants | Statistical method | Effect size |
| 1 Creatinine Show forest plot | 1 | Mean Difference (IV, Random, 95% CI) | Totals not selected | |
| 2 GFR [mL/min/1.73 m²] Show forest plot | 1 | 41 | Mean Difference (IV, Random, 95% CI) | 6.10 [‐11.16, 23.36] |
| 3 Total kidney volume Show forest plot | 1 | 41 | Mean Difference (IV, Random, 95% CI) | ‐209.0 [‐729.06, 311.06] |
| 4 Albuminuria Show forest plot | 1 | 41 | Mean Difference (IV, Random, 95% CI) | 82.40 [‐162.09, 326.89] |
| Outcome or subgroup title | No. of studies | No. of participants | Statistical method | Effect size |
| 1 GFR descriptive data Show forest plot | Other data | No numeric data | ||
| 2 GFR descriptive data from cross‐over studies Show forest plot | Other data | No numeric data | ||
| 3 Proteinuria descriptive data Show forest plot | Other data | No numeric data | ||
| 4 Systolic blood pressure Show forest plot | 1 | 49 | Mean Difference (IV, Random, 95% CI) | 1.70 [‐6.39, 9.79] |
| 5 Diastolic blood pressure Show forest plot | 1 | 49 | Mean Difference (IV, Random, 95% CI) | ‐1.40 [‐5.54, 2.74] |
| Outcome or subgroup title | No. of studies | No. of participants | Statistical method | Effect size |
| 1 Creatinine Show forest plot | 1 | Mean Difference (IV, Random, 95% CI) | Totals not selected | |
| 2 GFR Show forest plot | 1 | 34 | Mean Difference (IV, Random, 95% CI) | 22.60 [0.92, 44.28] |