Profilaxis con antibióticos para la prevención de complicaciones relacionadas con el Staphylococcus aureus resistente a la meticilina (SARM) en pacientes quirúrgicos
Referencias
References to studies included in this review
References to studies excluded from this review
Additional references
Characteristics of studies
Characteristics of included studies [ordered by study ID]
Ir a:
| Methods | RCT | |
| Participants | Country: France | |
| Interventions | Participants randomly assigned to 2 groups: | |
| Outcomes | SSI and MRSA SSI | |
| Notes | We attempted to contact the authors in September 2012 Source of funding: not reported | |
| Risk of bias | ||
| Bias | Authors' judgement | Support for judgement |
| Random sequence generation (selection bias) | Unclear risk | Comment: this information was not available |
| Allocation concealment (selection bias) | Unclear risk | Comment: this information was not available |
| Blinding of participants and personnel (performance bias) | Unclear risk | Quote: "In a randomised double‐blind trial…" |
| Blinding of outcome assessment (detection bias) | Unclear risk | Quote: "In a randomised double‐blind trial…" |
| Incomplete outcome data (attrition bias) | Unclear risk | Comment: this information was not available |
| Selective reporting (reporting bias) | High risk | Comment: some important outcomes, that are generally assessed, were not reported |
| Methods | RCT | |
| Participants | Country: USA | |
| Interventions | Participants randomly assigned to 2 groups | |
| Outcomes | MRSA SSI | |
| Notes | We attempted to contact the authors in September 2012 Source of funding: not reported, however, some of the authors worked or belonged to the advisory board of a pharmaceutical company | |
| Risk of bias | ||
| Bias | Authors' judgement | Support for judgement |
| Random sequence generation (selection bias) | Unclear risk | Comment: this information was not available |
| Allocation concealment (selection bias) | Unclear risk | Comment: this information was not available |
| Blinding of participants and personnel (performance bias) | Unclear risk | Comment: this information was not available |
| Blinding of outcome assessment (detection bias) | Unclear risk | Comment: this information was not available |
| Incomplete outcome data (attrition bias) | High risk | Comment: there were post‐randomisation drop‐outs |
| Selective reporting (reporting bias) | High risk | Comment: some important outcomes, that are generally assessed, were not reported |
| Methods | RCT | |
| Participants | Country: Japan | |
| Interventions | Participants randomly assigned to 2 groups: | |
| Outcomes | SSI and MRSA SSI. | |
| Notes | We attempted to contact the authors in September 2012 Source of funding: not reported | |
| Risk of bias | ||
| Bias | Authors' judgement | Support for judgement |
| Random sequence generation (selection bias) | Unclear risk | Comment: this information was not available |
| Allocation concealment (selection bias) | Unclear risk | Comment: this information was not available |
| Blinding of participants and personnel (performance bias) | Unclear risk | Comment: this information was not available |
| Blinding of outcome assessment (detection bias) | Unclear risk | Comment: this information was not available |
| Incomplete outcome data (attrition bias) | Unclear risk | Comment: this information was not available |
| Selective reporting (reporting bias) | High risk | Comment: some important outcomes, that are generally assessed, were not reported |
| Methods | RCT | |
| Participants | Country: Japan Inclusion criteria: elective surgery for colon cancer | |
| Interventions | Participants randomly assigned to 2 groups | |
| Outcomes | Mortality, antibiotic‐related serious adverse events, SSI, MRSA SSI, and overall MRSA infections | |
| Notes | We contacted the authors in September 2012, and they provided prompt replies to our questions Source of funding: no external funding (authors' replies) | |
| Risk of bias | ||
| Bias | Authors' judgement | Support for judgement |
| Random sequence generation (selection bias) | Low risk | Quote: "We prepared the same number of A and B in opaque and sealed envelopes, for example, total 100 opaque and sealed envelopes include 50 A and 50 B, and shuffled. Then the surgeon draws the envelope in turn when informed consent is obtained from patients on admission" (author replies)". |
| Allocation concealment (selection bias) | Low risk | Quote: "We prepared the same number of A and B in opaque and sealed envelopes, for example, total 100 opaque and sealed envelopes include 50 A and 50 B, and shuffled. Then the surgeon draws the envelope in turn when informed consent is obtained from patients on admission" (author replies) |
| Blinding of participants and personnel (performance bias) | High risk | Comment: the authors replied that the patients and healthcare providers were not blinded |
| Blinding of outcome assessment (detection bias) | Low risk | Comment: the authors replied that the outcome assessors were blinded |
| Incomplete outcome data (attrition bias) | Low risk | Comment: there were no post‐randomisation drop‐outs |
| Selective reporting (reporting bias) | Low risk | Comment: all important outcomes were reported |
| Methods | RCT | |
| Participants | Country: Japan 2. taken any antibiotics within 14 days before surgery | |
| Interventions | Participants randomly assigned to 2 groups | |
| Outcomes | Mortality, antibiotic‐related serious adverse events, SSI, MRSA SSI, and overall MRSA infections | |
| Notes | We contacted the authors in September 2012, and they replied promptly with answers to our questions Source of funding: no external funding (authors' replies) | |
| Risk of bias | ||
| Bias | Authors' judgement | Support for judgement |
| Random sequence generation (selection bias) | Low risk | Quote: "We prepared the same number of A and B in opaque and sealed envelopes, for example, total 100 opaque and sealed envelopes include 50 A and 50 B, and shuffled. Then the surgeon draws the envelope in turn when informed consent is obtained from patients on admission" (authors' replies) |
| Allocation concealment (selection bias) | Low risk | Quote: "We prepared the same number of A and B in opaque and sealed envelopes, for example, total 100 opaque and sealed envelopes include 50 A and 50 B, and shuffled. Then the surgeon draws the envelope in turn when informed consent is obtained from patients on admission" (authors' replies) |
| Blinding of participants and personnel (performance bias) | High risk | Comment: the authors replied that the patients and healthcare providers were not blinded |
| Blinding of outcome assessment (detection bias) | Low risk | Comment: the authors replied that the outcome assessors were blinded |
| Incomplete outcome data (attrition bias) | High risk | Comment: there were post‐randomisation drop‐outs. Imputation of missing outcome data under different scenarios showed change in conclusions |
| Selective reporting (reporting bias) | Low risk | Comment: all important outcomes were reported |
| Methods | RCT | |
| Participants | Country: USA | |
| Interventions | Participants randomly assigned to 4 groups Group 2: antibiotic 2 (n = 253), as in group 1 plus gentamicin 1.5 mg/kg given iv at induction of anaesthesia | |
| Outcomes | SSI and MRSA SSI | |
| Notes | We attempted to contact the authors in September 2012 Source of funding: not reported | |
| Risk of bias | ||
| Bias | Authors' judgement | Support for judgement |
| Random sequence generation (selection bias) | Unclear risk | Comment: this information was not available |
| Allocation concealment (selection bias) | Unclear risk | Comment: this information was not available |
| Blinding of participants and personnel (performance bias) | High risk | Quote: "Placebo doses were not included" |
| Blinding of outcome assessment (detection bias) | High risk | Quote: "Placebo doses were not included" |
| Incomplete outcome data (attrition bias) | High risk | Comment: there were post‐randomisation drop‐outs |
| Selective reporting (reporting bias) | High risk | Comment: some important outcomes, that are generally assessed, were not reported |
| Methods | RCT | |
| Participants | Country: Japan | |
| Interventions | Participants randomly assigned to 2 groups | |
| Outcomes | SSI and MRSA SSI | |
| Notes | We attempted to contact the authors in September 2012 Source of funding: not reported | |
| Risk of bias | ||
| Bias | Authors' judgement | Support for judgement |
| Random sequence generation (selection bias) | Unclear risk | Comment: this information was not available |
| Allocation concealment (selection bias) | Unclear risk | Comment: this information was not available |
| Blinding of participants and personnel (performance bias) | Unclear risk | Comment: this information was not available |
| Blinding of outcome assessment (detection bias) | Unclear risk | Comment: this information was not available |
| Incomplete outcome data (attrition bias) | High risk | Comment: there were post‐randomisation drop‐outs |
| Selective reporting (reporting bias) | High risk | Comment: some important outcomes, that are generally assessed, were not reported |
| Methods | RCT | |
| Participants | Country: UK | |
| Interventions | Participants randomly assigned to 2 groups | |
| Outcomes | Mortality, antibiotic‐related serious adverse events, SSI, and MRSA SSI | |
| Notes | We contacted the authors in September 2012. Authors provided replies regarding serious adverse events related to antibiotic treatment Source of funding: no external funding (authors' replies) | |
| Risk of bias | ||
| Bias | Authors' judgement | Support for judgement |
| Random sequence generation (selection bias) | Low risk | Quote: "Randomization was done in advance using a random number generator" |
| Allocation concealment (selection bias) | Low risk | Quote: "study assignment cards with medication packs were kept in pharmacy" |
| Blinding of participants and personnel (performance bias) | Low risk | Quote: "The endoscopy nurse prepared the medication and the syringe out of sight of the study investigator, and covered the syringe with an opaque sleeve so that both the study investigator and the patient were ‘blinded’" |
| Blinding of outcome assessment (detection bias) | Low risk | Quote: "The endoscopy nurse prepared the medication and the syringe out of sight of the study investigator, and covered the syringe with an opaque sleeve so that both the study investigator and the patient were ‘blinded’" |
| Incomplete outcome data (attrition bias) | High risk | Comment: there were post‐randomisation drop‐outs |
| Selective reporting (reporting bias) | Low risk | Comment: all important outcomes were reported |
| Methods | RCT | |
| Participants | Country: USA | |
| Interventions | Participants randomly assigned to 2 groups | |
| Outcomes | Antibiotic‐related serious adverse events, SSI, and MRSA SSI | |
| Notes | We contacted the authors in September 2012; they replied, but no additional information was obtained Source of funding: not reported | |
| Risk of bias | ||
| Bias | Authors' judgement | Support for judgement |
| Random sequence generation (selection bias) | Unclear risk | Comment: this information was not available |
| Allocation concealment (selection bias) | Unclear risk | Comment: this information was not available |
| Blinding of participants and personnel (performance bias) | Unclear risk | Comment: this information was not available |
| Blinding of outcome assessment (detection bias) | Unclear risk | Comment: this information was not available |
| Incomplete outcome data (attrition bias) | Unclear risk | Comment: this information was not available |
| Selective reporting (reporting bias) | High risk | Comment: some important outcomes, that are generally assessed, were not reported |
| Methods | RCT | |
| Participants | Country: Japan | |
| Interventions | Participants randomly assigned to 2 groups | |
| Outcomes | SSI and MRSA SSI | |
| Notes | We attempted to contact the authors in September 2012 Source of funding: not reported | |
| Risk of bias | ||
| Bias | Authors' judgement | Support for judgement |
| Random sequence generation (selection bias) | Unclear risk | Comment: this information was not available |
| Allocation concealment (selection bias) | Unclear risk | Comment: this information was not available |
| Blinding of participants and personnel (performance bias) | Unclear risk | Comment: this information was not available |
| Blinding of outcome assessment (detection bias) | Unclear risk | Comment: this information was not available |
| Incomplete outcome data (attrition bias) | Low risk | Comment: there were post‐randomisation drop‐outs, however, imputation of missing outcome data under different scenarios did not change the conclusions |
| Selective reporting (reporting bias) | High risk | Comment: some important outcomes, that are generally assessed, were not reported |
| Methods | RCT | |
| Participants | Country: USA | |
| Interventions | Participants randomly assigned to 3 groups. | |
| Outcomes | SSI and MRSA SSI | |
| Notes | We contacted the authors in September 2012: they replied, but no additional information was obtained Source of funding: not reported, however, Dr Patrick A Stone, the primary author of this paper, is on the Speakers' Bureau for Cubist Pharmaceuticals | |
| Risk of bias | ||
| Bias | Authors' judgement | Support for judgement |
| Random sequence generation (selection bias) | Low risk | Quote: "Randomization was performed by staff from the Center for Health Services and Outcomes Research (CHSOR) using the statistical program SAS" |
| Allocation concealment (selection bias) | Low risk | Quote: "Randomization was performed by staff from the Center for Health Services and Outcomes Research (CHSOR) using the statistical program SAS" |
| Blinding of participants and personnel (performance bias) | Unclear risk | Comment: this information was not available |
| Blinding of outcome assessment (detection bias) | Unclear risk | Comment: this information was not available |
| Incomplete outcome data (attrition bias) | High risk | Comment: there were post‐randomisation drop‐outs. Imputation of missing outcome data under different scenarios showed change in conclusions |
| Selective reporting (reporting bias) | High risk | Comment: Some important outcomes, that are generally assessed, were not reported |
| Methods | RCT | |
| Participants | Country: Finland | |
| Interventions | Participants randomly assigned to 2 groups Group 2: antibiotic 2 (n = 444), cefuroxime 1.5 g iv over 15 minutes at the induction of anaesthesia plus 2 additional doses of 0.75 g at 8‐h intervals | |
| Outcomes | Mortality, SSI, and MRSA SSI | |
| Notes | We attempted to contact the authors in September 2012 Source of funding: Satakunta Fund of the Finnish Cultural Foundation | |
| Risk of bias | ||
| Bias | Authors' judgement | Support for judgement |
| Random sequence generation (selection bias) | Low risk | Quote: "The patients were assigned by reference to a random number table" |
| Allocation concealment (selection bias) | Unclear risk | Comment: this information was not available |
| Blinding of participants and personnel (performance bias) | Unclear risk | Comment: this information was not available |
| Blinding of outcome assessment (detection bias) | Unclear risk | Comment: this information was not available |
| Incomplete outcome data (attrition bias) | High risk | Comment: there were post‐randomisation drop‐outs. Imputation of missing outcome data under different scenarios showed change in conclusions |
| Selective reporting (reporting bias) | High risk | Comment: some important outcomes, that are generally assessed, were not reported |
Abbreviations
< = less than
> = greater/more than
≥ = greater/more than or equal to
CABG = coronary artery bypass graft
ER = emergency room
g = gram
GFR = glomerular filtration rate
h = hour
iv = intravenous
MRSA = methicillin‐resistant Staphylococcus aureus
n = number of participants
OR = operating room
PEG = percutaneous endoscopic gastrostomy
PICU = paediatric intensive care unit
RCT = randomised controlled trial
SSI = surgical site infection
Characteristics of excluded studies [ordered by study ID]
Ir a:
| Study | Reason for exclusion |
| Not an RCT | |
| No information on methicillin resistance status of the cultured organisms | |
| Methicillin resistance status of all staphylococcal infections was not reported | |
| No information on methicillin resistance status of the cultured organisms | |
| Not an RCT | |
| Quasi‐randomised study (allocation by hospital number) | |
| No information on methicillin resistance status of the cultured organisms | |
| Quasi‐randomised study (treatment chosen by the ward to which the patient was admitted) | |
| Not an RCT | |
| No information on methicillin resistance status of the cultured organisms | |
| No information on methicillin resistance status of the cultured organisms | |
| No information on methicillin resistance status of the cultured organisms | |
| No information on methicillin resistance status of the cultured organisms | |
| No information on methicillin resistance status of the cultured organisms | |
| Methicillin resistance status of all staphylococcal infections was not reported | |
| No information on methicillin resistance status of the cultured organisms | |
| No information on methicillin resistance status of the cultured organisms | |
| Quasi‐randomised study (allocation by birth year) | |
| Quasi‐randomised study (allocation according to the first letter of the patient's name) | |
| Quasi‐randomised study (allocation according to the room number to which the patient was admitted) | |
| No information on methicillin resistance status of the cultured organisms | |
| No information on methicillin resistance status of the cultured organisms |
Abbreviation
RCT = randomised controlled trial
Data and analyses
| Outcome or subgroup title | No. of studies | No. of participants | Statistical method | Effect size |
| 1 Mortality Show forest plot | 4 | Risk Ratio (M‐H, Fixed, 95% CI) | Totals not selected | |
| Analysis 1.1  Comparison 1 Comparison of different regimens of prophylactic antibiotics, Outcome 1 Mortality. | ||||
| 1.1 One dose of cefotiam or cefmetazol versus four doses of cefotiam or cefmetazol | 1 | Risk Ratio (M‐H, Fixed, 95% CI) | 0.0 [0.0, 0.0] | |
| 1.2 Kanamycin, erythromycin and cefotiam versus cefotiam | 1 | Risk Ratio (M‐H, Fixed, 95% CI) | 0.0 [0.0, 0.0] | |
| 1.3 Co‐amoxiclav or cefotaxime versus placebo | 1 | Risk Ratio (M‐H, Fixed, 95% CI) | 0.0 [0.0, 0.0] | |
| 1.4 Vancomycin versus cefuroxime | 1 | Risk Ratio (M‐H, Fixed, 95% CI) | 0.0 [0.0, 0.0] | |
| 2 Overall surgical site infection Show forest plot | 11 | Risk Ratio (M‐H, Fixed, 95% CI) | Totals not selected | |
| Analysis 1.2  Comparison 1 Comparison of different regimens of prophylactic antibiotics, Outcome 2 Overall surgical site infection. | ||||
| 2.1 Cefamendole versus cefamendole and gentamycin | 1 | Risk Ratio (M‐H, Fixed, 95% CI) | 0.0 [0.0, 0.0] | |
| 2.2 Cefazolin and gentamycin versus cefamendole and gentamycin | 1 | Risk Ratio (M‐H, Fixed, 95% CI) | 0.0 [0.0, 0.0] | |
| 2.3 Cefazolin versus cefamendole | 1 | Risk Ratio (M‐H, Fixed, 95% CI) | 0.0 [0.0, 0.0] | |
| 2.4 Cefazolin versus cefazolin and gentamycin | 1 | Risk Ratio (M‐H, Fixed, 95% CI) | 0.0 [0.0, 0.0] | |
| 2.5 Co‐amoxiclav or cefotaxime versus placebo | 1 | Risk Ratio (M‐H, Fixed, 95% CI) | 0.0 [0.0, 0.0] | |
| 2.6 Daptomycin and cefazolin versus cefazolin | 1 | Risk Ratio (M‐H, Fixed, 95% CI) | 0.0 [0.0, 0.0] | |
| 2.7 Kanamycin, erythromycin and cefotiam versus cefotiam | 1 | Risk Ratio (M‐H, Fixed, 95% CI) | 0.0 [0.0, 0.0] | |
| 2.8 Levofloxacin versus ofloxacin | 1 | Risk Ratio (M‐H, Fixed, 95% CI) | 0.0 [0.0, 0.0] | |
| 2.9 One day of piperacillin, cefazolin, cefmetazole, or cefotiam versus three days of piperacillin, cefazolin, cefmetazole, or cefotiam | 1 | Risk Ratio (M‐H, Fixed, 95% CI) | 0.0 [0.0, 0.0] | |
| 2.10 One dose of cefotiam or cefmetazol versus four doses of cefotiam or cefmetazol | 1 | Risk Ratio (M‐H, Fixed, 95% CI) | 0.0 [0.0, 0.0] | |
| 2.11 Pefloxacin versus cefazolin and oxacillin | 1 | Risk Ratio (M‐H, Fixed, 95% CI) | 0.0 [0.0, 0.0] | |
| 2.12 Vancomycin and cefazolin versus cefazolin (open fractures) | 1 | Risk Ratio (M‐H, Fixed, 95% CI) | 0.0 [0.0, 0.0] | |
| 2.13 Vancomycin and cefazolin versus cefazolin (vascular surgery) | 1 | Risk Ratio (M‐H, Fixed, 95% CI) | 0.0 [0.0, 0.0] | |
| 2.14 Vancomycin and cefazolin versus daptomycin and cefazolin | 1 | Risk Ratio (M‐H, Fixed, 95% CI) | 0.0 [0.0, 0.0] | |
| 2.15 Vancomycin versus teicoplanin | 1 | Risk Ratio (M‐H, Fixed, 95% CI) | 0.0 [0.0, 0.0] | |
| 2.16 Vancomycin versus cefuroxime | 1 | Risk Ratio (M‐H, Fixed, 95% CI) | 0.0 [0.0, 0.0] | |
| 3 MRSA surgical site infection Show forest plot | 12 | Risk Ratio (M‐H, Fixed, 95% CI) | Totals not selected | |
| Analysis 1.3  Comparison 1 Comparison of different regimens of prophylactic antibiotics, Outcome 3 MRSA surgical site infection. | ||||
| 3.1 Cefamendole versus cefamendole and gentamycin | 1 | Risk Ratio (M‐H, Fixed, 95% CI) | 0.0 [0.0, 0.0] | |
| 3.2 Cefazolin and gentamycin versus cefamendole and gentamycin | 1 | Risk Ratio (M‐H, Fixed, 95% CI) | 0.0 [0.0, 0.0] | |
| 3.3 Cefazolin versus cefamendole | 1 | Risk Ratio (M‐H, Fixed, 95% CI) | 0.0 [0.0, 0.0] | |
| 3.4 Cefazolin versus cefazolin and gentamycin | 1 | Risk Ratio (M‐H, Fixed, 95% CI) | 0.0 [0.0, 0.0] | |
| 3.5 Co‐amoxiclav or cefotaxime versus placebo | 1 | Risk Ratio (M‐H, Fixed, 95% CI) | 0.0 [0.0, 0.0] | |
| 3.6 Daptomycin and cefazolin versus cefazolin | 1 | Risk Ratio (M‐H, Fixed, 95% CI) | 0.0 [0.0, 0.0] | |
| 3.7 Ertapenem versus cefotetan | 1 | Risk Ratio (M‐H, Fixed, 95% CI) | 0.0 [0.0, 0.0] | |
| 3.8 Kanamycin, erythromycin and cefotiam versus cefotiam | 1 | Risk Ratio (M‐H, Fixed, 95% CI) | 0.0 [0.0, 0.0] | |
| 3.9 Levofloxacin versus ofloxacin | 1 | Risk Ratio (M‐H, Fixed, 95% CI) | 0.0 [0.0, 0.0] | |
| 3.10 One day of piperacillin, cefazolin, cefmetazole, or cefotiam versus three days of piperacillin, cefazolin, cefmetazole, or cefotiam | 1 | Risk Ratio (M‐H, Fixed, 95% CI) | 0.0 [0.0, 0.0] | |
| 3.11 One dose of cefotiam or cefmetazol versus four doses of cefotiam or cefmetazol | 1 | Risk Ratio (M‐H, Fixed, 95% CI) | 0.0 [0.0, 0.0] | |
| 3.12 Pefloxacin versus cefazolin and oxacillin | 1 | Risk Ratio (M‐H, Fixed, 95% CI) | 0.0 [0.0, 0.0] | |
| 3.13 Vancomycin and cefazolin versus cefazolin (open fractures) | 1 | Risk Ratio (M‐H, Fixed, 95% CI) | 0.0 [0.0, 0.0] | |
| 3.14 Vancomycin and cefazolin versus cefazolin (vascular surgery) | 1 | Risk Ratio (M‐H, Fixed, 95% CI) | 0.0 [0.0, 0.0] | |
| 3.15 Vancomycin and cefazolin versus daptomycin and cefazolin | 1 | Risk Ratio (M‐H, Fixed, 95% CI) | 0.0 [0.0, 0.0] | |
| 3.16 Vancomycin versus teicoplanin | 1 | Risk Ratio (M‐H, Fixed, 95% CI) | 0.0 [0.0, 0.0] | |
| 3.17 Vancomycin versus cefuroxime | 1 | Risk Ratio (M‐H, Fixed, 95% CI) | 0.0 [0.0, 0.0] | |
| 4 Overall MRSA infections Show forest plot | 2 | Risk Ratio (M‐H, Fixed, 95% CI) | Totals not selected | |
| Analysis 1.4  Comparison 1 Comparison of different regimens of prophylactic antibiotics, Outcome 4 Overall MRSA infections. | ||||
| 4.1 One dose of cefotiam or cefmetazol versus four doses of cefotiam or cefmetazol | 1 | Risk Ratio (M‐H, Fixed, 95% CI) | 0.0 [0.0, 0.0] | |
| 4.2 Kanamycin, erythromycin and cefotiam versus cefotiam | 1 | Risk Ratio (M‐H, Fixed, 95% CI) | 0.0 [0.0, 0.0] | |
| Outcome or subgroup title | No. of studies | No. of participants | Statistical method | Effect size |
| 1 Mortality (kanamycin, erythromycin and cefotiam versus cefotiam) Show forest plot | 1 | Risk Ratio (M‐H, Fixed, 95% CI) | Totals not selected | |
| Analysis 2.1  Comparison 2 Sensitivity analysis, Outcome 1 Mortality (kanamycin, erythromycin and cefotiam versus cefotiam). | ||||
| 1.1 Best‐best scenario | 1 | Risk Ratio (M‐H, Fixed, 95% CI) | 0.0 [0.0, 0.0] | |
| 1.2 Worst‐worst scenario | 1 | Risk Ratio (M‐H, Fixed, 95% CI) | 0.0 [0.0, 0.0] | |
| 1.3 Best‐worst scenario | 1 | Risk Ratio (M‐H, Fixed, 95% CI) | 0.0 [0.0, 0.0] | |
| 1.4 Worst‐best scenario | 1 | Risk Ratio (M‐H, Fixed, 95% CI) | 0.0 [0.0, 0.0] | |
| 2 Mortality (vancomycin versus cefuroxime) Show forest plot | 1 | Risk Ratio (M‐H, Fixed, 95% CI) | Totals not selected | |
| Analysis 2.2  Comparison 2 Sensitivity analysis, Outcome 2 Mortality (vancomycin versus cefuroxime). | ||||
| 2.1 Best‐best scenario | 1 | Risk Ratio (M‐H, Fixed, 95% CI) | 0.0 [0.0, 0.0] | |
| 2.2 Worst‐worst scenario | 1 | Risk Ratio (M‐H, Fixed, 95% CI) | 0.0 [0.0, 0.0] | |
| 2.3 Best‐worst scenario | 1 | Risk Ratio (M‐H, Fixed, 95% CI) | 0.0 [0.0, 0.0] | |
| 2.4 Worst‐best scenario | 1 | Risk Ratio (M‐H, Fixed, 95% CI) | 0.0 [0.0, 0.0] | |
| 3 Surgical site infection (kanamycin, erythromycin and cefotiam versus cefotiam) Show forest plot | 1 | Risk Ratio (M‐H, Fixed, 95% CI) | Totals not selected | |
| Analysis 2.3  Comparison 2 Sensitivity analysis, Outcome 3 Surgical site infection (kanamycin, erythromycin and cefotiam versus cefotiam). | ||||
| 3.1 Best‐best scenario | 1 | Risk Ratio (M‐H, Fixed, 95% CI) | 0.0 [0.0, 0.0] | |
| 3.2 Worst‐worst scenario | 1 | Risk Ratio (M‐H, Fixed, 95% CI) | 0.0 [0.0, 0.0] | |
| 3.3 Best‐worst scenario | 1 | Risk Ratio (M‐H, Fixed, 95% CI) | 0.0 [0.0, 0.0] | |
| 3.4 Worst‐best scenario | 1 | Risk Ratio (M‐H, Fixed, 95% CI) | 0.0 [0.0, 0.0] | |
| 4 Surgical site infection (vancomycin versus teicoplanin) Show forest plot | 1 | Risk Ratio (M‐H, Fixed, 95% CI) | Totals not selected | |
| Analysis 2.4  Comparison 2 Sensitivity analysis, Outcome 4 Surgical site infection (vancomycin versus teicoplanin). | ||||
| 4.1 Best‐best scenario | 1 | Risk Ratio (M‐H, Fixed, 95% CI) | 0.0 [0.0, 0.0] | |
| 4.2 Worst‐worst scenario | 1 | Risk Ratio (M‐H, Fixed, 95% CI) | 0.0 [0.0, 0.0] | |
| 4.3 Best‐worst scenario | 1 | Risk Ratio (M‐H, Fixed, 95% CI) | 0.0 [0.0, 0.0] | |
| 4.4 Worst‐best scenario | 1 | Risk Ratio (M‐H, Fixed, 95% CI) | 0.0 [0.0, 0.0] | |
| 5 Surgical site infection (vancomycin and cefazolin versus daptomycin and cefazolin) Show forest plot | 1 | Risk Ratio (M‐H, Fixed, 95% CI) | Totals not selected | |
| Analysis 2.5  Comparison 2 Sensitivity analysis, Outcome 5 Surgical site infection (vancomycin and cefazolin versus daptomycin and cefazolin). | ||||
| 5.1 Best‐best scenario | 1 | Risk Ratio (M‐H, Fixed, 95% CI) | 0.0 [0.0, 0.0] | |
| 5.2 Worst‐worst scenario | 1 | Risk Ratio (M‐H, Fixed, 95% CI) | 0.0 [0.0, 0.0] | |
| 5.3 Best‐worst scenario | 1 | Risk Ratio (M‐H, Fixed, 95% CI) | 0.0 [0.0, 0.0] | |
| 5.4 Worst‐best scenario | 1 | Risk Ratio (M‐H, Fixed, 95% CI) | 0.0 [0.0, 0.0] | |
| 6 Surgical site infection (vancomycin and cefazolin versus cefazolin) Show forest plot | 1 | Risk Ratio (M‐H, Fixed, 95% CI) | Totals not selected | |
| Analysis 2.6  Comparison 2 Sensitivity analysis, Outcome 6 Surgical site infection (vancomycin and cefazolin versus cefazolin). | ||||
| 6.1 Best‐best scenario | 1 | Risk Ratio (M‐H, Fixed, 95% CI) | 0.0 [0.0, 0.0] | |
| 6.2 Worst‐worst scenario | 1 | Risk Ratio (M‐H, Fixed, 95% CI) | 0.0 [0.0, 0.0] | |
| 6.3 Best‐worst scenario | 1 | Risk Ratio (M‐H, Fixed, 95% CI) | 0.0 [0.0, 0.0] | |
| 6.4 Worst‐best scenario | 1 | Risk Ratio (M‐H, Fixed, 95% CI) | 0.0 [0.0, 0.0] | |
| 7 Surgical site infection (daptomycin and cefazolin versus cefazolin) Show forest plot | 1 | Risk Ratio (M‐H, Fixed, 95% CI) | Totals not selected | |
| Analysis 2.7  Comparison 2 Sensitivity analysis, Outcome 7 Surgical site infection (daptomycin and cefazolin versus cefazolin). | ||||
| 7.1 Best‐best scenario | 1 | Risk Ratio (M‐H, Fixed, 95% CI) | 0.0 [0.0, 0.0] | |
| 7.2 Worst‐worst scenario | 1 | Risk Ratio (M‐H, Fixed, 95% CI) | 0.0 [0.0, 0.0] | |
| 7.3 Best‐worst scenario | 1 | Risk Ratio (M‐H, Fixed, 95% CI) | 0.0 [0.0, 0.0] | |
| 7.4 Worst‐best scenario | 1 | Risk Ratio (M‐H, Fixed, 95% CI) | 0.0 [0.0, 0.0] | |
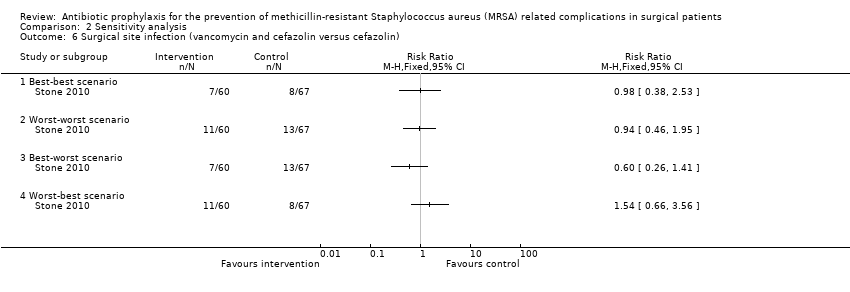
| 8 Surgical site infection (vancomycin versus cefuroxime) Show forest plot | 1 | Risk Ratio (M‐H, Fixed, 95% CI) | Totals not selected | |
| Analysis 2.8  Comparison 2 Sensitivity analysis, Outcome 8 Surgical site infection (vancomycin versus cefuroxime). | ||||
| 8.1 Best‐best scenario | 1 | Risk Ratio (M‐H, Fixed, 95% CI) | 0.0 [0.0, 0.0] | |
| 8.2 Worst‐worst scenario | 1 | Risk Ratio (M‐H, Fixed, 95% CI) | 0.0 [0.0, 0.0] | |
| 8.3 Best‐worst scenario | 1 | Risk Ratio (M‐H, Fixed, 95% CI) | 0.0 [0.0, 0.0] | |
| 8.4 Worst‐best scenario | 1 | Risk Ratio (M‐H, Fixed, 95% CI) | 0.0 [0.0, 0.0] | |
| 9 MRSA surgical site infection (kanamycin, erythromycin and cefotiam versus cefotiam) Show forest plot | 1 | Risk Ratio (M‐H, Fixed, 95% CI) | Totals not selected | |
| Analysis 2.9  Comparison 2 Sensitivity analysis, Outcome 9 MRSA surgical site infection (kanamycin, erythromycin and cefotiam versus cefotiam). | ||||
| 9.1 Best‐best scenario | 1 | Risk Ratio (M‐H, Fixed, 95% CI) | 0.0 [0.0, 0.0] | |
| 9.2 Worst‐worst scenario | 1 | Risk Ratio (M‐H, Fixed, 95% CI) | 0.0 [0.0, 0.0] | |
| 9.3 Best‐worst scenario | 1 | Risk Ratio (M‐H, Fixed, 95% CI) | 0.0 [0.0, 0.0] | |
| 9.4 Worst‐best scenario | 1 | Risk Ratio (M‐H, Fixed, 95% CI) | 0.0 [0.0, 0.0] | |
| 10 MRSA surgical site infection (vancomycin versus teicoplanin) Show forest plot | 1 | Risk Ratio (M‐H, Fixed, 95% CI) | Totals not selected | |
| Analysis 2.10  Comparison 2 Sensitivity analysis, Outcome 10 MRSA surgical site infection (vancomycin versus teicoplanin). | ||||
| 10.1 Best‐best scenario | 1 | Risk Ratio (M‐H, Fixed, 95% CI) | 0.0 [0.0, 0.0] | |
| 10.2 Worst‐worst scenario | 1 | Risk Ratio (M‐H, Fixed, 95% CI) | 0.0 [0.0, 0.0] | |
| 10.3 Best‐worst scenario | 1 | Risk Ratio (M‐H, Fixed, 95% CI) | 0.0 [0.0, 0.0] | |
| 10.4 Worst‐best scenario | 1 | Risk Ratio (M‐H, Fixed, 95% CI) | 0.0 [0.0, 0.0] | |
| 11 MRSA surgical site infection (vancomycin and cefazolin versus daptomycin and cefazolin) Show forest plot | 1 | Risk Ratio (M‐H, Fixed, 95% CI) | Totals not selected | |
| Analysis 2.11  Comparison 2 Sensitivity analysis, Outcome 11 MRSA surgical site infection (vancomycin and cefazolin versus daptomycin and cefazolin). | ||||
| 11.1 Best‐best scenario | 1 | Risk Ratio (M‐H, Fixed, 95% CI) | 0.0 [0.0, 0.0] | |
| 11.2 Worst‐worst scenario | 1 | Risk Ratio (M‐H, Fixed, 95% CI) | 0.0 [0.0, 0.0] | |
| 11.3 Best‐worst scenario | 1 | Risk Ratio (M‐H, Fixed, 95% CI) | 0.0 [0.0, 0.0] | |
| 11.4 Worst‐best scenario | 1 | Risk Ratio (M‐H, Fixed, 95% CI) | 0.0 [0.0, 0.0] | |
| 12 MRSA surgical site infection (vancomycin and cefazolin versus cefazolin) Show forest plot | 1 | Risk Ratio (M‐H, Fixed, 95% CI) | Totals not selected | |
| Analysis 2.12  Comparison 2 Sensitivity analysis, Outcome 12 MRSA surgical site infection (vancomycin and cefazolin versus cefazolin). | ||||
| 12.1 Best‐best scenario | 1 | Risk Ratio (M‐H, Fixed, 95% CI) | 0.0 [0.0, 0.0] | |
| 12.2 Worst‐worst scenario | 1 | Risk Ratio (M‐H, Fixed, 95% CI) | 0.0 [0.0, 0.0] | |
| 12.3 Best‐worst scenario | 1 | Risk Ratio (M‐H, Fixed, 95% CI) | 0.0 [0.0, 0.0] | |
| 12.4 Worst‐best scenario | 1 | Risk Ratio (M‐H, Fixed, 95% CI) | 0.0 [0.0, 0.0] | |
| 13 MRSA surgical site infection (daptomycin and cefazolin versus cefazolin) Show forest plot | 1 | Risk Ratio (M‐H, Fixed, 95% CI) | Totals not selected | |
| Analysis 2.13  Comparison 2 Sensitivity analysis, Outcome 13 MRSA surgical site infection (daptomycin and cefazolin versus cefazolin). | ||||
| 13.1 Best‐best scenario | 1 | Risk Ratio (M‐H, Fixed, 95% CI) | 0.0 [0.0, 0.0] | |
| 13.2 Worst‐worst scenario | 1 | Risk Ratio (M‐H, Fixed, 95% CI) | 0.0 [0.0, 0.0] | |
| 13.3 Best‐worst scenario | 1 | Risk Ratio (M‐H, Fixed, 95% CI) | 0.0 [0.0, 0.0] | |
| 13.4 Worst‐best scenario | 1 | Risk Ratio (M‐H, Fixed, 95% CI) | 0.0 [0.0, 0.0] | |
| 14 MRSA surgical site infection (vancomycin versus cefuroxime) Show forest plot | 1 | Risk Ratio (M‐H, Fixed, 95% CI) | Totals not selected | |
| Analysis 2.14  Comparison 2 Sensitivity analysis, Outcome 14 MRSA surgical site infection (vancomycin versus cefuroxime). | ||||
| 14.1 Best‐best scenario | 1 | Risk Ratio (M‐H, Fixed, 95% CI) | 0.0 [0.0, 0.0] | |
| 14.2 Worst‐worst scenario | 1 | Risk Ratio (M‐H, Fixed, 95% CI) | 0.0 [0.0, 0.0] | |
| 14.3 Best‐worst scenario | 1 | Risk Ratio (M‐H, Fixed, 95% CI) | 0.0 [0.0, 0.0] | |
| 14.4 Worst‐best scenario | 1 | Risk Ratio (M‐H, Fixed, 95% CI) | 0.0 [0.0, 0.0] | |
| 15 Overall MRSA infections (kanamycin, erythromycin and cefotiam versus cefotiam) Show forest plot | 1 | Risk Ratio (M‐H, Fixed, 95% CI) | Totals not selected | |
| Analysis 2.15  Comparison 2 Sensitivity analysis, Outcome 15 Overall MRSA infections (kanamycin, erythromycin and cefotiam versus cefotiam). | ||||
| 15.1 Best‐best scenario | 1 | Risk Ratio (M‐H, Fixed, 95% CI) | 0.0 [0.0, 0.0] | |
| 15.2 Worst‐worst scenario | 1 | Risk Ratio (M‐H, Fixed, 95% CI) | 0.0 [0.0, 0.0] | |
| 15.3 Best‐worst scenario | 1 | Risk Ratio (M‐H, Fixed, 95% CI) | 0.0 [0.0, 0.0] | |
| 15.4 Worst‐best scenario | 1 | Risk Ratio (M‐H, Fixed, 95% CI) | 0.0 [0.0, 0.0] | |

Study flow diagram.

Risk of bias graph: review authors' judgements about each risk of bias item presented as percentages across all included studies

Risk of bias summary: review authors' judgements about each risk of bias item for each included study
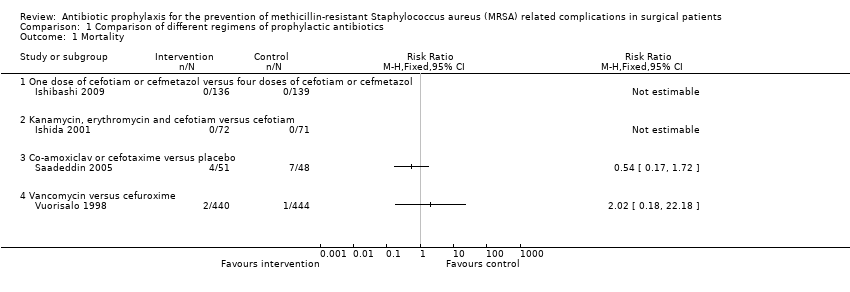
Comparison 1 Comparison of different regimens of prophylactic antibiotics, Outcome 1 Mortality.
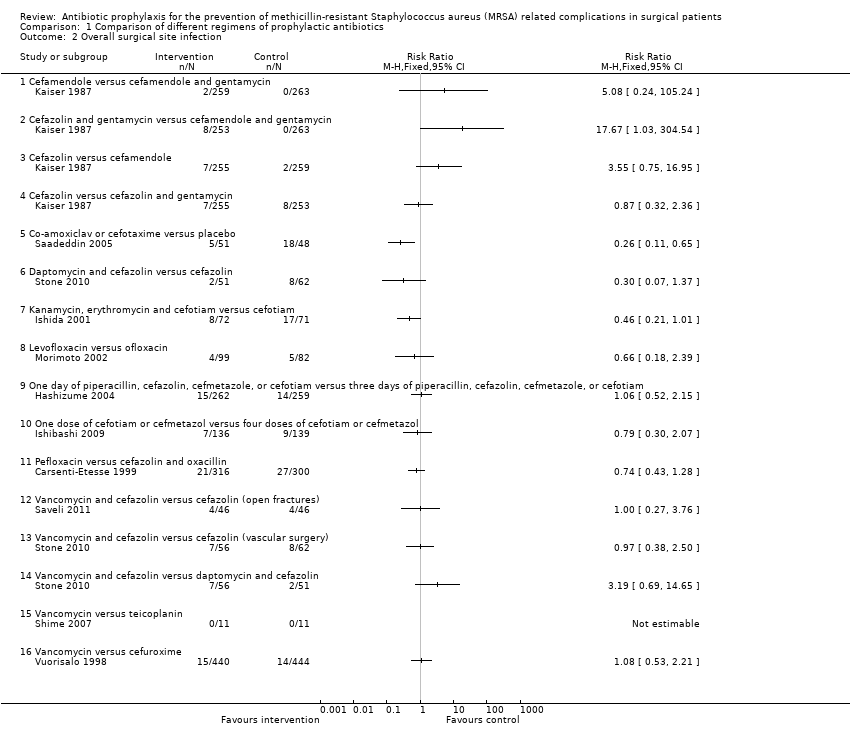
Comparison 1 Comparison of different regimens of prophylactic antibiotics, Outcome 2 Overall surgical site infection.

Comparison 1 Comparison of different regimens of prophylactic antibiotics, Outcome 3 MRSA surgical site infection.
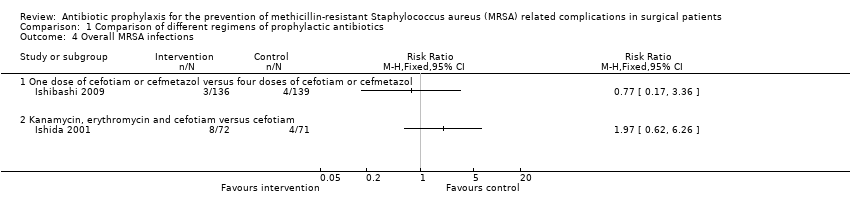
Comparison 1 Comparison of different regimens of prophylactic antibiotics, Outcome 4 Overall MRSA infections.

Comparison 2 Sensitivity analysis, Outcome 1 Mortality (kanamycin, erythromycin and cefotiam versus cefotiam).

Comparison 2 Sensitivity analysis, Outcome 2 Mortality (vancomycin versus cefuroxime).

Comparison 2 Sensitivity analysis, Outcome 3 Surgical site infection (kanamycin, erythromycin and cefotiam versus cefotiam).
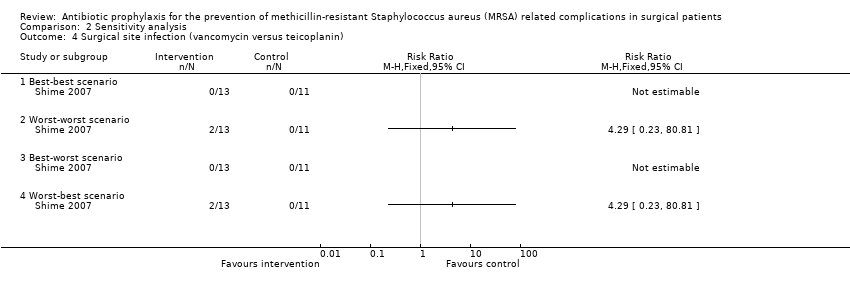
Comparison 2 Sensitivity analysis, Outcome 4 Surgical site infection (vancomycin versus teicoplanin).

Comparison 2 Sensitivity analysis, Outcome 5 Surgical site infection (vancomycin and cefazolin versus daptomycin and cefazolin).
Comparison 2 Sensitivity analysis, Outcome 6 Surgical site infection (vancomycin and cefazolin versus cefazolin).

Comparison 2 Sensitivity analysis, Outcome 7 Surgical site infection (daptomycin and cefazolin versus cefazolin).

Comparison 2 Sensitivity analysis, Outcome 8 Surgical site infection (vancomycin versus cefuroxime).

Comparison 2 Sensitivity analysis, Outcome 9 MRSA surgical site infection (kanamycin, erythromycin and cefotiam versus cefotiam).
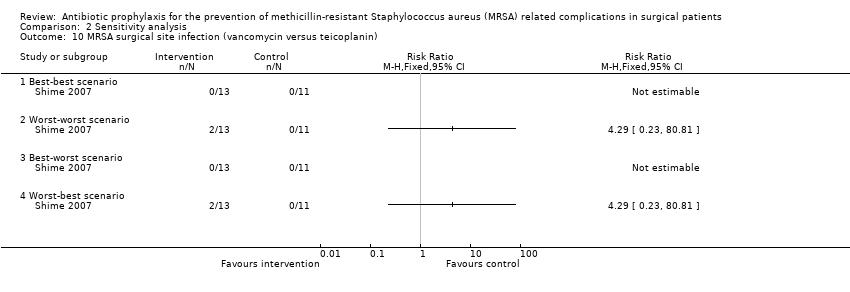
Comparison 2 Sensitivity analysis, Outcome 10 MRSA surgical site infection (vancomycin versus teicoplanin).
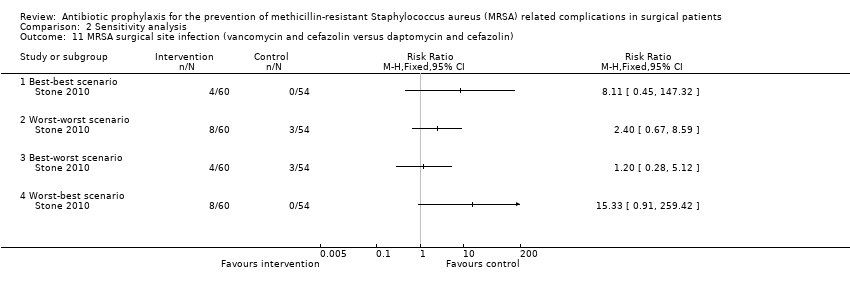
Comparison 2 Sensitivity analysis, Outcome 11 MRSA surgical site infection (vancomycin and cefazolin versus daptomycin and cefazolin).

Comparison 2 Sensitivity analysis, Outcome 12 MRSA surgical site infection (vancomycin and cefazolin versus cefazolin).
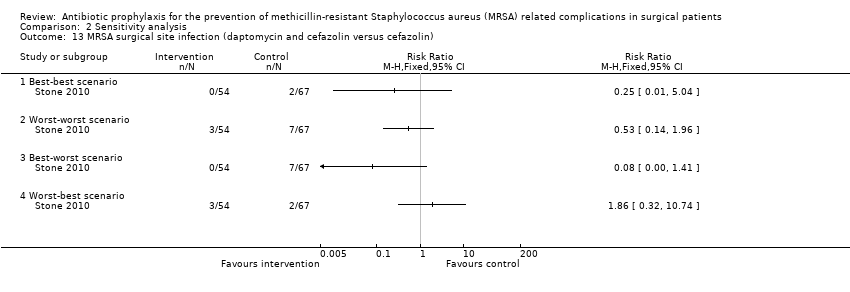
Comparison 2 Sensitivity analysis, Outcome 13 MRSA surgical site infection (daptomycin and cefazolin versus cefazolin).

Comparison 2 Sensitivity analysis, Outcome 14 MRSA surgical site infection (vancomycin versus cefuroxime).
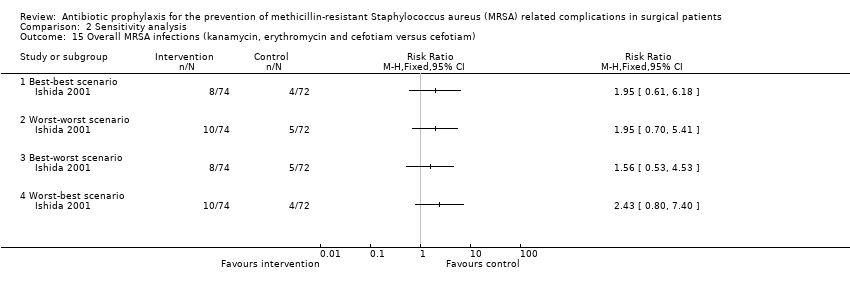
Comparison 2 Sensitivity analysis, Outcome 15 Overall MRSA infections (kanamycin, erythromycin and cefotiam versus cefotiam).
| Mortality | |||||
| Patient or population: surgical patients | |||||
| Comparisons | Illustrative comparative risks* (95% CI) | Relative effect | No of Participants | Quality of the evidence | |
| Assumed risk | Corresponding risk | ||||
| Control | Comparison of different regimens of prophylactic antibiotic regimens | ||||
| One dose of cefotiam or cefmetazol versus four doses of cefotiam or cefmetazol (elective surgery for colon cancer) | See comment | See comment | Not estimable | 275 | ⊕⊝⊝⊝ |
| Kanamycin, erythromycin and cefotiam versus cefotiam (surgery for colorectal diseases) | See comment | See comment | Not estimable | 143 | ⊕⊝⊝⊝ |
| Co‐amoxiclav or cefotaxime versus placebo (percutaneous endoscopic gastrostomy) | 146 per 1000 | 79 per 1000 | RR 0.54 | 99 | ⊕⊝⊝⊝ |
| Vancomycin versus cefuroxime (coronary artery bypass graft without valvular disease) | 2 per 1000 | 5 per 1000 | RR 2.02 | 884 | ⊕⊝⊝⊝ |
| *The basis for the assumed risk is the control group risk in the study. The corresponding risk (and its 95% confidence interval) is based on the assumed risk in the comparison group and the relative effect of the intervention (and its 95% CI). | |||||
| GRADE Working Group grades of evidence: | |||||
| 1 The risk of bias in the trial was high | |||||
| Surgical site infection | |||||
| Patient or population: surgical patients | |||||
| Comparisons | Illustrative comparative risks* (95% CI) | Relative effect | No of Participants | Quality of the evidence | |
| Assumed risk | Corresponding risk | ||||
| Control | Comparison of different regimens of prophylactic antibiotic regimens | ||||
| Cefamendole versus cefamendole and gentamycin (median sternotomy) | Moderate | RR 5.08 | 522 | ⊕⊝⊝⊝ | |
| 5 per 1000 | 25 per 1000 | ||||
| Cefazolin versus cefamendole (median sternotomy) | 8 per 1000 | 27 per 1000 | RR 3.55 | 514 | ⊕⊝⊝⊝ |
| Cefazolin versus cefazolin and gentamycin (median sternotomy) | 32 per 1000 | 28 per 1000 | RR 0.87 | 508 | ⊕⊝⊝⊝ |
| Co‐amoxiclav or cefotaxime versus placebo (percutaneous endoscopic gastrostomy) | 375 per 1000 | 98 per 1000 | RR 0.26 | 99 | ⊕⊕⊝⊝ |
| Daptomycin and cefazolin versus cefazolin (vascular surgery) | 129 per 1000 | 39 per 1000 | RR 0.3 | 113 | ⊕⊝⊝⊝ |
| Kanamycin, erythromycin and cefotiam versus cefotiam (surgery for colorectal diseases) | 239 per 1000 | 110 per 1000 | RR 0.46 | 143 | ⊕⊝⊝⊝ |
| Levofloxacin versus ofloxacin (breast cancer) | 61 per 1000 | 40 per 1000 | RR 0.66 | 181 | ⊕⊝⊝⊝ |
| One day of piperacillin, cefazolin, cefmetazole, or cefotiam versus three days of piperacillin, cefazolin, cefmetazole, or cefotiam (elective colorectal surgery) | 54 per 1000 | 57 per 1000 | RR 1.06 | 521 | ⊕⊝⊝⊝ |
| One dose of cefotiam or cefmetazol versus four doses of cefotiam or cefmetazol (elective surgery for colon cancer) | 65 per 1000 | 51 per 1000 | RR 0.79 | 275 | ⊕⊝⊝⊝ |
| Pefloxacin versus cefazolin and oxacillin (tibial fracture requiring external fixation) | 90 per 1000 | 67 per 1000 | RR 0.74 | 616 | ⊕⊝⊝⊝ |
| Vancomycin and cefazolin versus cefazolin (open fractures) | 87 per 1000 | 87 per 1000 | RR 1 | 92 | ⊕⊝⊝⊝ |
| Vancomycin and cefazolin versus cefazolin (vascular surgery) ‐ suggest add for all comparisons | 129 per 1000 | 125 per 1000 | RR 0.97 | 118 | ⊕⊝⊝⊝ |
| Vancomycin and cefazolin versus daptomycin and cefazolin (vascular surgery) | 39 per 1000 | 125 per 1000 | RR 3.19 | 107 | ⊕⊝⊝⊝ |
| Vancomycin versus teicoplanin (paediatric cardiac surgery) | No infection in either group | Not estimable | 22 | ⊕⊝⊝⊝ | |
| Vancomycin versus cefuroxime (coronary artery bypass graft without valvular disease) | 32 per 1000 | 34 per 1000 | RR 1.08 | 884 | ⊕⊝⊝⊝ |
| *The basis for the assumed risk is the control group risk in the study. When there were no events in either group, we have indicated so. When there were events in the intervention group but not in the control group, we have used a moderate proportion of 0.5% in the control group. The corresponding risk (and its 95% confidence interval) is based on the assumed risk in the comparison group and the relative effect of the intervention (and its 95% CI). | |||||
| GRADE Working Group grades of evidence: | |||||
| 1 The risk of bias in the trial was high | |||||
| MRSA surgical site infection | |||||
| Patient or population: surgical patients | |||||
| Comparisons | Illustrative comparative risks* (95% CI) | Relative effect | No of Participants | Quality of the evidence | |
| Assumed risk | Corresponding risk | ||||
| Control | Comparison of different regimens of prophylactic antibiotic regimens | ||||
| Cefamendole versus cefamendole and gentamycin (median sternotomy) | No infection in either group | Not estimable | 522 | ⊕⊝⊝⊝ | |
| Cefazolin and gentamycin versus cefamendole and gentamycin (median sternotomy) | No infection in either group | Not estimable | 516 | ⊕⊝⊝⊝ | |
| Cefazolin versus cefamendole (median sternotomy) | Moderate | RR 3.05 | 514 | ⊕⊝⊝⊝ | |
| 5 per 1000 | 15 per 1000 | ||||
| Cefazolin versus cefazolin and gentamycin (median sternotomy) | Moderate | RR 2.98 | 508 | ⊕⊝⊝⊝ | |
| 5 per 1000 | 15 per 1000 | ||||
| Co‐amoxiclav or cefotaxime versus placebo (percutaneous endoscopic gastrostomy) | 188 per 1000 | 9 per 1000 | RR 0.05 | 99 | ⊕⊕⊝⊝ |
| Daptomycin and cefazolin versus cefazolin (vascular surgery) | 32 per 1000 | 8 per 1000 | RR 0.24 | 113 | ⊕⊝⊝⊝ |
| Ertapenem versus cefotetan (elective colorectal surgery) | 15 per 1000 | 9 per 1000 | RR 0.59 | 672 | ⊕⊝⊝⊝ |
| Kanamycin, erythromycin and cefotiam versus cefotiam (surgery for colorectal diseases) | 28 per 1000 | 55 per 1000 | RR 1.97 | 143 | ⊕⊝⊝⊝ |
| Levofloxacin versus ofloxacin (breast cancer) | No infection in either group | Not estimable | 181 | ⊕⊝⊝⊝ | |
| One day of piperacillin, cefazolin, cefmetazole, or cefotiam versus three days of piperacillin, cefazolin, cefmetazole, or cefotiam (elective colorectal surgery) | No infection in either group | Not estimable | 521 | ⊕⊝⊝⊝ | |
| One dose of cefotiam or cefmetazol versus four doses of cefotiam or cefmetazol (elective surgery for colon cancer) | 22 per 1000 | 22 per 1000 | RR 1.02 | 275 | ⊕⊝⊝⊝ |
| Pefloxacin versus cefazolin and oxacillin (tibial fracture requiring external fixation) | 3 per 1000 | 13 per 1000 | RR 3.8 | 616 | ⊕⊝⊝⊝ |
| Vancomycin and cefazolin versus cefazolin (open fractures) | Moderate | RR 3 | 92 | ⊕⊝⊝⊝ | |
| 5 per 1000 | 15 per 1000 | ||||
| Vancomycin and cefazolin versus cefazolin (vascular surgery) | 32 per 1000 | 71 per 1000 | RR 2.21 | 118 | ⊕⊝⊝⊝ |
| Vancomycin and cefazolin versus daptomycin and cefazolin (vascular surgery) | Moderate | RR 8.21 | 107 | ⊕⊝⊝⊝ | |
| 5 per 1000 | 41 per 1000 | ||||
| Vancomycin versus teicoplanin (paediatric cardiac surgery) | No infection in either group | Not estimable | 22 | ⊕⊝⊝⊝ | |
| Vancomycin versus cefuroxime (coronary artery bypass graft without valvular disease) | 5 per 1000 | 5 per 1000 | RR 1.01 | 884 | ⊕⊝⊝⊝ |
| *The basis for the assumed risk is the control group risk in the study. When there were no events in either group, we have indicated so. When there were events in the intervention group but not in the control group, we have used a moderate proportion of 0.5% in the control group. The corresponding risk (and its 95% confidence interval) is based on the assumed risk in the comparison group and the relative effect of the intervention (and its 95% CI). | |||||
| GRADE Working Group grades of evidence: | |||||
| 1 The risk of bias in the trial was high | |||||
| Overall MRSA infections | |||||
| Patient or population: surgical patients | |||||
| Comparisons | Illustrative comparative risks* (95% CI) | Relative effect | No of Participants | Quality of the evidence | |
| Assumed risk | Corresponding risk | ||||
| Control | Comparison of different regimens of prophylactic antibiotic regimens | ||||
| One dose of cefotiam or cefmetazol versus four doses of cefotiam or cefmetazol (elective surgery for colon cancer) | 29 per 1000 | 22 per 1000 | RR 0.77 | 275 | ⊕⊝⊝⊝ |
| Kanamycin, erythromycin and cefotiam versus cefotiam (surgery for colorectal diseases) | 56 per 1000 | 111 per 1000 | RR 1.97 | 143 | ⊕⊝⊝⊝ |
| *The basis for the assumed risk is the control group risk in the study. The corresponding risk (and its 95% confidence interval) is based on the assumed risk in the comparison group and the relative effect of the intervention (and its 95% CI). | |||||
| GRADE Working Group grades of evidence: | |||||
| 1 The risk of bias in the trial was high. | |||||
| Outcome or subgroup title | No. of studies | No. of participants | Statistical method | Effect size |
| 1 Mortality Show forest plot | 4 | Risk Ratio (M‐H, Fixed, 95% CI) | Totals not selected | |
| 1.1 One dose of cefotiam or cefmetazol versus four doses of cefotiam or cefmetazol | 1 | Risk Ratio (M‐H, Fixed, 95% CI) | 0.0 [0.0, 0.0] | |
| 1.2 Kanamycin, erythromycin and cefotiam versus cefotiam | 1 | Risk Ratio (M‐H, Fixed, 95% CI) | 0.0 [0.0, 0.0] | |
| 1.3 Co‐amoxiclav or cefotaxime versus placebo | 1 | Risk Ratio (M‐H, Fixed, 95% CI) | 0.0 [0.0, 0.0] | |
| 1.4 Vancomycin versus cefuroxime | 1 | Risk Ratio (M‐H, Fixed, 95% CI) | 0.0 [0.0, 0.0] | |
| 2 Overall surgical site infection Show forest plot | 11 | Risk Ratio (M‐H, Fixed, 95% CI) | Totals not selected | |
| 2.1 Cefamendole versus cefamendole and gentamycin | 1 | Risk Ratio (M‐H, Fixed, 95% CI) | 0.0 [0.0, 0.0] | |
| 2.2 Cefazolin and gentamycin versus cefamendole and gentamycin | 1 | Risk Ratio (M‐H, Fixed, 95% CI) | 0.0 [0.0, 0.0] | |
| 2.3 Cefazolin versus cefamendole | 1 | Risk Ratio (M‐H, Fixed, 95% CI) | 0.0 [0.0, 0.0] | |
| 2.4 Cefazolin versus cefazolin and gentamycin | 1 | Risk Ratio (M‐H, Fixed, 95% CI) | 0.0 [0.0, 0.0] | |
| 2.5 Co‐amoxiclav or cefotaxime versus placebo | 1 | Risk Ratio (M‐H, Fixed, 95% CI) | 0.0 [0.0, 0.0] | |
| 2.6 Daptomycin and cefazolin versus cefazolin | 1 | Risk Ratio (M‐H, Fixed, 95% CI) | 0.0 [0.0, 0.0] | |
| 2.7 Kanamycin, erythromycin and cefotiam versus cefotiam | 1 | Risk Ratio (M‐H, Fixed, 95% CI) | 0.0 [0.0, 0.0] | |
| 2.8 Levofloxacin versus ofloxacin | 1 | Risk Ratio (M‐H, Fixed, 95% CI) | 0.0 [0.0, 0.0] | |
| 2.9 One day of piperacillin, cefazolin, cefmetazole, or cefotiam versus three days of piperacillin, cefazolin, cefmetazole, or cefotiam | 1 | Risk Ratio (M‐H, Fixed, 95% CI) | 0.0 [0.0, 0.0] | |
| 2.10 One dose of cefotiam or cefmetazol versus four doses of cefotiam or cefmetazol | 1 | Risk Ratio (M‐H, Fixed, 95% CI) | 0.0 [0.0, 0.0] | |
| 2.11 Pefloxacin versus cefazolin and oxacillin | 1 | Risk Ratio (M‐H, Fixed, 95% CI) | 0.0 [0.0, 0.0] | |
| 2.12 Vancomycin and cefazolin versus cefazolin (open fractures) | 1 | Risk Ratio (M‐H, Fixed, 95% CI) | 0.0 [0.0, 0.0] | |
| 2.13 Vancomycin and cefazolin versus cefazolin (vascular surgery) | 1 | Risk Ratio (M‐H, Fixed, 95% CI) | 0.0 [0.0, 0.0] | |
| 2.14 Vancomycin and cefazolin versus daptomycin and cefazolin | 1 | Risk Ratio (M‐H, Fixed, 95% CI) | 0.0 [0.0, 0.0] | |
| 2.15 Vancomycin versus teicoplanin | 1 | Risk Ratio (M‐H, Fixed, 95% CI) | 0.0 [0.0, 0.0] | |
| 2.16 Vancomycin versus cefuroxime | 1 | Risk Ratio (M‐H, Fixed, 95% CI) | 0.0 [0.0, 0.0] | |
| 3 MRSA surgical site infection Show forest plot | 12 | Risk Ratio (M‐H, Fixed, 95% CI) | Totals not selected | |
| 3.1 Cefamendole versus cefamendole and gentamycin | 1 | Risk Ratio (M‐H, Fixed, 95% CI) | 0.0 [0.0, 0.0] | |
| 3.2 Cefazolin and gentamycin versus cefamendole and gentamycin | 1 | Risk Ratio (M‐H, Fixed, 95% CI) | 0.0 [0.0, 0.0] | |
| 3.3 Cefazolin versus cefamendole | 1 | Risk Ratio (M‐H, Fixed, 95% CI) | 0.0 [0.0, 0.0] | |
| 3.4 Cefazolin versus cefazolin and gentamycin | 1 | Risk Ratio (M‐H, Fixed, 95% CI) | 0.0 [0.0, 0.0] | |
| 3.5 Co‐amoxiclav or cefotaxime versus placebo | 1 | Risk Ratio (M‐H, Fixed, 95% CI) | 0.0 [0.0, 0.0] | |
| 3.6 Daptomycin and cefazolin versus cefazolin | 1 | Risk Ratio (M‐H, Fixed, 95% CI) | 0.0 [0.0, 0.0] | |
| 3.7 Ertapenem versus cefotetan | 1 | Risk Ratio (M‐H, Fixed, 95% CI) | 0.0 [0.0, 0.0] | |
| 3.8 Kanamycin, erythromycin and cefotiam versus cefotiam | 1 | Risk Ratio (M‐H, Fixed, 95% CI) | 0.0 [0.0, 0.0] | |
| 3.9 Levofloxacin versus ofloxacin | 1 | Risk Ratio (M‐H, Fixed, 95% CI) | 0.0 [0.0, 0.0] | |
| 3.10 One day of piperacillin, cefazolin, cefmetazole, or cefotiam versus three days of piperacillin, cefazolin, cefmetazole, or cefotiam | 1 | Risk Ratio (M‐H, Fixed, 95% CI) | 0.0 [0.0, 0.0] | |
| 3.11 One dose of cefotiam or cefmetazol versus four doses of cefotiam or cefmetazol | 1 | Risk Ratio (M‐H, Fixed, 95% CI) | 0.0 [0.0, 0.0] | |
| 3.12 Pefloxacin versus cefazolin and oxacillin | 1 | Risk Ratio (M‐H, Fixed, 95% CI) | 0.0 [0.0, 0.0] | |
| 3.13 Vancomycin and cefazolin versus cefazolin (open fractures) | 1 | Risk Ratio (M‐H, Fixed, 95% CI) | 0.0 [0.0, 0.0] | |
| 3.14 Vancomycin and cefazolin versus cefazolin (vascular surgery) | 1 | Risk Ratio (M‐H, Fixed, 95% CI) | 0.0 [0.0, 0.0] | |
| 3.15 Vancomycin and cefazolin versus daptomycin and cefazolin | 1 | Risk Ratio (M‐H, Fixed, 95% CI) | 0.0 [0.0, 0.0] | |
| 3.16 Vancomycin versus teicoplanin | 1 | Risk Ratio (M‐H, Fixed, 95% CI) | 0.0 [0.0, 0.0] | |
| 3.17 Vancomycin versus cefuroxime | 1 | Risk Ratio (M‐H, Fixed, 95% CI) | 0.0 [0.0, 0.0] | |
| 4 Overall MRSA infections Show forest plot | 2 | Risk Ratio (M‐H, Fixed, 95% CI) | Totals not selected | |
| 4.1 One dose of cefotiam or cefmetazol versus four doses of cefotiam or cefmetazol | 1 | Risk Ratio (M‐H, Fixed, 95% CI) | 0.0 [0.0, 0.0] | |
| 4.2 Kanamycin, erythromycin and cefotiam versus cefotiam | 1 | Risk Ratio (M‐H, Fixed, 95% CI) | 0.0 [0.0, 0.0] | |
| Outcome or subgroup title | No. of studies | No. of participants | Statistical method | Effect size |
| 1 Mortality (kanamycin, erythromycin and cefotiam versus cefotiam) Show forest plot | 1 | Risk Ratio (M‐H, Fixed, 95% CI) | Totals not selected | |
| 1.1 Best‐best scenario | 1 | Risk Ratio (M‐H, Fixed, 95% CI) | 0.0 [0.0, 0.0] | |
| 1.2 Worst‐worst scenario | 1 | Risk Ratio (M‐H, Fixed, 95% CI) | 0.0 [0.0, 0.0] | |
| 1.3 Best‐worst scenario | 1 | Risk Ratio (M‐H, Fixed, 95% CI) | 0.0 [0.0, 0.0] | |
| 1.4 Worst‐best scenario | 1 | Risk Ratio (M‐H, Fixed, 95% CI) | 0.0 [0.0, 0.0] | |
| 2 Mortality (vancomycin versus cefuroxime) Show forest plot | 1 | Risk Ratio (M‐H, Fixed, 95% CI) | Totals not selected | |
| 2.1 Best‐best scenario | 1 | Risk Ratio (M‐H, Fixed, 95% CI) | 0.0 [0.0, 0.0] | |
| 2.2 Worst‐worst scenario | 1 | Risk Ratio (M‐H, Fixed, 95% CI) | 0.0 [0.0, 0.0] | |
| 2.3 Best‐worst scenario | 1 | Risk Ratio (M‐H, Fixed, 95% CI) | 0.0 [0.0, 0.0] | |
| 2.4 Worst‐best scenario | 1 | Risk Ratio (M‐H, Fixed, 95% CI) | 0.0 [0.0, 0.0] | |
| 3 Surgical site infection (kanamycin, erythromycin and cefotiam versus cefotiam) Show forest plot | 1 | Risk Ratio (M‐H, Fixed, 95% CI) | Totals not selected | |
| 3.1 Best‐best scenario | 1 | Risk Ratio (M‐H, Fixed, 95% CI) | 0.0 [0.0, 0.0] | |
| 3.2 Worst‐worst scenario | 1 | Risk Ratio (M‐H, Fixed, 95% CI) | 0.0 [0.0, 0.0] | |
| 3.3 Best‐worst scenario | 1 | Risk Ratio (M‐H, Fixed, 95% CI) | 0.0 [0.0, 0.0] | |
| 3.4 Worst‐best scenario | 1 | Risk Ratio (M‐H, Fixed, 95% CI) | 0.0 [0.0, 0.0] | |
| 4 Surgical site infection (vancomycin versus teicoplanin) Show forest plot | 1 | Risk Ratio (M‐H, Fixed, 95% CI) | Totals not selected | |
| 4.1 Best‐best scenario | 1 | Risk Ratio (M‐H, Fixed, 95% CI) | 0.0 [0.0, 0.0] | |
| 4.2 Worst‐worst scenario | 1 | Risk Ratio (M‐H, Fixed, 95% CI) | 0.0 [0.0, 0.0] | |
| 4.3 Best‐worst scenario | 1 | Risk Ratio (M‐H, Fixed, 95% CI) | 0.0 [0.0, 0.0] | |
| 4.4 Worst‐best scenario | 1 | Risk Ratio (M‐H, Fixed, 95% CI) | 0.0 [0.0, 0.0] | |
| 5 Surgical site infection (vancomycin and cefazolin versus daptomycin and cefazolin) Show forest plot | 1 | Risk Ratio (M‐H, Fixed, 95% CI) | Totals not selected | |
| 5.1 Best‐best scenario | 1 | Risk Ratio (M‐H, Fixed, 95% CI) | 0.0 [0.0, 0.0] | |
| 5.2 Worst‐worst scenario | 1 | Risk Ratio (M‐H, Fixed, 95% CI) | 0.0 [0.0, 0.0] | |
| 5.3 Best‐worst scenario | 1 | Risk Ratio (M‐H, Fixed, 95% CI) | 0.0 [0.0, 0.0] | |
| 5.4 Worst‐best scenario | 1 | Risk Ratio (M‐H, Fixed, 95% CI) | 0.0 [0.0, 0.0] | |
| 6 Surgical site infection (vancomycin and cefazolin versus cefazolin) Show forest plot | 1 | Risk Ratio (M‐H, Fixed, 95% CI) | Totals not selected | |
| 6.1 Best‐best scenario | 1 | Risk Ratio (M‐H, Fixed, 95% CI) | 0.0 [0.0, 0.0] | |
| 6.2 Worst‐worst scenario | 1 | Risk Ratio (M‐H, Fixed, 95% CI) | 0.0 [0.0, 0.0] | |
| 6.3 Best‐worst scenario | 1 | Risk Ratio (M‐H, Fixed, 95% CI) | 0.0 [0.0, 0.0] | |
| 6.4 Worst‐best scenario | 1 | Risk Ratio (M‐H, Fixed, 95% CI) | 0.0 [0.0, 0.0] | |
| 7 Surgical site infection (daptomycin and cefazolin versus cefazolin) Show forest plot | 1 | Risk Ratio (M‐H, Fixed, 95% CI) | Totals not selected | |
| 7.1 Best‐best scenario | 1 | Risk Ratio (M‐H, Fixed, 95% CI) | 0.0 [0.0, 0.0] | |
| 7.2 Worst‐worst scenario | 1 | Risk Ratio (M‐H, Fixed, 95% CI) | 0.0 [0.0, 0.0] | |
| 7.3 Best‐worst scenario | 1 | Risk Ratio (M‐H, Fixed, 95% CI) | 0.0 [0.0, 0.0] | |
| 7.4 Worst‐best scenario | 1 | Risk Ratio (M‐H, Fixed, 95% CI) | 0.0 [0.0, 0.0] | |
| 8 Surgical site infection (vancomycin versus cefuroxime) Show forest plot | 1 | Risk Ratio (M‐H, Fixed, 95% CI) | Totals not selected | |
| 8.1 Best‐best scenario | 1 | Risk Ratio (M‐H, Fixed, 95% CI) | 0.0 [0.0, 0.0] | |
| 8.2 Worst‐worst scenario | 1 | Risk Ratio (M‐H, Fixed, 95% CI) | 0.0 [0.0, 0.0] | |
| 8.3 Best‐worst scenario | 1 | Risk Ratio (M‐H, Fixed, 95% CI) | 0.0 [0.0, 0.0] | |
| 8.4 Worst‐best scenario | 1 | Risk Ratio (M‐H, Fixed, 95% CI) | 0.0 [0.0, 0.0] | |
| 9 MRSA surgical site infection (kanamycin, erythromycin and cefotiam versus cefotiam) Show forest plot | 1 | Risk Ratio (M‐H, Fixed, 95% CI) | Totals not selected | |
| 9.1 Best‐best scenario | 1 | Risk Ratio (M‐H, Fixed, 95% CI) | 0.0 [0.0, 0.0] | |
| 9.2 Worst‐worst scenario | 1 | Risk Ratio (M‐H, Fixed, 95% CI) | 0.0 [0.0, 0.0] | |
| 9.3 Best‐worst scenario | 1 | Risk Ratio (M‐H, Fixed, 95% CI) | 0.0 [0.0, 0.0] | |
| 9.4 Worst‐best scenario | 1 | Risk Ratio (M‐H, Fixed, 95% CI) | 0.0 [0.0, 0.0] | |
| 10 MRSA surgical site infection (vancomycin versus teicoplanin) Show forest plot | 1 | Risk Ratio (M‐H, Fixed, 95% CI) | Totals not selected | |
| 10.1 Best‐best scenario | 1 | Risk Ratio (M‐H, Fixed, 95% CI) | 0.0 [0.0, 0.0] | |
| 10.2 Worst‐worst scenario | 1 | Risk Ratio (M‐H, Fixed, 95% CI) | 0.0 [0.0, 0.0] | |
| 10.3 Best‐worst scenario | 1 | Risk Ratio (M‐H, Fixed, 95% CI) | 0.0 [0.0, 0.0] | |
| 10.4 Worst‐best scenario | 1 | Risk Ratio (M‐H, Fixed, 95% CI) | 0.0 [0.0, 0.0] | |
| 11 MRSA surgical site infection (vancomycin and cefazolin versus daptomycin and cefazolin) Show forest plot | 1 | Risk Ratio (M‐H, Fixed, 95% CI) | Totals not selected | |
| 11.1 Best‐best scenario | 1 | Risk Ratio (M‐H, Fixed, 95% CI) | 0.0 [0.0, 0.0] | |
| 11.2 Worst‐worst scenario | 1 | Risk Ratio (M‐H, Fixed, 95% CI) | 0.0 [0.0, 0.0] | |
| 11.3 Best‐worst scenario | 1 | Risk Ratio (M‐H, Fixed, 95% CI) | 0.0 [0.0, 0.0] | |
| 11.4 Worst‐best scenario | 1 | Risk Ratio (M‐H, Fixed, 95% CI) | 0.0 [0.0, 0.0] | |
| 12 MRSA surgical site infection (vancomycin and cefazolin versus cefazolin) Show forest plot | 1 | Risk Ratio (M‐H, Fixed, 95% CI) | Totals not selected | |
| 12.1 Best‐best scenario | 1 | Risk Ratio (M‐H, Fixed, 95% CI) | 0.0 [0.0, 0.0] | |
| 12.2 Worst‐worst scenario | 1 | Risk Ratio (M‐H, Fixed, 95% CI) | 0.0 [0.0, 0.0] | |
| 12.3 Best‐worst scenario | 1 | Risk Ratio (M‐H, Fixed, 95% CI) | 0.0 [0.0, 0.0] | |
| 12.4 Worst‐best scenario | 1 | Risk Ratio (M‐H, Fixed, 95% CI) | 0.0 [0.0, 0.0] | |
| 13 MRSA surgical site infection (daptomycin and cefazolin versus cefazolin) Show forest plot | 1 | Risk Ratio (M‐H, Fixed, 95% CI) | Totals not selected | |
| 13.1 Best‐best scenario | 1 | Risk Ratio (M‐H, Fixed, 95% CI) | 0.0 [0.0, 0.0] | |
| 13.2 Worst‐worst scenario | 1 | Risk Ratio (M‐H, Fixed, 95% CI) | 0.0 [0.0, 0.0] | |
| 13.3 Best‐worst scenario | 1 | Risk Ratio (M‐H, Fixed, 95% CI) | 0.0 [0.0, 0.0] | |
| 13.4 Worst‐best scenario | 1 | Risk Ratio (M‐H, Fixed, 95% CI) | 0.0 [0.0, 0.0] | |
| 14 MRSA surgical site infection (vancomycin versus cefuroxime) Show forest plot | 1 | Risk Ratio (M‐H, Fixed, 95% CI) | Totals not selected | |
| 14.1 Best‐best scenario | 1 | Risk Ratio (M‐H, Fixed, 95% CI) | 0.0 [0.0, 0.0] | |
| 14.2 Worst‐worst scenario | 1 | Risk Ratio (M‐H, Fixed, 95% CI) | 0.0 [0.0, 0.0] | |
| 14.3 Best‐worst scenario | 1 | Risk Ratio (M‐H, Fixed, 95% CI) | 0.0 [0.0, 0.0] | |
| 14.4 Worst‐best scenario | 1 | Risk Ratio (M‐H, Fixed, 95% CI) | 0.0 [0.0, 0.0] | |
| 15 Overall MRSA infections (kanamycin, erythromycin and cefotiam versus cefotiam) Show forest plot | 1 | Risk Ratio (M‐H, Fixed, 95% CI) | Totals not selected | |
| 15.1 Best‐best scenario | 1 | Risk Ratio (M‐H, Fixed, 95% CI) | 0.0 [0.0, 0.0] | |
| 15.2 Worst‐worst scenario | 1 | Risk Ratio (M‐H, Fixed, 95% CI) | 0.0 [0.0, 0.0] | |
| 15.3 Best‐worst scenario | 1 | Risk Ratio (M‐H, Fixed, 95% CI) | 0.0 [0.0, 0.0] | |
| 15.4 Worst‐best scenario | 1 | Risk Ratio (M‐H, Fixed, 95% CI) | 0.0 [0.0, 0.0] | |