Profilaxis con antibióticos para la prevención de complicaciones relacionadas con el Staphylococcus aureus resistente a la meticilina (SARM) en pacientes quirúrgicos
Información
- DOI:
- https://doi.org/10.1002/14651858.CD010268.pub2Copiar DOI

- Base de datos:
-
- Cochrane Database of Systematic Reviews
- Versión publicada:
-
- 19 agosto 2013see what's new
- Tipo:
-
- Intervention
- Etapa:
-
- Review
- Grupo Editorial Cochrane:
-
Grupo Cochrane de Heridas
- Copyright:
-
- Copyright © 2013 The Cochrane Collaboration. Published by John Wiley & Sons, Ltd.
Cifras del artículo
Altmetric:
Citado por:
Autores
Contributions of authors
KS Gurusamy: wrote the review, assessed the trials for inclusion and extracted data on included trials.
R Koti: independently assessed the trials for inclusion and extracted data on included trials.
P Wilson and BR Davidson: commented critically on the review and approved the review.
Contributions of editorial base
Nicky Cullum: edited the protocol; advised on methodology, interpretation and review content. Approved the review for submission.
Susan O'Meara: Editor: advised on methodology, interpretation and content.
Sally Bell‐Syer: co‐ordinated the editorial process. Advised on methodology, interpretation and content. Edited and copy edited the review.
Ruth Foxlee: designed the search strategy and edited the Search methods section.
Sources of support
Internal sources
-
No sources of support supplied
External sources
-
National Institute for Health Research, UK.
National Institute for Health Research, the health research wing of the UK Government Department of Health funds K Gurusamy to complete this review.
-
NIHR/Department of Health (England), (Cochrane Wounds Group), UK.
Declarations of interest
KS Gurusamy and BR Davidson are funded by a joint funding scheme between Department of Health and Wellcome Trust on a completely unrelated project.
R Koti: none known.
APR Wilson is a consultant microbiologist in the NHS advising on antibiotic use and advises some private hospitals on infection control. He is a member of a clinical trial drug safety monitoring board for a monoclonal antibody. He has been an expert witness in infection‐related cases. He has a number of non‐commercial grants for research in the area of transmission of infection. APR Wilson was part‐funded by the UCLH/UCL Comprehensive Biomedical Centre with funding from the Department of Health's NIHR Biomedical Research Centres.
This project was funded by the National Institute for Health Research (NIHR).
Disclaimer
Department of Health disclaimer: The views and opinions expressed therein are those of the authors and do not necessarily reflect those of the NIHR, NHS (National Health Service), or the Department of Health.
Acknowledgements
The authors would like to acknowledge the contribution of the peer referees, Wounds Group Editors (Julie Bruce) and referees (Caroline Main; Richard Kirubakaran; Jo Sutton) and copy editors Elizabeth Royle and Heather Maxwell.
Version history
| Published | Title | Stage | Authors | Version |
| 2013 Aug 19 | Antibiotic prophylaxis for the prevention of methicillin‐resistant Staphylococcus aureus (MRSA) related complications in surgical patients | Review | Kurinchi Selvan Gurusamy, Rahul Koti, Peter Wilson, Brian R Davidson | |
| 2012 Dec 12 | Antibiotic prophylaxis for the prevention of Methicillin resistant Staphylococcus aureus (MRSA) infections and related complications in surgical patients | Protocol | Kurinchi Selvan Gurusamy, Peter Wilson, Brian R Davidson | |
Differences between protocol and review
Peto's odds ratios were used for outcomes with a proportion of less than 1% events.
MRSA overall infections was included as a secondary outcome, since the antibiotics act on MRSA at any site rather than on the surgical wounds alone.
Keywords
MeSH
Medical Subject Headings (MeSH) Keywords
- Amoxicillin-Potassium Clavulanate Combination [therapeutic use];
- Anti-Bacterial Agents [adverse effects, *therapeutic use];
- *Antibiotic Prophylaxis [adverse effects];
- Carrier State [microbiology];
- Cefotaxime [therapeutic use];
- *Methicillin-Resistant Staphylococcus aureus;
- Postoperative Complications [microbiology, prevention & control];
- Randomized Controlled Trials as Topic;
- Staphylococcal Infections [microbiology, *prevention & control];
- Surgical Wound Infection [microbiology, *prevention & control];
Medical Subject Headings Check Words
Humans;

Study flow diagram.

Risk of bias graph: review authors' judgements about each risk of bias item presented as percentages across all included studies

Risk of bias summary: review authors' judgements about each risk of bias item for each included study
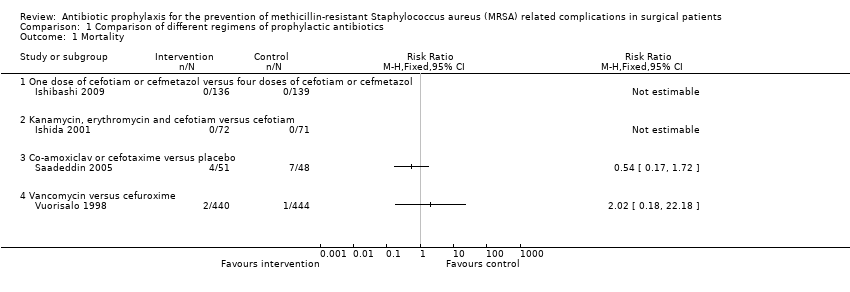
Comparison 1 Comparison of different regimens of prophylactic antibiotics, Outcome 1 Mortality.
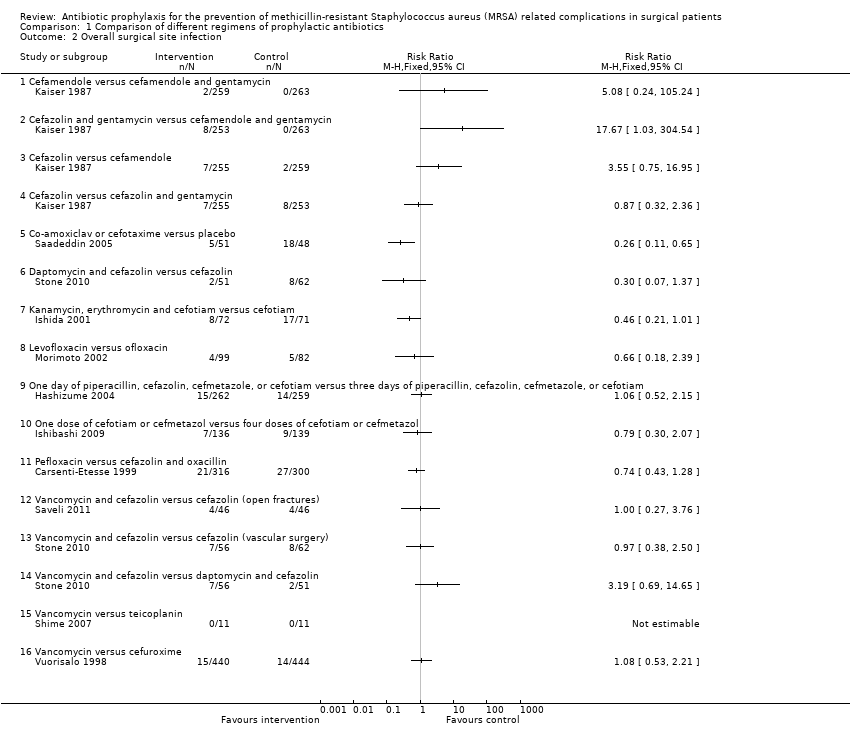
Comparison 1 Comparison of different regimens of prophylactic antibiotics, Outcome 2 Overall surgical site infection.

Comparison 1 Comparison of different regimens of prophylactic antibiotics, Outcome 3 MRSA surgical site infection.
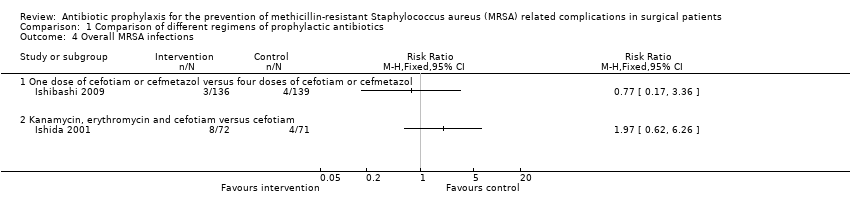
Comparison 1 Comparison of different regimens of prophylactic antibiotics, Outcome 4 Overall MRSA infections.

Comparison 2 Sensitivity analysis, Outcome 1 Mortality (kanamycin, erythromycin and cefotiam versus cefotiam).

Comparison 2 Sensitivity analysis, Outcome 2 Mortality (vancomycin versus cefuroxime).

Comparison 2 Sensitivity analysis, Outcome 3 Surgical site infection (kanamycin, erythromycin and cefotiam versus cefotiam).
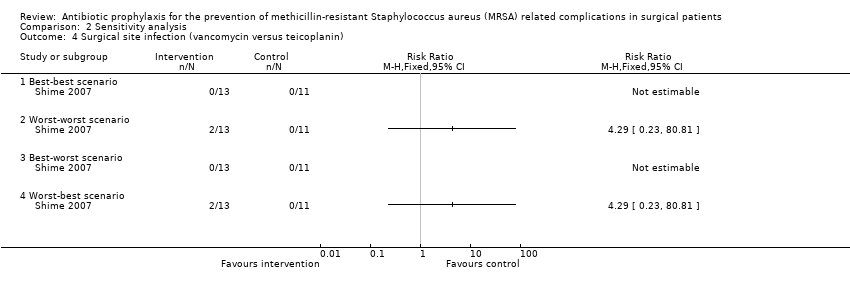
Comparison 2 Sensitivity analysis, Outcome 4 Surgical site infection (vancomycin versus teicoplanin).

Comparison 2 Sensitivity analysis, Outcome 5 Surgical site infection (vancomycin and cefazolin versus daptomycin and cefazolin).
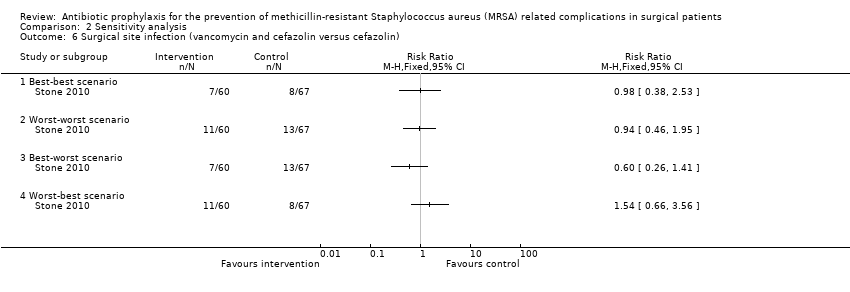
Comparison 2 Sensitivity analysis, Outcome 6 Surgical site infection (vancomycin and cefazolin versus cefazolin).

Comparison 2 Sensitivity analysis, Outcome 7 Surgical site infection (daptomycin and cefazolin versus cefazolin).

Comparison 2 Sensitivity analysis, Outcome 8 Surgical site infection (vancomycin versus cefuroxime).

Comparison 2 Sensitivity analysis, Outcome 9 MRSA surgical site infection (kanamycin, erythromycin and cefotiam versus cefotiam).
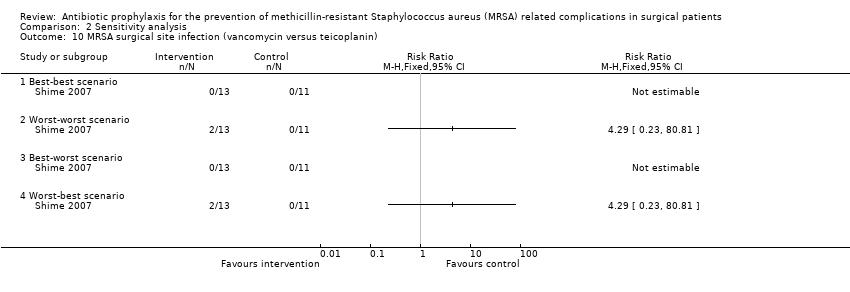
Comparison 2 Sensitivity analysis, Outcome 10 MRSA surgical site infection (vancomycin versus teicoplanin).
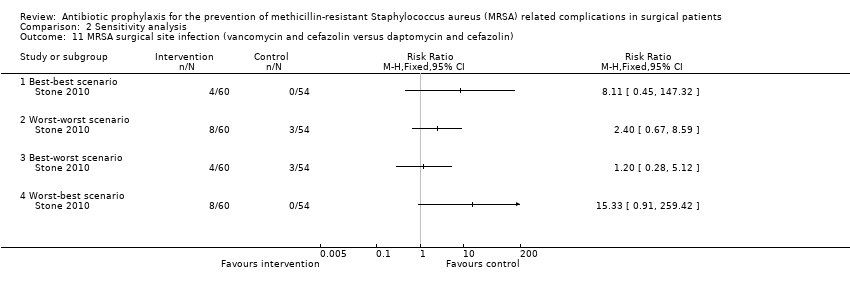
Comparison 2 Sensitivity analysis, Outcome 11 MRSA surgical site infection (vancomycin and cefazolin versus daptomycin and cefazolin).

Comparison 2 Sensitivity analysis, Outcome 12 MRSA surgical site infection (vancomycin and cefazolin versus cefazolin).
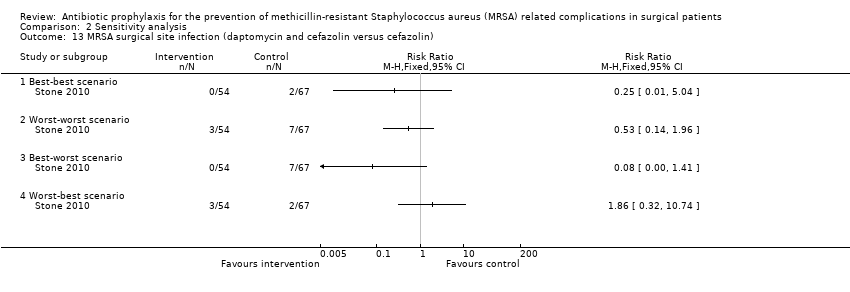
Comparison 2 Sensitivity analysis, Outcome 13 MRSA surgical site infection (daptomycin and cefazolin versus cefazolin).

Comparison 2 Sensitivity analysis, Outcome 14 MRSA surgical site infection (vancomycin versus cefuroxime).
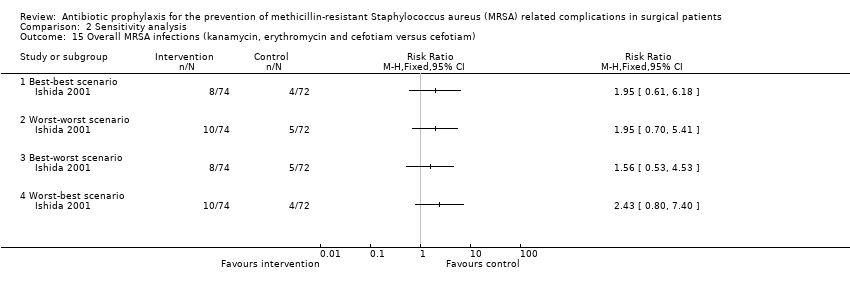
Comparison 2 Sensitivity analysis, Outcome 15 Overall MRSA infections (kanamycin, erythromycin and cefotiam versus cefotiam).
| Mortality | |||||
| Patient or population: surgical patients | |||||
| Comparisons | Illustrative comparative risks* (95% CI) | Relative effect | No of Participants | Quality of the evidence | |
| Assumed risk | Corresponding risk | ||||
| Control | Comparison of different regimens of prophylactic antibiotic regimens | ||||
| One dose of cefotiam or cefmetazol versus four doses of cefotiam or cefmetazol (elective surgery for colon cancer) | See comment | See comment | Not estimable | 275 | ⊕⊝⊝⊝ |
| Kanamycin, erythromycin and cefotiam versus cefotiam (surgery for colorectal diseases) | See comment | See comment | Not estimable | 143 | ⊕⊝⊝⊝ |
| Co‐amoxiclav or cefotaxime versus placebo (percutaneous endoscopic gastrostomy) | 146 per 1000 | 79 per 1000 | RR 0.54 | 99 | ⊕⊝⊝⊝ |
| Vancomycin versus cefuroxime (coronary artery bypass graft without valvular disease) | 2 per 1000 | 5 per 1000 | RR 2.02 | 884 | ⊕⊝⊝⊝ |
| *The basis for the assumed risk is the control group risk in the study. The corresponding risk (and its 95% confidence interval) is based on the assumed risk in the comparison group and the relative effect of the intervention (and its 95% CI). | |||||
| GRADE Working Group grades of evidence: | |||||
| 1 The risk of bias in the trial was high | |||||
| Surgical site infection | |||||
| Patient or population: surgical patients | |||||
| Comparisons | Illustrative comparative risks* (95% CI) | Relative effect | No of Participants | Quality of the evidence | |
| Assumed risk | Corresponding risk | ||||
| Control | Comparison of different regimens of prophylactic antibiotic regimens | ||||
| Cefamendole versus cefamendole and gentamycin (median sternotomy) | Moderate | RR 5.08 | 522 | ⊕⊝⊝⊝ | |
| 5 per 1000 | 25 per 1000 | ||||
| Cefazolin versus cefamendole (median sternotomy) | 8 per 1000 | 27 per 1000 | RR 3.55 | 514 | ⊕⊝⊝⊝ |
| Cefazolin versus cefazolin and gentamycin (median sternotomy) | 32 per 1000 | 28 per 1000 | RR 0.87 | 508 | ⊕⊝⊝⊝ |
| Co‐amoxiclav or cefotaxime versus placebo (percutaneous endoscopic gastrostomy) | 375 per 1000 | 98 per 1000 | RR 0.26 | 99 | ⊕⊕⊝⊝ |
| Daptomycin and cefazolin versus cefazolin (vascular surgery) | 129 per 1000 | 39 per 1000 | RR 0.3 | 113 | ⊕⊝⊝⊝ |
| Kanamycin, erythromycin and cefotiam versus cefotiam (surgery for colorectal diseases) | 239 per 1000 | 110 per 1000 | RR 0.46 | 143 | ⊕⊝⊝⊝ |
| Levofloxacin versus ofloxacin (breast cancer) | 61 per 1000 | 40 per 1000 | RR 0.66 | 181 | ⊕⊝⊝⊝ |
| One day of piperacillin, cefazolin, cefmetazole, or cefotiam versus three days of piperacillin, cefazolin, cefmetazole, or cefotiam (elective colorectal surgery) | 54 per 1000 | 57 per 1000 | RR 1.06 | 521 | ⊕⊝⊝⊝ |
| One dose of cefotiam or cefmetazol versus four doses of cefotiam or cefmetazol (elective surgery for colon cancer) | 65 per 1000 | 51 per 1000 | RR 0.79 | 275 | ⊕⊝⊝⊝ |
| Pefloxacin versus cefazolin and oxacillin (tibial fracture requiring external fixation) | 90 per 1000 | 67 per 1000 | RR 0.74 | 616 | ⊕⊝⊝⊝ |
| Vancomycin and cefazolin versus cefazolin (open fractures) | 87 per 1000 | 87 per 1000 | RR 1 | 92 | ⊕⊝⊝⊝ |
| Vancomycin and cefazolin versus cefazolin (vascular surgery) ‐ suggest add for all comparisons | 129 per 1000 | 125 per 1000 | RR 0.97 | 118 | ⊕⊝⊝⊝ |
| Vancomycin and cefazolin versus daptomycin and cefazolin (vascular surgery) | 39 per 1000 | 125 per 1000 | RR 3.19 | 107 | ⊕⊝⊝⊝ |
| Vancomycin versus teicoplanin (paediatric cardiac surgery) | No infection in either group | Not estimable | 22 | ⊕⊝⊝⊝ | |
| Vancomycin versus cefuroxime (coronary artery bypass graft without valvular disease) | 32 per 1000 | 34 per 1000 | RR 1.08 | 884 | ⊕⊝⊝⊝ |
| *The basis for the assumed risk is the control group risk in the study. When there were no events in either group, we have indicated so. When there were events in the intervention group but not in the control group, we have used a moderate proportion of 0.5% in the control group. The corresponding risk (and its 95% confidence interval) is based on the assumed risk in the comparison group and the relative effect of the intervention (and its 95% CI). | |||||
| GRADE Working Group grades of evidence: | |||||
| 1 The risk of bias in the trial was high | |||||
| MRSA surgical site infection | |||||
| Patient or population: surgical patients | |||||
| Comparisons | Illustrative comparative risks* (95% CI) | Relative effect | No of Participants | Quality of the evidence | |
| Assumed risk | Corresponding risk | ||||
| Control | Comparison of different regimens of prophylactic antibiotic regimens | ||||
| Cefamendole versus cefamendole and gentamycin (median sternotomy) | No infection in either group | Not estimable | 522 | ⊕⊝⊝⊝ | |
| Cefazolin and gentamycin versus cefamendole and gentamycin (median sternotomy) | No infection in either group | Not estimable | 516 | ⊕⊝⊝⊝ | |
| Cefazolin versus cefamendole (median sternotomy) | Moderate | RR 3.05 | 514 | ⊕⊝⊝⊝ | |
| 5 per 1000 | 15 per 1000 | ||||
| Cefazolin versus cefazolin and gentamycin (median sternotomy) | Moderate | RR 2.98 | 508 | ⊕⊝⊝⊝ | |
| 5 per 1000 | 15 per 1000 | ||||
| Co‐amoxiclav or cefotaxime versus placebo (percutaneous endoscopic gastrostomy) | 188 per 1000 | 9 per 1000 | RR 0.05 | 99 | ⊕⊕⊝⊝ |
| Daptomycin and cefazolin versus cefazolin (vascular surgery) | 32 per 1000 | 8 per 1000 | RR 0.24 | 113 | ⊕⊝⊝⊝ |
| Ertapenem versus cefotetan (elective colorectal surgery) | 15 per 1000 | 9 per 1000 | RR 0.59 | 672 | ⊕⊝⊝⊝ |
| Kanamycin, erythromycin and cefotiam versus cefotiam (surgery for colorectal diseases) | 28 per 1000 | 55 per 1000 | RR 1.97 | 143 | ⊕⊝⊝⊝ |
| Levofloxacin versus ofloxacin (breast cancer) | No infection in either group | Not estimable | 181 | ⊕⊝⊝⊝ | |
| One day of piperacillin, cefazolin, cefmetazole, or cefotiam versus three days of piperacillin, cefazolin, cefmetazole, or cefotiam (elective colorectal surgery) | No infection in either group | Not estimable | 521 | ⊕⊝⊝⊝ | |
| One dose of cefotiam or cefmetazol versus four doses of cefotiam or cefmetazol (elective surgery for colon cancer) | 22 per 1000 | 22 per 1000 | RR 1.02 | 275 | ⊕⊝⊝⊝ |
| Pefloxacin versus cefazolin and oxacillin (tibial fracture requiring external fixation) | 3 per 1000 | 13 per 1000 | RR 3.8 | 616 | ⊕⊝⊝⊝ |
| Vancomycin and cefazolin versus cefazolin (open fractures) | Moderate | RR 3 | 92 | ⊕⊝⊝⊝ | |
| 5 per 1000 | 15 per 1000 | ||||
| Vancomycin and cefazolin versus cefazolin (vascular surgery) | 32 per 1000 | 71 per 1000 | RR 2.21 | 118 | ⊕⊝⊝⊝ |
| Vancomycin and cefazolin versus daptomycin and cefazolin (vascular surgery) | Moderate | RR 8.21 | 107 | ⊕⊝⊝⊝ | |
| 5 per 1000 | 41 per 1000 | ||||
| Vancomycin versus teicoplanin (paediatric cardiac surgery) | No infection in either group | Not estimable | 22 | ⊕⊝⊝⊝ | |
| Vancomycin versus cefuroxime (coronary artery bypass graft without valvular disease) | 5 per 1000 | 5 per 1000 | RR 1.01 | 884 | ⊕⊝⊝⊝ |
| *The basis for the assumed risk is the control group risk in the study. When there were no events in either group, we have indicated so. When there were events in the intervention group but not in the control group, we have used a moderate proportion of 0.5% in the control group. The corresponding risk (and its 95% confidence interval) is based on the assumed risk in the comparison group and the relative effect of the intervention (and its 95% CI). | |||||
| GRADE Working Group grades of evidence: | |||||
| 1 The risk of bias in the trial was high | |||||
| Overall MRSA infections | |||||
| Patient or population: surgical patients | |||||
| Comparisons | Illustrative comparative risks* (95% CI) | Relative effect | No of Participants | Quality of the evidence | |
| Assumed risk | Corresponding risk | ||||
| Control | Comparison of different regimens of prophylactic antibiotic regimens | ||||
| One dose of cefotiam or cefmetazol versus four doses of cefotiam or cefmetazol (elective surgery for colon cancer) | 29 per 1000 | 22 per 1000 | RR 0.77 | 275 | ⊕⊝⊝⊝ |
| Kanamycin, erythromycin and cefotiam versus cefotiam (surgery for colorectal diseases) | 56 per 1000 | 111 per 1000 | RR 1.97 | 143 | ⊕⊝⊝⊝ |
| *The basis for the assumed risk is the control group risk in the study. The corresponding risk (and its 95% confidence interval) is based on the assumed risk in the comparison group and the relative effect of the intervention (and its 95% CI). | |||||
| GRADE Working Group grades of evidence: | |||||
| 1 The risk of bias in the trial was high. | |||||
| Outcome or subgroup title | No. of studies | No. of participants | Statistical method | Effect size |
| 1 Mortality Show forest plot | 4 | Risk Ratio (M‐H, Fixed, 95% CI) | Totals not selected | |
| 1.1 One dose of cefotiam or cefmetazol versus four doses of cefotiam or cefmetazol | 1 | Risk Ratio (M‐H, Fixed, 95% CI) | 0.0 [0.0, 0.0] | |
| 1.2 Kanamycin, erythromycin and cefotiam versus cefotiam | 1 | Risk Ratio (M‐H, Fixed, 95% CI) | 0.0 [0.0, 0.0] | |
| 1.3 Co‐amoxiclav or cefotaxime versus placebo | 1 | Risk Ratio (M‐H, Fixed, 95% CI) | 0.0 [0.0, 0.0] | |
| 1.4 Vancomycin versus cefuroxime | 1 | Risk Ratio (M‐H, Fixed, 95% CI) | 0.0 [0.0, 0.0] | |
| 2 Overall surgical site infection Show forest plot | 11 | Risk Ratio (M‐H, Fixed, 95% CI) | Totals not selected | |
| 2.1 Cefamendole versus cefamendole and gentamycin | 1 | Risk Ratio (M‐H, Fixed, 95% CI) | 0.0 [0.0, 0.0] | |
| 2.2 Cefazolin and gentamycin versus cefamendole and gentamycin | 1 | Risk Ratio (M‐H, Fixed, 95% CI) | 0.0 [0.0, 0.0] | |
| 2.3 Cefazolin versus cefamendole | 1 | Risk Ratio (M‐H, Fixed, 95% CI) | 0.0 [0.0, 0.0] | |
| 2.4 Cefazolin versus cefazolin and gentamycin | 1 | Risk Ratio (M‐H, Fixed, 95% CI) | 0.0 [0.0, 0.0] | |
| 2.5 Co‐amoxiclav or cefotaxime versus placebo | 1 | Risk Ratio (M‐H, Fixed, 95% CI) | 0.0 [0.0, 0.0] | |
| 2.6 Daptomycin and cefazolin versus cefazolin | 1 | Risk Ratio (M‐H, Fixed, 95% CI) | 0.0 [0.0, 0.0] | |
| 2.7 Kanamycin, erythromycin and cefotiam versus cefotiam | 1 | Risk Ratio (M‐H, Fixed, 95% CI) | 0.0 [0.0, 0.0] | |
| 2.8 Levofloxacin versus ofloxacin | 1 | Risk Ratio (M‐H, Fixed, 95% CI) | 0.0 [0.0, 0.0] | |
| 2.9 One day of piperacillin, cefazolin, cefmetazole, or cefotiam versus three days of piperacillin, cefazolin, cefmetazole, or cefotiam | 1 | Risk Ratio (M‐H, Fixed, 95% CI) | 0.0 [0.0, 0.0] | |
| 2.10 One dose of cefotiam or cefmetazol versus four doses of cefotiam or cefmetazol | 1 | Risk Ratio (M‐H, Fixed, 95% CI) | 0.0 [0.0, 0.0] | |
| 2.11 Pefloxacin versus cefazolin and oxacillin | 1 | Risk Ratio (M‐H, Fixed, 95% CI) | 0.0 [0.0, 0.0] | |
| 2.12 Vancomycin and cefazolin versus cefazolin (open fractures) | 1 | Risk Ratio (M‐H, Fixed, 95% CI) | 0.0 [0.0, 0.0] | |
| 2.13 Vancomycin and cefazolin versus cefazolin (vascular surgery) | 1 | Risk Ratio (M‐H, Fixed, 95% CI) | 0.0 [0.0, 0.0] | |
| 2.14 Vancomycin and cefazolin versus daptomycin and cefazolin | 1 | Risk Ratio (M‐H, Fixed, 95% CI) | 0.0 [0.0, 0.0] | |
| 2.15 Vancomycin versus teicoplanin | 1 | Risk Ratio (M‐H, Fixed, 95% CI) | 0.0 [0.0, 0.0] | |
| 2.16 Vancomycin versus cefuroxime | 1 | Risk Ratio (M‐H, Fixed, 95% CI) | 0.0 [0.0, 0.0] | |
| 3 MRSA surgical site infection Show forest plot | 12 | Risk Ratio (M‐H, Fixed, 95% CI) | Totals not selected | |
| 3.1 Cefamendole versus cefamendole and gentamycin | 1 | Risk Ratio (M‐H, Fixed, 95% CI) | 0.0 [0.0, 0.0] | |
| 3.2 Cefazolin and gentamycin versus cefamendole and gentamycin | 1 | Risk Ratio (M‐H, Fixed, 95% CI) | 0.0 [0.0, 0.0] | |
| 3.3 Cefazolin versus cefamendole | 1 | Risk Ratio (M‐H, Fixed, 95% CI) | 0.0 [0.0, 0.0] | |
| 3.4 Cefazolin versus cefazolin and gentamycin | 1 | Risk Ratio (M‐H, Fixed, 95% CI) | 0.0 [0.0, 0.0] | |
| 3.5 Co‐amoxiclav or cefotaxime versus placebo | 1 | Risk Ratio (M‐H, Fixed, 95% CI) | 0.0 [0.0, 0.0] | |
| 3.6 Daptomycin and cefazolin versus cefazolin | 1 | Risk Ratio (M‐H, Fixed, 95% CI) | 0.0 [0.0, 0.0] | |
| 3.7 Ertapenem versus cefotetan | 1 | Risk Ratio (M‐H, Fixed, 95% CI) | 0.0 [0.0, 0.0] | |
| 3.8 Kanamycin, erythromycin and cefotiam versus cefotiam | 1 | Risk Ratio (M‐H, Fixed, 95% CI) | 0.0 [0.0, 0.0] | |
| 3.9 Levofloxacin versus ofloxacin | 1 | Risk Ratio (M‐H, Fixed, 95% CI) | 0.0 [0.0, 0.0] | |
| 3.10 One day of piperacillin, cefazolin, cefmetazole, or cefotiam versus three days of piperacillin, cefazolin, cefmetazole, or cefotiam | 1 | Risk Ratio (M‐H, Fixed, 95% CI) | 0.0 [0.0, 0.0] | |
| 3.11 One dose of cefotiam or cefmetazol versus four doses of cefotiam or cefmetazol | 1 | Risk Ratio (M‐H, Fixed, 95% CI) | 0.0 [0.0, 0.0] | |
| 3.12 Pefloxacin versus cefazolin and oxacillin | 1 | Risk Ratio (M‐H, Fixed, 95% CI) | 0.0 [0.0, 0.0] | |
| 3.13 Vancomycin and cefazolin versus cefazolin (open fractures) | 1 | Risk Ratio (M‐H, Fixed, 95% CI) | 0.0 [0.0, 0.0] | |
| 3.14 Vancomycin and cefazolin versus cefazolin (vascular surgery) | 1 | Risk Ratio (M‐H, Fixed, 95% CI) | 0.0 [0.0, 0.0] | |
| 3.15 Vancomycin and cefazolin versus daptomycin and cefazolin | 1 | Risk Ratio (M‐H, Fixed, 95% CI) | 0.0 [0.0, 0.0] | |
| 3.16 Vancomycin versus teicoplanin | 1 | Risk Ratio (M‐H, Fixed, 95% CI) | 0.0 [0.0, 0.0] | |
| 3.17 Vancomycin versus cefuroxime | 1 | Risk Ratio (M‐H, Fixed, 95% CI) | 0.0 [0.0, 0.0] | |
| 4 Overall MRSA infections Show forest plot | 2 | Risk Ratio (M‐H, Fixed, 95% CI) | Totals not selected | |
| 4.1 One dose of cefotiam or cefmetazol versus four doses of cefotiam or cefmetazol | 1 | Risk Ratio (M‐H, Fixed, 95% CI) | 0.0 [0.0, 0.0] | |
| 4.2 Kanamycin, erythromycin and cefotiam versus cefotiam | 1 | Risk Ratio (M‐H, Fixed, 95% CI) | 0.0 [0.0, 0.0] | |
| Outcome or subgroup title | No. of studies | No. of participants | Statistical method | Effect size |
| 1 Mortality (kanamycin, erythromycin and cefotiam versus cefotiam) Show forest plot | 1 | Risk Ratio (M‐H, Fixed, 95% CI) | Totals not selected | |
| 1.1 Best‐best scenario | 1 | Risk Ratio (M‐H, Fixed, 95% CI) | 0.0 [0.0, 0.0] | |
| 1.2 Worst‐worst scenario | 1 | Risk Ratio (M‐H, Fixed, 95% CI) | 0.0 [0.0, 0.0] | |
| 1.3 Best‐worst scenario | 1 | Risk Ratio (M‐H, Fixed, 95% CI) | 0.0 [0.0, 0.0] | |
| 1.4 Worst‐best scenario | 1 | Risk Ratio (M‐H, Fixed, 95% CI) | 0.0 [0.0, 0.0] | |
| 2 Mortality (vancomycin versus cefuroxime) Show forest plot | 1 | Risk Ratio (M‐H, Fixed, 95% CI) | Totals not selected | |
| 2.1 Best‐best scenario | 1 | Risk Ratio (M‐H, Fixed, 95% CI) | 0.0 [0.0, 0.0] | |
| 2.2 Worst‐worst scenario | 1 | Risk Ratio (M‐H, Fixed, 95% CI) | 0.0 [0.0, 0.0] | |
| 2.3 Best‐worst scenario | 1 | Risk Ratio (M‐H, Fixed, 95% CI) | 0.0 [0.0, 0.0] | |
| 2.4 Worst‐best scenario | 1 | Risk Ratio (M‐H, Fixed, 95% CI) | 0.0 [0.0, 0.0] | |
| 3 Surgical site infection (kanamycin, erythromycin and cefotiam versus cefotiam) Show forest plot | 1 | Risk Ratio (M‐H, Fixed, 95% CI) | Totals not selected | |
| 3.1 Best‐best scenario | 1 | Risk Ratio (M‐H, Fixed, 95% CI) | 0.0 [0.0, 0.0] | |
| 3.2 Worst‐worst scenario | 1 | Risk Ratio (M‐H, Fixed, 95% CI) | 0.0 [0.0, 0.0] | |
| 3.3 Best‐worst scenario | 1 | Risk Ratio (M‐H, Fixed, 95% CI) | 0.0 [0.0, 0.0] | |
| 3.4 Worst‐best scenario | 1 | Risk Ratio (M‐H, Fixed, 95% CI) | 0.0 [0.0, 0.0] | |
| 4 Surgical site infection (vancomycin versus teicoplanin) Show forest plot | 1 | Risk Ratio (M‐H, Fixed, 95% CI) | Totals not selected | |
| 4.1 Best‐best scenario | 1 | Risk Ratio (M‐H, Fixed, 95% CI) | 0.0 [0.0, 0.0] | |
| 4.2 Worst‐worst scenario | 1 | Risk Ratio (M‐H, Fixed, 95% CI) | 0.0 [0.0, 0.0] | |
| 4.3 Best‐worst scenario | 1 | Risk Ratio (M‐H, Fixed, 95% CI) | 0.0 [0.0, 0.0] | |
| 4.4 Worst‐best scenario | 1 | Risk Ratio (M‐H, Fixed, 95% CI) | 0.0 [0.0, 0.0] | |
| 5 Surgical site infection (vancomycin and cefazolin versus daptomycin and cefazolin) Show forest plot | 1 | Risk Ratio (M‐H, Fixed, 95% CI) | Totals not selected | |
| 5.1 Best‐best scenario | 1 | Risk Ratio (M‐H, Fixed, 95% CI) | 0.0 [0.0, 0.0] | |
| 5.2 Worst‐worst scenario | 1 | Risk Ratio (M‐H, Fixed, 95% CI) | 0.0 [0.0, 0.0] | |
| 5.3 Best‐worst scenario | 1 | Risk Ratio (M‐H, Fixed, 95% CI) | 0.0 [0.0, 0.0] | |
| 5.4 Worst‐best scenario | 1 | Risk Ratio (M‐H, Fixed, 95% CI) | 0.0 [0.0, 0.0] | |
| 6 Surgical site infection (vancomycin and cefazolin versus cefazolin) Show forest plot | 1 | Risk Ratio (M‐H, Fixed, 95% CI) | Totals not selected | |
| 6.1 Best‐best scenario | 1 | Risk Ratio (M‐H, Fixed, 95% CI) | 0.0 [0.0, 0.0] | |
| 6.2 Worst‐worst scenario | 1 | Risk Ratio (M‐H, Fixed, 95% CI) | 0.0 [0.0, 0.0] | |
| 6.3 Best‐worst scenario | 1 | Risk Ratio (M‐H, Fixed, 95% CI) | 0.0 [0.0, 0.0] | |
| 6.4 Worst‐best scenario | 1 | Risk Ratio (M‐H, Fixed, 95% CI) | 0.0 [0.0, 0.0] | |
| 7 Surgical site infection (daptomycin and cefazolin versus cefazolin) Show forest plot | 1 | Risk Ratio (M‐H, Fixed, 95% CI) | Totals not selected | |
| 7.1 Best‐best scenario | 1 | Risk Ratio (M‐H, Fixed, 95% CI) | 0.0 [0.0, 0.0] | |
| 7.2 Worst‐worst scenario | 1 | Risk Ratio (M‐H, Fixed, 95% CI) | 0.0 [0.0, 0.0] | |
| 7.3 Best‐worst scenario | 1 | Risk Ratio (M‐H, Fixed, 95% CI) | 0.0 [0.0, 0.0] | |
| 7.4 Worst‐best scenario | 1 | Risk Ratio (M‐H, Fixed, 95% CI) | 0.0 [0.0, 0.0] | |
| 8 Surgical site infection (vancomycin versus cefuroxime) Show forest plot | 1 | Risk Ratio (M‐H, Fixed, 95% CI) | Totals not selected | |
| 8.1 Best‐best scenario | 1 | Risk Ratio (M‐H, Fixed, 95% CI) | 0.0 [0.0, 0.0] | |
| 8.2 Worst‐worst scenario | 1 | Risk Ratio (M‐H, Fixed, 95% CI) | 0.0 [0.0, 0.0] | |
| 8.3 Best‐worst scenario | 1 | Risk Ratio (M‐H, Fixed, 95% CI) | 0.0 [0.0, 0.0] | |
| 8.4 Worst‐best scenario | 1 | Risk Ratio (M‐H, Fixed, 95% CI) | 0.0 [0.0, 0.0] | |
| 9 MRSA surgical site infection (kanamycin, erythromycin and cefotiam versus cefotiam) Show forest plot | 1 | Risk Ratio (M‐H, Fixed, 95% CI) | Totals not selected | |
| 9.1 Best‐best scenario | 1 | Risk Ratio (M‐H, Fixed, 95% CI) | 0.0 [0.0, 0.0] | |
| 9.2 Worst‐worst scenario | 1 | Risk Ratio (M‐H, Fixed, 95% CI) | 0.0 [0.0, 0.0] | |
| 9.3 Best‐worst scenario | 1 | Risk Ratio (M‐H, Fixed, 95% CI) | 0.0 [0.0, 0.0] | |
| 9.4 Worst‐best scenario | 1 | Risk Ratio (M‐H, Fixed, 95% CI) | 0.0 [0.0, 0.0] | |
| 10 MRSA surgical site infection (vancomycin versus teicoplanin) Show forest plot | 1 | Risk Ratio (M‐H, Fixed, 95% CI) | Totals not selected | |
| 10.1 Best‐best scenario | 1 | Risk Ratio (M‐H, Fixed, 95% CI) | 0.0 [0.0, 0.0] | |
| 10.2 Worst‐worst scenario | 1 | Risk Ratio (M‐H, Fixed, 95% CI) | 0.0 [0.0, 0.0] | |
| 10.3 Best‐worst scenario | 1 | Risk Ratio (M‐H, Fixed, 95% CI) | 0.0 [0.0, 0.0] | |
| 10.4 Worst‐best scenario | 1 | Risk Ratio (M‐H, Fixed, 95% CI) | 0.0 [0.0, 0.0] | |
| 11 MRSA surgical site infection (vancomycin and cefazolin versus daptomycin and cefazolin) Show forest plot | 1 | Risk Ratio (M‐H, Fixed, 95% CI) | Totals not selected | |
| 11.1 Best‐best scenario | 1 | Risk Ratio (M‐H, Fixed, 95% CI) | 0.0 [0.0, 0.0] | |
| 11.2 Worst‐worst scenario | 1 | Risk Ratio (M‐H, Fixed, 95% CI) | 0.0 [0.0, 0.0] | |
| 11.3 Best‐worst scenario | 1 | Risk Ratio (M‐H, Fixed, 95% CI) | 0.0 [0.0, 0.0] | |
| 11.4 Worst‐best scenario | 1 | Risk Ratio (M‐H, Fixed, 95% CI) | 0.0 [0.0, 0.0] | |
| 12 MRSA surgical site infection (vancomycin and cefazolin versus cefazolin) Show forest plot | 1 | Risk Ratio (M‐H, Fixed, 95% CI) | Totals not selected | |
| 12.1 Best‐best scenario | 1 | Risk Ratio (M‐H, Fixed, 95% CI) | 0.0 [0.0, 0.0] | |
| 12.2 Worst‐worst scenario | 1 | Risk Ratio (M‐H, Fixed, 95% CI) | 0.0 [0.0, 0.0] | |
| 12.3 Best‐worst scenario | 1 | Risk Ratio (M‐H, Fixed, 95% CI) | 0.0 [0.0, 0.0] | |
| 12.4 Worst‐best scenario | 1 | Risk Ratio (M‐H, Fixed, 95% CI) | 0.0 [0.0, 0.0] | |
| 13 MRSA surgical site infection (daptomycin and cefazolin versus cefazolin) Show forest plot | 1 | Risk Ratio (M‐H, Fixed, 95% CI) | Totals not selected | |
| 13.1 Best‐best scenario | 1 | Risk Ratio (M‐H, Fixed, 95% CI) | 0.0 [0.0, 0.0] | |
| 13.2 Worst‐worst scenario | 1 | Risk Ratio (M‐H, Fixed, 95% CI) | 0.0 [0.0, 0.0] | |
| 13.3 Best‐worst scenario | 1 | Risk Ratio (M‐H, Fixed, 95% CI) | 0.0 [0.0, 0.0] | |
| 13.4 Worst‐best scenario | 1 | Risk Ratio (M‐H, Fixed, 95% CI) | 0.0 [0.0, 0.0] | |
| 14 MRSA surgical site infection (vancomycin versus cefuroxime) Show forest plot | 1 | Risk Ratio (M‐H, Fixed, 95% CI) | Totals not selected | |
| 14.1 Best‐best scenario | 1 | Risk Ratio (M‐H, Fixed, 95% CI) | 0.0 [0.0, 0.0] | |
| 14.2 Worst‐worst scenario | 1 | Risk Ratio (M‐H, Fixed, 95% CI) | 0.0 [0.0, 0.0] | |
| 14.3 Best‐worst scenario | 1 | Risk Ratio (M‐H, Fixed, 95% CI) | 0.0 [0.0, 0.0] | |
| 14.4 Worst‐best scenario | 1 | Risk Ratio (M‐H, Fixed, 95% CI) | 0.0 [0.0, 0.0] | |
| 15 Overall MRSA infections (kanamycin, erythromycin and cefotiam versus cefotiam) Show forest plot | 1 | Risk Ratio (M‐H, Fixed, 95% CI) | Totals not selected | |
| 15.1 Best‐best scenario | 1 | Risk Ratio (M‐H, Fixed, 95% CI) | 0.0 [0.0, 0.0] | |
| 15.2 Worst‐worst scenario | 1 | Risk Ratio (M‐H, Fixed, 95% CI) | 0.0 [0.0, 0.0] | |
| 15.3 Best‐worst scenario | 1 | Risk Ratio (M‐H, Fixed, 95% CI) | 0.0 [0.0, 0.0] | |
| 15.4 Worst‐best scenario | 1 | Risk Ratio (M‐H, Fixed, 95% CI) | 0.0 [0.0, 0.0] | |