Profilaxis con antibióticos para la prevención de complicaciones relacionadas con el Staphylococcus aureus resistente a la meticilina (SARM) en pacientes quirúrgicos
Resumen
Antecedentes
Generalmente el riesgo de infección por Staphylococcus aureus resistente a la meticilina (SARM) después de cirugía es bajo, pero afecta hasta el 33% de los pacientes después de algunos tipos de cirugía. La infección postoperatoria por SARM puede ocurrir como infecciones del sitio quirúrgico (ISQ), infecciones torácicas o infecciones sanguíneas (bacteriemia). La incidencia de ISQ por SARM varía del 1% al 33% según el tipo de cirugía realizada y el estado portador de los pacientes tratados. No se conoce el régimen del antibiótico profiláctico óptimo para la prevención del SARM después de la cirugía.
Objetivos
Comparar los efectos beneficiosos y perjudiciales de todos los métodos de profilaxis con antibióticos en la prevención de la infección postoperatoria por SARM y las complicaciones relacionadas en pacientes a los que se les realiza cirugía.
Métodos de búsqueda
En marzo de 2013 se realizaron búsquedas en las siguientes bases de datos: el registro especializado del Grupo Cochrane de Heridas (Cochrane Wounds Group); el Registro Cochrane Central de Ensayos Controlados (Cochrane Central Register of Controlled Trials, CENTRAL); Database of Abstracts of Reviews of Effects (DARE) (The Cochrane Library); NHS Economic Evaluation Database (The Cochrane Library); Health Technology Assessment (HTA) Database (The Cochrane Library); Ovid MEDLINE; Ovid MEDLINE (In‐Process & Other Non‐Indexed Citations); Ovid EMBASE; y EBSCO CINAHL.
Criterios de selección
Solamente se incluyeron los ensayos controlados aleatorios (ECA) que compararon un régimen antibiótico utilizado como profilaxis para las ISQ (y otras infecciones postoperatorias) con otro régimen antibiótico o sin antibiótico, y que informaron el estado de resistencia a la meticilina de los microorganismos cultivados. La búsqueda de ECA no se limitó por el idioma, el estado de publicación, el año de publicación ni el tamaño de la muestra.
Obtención y análisis de los datos
Dos revisores identificaron los ensayos para la inclusión y extrajeron los datos de forma independiente. Se calculó el cociente de riesgos (CR) con los intervalos de confianza (IC) del 95% para comparar los resultados binarios entre los grupos y se planificó calcular la diferencia de medias (DM) con los IC del 95% para comparar los resultados continuos. Se planificó realizar el metanálisis con el modelo de efectos fijos y de efectos aleatorios. Siempre que fue posible se realizó el análisis de intención de tratar.
Resultados principales
En esta revisión se incluyeron 12 ECA con 4704 participantes. Once ensayos realizaron 16 comparaciones directas de diferentes regímenes antibióticos profilácticos. La profilaxis con antibióticos se comparó con ninguna profilaxis con antibióticos en un ensayo. Todos los ensayos presentaron un alto riesgo de sesgo. Con la excepción de un ensayo en el que todos los participantes fueron positivos como portadores nasales de SARM o habían presentado infecciones anteriores por SARM, no parece que el SARM se haya probado o erradicado antes de la cirugía; tampoco parece que hubiera una alta prevalencia del estado de portador de SARM en los pacientes a los que se les realizó cirugía.
No hubo similitud clínica suficiente entre los ensayos para realizar un metanálisis. La mortalidad general por todas las causas en cuatro ensayos que informaron la mortalidad fue 14/1401 (1,0%) y no hubo diferencias significativas en la mortalidad entre los grupos de intervención y control en cada una de las comparaciones individuales. No hubo eventos adversos graves relacionados con los antibióticos en cualquiera de los 561 pacientes asignados al azar a siete regímenes diferentes de antibióticos en cuatro ensayos (tres ensayos que informaron mortalidad y otro ensayo). Ninguno de los ensayos informó calidad de vida, duración total de la estancia hospitalaria ni uso de los recursos de asistencia sanitaria. En general, 221/4032 pacientes (5,5%) desarrollaron una ISQ debido a todos los microorganismos, y 46/4704 (1,0%) pacientes desarrollaron ISQ debido a SARM.
En las 15 comparaciones de un régimen antibiótico con otro, no hubo diferencias significativas en la proporción de pacientes que desarrollaron ISQ. En el único ensayo que comparó un régimen antibiótico con placebo, la proporción de pacientes que desarrolló ISQ fue significativamente menor en el grupo que recibió profilaxis con antibióticos con co‐amoxiclav (o cefotaxima si eran alérgicos a la penicilina) en comparación con placebo (todas las ISQ: CR 0,26; IC del 95%: 0,11 a 0,65; ISQ por SARM CR 0,05; IC del 95%: 0,00 a 0,83). En dos ensayos que informaron infecciones por SARM diferentes de la ISQ, 19/478 (4,5%) pacientes desarrollaron infecciones por SARM que incluyeron ISQ, infección torácica y bacteriemia. No hubo diferencias significativas en la proporción de pacientes que desarrolló infecciones por SARM en cualquier sitio corporal en estas dos comparaciones.
Conclusiones de los autores
La profilaxis con co‐amoxiclav disminuye la proporción de pacientes que desarrollan infecciones por SARM en comparación con placebo en pacientes sin enfermedad maligna a los que se les realiza una inserción de gastrostomía endoscópica percutánea, aunque lo anterior se puede deber a la disminución de la infección general, lo que evita por su parte que las heridas se infecten secundariamente por SARM. Actualmente no hay otras pruebas que indiquen que el uso de una combinación de antibióticos profilácticos múltiples o la administración de antibióticos profilácticos durante mayor tiempo tiene un efecto beneficioso para los pacientes a los que se les realiza cirugía en cuanto a la reducción de las infecciones por SARM. Se necesitan ECA bien diseñados sobre este tema que evalúen la efectividad clínica de diferentes regímenes antibióticos.
Resumen en términos sencillos
Uso de un antibiótico para prevenir las infecciones por SARM (Staphylococcus aureus resistente a la meticilina) y las complicaciones relacionadas en pacientes a los que se les realiza cirugía
La mayoría de las infecciones bacterianas de la herida después de una cirugía curan de forma natural o después de tratamiento con antibióticos. Algunas bacterias son resistentes a los antibióticos utilizados frecuentemente, p.ej. Staphylococcus aureus resistente a la meticilina (SARM). La infección por SARM después de la cirugía es poco frecuente, pero puede presentarse en las heridas (infecciones del sitio quirúrgico o ISQ), el tórax o la sangre (bacteriemia) y puede poner en peligro la vida del paciente. Las ISQ por SARM ocurren en el 1% al 33% de los pacientes a los que se les realiza cirugía (según el tipo de operación) y dan lugar a la hospitalización prolongada.
Los antibióticos se pueden utilizar individualmente o combinados, y administrarse durante diferentes períodos de tiempo. Para identificar el/los mejor/es antibiótico/s, o patrón de dosis, para prevenir la aparición de infección por SARM después de cirugía, se investigaron los estudios que compararon diferentes antibióticos entre sí, o con ningún tratamiento, para prevenir la ISQ por SARM. Solo se incluyeron ensayos controlados aleatorios (ECA), y no se establecieron limitaciones con respecto al idioma, la fecha de publicación ni el tamaño del ensayo. Dos revisores identificaron los estudios y extrajeron los datos de forma independiente.
Se incluyeron 12 ECA con 4704 participantes. Once ensayos compararon 16 tratamientos con antibióticos preventivos (profilácticos), y uno comparó profilaxis con antibiótico con ninguna profilaxis. En general no se conocía el estado de SARM de los participantes antes de la cirugía.
Cuatro estudios informaron las muertes (14/1401 participantes): aproximadamente el 1% de los participantes murió por cualquier causa después de la cirugía, pero no hubo diferencias significativas entre los grupos de tratamiento. Cuatro ensayos informaron eventos adversos graves relacionados con el antibiótico; no hubo eventos en 561 participantes. Ninguno de los ensayos informó calidad de vida, duración de la estancia hospitalaria ni uso de recursos de asistencia sanitaria. En general, hubo 221 ISQ debido a cualquier bacteria en 4032 pacientes (6%) y 46 ISQ por SARM en 4704 pacientes (1%). No hubo diferencias significativas en el desarrollo de ISQ entre las 15 comparaciones de un tratamiento antibiótico contra otro. Cuando la profilaxis con antibióticos con co‐amoxiclav se comparó con ninguna profilaxis con antibióticos, una proporción significativamente menor de pacientes desarrolló ISQ después de recibir co‐amoxiclav (reducción del 74% en todas las ISQ y reducción del 95% en todas las ISQ por SARM).
Dos ensayos informaron que 19 participantes desarrollaron infección por SARM en las heridas (ISQ), el tórax o la sangre, pero no hubo diferencias significativas en la proporción de pacientes que la desarrollaron entre las dos comparaciones.
La profilaxis con co‐amoxiclav disminuyó la proporción de pacientes que desarrollaron infecciones por SARM en comparación con ninguna profilaxis con antibióticos en pacientes sin cáncer a los que se les realizó cirugía para la inserción de sondas alimentarias en el estómago mediante endoscopia, aunque lo anterior se puede deber a la disminución de la infección general, lo que a su vez evitó que las heridas se infectaran secundariamente por SARM. Actualmente no hay otras pruebas de que una combinación de antibióticos profilácticos, o una mayor duración del tratamiento con antibióticos, tenga efectos beneficiosos para los pacientes a los que se les realizó cirugía en cuanto a la reducción de las infecciones por SARM. Se necesitan ECA bien diseñados para evaluar diferentes tratamientos antibióticos para la prevención de las infecciones por SARM después de la cirugía.
Authors' conclusions
Summary of findings
| Mortality | |||||
| Patient or population: surgical patients | |||||
| Comparisons | Illustrative comparative risks* (95% CI) | Relative effect | No of Participants | Quality of the evidence | |
| Assumed risk | Corresponding risk | ||||
| Control | Comparison of different regimens of prophylactic antibiotic regimens | ||||
| One dose of cefotiam or cefmetazol versus four doses of cefotiam or cefmetazol (elective surgery for colon cancer) | See comment | See comment | Not estimable | 275 | ⊕⊝⊝⊝ |
| Kanamycin, erythromycin and cefotiam versus cefotiam (surgery for colorectal diseases) | See comment | See comment | Not estimable | 143 | ⊕⊝⊝⊝ |
| Co‐amoxiclav or cefotaxime versus placebo (percutaneous endoscopic gastrostomy) | 146 per 1000 | 79 per 1000 | RR 0.54 | 99 | ⊕⊝⊝⊝ |
| Vancomycin versus cefuroxime (coronary artery bypass graft without valvular disease) | 2 per 1000 | 5 per 1000 | RR 2.02 | 884 | ⊕⊝⊝⊝ |
| *The basis for the assumed risk is the control group risk in the study. The corresponding risk (and its 95% confidence interval) is based on the assumed risk in the comparison group and the relative effect of the intervention (and its 95% CI). | |||||
| GRADE Working Group grades of evidence: | |||||
| 1 The risk of bias in the trial was high | |||||
| Surgical site infection | |||||
| Patient or population: surgical patients | |||||
| Comparisons | Illustrative comparative risks* (95% CI) | Relative effect | No of Participants | Quality of the evidence | |
| Assumed risk | Corresponding risk | ||||
| Control | Comparison of different regimens of prophylactic antibiotic regimens | ||||
| Cefamendole versus cefamendole and gentamycin (median sternotomy) | Moderate | RR 5.08 | 522 | ⊕⊝⊝⊝ | |
| 5 per 1000 | 25 per 1000 | ||||
| Cefazolin versus cefamendole (median sternotomy) | 8 per 1000 | 27 per 1000 | RR 3.55 | 514 | ⊕⊝⊝⊝ |
| Cefazolin versus cefazolin and gentamycin (median sternotomy) | 32 per 1000 | 28 per 1000 | RR 0.87 | 508 | ⊕⊝⊝⊝ |
| Co‐amoxiclav or cefotaxime versus placebo (percutaneous endoscopic gastrostomy) | 375 per 1000 | 98 per 1000 | RR 0.26 | 99 | ⊕⊕⊝⊝ |
| Daptomycin and cefazolin versus cefazolin (vascular surgery) | 129 per 1000 | 39 per 1000 | RR 0.3 | 113 | ⊕⊝⊝⊝ |
| Kanamycin, erythromycin and cefotiam versus cefotiam (surgery for colorectal diseases) | 239 per 1000 | 110 per 1000 | RR 0.46 | 143 | ⊕⊝⊝⊝ |
| Levofloxacin versus ofloxacin (breast cancer) | 61 per 1000 | 40 per 1000 | RR 0.66 | 181 | ⊕⊝⊝⊝ |
| One day of piperacillin, cefazolin, cefmetazole, or cefotiam versus three days of piperacillin, cefazolin, cefmetazole, or cefotiam (elective colorectal surgery) | 54 per 1000 | 57 per 1000 | RR 1.06 | 521 | ⊕⊝⊝⊝ |
| One dose of cefotiam or cefmetazol versus four doses of cefotiam or cefmetazol (elective surgery for colon cancer) | 65 per 1000 | 51 per 1000 | RR 0.79 | 275 | ⊕⊝⊝⊝ |
| Pefloxacin versus cefazolin and oxacillin (tibial fracture requiring external fixation) | 90 per 1000 | 67 per 1000 | RR 0.74 | 616 | ⊕⊝⊝⊝ |
| Vancomycin and cefazolin versus cefazolin (open fractures) | 87 per 1000 | 87 per 1000 | RR 1 | 92 | ⊕⊝⊝⊝ |
| Vancomycin and cefazolin versus cefazolin (vascular surgery) ‐ suggest add for all comparisons | 129 per 1000 | 125 per 1000 | RR 0.97 | 118 | ⊕⊝⊝⊝ |
| Vancomycin and cefazolin versus daptomycin and cefazolin (vascular surgery) | 39 per 1000 | 125 per 1000 | RR 3.19 | 107 | ⊕⊝⊝⊝ |
| Vancomycin versus teicoplanin (paediatric cardiac surgery) | No infection in either group | Not estimable | 22 | ⊕⊝⊝⊝ | |
| Vancomycin versus cefuroxime (coronary artery bypass graft without valvular disease) | 32 per 1000 | 34 per 1000 | RR 1.08 | 884 | ⊕⊝⊝⊝ |
| *The basis for the assumed risk is the control group risk in the study. When there were no events in either group, we have indicated so. When there were events in the intervention group but not in the control group, we have used a moderate proportion of 0.5% in the control group. The corresponding risk (and its 95% confidence interval) is based on the assumed risk in the comparison group and the relative effect of the intervention (and its 95% CI). | |||||
| GRADE Working Group grades of evidence: | |||||
| 1 The risk of bias in the trial was high | |||||
| MRSA surgical site infection | |||||
| Patient or population: surgical patients | |||||
| Comparisons | Illustrative comparative risks* (95% CI) | Relative effect | No of Participants | Quality of the evidence | |
| Assumed risk | Corresponding risk | ||||
| Control | Comparison of different regimens of prophylactic antibiotic regimens | ||||
| Cefamendole versus cefamendole and gentamycin (median sternotomy) | No infection in either group | Not estimable | 522 | ⊕⊝⊝⊝ | |
| Cefazolin and gentamycin versus cefamendole and gentamycin (median sternotomy) | No infection in either group | Not estimable | 516 | ⊕⊝⊝⊝ | |
| Cefazolin versus cefamendole (median sternotomy) | Moderate | RR 3.05 | 514 | ⊕⊝⊝⊝ | |
| 5 per 1000 | 15 per 1000 | ||||
| Cefazolin versus cefazolin and gentamycin (median sternotomy) | Moderate | RR 2.98 | 508 | ⊕⊝⊝⊝ | |
| 5 per 1000 | 15 per 1000 | ||||
| Co‐amoxiclav or cefotaxime versus placebo (percutaneous endoscopic gastrostomy) | 188 per 1000 | 9 per 1000 | RR 0.05 | 99 | ⊕⊕⊝⊝ |
| Daptomycin and cefazolin versus cefazolin (vascular surgery) | 32 per 1000 | 8 per 1000 | RR 0.24 | 113 | ⊕⊝⊝⊝ |
| Ertapenem versus cefotetan (elective colorectal surgery) | 15 per 1000 | 9 per 1000 | RR 0.59 | 672 | ⊕⊝⊝⊝ |
| Kanamycin, erythromycin and cefotiam versus cefotiam (surgery for colorectal diseases) | 28 per 1000 | 55 per 1000 | RR 1.97 | 143 | ⊕⊝⊝⊝ |
| Levofloxacin versus ofloxacin (breast cancer) | No infection in either group | Not estimable | 181 | ⊕⊝⊝⊝ | |
| One day of piperacillin, cefazolin, cefmetazole, or cefotiam versus three days of piperacillin, cefazolin, cefmetazole, or cefotiam (elective colorectal surgery) | No infection in either group | Not estimable | 521 | ⊕⊝⊝⊝ | |
| One dose of cefotiam or cefmetazol versus four doses of cefotiam or cefmetazol (elective surgery for colon cancer) | 22 per 1000 | 22 per 1000 | RR 1.02 | 275 | ⊕⊝⊝⊝ |
| Pefloxacin versus cefazolin and oxacillin (tibial fracture requiring external fixation) | 3 per 1000 | 13 per 1000 | RR 3.8 | 616 | ⊕⊝⊝⊝ |
| Vancomycin and cefazolin versus cefazolin (open fractures) | Moderate | RR 3 | 92 | ⊕⊝⊝⊝ | |
| 5 per 1000 | 15 per 1000 | ||||
| Vancomycin and cefazolin versus cefazolin (vascular surgery) | 32 per 1000 | 71 per 1000 | RR 2.21 | 118 | ⊕⊝⊝⊝ |
| Vancomycin and cefazolin versus daptomycin and cefazolin (vascular surgery) | Moderate | RR 8.21 | 107 | ⊕⊝⊝⊝ | |
| 5 per 1000 | 41 per 1000 | ||||
| Vancomycin versus teicoplanin (paediatric cardiac surgery) | No infection in either group | Not estimable | 22 | ⊕⊝⊝⊝ | |
| Vancomycin versus cefuroxime (coronary artery bypass graft without valvular disease) | 5 per 1000 | 5 per 1000 | RR 1.01 | 884 | ⊕⊝⊝⊝ |
| *The basis for the assumed risk is the control group risk in the study. When there were no events in either group, we have indicated so. When there were events in the intervention group but not in the control group, we have used a moderate proportion of 0.5% in the control group. The corresponding risk (and its 95% confidence interval) is based on the assumed risk in the comparison group and the relative effect of the intervention (and its 95% CI). | |||||
| GRADE Working Group grades of evidence: | |||||
| 1 The risk of bias in the trial was high | |||||
| Overall MRSA infections | |||||
| Patient or population: surgical patients | |||||
| Comparisons | Illustrative comparative risks* (95% CI) | Relative effect | No of Participants | Quality of the evidence | |
| Assumed risk | Corresponding risk | ||||
| Control | Comparison of different regimens of prophylactic antibiotic regimens | ||||
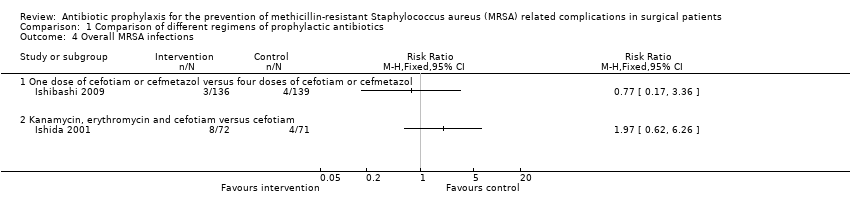
| One dose of cefotiam or cefmetazol versus four doses of cefotiam or cefmetazol (elective surgery for colon cancer) | 29 per 1000 | 22 per 1000 | RR 0.77 | 275 | ⊕⊝⊝⊝ |
| Kanamycin, erythromycin and cefotiam versus cefotiam (surgery for colorectal diseases) | 56 per 1000 | 111 per 1000 | RR 1.97 | 143 | ⊕⊝⊝⊝ |
| *The basis for the assumed risk is the control group risk in the study. The corresponding risk (and its 95% confidence interval) is based on the assumed risk in the comparison group and the relative effect of the intervention (and its 95% CI). | |||||
| GRADE Working Group grades of evidence: | |||||
| 1 The risk of bias in the trial was high. | |||||
Background
Description of the condition
Methicillin‐resistant Staphylococcus aureus (MRSA) was first discovered in 1961 (Barber 1961; Jevons 1961; Knox 1961), and outbreaks of infection have been reported since the 1970s (Klimek 1976; O'Toole 1970). MRSA infection is associated with significant mortality and morbidity. In the European Union member states plus Norway and Iceland, MRSA infections cause an estimated one million extra hospital stays and cost an estimated EUR 600 million (ECDC 2009a). In the USA, an estimated 125,000 hospitalisations occur each year in relation to MRSA infections (Kuehnert 2005). While there has been a decrease in the incidence of MRSA in some countries such as the USA (Kallen 2010), probably because of measures to combat MRSA infections (ECDC 2009b), there has been an increase in the incidence of MRSA infections in Nordic countries (Skov 2005). Methicillin (meticillin is the International Nonproprietary Name but we have used 'methicillin' in this review as it is the more commonly used name in our experience) resistance is a marker of resistance to some beta‐lactam antibiotics (penicillin and the cephalosporin group of antibiotics, which are some of the most commonly used antibiotics in the patients) (Otter 2011). In addition to beta‐lactam antibiotics, MRSA may be resistant to many other commonly‐used antibiotics such as erythromycin, clindamycin, gentamycin, ciprofloxacin, and fusidic acid (Otter 2011). So, even though the antibiotic methicillin is not commonly used itself, methicillin resistance indicates resistance to a wide range of antibiotics. There are currently concerns that farm animals may become reservoirs of MRSA, and a source of a major epidemic of MRSA outside hospitals (Wulf 2008).
The incidence of MRSA infection after surgery is usually low, but can be up to 33% in certain types of surgery, such as pancreatic surgery (pancreatoduodenectomies) (Sanjay 2010). Post‐operative MRSA infection can present as surgical site infections (SSI), chest infections, or bloodstream infections (bacteraemia) (Fraser 2010; Reddy 2007; Sanjay 2010). Nosocomial (hospital‐acquired) MRSA transmission is believed to be due to cross‐contamination from healthcare workers whose hands become colonised transiently while performing patient care activities on people colonised or infected with MRSA (Boyce 1994). Healthcare workers who are persistent nasal carriers of MRSA (i.e. who carry MRSA without suffering from infection) may also act as the source of infection for MRSA (Boyce 1994). Generally, air‐borne transmission is not considered to be a mode of transmission for MRSA. Large burn wounds in people colonised or infected with MRSA may act as reservoirs of MRSA (Boyce 1994).
The Centers for Disease Control and Prevention (CDC) criteria for SSIs, published by Horan et al (Horan 1992), provide definitions of nosocomial SSIs. Interested readers may refer to this document for definitions, but broadly speaking, infections confined to skin and subcutaneous tissues are superficial SSIs; those involving the fascia and muscles are deep SSIs; and those involving organs or spaces other than the incision are organ space SSIs (Horan 1992). The incidence of MRSA SSIs in developed countries varies from 1% to 25% depending upon type of surgery and the carrier status of the individual (i.e. whether MRSA colonisation was present prior to the surgery) (Harbarth 2008a; Reddy 2007; Ridgeway 2005; Sanjay 2010; Shukla 2009). The role of universal MRSA screening and contact precautions in hospitalised patients is controversial. Guidelines published by the Society for Healthcare Epidemiology of America (SHEA) recommend routine screening and contact precautions (Muto 2003); others suggest that MRSA screening targeted at people at high risk of MRSA colonisation, such as those requiring intensive care, people with chronic wounds, and nursing home residents is more cost‐effective than universal MRSA screening (Creamer 2011; Kang 2012). Others suggest that the contact precautions are not necessary for decreasing post‐operative MRSA infection rate, provided that the people are isolated after screening (Spence 2011); yet others suggest that MRSA screening is not effective in decreasing post‐operative MRSA SSIs (Harbarth 2008b). The risk factors, other than the type of surgery and carrier status of the individual, include emergency surgery, prolonged duration of surgery, contaminated surgery, immunosuppression, and the presence of co‐morbidities such as diabetes mellitus, renal insufficiency, and ischaemic disease (Harbarth 2008a). MRSA SSIs are associated with increased mortality in people undergoing cardiac operations such as coronary artery bypass graft surgery and cardiac valve surgery (Reddy 2007). Cardiac surgical patients with MRSA SSIs had an in‐hospital mortality of 12.9% compared with an in‐hospital mortality of 3% in uninfected cardiac surgery patients (Reddy 2007). In people undergoing vascular surgery, such as aortic aneurysm repair, carotid endarterectomy, and vascular bypass procedures, the presence of post‐operative MRSA infection resulted in a four‐fold increase in the in‐hospital mortality (Cowie 2005). Patients who developed MRSA infections also stayed longer in hospital than those who did not develop MRSA infections (Chemaly 2010; Cowie 2005; Fraser 2010; Sanjay 2010; Shukla 2009).
The incidence of post‐operative MRSA infection can vary with the type of surgery; such infection is usually rare, but post‐operative chest infections can be found in up to 15% of pancreatic surgeries (Sanjay 2010), and can result in bacteraemia in up to 5% of the pancreatic surgical patients (Sanjay 2010). MRSA bacteraemia is associated with a 30‐day mortality of about 28% to 38% (Lamagni 2011; Lewis 2011; Wang 2010), and a one‐year mortality of about 55% (Kaye 2008).
Description of the intervention
The Oxford English Dictionary defines an antibiotic substance as, "One of a class of substances produced by living organisms and capable of destroying or inhibiting the growth of micro‐organisms especially used for therapeutic purposes. Synthetic organic compounds having similar properties are also called antibiotics" (OED 2011). Prophylactic antibiotics (to prevent infection) require administration before the infection sets in. A variety of antibiotics, including beta‐lactams (penicillin derivatives, cephalosporins),glycopeptide antibiotics (e.g. vancomycin, teicoplanin), clindamycin, trimethoprim‐sulfamethoxazole (TMP‐SMX), a tetracycline (doxycycline or minocycline), linezolid, daptomycin, telavancin, rifampicin, gentamycin, and fluoroquinolone, all work against MRSA (Liu 2011). Different antibiotics are administered in different ways, with the common routes being oral, intravenous, and topical (surface) administration (Liu 2011). Antibiotics can be given as a single agent or in combinations (Liu 2011). Antibiotics can be given pre‐operatively, during the operation, post‐operatively, or a combination of the above. Prophylactic antibiotics are usually started just before surgery, and can vary between a single dose or multiple doses for a short period of time after the surgery (Saginur 2000). An antibiotic regimen can be considered as a particular method of administration of antibiotic that includes route of administration, dose administered, and whether single or multiple antibiotics; it can be administered pre‐operatively, during the operation, post‐operatively, or a combination of the above. Some national guidelines recommend a single prophylactic dose prior to start of surgery except under exceptional circumstances, such as prolonged surgery (more than four hours), major blood loss (in excess of 1.5 litres in adults or 25 ml/kg in children), or in specific types of surgery such as arthroplasty (SIGN 2008).
How the intervention might work
The mechanisms of action vary for different types of antibiotic, but in general terms they either destroy MRSA or prevent cell division (which prevents reproduction and hence multiplication in numbers of MRSA bacteria). The intervention might decrease the complications caused by MRSA infection by preventing MRSA infection. As described above, complications related to MRSA infection include mortality and serious adverse events such as bacteraemia, and chest infection; such outcomes are important in terms of clinical decision making (Fraser 2010; Reddy 2007; Sanjay 2010). Incidence of MRSA infection is considered to be an intermediate outcome that might influence mortality, and has serious adverse events.
Why it is important to do this review
One systematic review found that glycopeptide antibiotics (such as vancomycin and teicoplanin) did not influence post‐operative surgical site infection rates compared with non‐glycopeptide antibiotics (Chambers 2010). This is just of one of the comparisons included in this review. There has been no systematic review comparing other antibiotics. Loeb et al compared the use of different anti‐microbial treatments in people colonised with MRSA either nasally or at extra‐nasal sites and concluded that there was insufficient evidence to support use of topical or systemic (whole body) antimicrobial therapy for eradicating nasal or extra‐nasal MRSA (Loeb 2003).There has been no systematic review or Cochrane review comparing the various antibiotics, other than the comparison between vancomycin and teicoplanin by Chambers 2010, in the prevention of MRSA infection and subsequent complications in people undergoing surgery. Such a review will be a useful guide for microbiologists, surgeons, and policy makers.
Objectives
To compare the benefits and harms of all methods of antibiotic prophylaxis in the prevention of MRSA infection and related post‐operative complications in people undergoing surgery.
Methods
Criteria for considering studies for this review
Types of studies
We included randomised controlled trials (RCTs), irrespective of blinding, language, publication status, date of publication, study setting, sample size, or whether the incidence of MRSA infection was the primary outcome of the trial. We planned to include cluster randomised clinical trials if the effect estimate was available after adjusting for clustering effect. No other study designs (i.e. quasi‐randomised studies and non‐randomised studies) were included.
Types of participants
People undergoing surgery, irrespective of age, type of surgery, whether surgery was elective or emergency, and whether MRSA colonisation was identified by routine screening (in general, we expected that if MRSA colonisation was identified, it would have been eradicated before surgery). We excluded studies recruiting people with established MRSA SSIs, as these are covered in another review (Gurusamy).
Types of interventions
-
Comparison of antibiotic prophylaxis (irrespective of the antibiotic) compared with placebo (or no treatment).
-
Comparison of different antibiotic prophylaxis (and regimens). This includes different doses, routes, or timings of administration.
We included studies evaluating a combination of antibiotics in terms of the combined regimen rather than as single antibiotics.
Types of outcome measures
Primary outcomes
-
All‐cause mortality at maximal follow‐up.
-
Other serious adverse events (defined as any event that is life‐threatening; requires inpatient hospitalisation; results in a persistent or significant disability; or any important medical event that might have jeopardised the patient or requires intervention to prevent it (ICH‐GCP 1996), e.g. rates of bacteraemia, and other MRSA complications) at maximal follow‐up due to surgery or MRSA infection or due to the use of antibiotics. Mild adverse events are unlikely to determine the clinical management, if there were no significant differences in the primary outcomes or one of the secondary outcomes.
-
Quality of life (at maximal follow‐up).
Secondary outcomes
-
Total length of hospital stay (at maximal follow‐up due to surgery or MRSA infection).
-
Use of health care resources (e.g. hospital visits at maximal follow‐up due to surgery or MRSA infection).
-
Rates of SSIs (due to all organisms) within 30 days of surgery.
-
Rates of SSIs due to MRSA within 30 days of surgery.
-
Rates of infections due to MRSA at any site within 30 days of surgery.
We included only trials in which MRSA SSIs were reported.
Search methods for identification of studies
Electronic searches
In March 2013 we searched the following electronic databases to identify reports of relevant RCTs:
-
The Cochrane Wounds Group Specialised Register (searched 28 February 2013);
-
The Cochrane Central Register of Controlled Trials (The Cochrane Library CENTRAL) (2013, Issue 1);
-
Database of Abstracts of Reviews of Effects (DARE) ) (The Cochrane Library 2013, Issue 1);
-
NHS Economic Evaluation Database ) (The Cochrane Library 2013, Issue 1);
-
Health Technology Assessment (HTA) Database ) (The Cochrane Library 2013, Issue 1);
-
Ovid MEDLINE (1948 to February Week 3 2013);
-
Ovid MEDLINE (In‐Process & Other Non‐Indexed Citations, 28 February 2013);
-
Ovid EMBASE (1974 to 2013 Week 08);
-
EBSCO CINAHL (1982 to 21 February 2013).
We used the following search strategy in The Cochrane Central Register of Controlled Trials (CENTRAL):
#1 MeSH descriptor Methicillin Resistance explode all trees
#2 MeSH descriptor Staphylococcal Infections explode all trees
#3 MeSH descriptor Staphylococcus aureus explode all trees
#4 (#2 OR #3)
#5 (#1 AND #4)
#6 MeSH descriptor Methicillin‐Resistant Staphylococcus aureus explode all trees
#7 (methicillin NEXT resistan*) or (meticillin NEXT resistan*) or MRSA
#8 (#5 OR #6 OR #7)
#9 MeSH descriptor Wound Infection explode all trees
#10 MeSH descriptor Sepsis explode all trees
#11 MeSH descriptor Soft Tissue Infections explode all trees
#12 MeSH descriptor Surgical Wound Dehiscence explode all trees
#13 surg* NEAR/5 infect*
#14 surg* NEAR/5 wound*
#15 surg* NEAR/5 site*
#16 surg* NEAR/5 incision*
#17 surg* NEAR/5 dehisc*
#18 wound* NEAR/5 dehisc*
#19 (deep NEXT infection*) or "deep sepsis" or (infected NEXT
collection*)
#20 (#9 OR #10 OR #11 OR #12 OR #13 OR #14 OR #15 OR #16 OR #17 OR
#18 OR #19)
#21 MeSH descriptor Anti‐Bacterial Agents explode all trees
#22 MeSH descriptor Cephalosporins explode all trees
#23 MeSH descriptor Tetracycline explode all trees
#24 MeSH descriptor Penicillins explode all trees
#25 antibiotic* or penicillin* or beta‐lactam* or cephalosporin* or clindamycin or trimethoprim* or tetracycline* or doxycycline or minocycline or linezolid or vancomycin or daptomycin or telavancin or rifampicin or gentamycin or gentamicin or fluoroquinolone
#26 (#21 OR #22 OR #23 OR #24 OR #25)
#27 (#8 AND #20 AND #26)
The search strategies for Ovid MEDLINE, Ovid EMBASE and EBSCO CINAHL can be found in Appendix 1. We combined the Ovid MEDLINE search with the Cochrane Highly Sensitive Search Strategy for identifying randomised trials in MEDLINE: sensitivity‐ and precision‐maximising version (2008 revision) (Lefebvre 2011). We combined the EMBASE search with the Ovid EMBASE filter developed by the UK Cochrane Centre (Lefebvre 2011). We combined the CINAHL searches with the trial filters developed by the Scottish Intercollegiate Guidelines Network (SIGN 2013). We did not restrict studies with respect to language, date of publication or study setting.
We searched the metaRegister of Controlled Trials (mRCT) (http://www.controlled‐trials.com/mrct/), which includes the ISRCTN Register and the NIH ClinicalTrials.gov Register among others. We also searched the World Health Organization's International Clinical Trials Registry Platform (ICTRP) (http://apps.who.int/trialsearch/). The ICRTP portal includes national trial registry databases from a number of countries (last searched 11 December 2012).
Searching other resources
We searched the references of the included trials to identify further relevant trials. We also contacted experts in MRSA infection to identify further trials.
Data collection and analysis
We performed the systematic review following the instructions in the Cochrane Handbook for Systematic Reviews of Intervention (Higgins 2011a).
Selection of studies
Two review authors (KG and RK) identified the trials for inclusion independently. We have listed the excluded studies with reasons for their exclusion. Any differences were resolved through discussion.
Data extraction and management
Both review authors extracted the following data independently:
-
Year and language of publication of trial report.
-
Country.
-
Year in which trial was conducted.
-
Inclusion and exclusion criteria.
-
Sample size.
-
Type of surgery.
-
Details of antibiotic treatment including dose, route, frequency, and duration.
-
Outcomes (described above).
-
Risk of bias (described below).
-
Source of funding.
When multiple reports had been published for a trial, we obtained information from all the reports. We contacted the authors of the individual trials to seek out any unclear or missing information. If there was any doubt about whether the trials shared the same participants, completely or partially (by identifying common authors and centres), we contacted the study authors to clarify whether the trial report had been duplicated. We resolved any differences in opinion through discussion.
Assessment of risk of bias in included studies
We followed the instructions in the Cochrane Handbook for Systematic Reviews of Intervention to assess risk of bias (Higgins 2011b). According to empirical evidence (Kjaergard 2001; Moher 1998; Schulz 1995; Wood 2008), the risk of bias of the trials was assessed according to the following bias risk domains:
Sequence generation
-
Low risk of bias (the methods used are either adequate (e.g. computer‐generated random numbers, table of random numbers) or unlikely to introduce confounding).
-
Uncertain risk of bias (there is insufficient information to assess whether the method used is likely to introduce confounding).
-
High risk of bias (the method used (e.g. quasi‐randomised studies) is improper and likely to introduce confounding). Such studies will be excluded.
Allocation concealment
-
Low risk of bias (the method used (e.g. central allocation) is unlikely to induce bias on the final observed effect).
-
Uncertain risk of bias (there is insufficient information to assess whether the method used is likely to induce bias on the estimate of effect).
-
High risk of bias (the method used (e.g. open random allocation schedule) is likely to induce bias on the final observed effect).
Blinding of participants, personnel
-
Low risk of bias (blinding was performed adequately, or the outcome measurement is not likely to be influenced by lack of blinding).
-
Uncertain risk of bias (there is insufficient information to assess whether the type of blinding used is likely to induce bias on the estimate of effect).
-
High risk of bias (no blinding or incomplete blinding, and the outcome or the outcome measurement is likely to be influenced by lack of blinding).
Blinding of outcome assessors
-
Low risk of bias (blinding was performed adequately, or the outcome measurement is not likely to be influenced by lack of blinding).
-
Uncertain risk of bias (there is insufficient information to assess whether the type of blinding used is likely to induce bias on the estimate of effect).
-
High risk of bias (no blinding or incomplete blinding, and the outcome or the outcome measurement is likely to be influenced by lack of blinding).
Incomplete outcome data
-
Low risk of bias (the underlying reasons for missing data are unlikely to make treatment effects depart from plausible values, or proper methods have been employed to handle missing data).
-
Uncertain risk of bias (there is insufficient information to assess whether the missing data mechanism in combination with the method used to handle missing data is likely to induce bias on the estimate of effect).
-
High risk of bias (the crude estimate of effects (e.g. complete case estimate) will clearly be biased due to the underlying reasons for the data being missing, and the methods used to handle missing data are unsatisfactory).
Selective outcome reporting
-
Low risk of bias (the trial protocol is available and all of the trial's pre‐specified outcomes that are of interest in the review have been reported or similarly, if the trial protocol is not available, all the primary outcomes in this review are reported).
-
Uncertain risk of bias (there is insufficient information to assess whether the magnitude and direction of the observed effect is related to selective outcome reporting).
-
High risk of bias (not all of the trial's pre‐specified primary outcomes have been reported).
We considered trials that were classified as having a low risk of bias in all the above domains to be low bias‐risk trials.
Measures of treatment effect
For dichotomous variables, we calculated the risk ratio (RR) with 95% confidence interval (CI). We used Peto's odds ratios (Peto OR) for outcomes with a proportion of less than 1% events. For continuous variables, we planned to calculate the mean difference (MD) with 95% CI for outcomes such as hospital stay and standardised mean difference (SMD) with 95% CI for quality of life (where different scales might be used). For time‐to‐event outcomes such as survival at maximal follow‐up, we planned to calculate the hazard ratio (HR) with 95% CI.
Unit of analysis issues
The unit of analysis was individual people undergoing surgical procedures. We did anticipate the need for people to have a second operation during the same admission within the trials. However, we decided that if we found any person having a second operation, provided that s/he did not have MRSA infection before the second surgery, we would consider each surgery to be a separate unit of analysis.
Dealing with missing data
We performed an intention‐to‐treat analysis whenever possible (Newell 1992). We imputed missing data for binary outcomes using various scenarios such as best‐best scenario, worst‐worst scenario, best‐worst scenario, and worst‐best scenario (Gurusamy 2009). In the best‐best scenario, the people with the missing outcomes were considered not to have developed a complication. In the worst‐worst scenario, the people with the missing outcomes were considered to have developed a complication. In the best‐worst scenario, the people with the missing outcomes were considered not to have developed a complication in the intervention group and to have developed a complication in the control group. In the worst‐best scenario, the people with the missing outcomes were considered to have developed a complication in the intervention group and not to have developed a complication in the control group.
For continuous outcomes, we planned to use available‐case analysis. We planned to impute the standard deviation from P values according to the instructions in the Cochrane Handbook for Systematic Reviews of Intervention (Higgins 2011c), and use the median for the meta‐analysis when the mean was not available. If it was not possible to calculate the standard deviation from the P value or the CIs, we planned to impute the standard deviation as the highest standard deviation in the other trials included under that outcome, fully recognising that this form of imputation would decrease the weight of the study for calculation of MD and bias the effect estimate to no effect in case of SMD (Higgins 2011c).
For time‐to‐event outcomes, where HR and 95% CIs were not reported, we planned to obtain the logarithm of hazard ratios (ln(HR)) and the standard error (SE) of ln(HR) according to the methods described by Parmar 1998.
Assessment of heterogeneity
We explored heterogeneity by means of the Chi2 test with significance set at P value 0.10, and measured the degree of heterogeneity by means of the I2 test (Higgins 2002). We also used overlapping of CIs on the forest plot to determine heterogeneity.
Assessment of reporting biases
We planned to use visual asymmetry on a funnel plot to explore reporting bias in the presence of at least 10 trials (Egger 1997; Macaskill 2001). We planned to perform the linear regression approach described by Egger 1997 to determine the funnel plot asymmetry.
Data synthesis
For the comparison of antibiotic versus placebo (or no intervention), we planned to perform the meta‐analysis only if there was sufficient clinical homogeneity in terms of people included in the trials. This was based on our clinical judgement. For the comparison of different antibiotics, we planned to perform the meta‐analysis only if there was sufficient clinical homogeneity in terms of people included in the trials and in terms of antibiotics used (i.e. similar class of antibiotics). We performed the meta‐analyses using the software package RevMan 5 (RevMan 2011), following the recommendations of The Cochrane Collaboration (Higgins 2011a). We used both a random‐effects model (DerSimonian 1986), and a fixed‐effect model (DeMets 1987), for the meta‐analyses. In case of discrepancy between the two models identified from the pooled estimates and their CIs, we have reported both results; otherwise we have reported the results of the fixed‐effect model. Calculations for dichotomous outcomes to produce risk ratio (RR) or Peto OR do not include trials in which no events occurred in either group in the meta‐analysis, whereas risk difference (RD) calculations do. We planned to report the RD when the results using this association measure were different from RR or Peto OR. However, RR or Peto OR were the measures that we used to arrive at conclusions, since they perform better than RD when there are differences in the control event rate (proportion of people who develop the event in the control). We planned to use the generic inverse variance method to combine the HRs for time‐to‐event outcomes.
Subgroup analysis and investigation of heterogeneity
We planned to perform the following subgroup analyses.
-
Different antibiotics (or class of antibiotics).
-
Different doses and durations of antibiotics.
-
Different types of surgery including different types of wounds (clean, clean‐contaminated, contaminated, and dirty or infected) (the risk of SSI varies according to wound types) (Garner 1986).
-
Different patient characteristics (presence of systemic illness such as diabetes or other immunocompromised individuals).
-
People routinely screened and treated versus those who were not routinely screened.
We planned to use a P value of less than 0.05 for the Chi2 test to identify the differences between subgroups and to investigate whether heterogeneity in effect estimates were attributable to differences in the above characteristics.
Sensitivity analysis
We performed a sensitivity analysis by imputing data for binary outcomes using various scenarios such as best‐best scenario, worst‐worst scenario, best‐worst scenario, and worst‐best scenario (Gurusamy 2009). We also planned to perform a sensitivity analysis by testing the effect of removing trials at unclear or high risk of bias and excluding the trials in which the mean and the standard deviation were imputed.
Presentation of results
We have presented the main results of the review in 'Summary of findings' tables, which provide key information concerning the quality of evidence, the magnitude of effect of the interventions examined, and the sum of available data on the main outcomes, as recommended by the Cochrane Collaboration (Schunemann 2011a). We planned to include the following in the 'Summary of findings' tables:
-
All‐cause mortality.
-
Serious adverse events.
-
Quality of life.
-
Total length of hospital stay.
-
Use of healthcare resources.
-
Rates of surgical site infections due to MRSA within 30 days of surgery.
-
Rates of surgical site infections due to all organisms within 30 days of surgery.
-
Rates of overall MRSA infections.
We have included 'Summary of findings' tables for the above outcomes when they were available from the trials. Each 'Summary of findings' table includes an overall grading of the evidence related to each of the main outcomes, using the GRADE approach (Schunemann 2011b).
Results
Description of studies
Results of the search
We identified a total of 489 unique references through electronic searches. We excluded 454 clearly irrelevant references through reading titles and abstracts. We retrieved 35 references in full for further assessment. We did not identify any additional references to trials by scanning reference lists of included trials. We did not identify any new trials through other searches. We excluded 22 references because of the reasons mentioned in the Characteristics of excluded studies. Thirteen references to 12 trials met the inclusion criteria and were included in this review (Carsenti‐Etesse 1999; Goldstein 2009; Hashizume 2004; Ishibashi 2009; Ishida 2001; Kaiser 1987; Morimoto 2002; Saadeddin 2005; Saveli 2011; Shime 2007; Stone 2010; Vuorisalo 1998). The reference flow is shown in Figure 1.
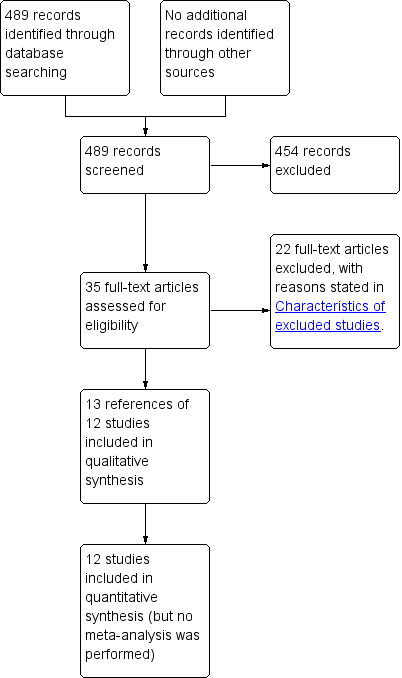
Study flow diagram.
Included studies
A total of 5284 people were randomised to different antibiotic regimens in the 12 trials (Carsenti‐Etesse 1999; Goldstein 2009; Hashizume 2004; Ishibashi 2009; Ishida 2001; Kaiser 1987; Morimoto 2002; Saadeddin 2005; Saveli 2011; Shime 2007; Stone 2010; Vuorisalo 1998). A total of 580 people were excluded from the analysis in eight trials (Hashizume 2004; Ishida 2001; Kaiser 1987; Morimoto 2002; Saadeddin 2005; Shime 2007; Stone 2010; Vuorisalo 1998). The proportion of drop‐outs in these trials ranged from 2% to 33%. There were no post‐randomisation drop‐outs in one trial (Ishibashi 2009). Information on post‐randomisation drop‐outs was not available in three trials (Carsenti‐Etesse 1999; Hashizume 2004; Saveli 2011). A total of 4704 people were included under the various comparisons. The average age of participants ranged between 54 years and 71 years in the five trials that reported this information (Ishibashi 2009; Ishida 2001; Morimoto 2002; Saadeddin 2005; Stone 2010). Four trials reported adult age as an inclusion criteria (Carsenti‐Etesse 1999; Goldstein 2009; Saadeddin 2005; Stone 2010). One trial stated children as an inclusion criterion (Shime 2007). From the age range of the included participants, it was possible to identify that three trials included adults only (Ishibashi 2009; Ishida 2001; Morimoto 2002). The information on the age of those included was not reported in the remaining trials (Hashizume 2004; Kaiser 1987; Saveli 2011; Vuorisalo 1998). The proportion of females ranged between 20.7% and 100% in the six trials that reported this information (Ishibashi 2009; Ishida 2001; Morimoto 2002; Saadeddin 2005; Stone 2010; Vuorisalo 1998).
Four trials involved elective colorectal surgeries (Goldstein 2009; Hashizume 2004; Ishibashi 2009; Ishida 2001), one trial percutaneous endoscopic gastrostomy (Saadeddin 2005), one trial surgery for breast cancer (Morimoto 2002), two trials cardiac surgery (Shime 2007; Vuorisalo 1998), one trial surgery requiring sternotomy (Kaiser 1987), and two trials involved open fracture fixation (Carsenti‐Etesse 1999; Saveli 2011). In one trial of cardiac surgery, all the participants were either positive for nasal carriage of MRSA or had previous MRSA infections (Shime 2007). However, it is not clear whether MRSA carrier status was treated prior to surgery. One trial clearly stated that the baseline MRSA screening status was not available for participants (Saadeddin 2005). One trial stated that routine screening was used, but, considering that the participants had open fractures, it is highly unlikely that MRSA was eradicated prior to surgery (Saveli 2011). Information about whether people were routinely screened and treated prior to operation was not reported in the remaining trials (Carsenti‐Etesse 1999; Goldstein 2009; Hashizume 2004; Ishibashi 2009; Ishida 2001; Kaiser 1987; Morimoto 2002; Stone 2010; Vuorisalo 1998). From the inclusion criteria in the trials, it appears that all the trials included at least some people without systemic illness such as diabetes.
Nine trials directly compared two prophylactic antibiotic regimens (Carsenti‐Etesse 1999; Goldstein 2009; Hashizume 2004; Ishibashi 2009; Ishida 2001; Morimoto 2002; Saveli 2011; Shime 2007; Vuorisalo 1998). Of the remaining three trials, one compared three prophylactic antibiotic regimens (Stone 2010), one compared four prophylactic antibiotic regimens (Kaiser 1987), and one compared a prophylactic antibiotic regimen with placebo (Saadeddin 2005). A total of 17 comparisons were possible from the data in the 12 included trials. The individual characteristics in trials including inclusion and exclusion criteria, post‐randomisation drop‐outs (and reasons for post‐randomisation drop‐outs), demographic characteristics, antibiotic regimens used, number of people included for analysis for the different antibiotic regimens and the outcomes reported are summarised in Characteristics of included studies.
Excluded studies
A total of 22 studies were excluded for the reasons stated in Characteristics of excluded studies. Three reports were not RCTs (Al‐Mukhtar 2009; Diehr 2007; Kato 2006); five studies were quasi‐randomised studies (Finkelstein 2002; Kanellakopoulou 2009; Salminen 1999; Tacconelli 2008; Tyllianakis 2010); 12 studies did not report the methicillin resistance status of the cultured organisms (Bluhm 1984; Dhadwal 2007; Frimodt‐Moller 1982; Keighley 1979; Maki 1992; Marroni 1999; Mindermann 1993; Palmer 1995; Ramos 2008; Saginur 2000; Weaver 1986; Wilson 1988); and two studies did not report the methicillin resistance status for all staphylococcal infections (i.e. the methicillin resistance was stated for staphylococcal infections at some sites, but not at others) (Cann 1988; Poon 1998).
Risk of bias in included studies
All the trials were judged to be at high risk of bias as shown in Figure 2 and Figure 3.
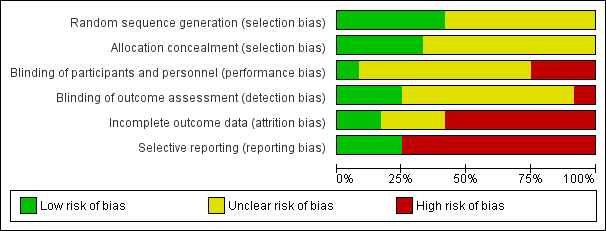
Risk of bias graph: review authors' judgements about each risk of bias item presented as percentages across all included studies
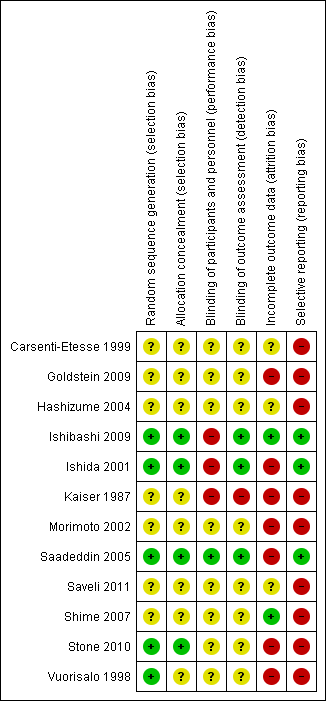
Risk of bias summary: review authors' judgements about each risk of bias item for each included study
Allocation
Four trials reported acceptable methods of random sequence generation and allocation concealment (Ishibashi 2009; Ishida 2001; Saadeddin 2005; Stone 2010). These four trials were also free from selection bias. One other trial reported an acceptable method of random sequence generation, but did not report on allocation concealment (Vuorisalo 1998). The remaining seven trials did not report on random sequence generation or allocation concealment (Carsenti‐Etesse 1999; Goldstein 2009; Hashizume 2004; Kaiser 1987; Morimoto 2002; Saveli 2011; Shime 2007). Eight trials were at unclear risk of selection bias (Carsenti‐Etesse 1999; Goldstein 2009; Hashizume 2004; Kaiser 1987; Morimoto 2002; Saveli 2011; Shime 2007; Vuorisalo 1998).
Blinding
Adequate blinding of participants, personnel and outcome assessors was reported in one trial (Saadeddin 2005); this trial was free from performance bias and detection bias (Saadeddin 2005). Two trials reported adequate blinding of outcome assessors (Ishibashi 2009; Ishida 2001), but had inadequate blinding of participants or personnel; these trials were free from detection bias but not performance bias. In one trial, blinding of participants, personnel or outcome assessors was not performed (Kaiser 1987); this trial was of high risk of performance bias and detection bias. Information on blinding was not available in the remaining eight trials (Carsenti‐Etesse 1999; Goldstein 2009; Hashizume 2004; Morimoto 2002; Saveli 2011; Shime 2007; Stone 2010; Vuorisalo 1998); these trials were at unclear risk of performance bias and detection bias.
Incomplete outcome data
One trial had no post‐randomisation drop‐outs and was free from attrition bias (Ishibashi 2009). In one trial, the imputation of missing outcome data under different scenarios did not influence the results and so the impact of post‐randomisation drop‐outs in this trial was minimal as shown in the section 'Sensitivity analysis' (Shime 2007). This trial was also considered to be low risk of attrition bias. There was unclear or high risk of attrition bias in the remaining trials (Carsenti‐Etesse 1999; Goldstein 2009; Hashizume 2004; Ishida 2001; Kaiser 1987; Morimoto 2002; Saadeddin 2005; Saveli 2011; Stone 2010; Vuorisalo 1998).
Selective reporting
Important outcomes such as mortality, antibiotic‐related serious adverse events, overall SSIs and MRSA related SSIs were reported in three trials (Ishibashi 2009; Ishida 2001; Saadeddin 2005). These three trials were considered to be at low risk of reporting bias, while the remaining trials were considered to be at high risk of reporting bias.
Other potential sources of bias
There were no other potential sources of bias in the remaining trials.
Effects of interventions
See: Summary of findings for the main comparison Antibiotic prophylaxis for the prevention of methicillin‐resistant Staphylococcus aureus (MRSA) infections and related complications in surgical patients: mortality; Summary of findings 2 Antibiotic prophylaxis for the prevention of methicillin‐resistant Staphylococcus aureus (MRSA) infections and related complications in surgical patients: surgical site infection; Summary of findings 3 Antibiotic prophylaxis for the prevention of methicillin‐resistant Staphylococcus aureus (MRSA) infections and related complications in surgical patients: MRSA surgical site infection; Summary of findings 4 Antibiotic prophylaxis for the prevention of methicillin‐resistant Staphylococcus aureus (MRSA) infections and related complications in surgical patients: overall MRSA infections
There was not sufficient clinical homogeneity amongst the included studies to perform a meta‐analysis. The effects of interventions are summarised in summary of findings Table for the main comparison; summary of findings Table 2; summary of findings Table 3; and summary of findings Table 4.
All‐cause mortality at maximal follow‐up
Four trials reported mortality (Ishibashi 2009; Ishida 2001; Saadeddin 2005; Vuorisalo 1998), with participants followed up until: discharge (Ishida 2001); seven days after the procedure (Saadeddin 2005); one month after the procedure (Ishibashi 2009); and one month after discharge (Vuorisalo 1998). One trial compared a prophylactic antibiotic regimen versus placebo for control (Saadeddin 2005), while the remaining trials compared different antibiotic regimens (Ishibashi 2009; Ishida 2001; Vuorisalo 1998). The overall mortality in these four trials was 14/1401 (1.0%) (Ishibashi 2009; Ishida 2001; Saadeddin 2005; Vuorisalo 1998). There were no significant differences in mortality between the intervention and control groups in any of the four comparisons (Analysis 1.1). Using Peto OR as the effect measure (as the proportion of people was fractionally less than 1.0%) did not alter the results.
Other serious adverse events
None of the trials reported on overall serious adverse events. Four trials reported serious adverse events related to antibiotics (Ishibashi 2009; Ishida 2001; Saadeddin 2005; Saveli 2011). One of these trials compared an antibiotic regimen with placebo as control (Saadeddin 2005), while the remaining trials compared different antibiotic regimens directly (Ishibashi 2009; Ishida 2001; Saveli 2011). There were no antibiotic‐related serious adverse events in any of the 561 people randomised to the seven different antibiotic regimens in these four trials (Ishibashi 2009; Ishida 2001; Saadeddin 2005; Saveli 2011).
Quality of life
None of the trials reported quality of life.
Total length of hospital stay
None of the trials reported the total length of hospital stay.
Use of healthcare resources
None of the trials reported the use of healthcare resources.
Surgical site infections due to all organisms
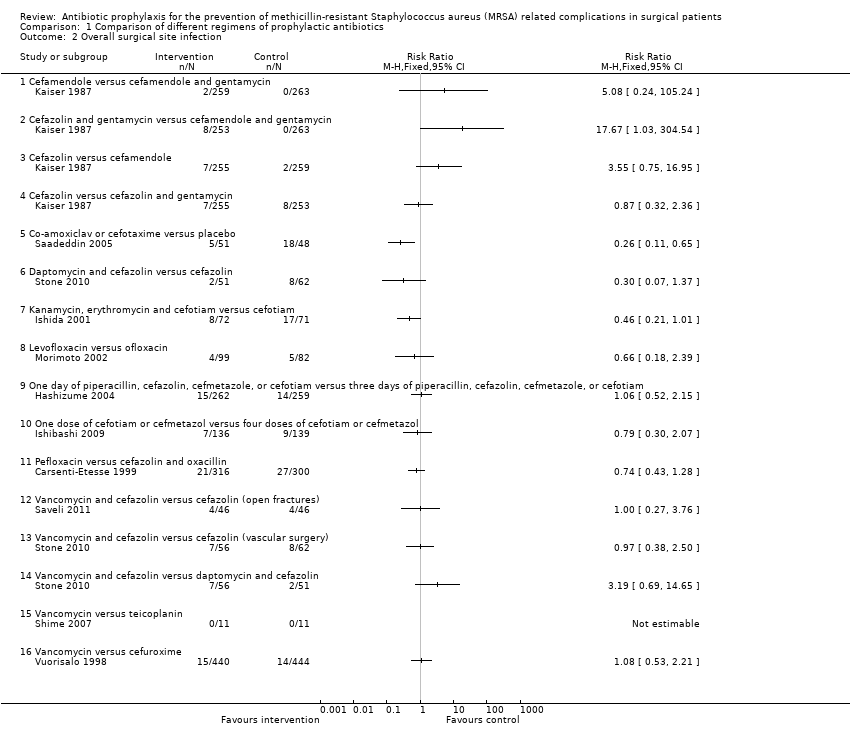
Eleven trials reported SSIs in the different groups (Carsenti‐Etesse 1999; Hashizume 2004; Ishibashi 2009; Ishida 2001; Kaiser 1987; Morimoto 2002; Saadeddin 2005; Saveli 2011; Shime 2007; Stone 2010; Vuorisalo 1998). One trial compared an antibiotic regimen with placebo as control (Saadeddin 2005), while the remaining trials directly compared different antibiotic regimens. Overall, 221/4032 (5.5%) people developed SSIs due to all organisms. There were no significant differences in the proportion of people who developed SSIs between any of the 15 comparisons involving direct comparison of one antibiotic regimen with another (Analysis 1.2). In the comparison involving antibiotic regimen with placebo, the proportion of people who developed SSIs was statistically significantly lower in people who received the antibiotic prophylaxis with co‐amoxiclav or cefotaxime compared with placebo (RR 0.26; 95% CI 0.11 to 0.65; Analysis 1.2) (Saadeddin 2005).
MRSA surgical site infections
All 12 included trials reported SSIs due to MRSA in the different groups. One trial compared an antibiotic regimen with placebo as control (Saadeddin 2005), while the remaining trials compared different antibiotic regimens. Overall, 46/4704 (1.0%) people developed SSIs due to MRSA. There were no significant differences in the proportion of people who developed SSIs due to MRSA between any of the 16 comparisons involving comparison of one antibiotic regimen with another (Analysis 1.3). In the comparison involving prophylactic antibiotic regimen with placebo, the proportion of people who developed SSIs due to MRSA was statistically significantly lower in people who received the antibiotic prophylaxis with co‐amoxiclav or cefotaxime compared with placebo (RR 0.05; 95% CI 0.00 to 0.83). Using Peto OR as the effect measure (as the proportion of people was fractionally less than 1.0%) did not alter the results.
MRSA infections at any site
Two trials reported overall MRSA infections in the different groups (Ishibashi 2009; Ishida 2001); both trials compared different antibiotic regimens. Overall, 19/478 (4.5%) people developed MRSA infections including SSI, chest infection and bacteraemia. There were no significant differences in the proportion of people who developed MRSA infections at any location in these two comparisons (Analysis 1.4).
Statistical variations
The issue of fixed‐effect versus random‐effects meta‐analysis did not arise because only one trial was included for each comparison. As meta‐analysis was not performed, we did not calculate the risk difference in order to assess the impact of the trials with zero events on the meta‐analysis results.
Subgroup analysis
We did not perform any subgroup analysis, as only one trial was included for each outcome.
Sensitivity analysis
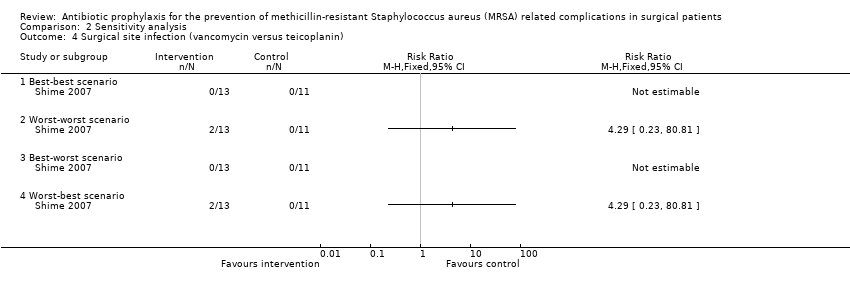
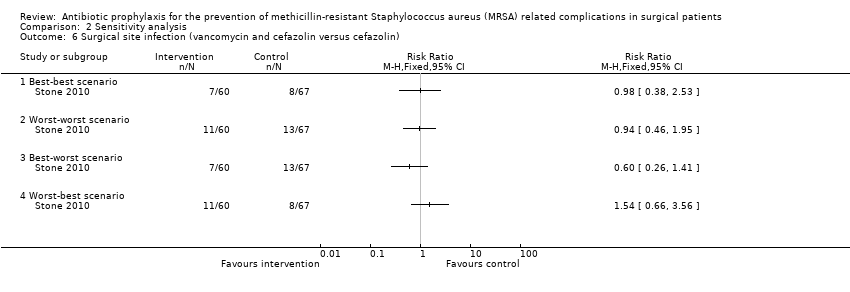
One trial had no post‐randomisation drop‐out (Ishibashi 2009). In three trials, it was not possible to determine whether there were any post‐randomisation drop‐outs (Carsenti‐Etesse 1999; Hashizume 2004; Saveli 2011). In four trials, although there were post‐randomisation drop‐outs, the groups to which the drop‐outs belonged were not reported (Goldstein 2009; Kaiser 1987; Morimoto 2002; Saadeddin 2005). Sensitivity analysis using imputation of missing outcome data under different scenarios was either not relevant, or could not be performed in these eight trials. Sensitivity analysis using imputation of missing outcome data under different scenarios was performed for six comparisons reported in four trials (Ishida 2001; Shime 2007; Stone 2010; Vuorisalo 1998). In one trial that reported SSI and MRSA SSI (Shime 2007), there was no change in the results when results were imputed under different scenarios (Analysis 2.4; Analysis 2.10). In another trial that reported mortality, SSI and MRSA SSI (Vuorisalo 1998), all the outcomes were sensitive to imputation under different scenarios (Analysis 2.2; Analysis 2.8; Analysis 2.14). In the remaining two trials (Ishida 2001; Stone 2010), some of the outcomes were sensitive to imputation under different scenarios (Analysis 2.3; Analysis 2.5; Analysis 2.7), while others were not sensitive (Analysis 2.1; Analysis 2.6; Analysis 2.9; Analysis 2.11; Analysis 2.12; Analysis 2.13; Analysis 2.15).
Reporting bias
Since only one trial was included for each comparison, we did not explore reporting bias using a funnel plot.
Discussion
Summary of main results
In this review, we compared the efficacy of different antibiotic prophylaxis regimens including no antibiotic prophylaxis in preventing MRSA and related postoperative complications in people undergoing surgery. A total of 16 comparisons of different antibiotic regimens were performed in 11 trials (Carsenti‐Etesse 1999; Goldstein 2009; Hashizume 2004; Ishibashi 2009; Ishida 2001; Kaiser 1987; Morimoto 2002; Saveli 2011; Shime 2007; Stone 2010; Vuorisalo 1998). Antibiotic prophylaxis was compared with no antibiotic prophylaxis in one trial (Saadeddin 2005). A total of 4704 people undergoing various types of surgery were included under the different comparisons in this review. Except for one trial where all the participants were either positive for nasal carriage of MRSA or had previous MRSA infections (no information provided on whether MRSA carriers were treated prior to surgery) (Shime 2007) , it does not appear that MRSA was eradicated prior to surgery; nor does it appear that there was high prevalence of MRSA carrier status in the people undergoing surgery. The overall short‐term mortality after surgery in four trials that reported mortality was 1.0% (14/1401) (Ishibashi 2009; Ishida 2001; Saadeddin 2005; Vuorisalo 1998). Overall, 221/4032 (5.5%) people developed SSIs due to all organisms (Carsenti‐Etesse 1999; Hashizume 2004; Ishibashi 2009; Ishida 2001; Kaiser 1987; Morimoto 2002; Saadeddin 2005; Saveli 2011; Shime 2007; Stone 2010; Vuorisalo 1998), and 46/4704 (1.0%) people developed SSIs due to MRSA (Carsenti‐Etesse 1999; Goldstein 2009; Hashizume 2004; Ishibashi 2009; Ishida 2001; Kaiser 1987; Morimoto 2002; Saadeddin 2005; Saveli 2011; Shime 2007; Stone 2010; Vuorisalo 1998).
One trial including 99 participants compared prophylactic co‐amoxiclav with placebo in people undergoing percutaneous endoscopic gastrostomy (Saadeddin 2005). In this trial, the proportion of people who developed SSIs due to all organisms and those developed SSIs due to MRSA was lower in the antibiotic prophylaxis group compared with placebo (Saadeddin 2005). Although co‐amoxiclav has significant in‐vitro activity against some strains of MRSA (Alou 2004; Cantoni 1989; Prieto 1998), there is no evidence for significant clinical activity of co‐amoxiclav and it is not one of the antibiotics recommended for MRSA infections (Liu 2011). The probable way that co‐amoxiclav decreased MRSA infections was by decreasing the overall infection level, thereby preventing the wounds from becoming infected secondarily.
There were no significant differences in short‐term mortality, SSIs, MRSA SSIs or overall MRSA infections in any of these comparisons. These comparisons included additional antibiotics or increased duration of antibiotics. There is currently no evidence that any of the important clinical outcomes are affected by the addition of antibiotics or increased duration of antibiotics. Although, there were no serious adverse events in any of the 561 people randomised to the seven different antibiotic regimens in four trials (Ishibashi 2009; Ishida 2001; Saadeddin 2005; Saveli 2011) (this information was not reported in the remaining eight trials (Carsenti‐Etesse 1999; Goldstein 2009; Hashizume 2004; Kaiser 1987; Morimoto 2002; Shime 2007; Stone 2010; Vuorisalo 1998)), there are various concerns about increasing the duration or the number of antibiotics in the antibiotic combination. The obvious concern is the cost of the antibiotics. This is important in state‐funded, insurance‐funded, and private‐funded healthcare systems, as unnecessary use of antibiotics increases the cost of procedures (besides the cost of the antibiotic per se, one should also consider the costs for administering the antibiotics). At the individual level, antibiotic‐related adverse events may delay recovery after surgery. While adverse events such as nausea or other gastrointestinal upsets may not be serious adverse events, and are unlikely to be major determinants of the decision about the antibiotic regimens, these mild adverse events may prevent the participant from returning to normal activities, and hence may delay recovery. Although most adverse events related to antibiotics can be managed easily, some adverse events such as severe anaphylactic shock or antibiotic‐related infections (by decreasing the gut flora ‐ for example antibiotic‐induced Clostridium difficile infection can cause pseudomembranous colitis) can be life‐threatening (Schroeder 2005). At the community level, inappropriate and unnecessary use of antibiotics can lead to the development of drug resistance (Sieradzki 1999; Chua 2008), which could be problematic for future populations.
Overall completeness and applicability of evidence
A range of surgeries ranging from moderate to major surgeries were included in this review. So, this review is applicable to most types of surgery. This review is applicable only to people who do not have existing MRSA infections. The people included in this review did not appear to be particularly immunocompromised, so the results of this review are not applicable for immunocompromised people.
Quality of the evidence
The overall quality of the evidence is either low, or very low, as shown in summary of findings Table for the main comparison; summary of findings Table 2; summary of findings Table 3; and summary of findings Table 4. The risk of bias was high in all the trials. By using and reporting an appropriate method of randomisation, selection bias could be minimised. In most instances where different antibiotic regimens are compared, it is possible to blind the participants, personnel and outcome assessors by the use of an appropriate placebo. This minimises the performance and detection bias. By performing an intention‐to‐treat analysis, it is possible to decrease attrition bias. By reporting the important clinical outcomes that are likely to be measured routinely, such as mortality, morbidity, antibiotic‐related adverse events, and length of hospital stay, selective outcome reporting could be minimised. Measuring the quality of life and health resource utilisation measures such as hospital or community nurse visits, wound dressings, etc would allow an health economic analysis to determine the cost‐effectiveness of using different antibiotics. Apart from the risk of bias, the other quality issue was that the effect measures were imprecise, i.e. the confidence intervals were wide and one could not rule out a clinically significant benefit or harm related to different antibiotic regimens. This issue can be addressed by appropriate sample size calculations prior to conducting a trial. In spite of all the shortcomings, this is the best available evidence on this topic.
Potential biases in the review process
We have performed a thorough search of the literature without any restrictions regarding language or date of publication. In spite of this, we were not be able to identify any trials that were conducted, but not reported, in the pre‐mandatory trial registration era. We included only trials in which MRSA infection was mentioned. It is highly likely that several other trials on antibiotic regimens have been conducted without assessing or reporting the methicillin resistance status of the organisms. The nature of this topic means that one has to be pragmatic and accept that such trials are unlikely to be identified electronically, and that contacting the authors of every single trial that has assessed prophylactic antibiotics to obtain information regarding whether they measured the MRSA status of the organisms, and to obtain information in a such way that it could be used for this systematic review would be resource intensive. The reliability of information obtained in this manner can also be a major concern.
Agreements and disagreements with other studies or reviews
There have been no previous systematic reviews on this topic.

Study flow diagram.

Risk of bias graph: review authors' judgements about each risk of bias item presented as percentages across all included studies

Risk of bias summary: review authors' judgements about each risk of bias item for each included study
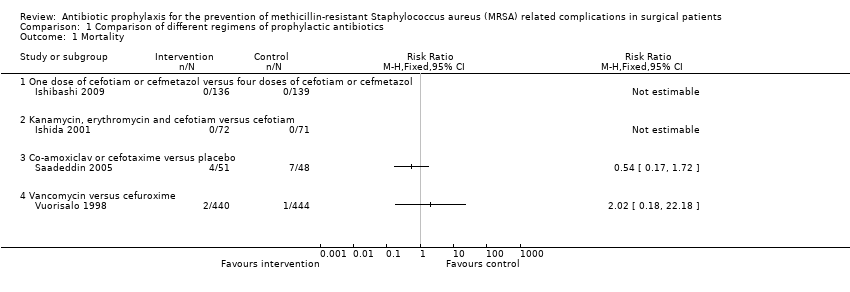
Comparison 1 Comparison of different regimens of prophylactic antibiotics, Outcome 1 Mortality.
Comparison 1 Comparison of different regimens of prophylactic antibiotics, Outcome 2 Overall surgical site infection.

Comparison 1 Comparison of different regimens of prophylactic antibiotics, Outcome 3 MRSA surgical site infection.
Comparison 1 Comparison of different regimens of prophylactic antibiotics, Outcome 4 Overall MRSA infections.

Comparison 2 Sensitivity analysis, Outcome 1 Mortality (kanamycin, erythromycin and cefotiam versus cefotiam).

Comparison 2 Sensitivity analysis, Outcome 2 Mortality (vancomycin versus cefuroxime).

Comparison 2 Sensitivity analysis, Outcome 3 Surgical site infection (kanamycin, erythromycin and cefotiam versus cefotiam).
Comparison 2 Sensitivity analysis, Outcome 4 Surgical site infection (vancomycin versus teicoplanin).

Comparison 2 Sensitivity analysis, Outcome 5 Surgical site infection (vancomycin and cefazolin versus daptomycin and cefazolin).
Comparison 2 Sensitivity analysis, Outcome 6 Surgical site infection (vancomycin and cefazolin versus cefazolin).

Comparison 2 Sensitivity analysis, Outcome 7 Surgical site infection (daptomycin and cefazolin versus cefazolin).

Comparison 2 Sensitivity analysis, Outcome 8 Surgical site infection (vancomycin versus cefuroxime).

Comparison 2 Sensitivity analysis, Outcome 9 MRSA surgical site infection (kanamycin, erythromycin and cefotiam versus cefotiam).
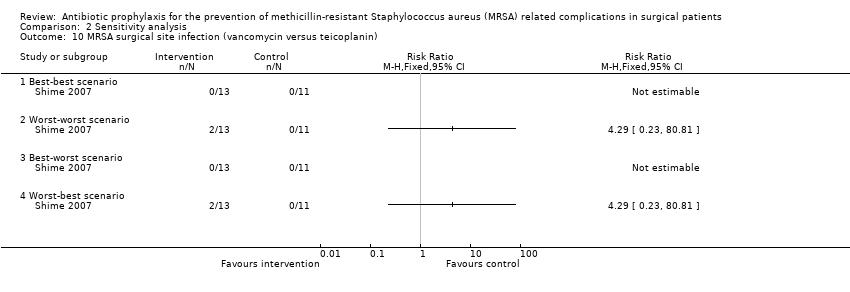
Comparison 2 Sensitivity analysis, Outcome 10 MRSA surgical site infection (vancomycin versus teicoplanin).
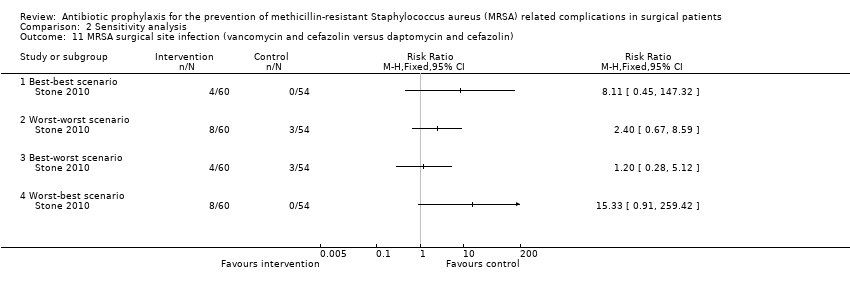
Comparison 2 Sensitivity analysis, Outcome 11 MRSA surgical site infection (vancomycin and cefazolin versus daptomycin and cefazolin).

Comparison 2 Sensitivity analysis, Outcome 12 MRSA surgical site infection (vancomycin and cefazolin versus cefazolin).
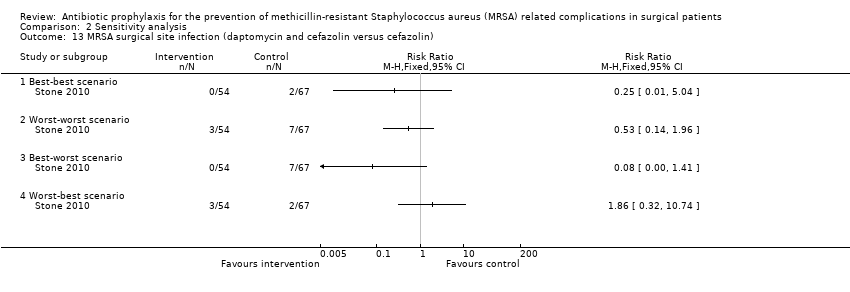
Comparison 2 Sensitivity analysis, Outcome 13 MRSA surgical site infection (daptomycin and cefazolin versus cefazolin).

Comparison 2 Sensitivity analysis, Outcome 14 MRSA surgical site infection (vancomycin versus cefuroxime).
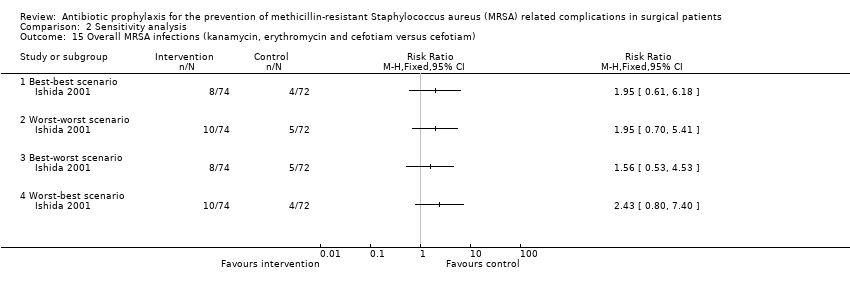
Comparison 2 Sensitivity analysis, Outcome 15 Overall MRSA infections (kanamycin, erythromycin and cefotiam versus cefotiam).
| Mortality | |||||
| Patient or population: surgical patients | |||||
| Comparisons | Illustrative comparative risks* (95% CI) | Relative effect | No of Participants | Quality of the evidence | |
| Assumed risk | Corresponding risk | ||||
| Control | Comparison of different regimens of prophylactic antibiotic regimens | ||||
| One dose of cefotiam or cefmetazol versus four doses of cefotiam or cefmetazol (elective surgery for colon cancer) | See comment | See comment | Not estimable | 275 | ⊕⊝⊝⊝ |
| Kanamycin, erythromycin and cefotiam versus cefotiam (surgery for colorectal diseases) | See comment | See comment | Not estimable | 143 | ⊕⊝⊝⊝ |
| Co‐amoxiclav or cefotaxime versus placebo (percutaneous endoscopic gastrostomy) | 146 per 1000 | 79 per 1000 | RR 0.54 | 99 | ⊕⊝⊝⊝ |
| Vancomycin versus cefuroxime (coronary artery bypass graft without valvular disease) | 2 per 1000 | 5 per 1000 | RR 2.02 | 884 | ⊕⊝⊝⊝ |
| *The basis for the assumed risk is the control group risk in the study. The corresponding risk (and its 95% confidence interval) is based on the assumed risk in the comparison group and the relative effect of the intervention (and its 95% CI). | |||||
| GRADE Working Group grades of evidence: | |||||
| 1 The risk of bias in the trial was high | |||||
| Surgical site infection | |||||
| Patient or population: surgical patients | |||||
| Comparisons | Illustrative comparative risks* (95% CI) | Relative effect | No of Participants | Quality of the evidence | |
| Assumed risk | Corresponding risk | ||||
| Control | Comparison of different regimens of prophylactic antibiotic regimens | ||||
| Cefamendole versus cefamendole and gentamycin (median sternotomy) | Moderate | RR 5.08 | 522 | ⊕⊝⊝⊝ | |
| 5 per 1000 | 25 per 1000 | ||||
| Cefazolin versus cefamendole (median sternotomy) | 8 per 1000 | 27 per 1000 | RR 3.55 | 514 | ⊕⊝⊝⊝ |
| Cefazolin versus cefazolin and gentamycin (median sternotomy) | 32 per 1000 | 28 per 1000 | RR 0.87 | 508 | ⊕⊝⊝⊝ |
| Co‐amoxiclav or cefotaxime versus placebo (percutaneous endoscopic gastrostomy) | 375 per 1000 | 98 per 1000 | RR 0.26 | 99 | ⊕⊕⊝⊝ |
| Daptomycin and cefazolin versus cefazolin (vascular surgery) | 129 per 1000 | 39 per 1000 | RR 0.3 | 113 | ⊕⊝⊝⊝ |
| Kanamycin, erythromycin and cefotiam versus cefotiam (surgery for colorectal diseases) | 239 per 1000 | 110 per 1000 | RR 0.46 | 143 | ⊕⊝⊝⊝ |
| Levofloxacin versus ofloxacin (breast cancer) | 61 per 1000 | 40 per 1000 | RR 0.66 | 181 | ⊕⊝⊝⊝ |
| One day of piperacillin, cefazolin, cefmetazole, or cefotiam versus three days of piperacillin, cefazolin, cefmetazole, or cefotiam (elective colorectal surgery) | 54 per 1000 | 57 per 1000 | RR 1.06 | 521 | ⊕⊝⊝⊝ |
| One dose of cefotiam or cefmetazol versus four doses of cefotiam or cefmetazol (elective surgery for colon cancer) | 65 per 1000 | 51 per 1000 | RR 0.79 | 275 | ⊕⊝⊝⊝ |
| Pefloxacin versus cefazolin and oxacillin (tibial fracture requiring external fixation) | 90 per 1000 | 67 per 1000 | RR 0.74 | 616 | ⊕⊝⊝⊝ |
| Vancomycin and cefazolin versus cefazolin (open fractures) | 87 per 1000 | 87 per 1000 | RR 1 | 92 | ⊕⊝⊝⊝ |
| Vancomycin and cefazolin versus cefazolin (vascular surgery) ‐ suggest add for all comparisons | 129 per 1000 | 125 per 1000 | RR 0.97 | 118 | ⊕⊝⊝⊝ |
| Vancomycin and cefazolin versus daptomycin and cefazolin (vascular surgery) | 39 per 1000 | 125 per 1000 | RR 3.19 | 107 | ⊕⊝⊝⊝ |
| Vancomycin versus teicoplanin (paediatric cardiac surgery) | No infection in either group | Not estimable | 22 | ⊕⊝⊝⊝ | |
| Vancomycin versus cefuroxime (coronary artery bypass graft without valvular disease) | 32 per 1000 | 34 per 1000 | RR 1.08 | 884 | ⊕⊝⊝⊝ |
| *The basis for the assumed risk is the control group risk in the study. When there were no events in either group, we have indicated so. When there were events in the intervention group but not in the control group, we have used a moderate proportion of 0.5% in the control group. The corresponding risk (and its 95% confidence interval) is based on the assumed risk in the comparison group and the relative effect of the intervention (and its 95% CI). | |||||
| GRADE Working Group grades of evidence: | |||||
| 1 The risk of bias in the trial was high | |||||
| MRSA surgical site infection | |||||
| Patient or population: surgical patients | |||||
| Comparisons | Illustrative comparative risks* (95% CI) | Relative effect | No of Participants | Quality of the evidence | |
| Assumed risk | Corresponding risk | ||||
| Control | Comparison of different regimens of prophylactic antibiotic regimens | ||||
| Cefamendole versus cefamendole and gentamycin (median sternotomy) | No infection in either group | Not estimable | 522 | ⊕⊝⊝⊝ | |
| Cefazolin and gentamycin versus cefamendole and gentamycin (median sternotomy) | No infection in either group | Not estimable | 516 | ⊕⊝⊝⊝ | |
| Cefazolin versus cefamendole (median sternotomy) | Moderate | RR 3.05 | 514 | ⊕⊝⊝⊝ | |
| 5 per 1000 | 15 per 1000 | ||||
| Cefazolin versus cefazolin and gentamycin (median sternotomy) | Moderate | RR 2.98 | 508 | ⊕⊝⊝⊝ | |
| 5 per 1000 | 15 per 1000 | ||||
| Co‐amoxiclav or cefotaxime versus placebo (percutaneous endoscopic gastrostomy) | 188 per 1000 | 9 per 1000 | RR 0.05 | 99 | ⊕⊕⊝⊝ |
| Daptomycin and cefazolin versus cefazolin (vascular surgery) | 32 per 1000 | 8 per 1000 | RR 0.24 | 113 | ⊕⊝⊝⊝ |
| Ertapenem versus cefotetan (elective colorectal surgery) | 15 per 1000 | 9 per 1000 | RR 0.59 | 672 | ⊕⊝⊝⊝ |
| Kanamycin, erythromycin and cefotiam versus cefotiam (surgery for colorectal diseases) | 28 per 1000 | 55 per 1000 | RR 1.97 | 143 | ⊕⊝⊝⊝ |
| Levofloxacin versus ofloxacin (breast cancer) | No infection in either group | Not estimable | 181 | ⊕⊝⊝⊝ | |
| One day of piperacillin, cefazolin, cefmetazole, or cefotiam versus three days of piperacillin, cefazolin, cefmetazole, or cefotiam (elective colorectal surgery) | No infection in either group | Not estimable | 521 | ⊕⊝⊝⊝ | |
| One dose of cefotiam or cefmetazol versus four doses of cefotiam or cefmetazol (elective surgery for colon cancer) | 22 per 1000 | 22 per 1000 | RR 1.02 | 275 | ⊕⊝⊝⊝ |
| Pefloxacin versus cefazolin and oxacillin (tibial fracture requiring external fixation) | 3 per 1000 | 13 per 1000 | RR 3.8 | 616 | ⊕⊝⊝⊝ |
| Vancomycin and cefazolin versus cefazolin (open fractures) | Moderate | RR 3 | 92 | ⊕⊝⊝⊝ | |
| 5 per 1000 | 15 per 1000 | ||||
| Vancomycin and cefazolin versus cefazolin (vascular surgery) | 32 per 1000 | 71 per 1000 | RR 2.21 | 118 | ⊕⊝⊝⊝ |
| Vancomycin and cefazolin versus daptomycin and cefazolin (vascular surgery) | Moderate | RR 8.21 | 107 | ⊕⊝⊝⊝ | |
| 5 per 1000 | 41 per 1000 | ||||
| Vancomycin versus teicoplanin (paediatric cardiac surgery) | No infection in either group | Not estimable | 22 | ⊕⊝⊝⊝ | |
| Vancomycin versus cefuroxime (coronary artery bypass graft without valvular disease) | 5 per 1000 | 5 per 1000 | RR 1.01 | 884 | ⊕⊝⊝⊝ |
| *The basis for the assumed risk is the control group risk in the study. When there were no events in either group, we have indicated so. When there were events in the intervention group but not in the control group, we have used a moderate proportion of 0.5% in the control group. The corresponding risk (and its 95% confidence interval) is based on the assumed risk in the comparison group and the relative effect of the intervention (and its 95% CI). | |||||
| GRADE Working Group grades of evidence: | |||||
| 1 The risk of bias in the trial was high | |||||
| Overall MRSA infections | |||||
| Patient or population: surgical patients | |||||
| Comparisons | Illustrative comparative risks* (95% CI) | Relative effect | No of Participants | Quality of the evidence | |
| Assumed risk | Corresponding risk | ||||
| Control | Comparison of different regimens of prophylactic antibiotic regimens | ||||
| One dose of cefotiam or cefmetazol versus four doses of cefotiam or cefmetazol (elective surgery for colon cancer) | 29 per 1000 | 22 per 1000 | RR 0.77 | 275 | ⊕⊝⊝⊝ |
| Kanamycin, erythromycin and cefotiam versus cefotiam (surgery for colorectal diseases) | 56 per 1000 | 111 per 1000 | RR 1.97 | 143 | ⊕⊝⊝⊝ |
| *The basis for the assumed risk is the control group risk in the study. The corresponding risk (and its 95% confidence interval) is based on the assumed risk in the comparison group and the relative effect of the intervention (and its 95% CI). | |||||
| GRADE Working Group grades of evidence: | |||||
| 1 The risk of bias in the trial was high. | |||||
| Outcome or subgroup title | No. of studies | No. of participants | Statistical method | Effect size |
| 1 Mortality Show forest plot | 4 | Risk Ratio (M‐H, Fixed, 95% CI) | Totals not selected | |
| 1.1 One dose of cefotiam or cefmetazol versus four doses of cefotiam or cefmetazol | 1 | Risk Ratio (M‐H, Fixed, 95% CI) | 0.0 [0.0, 0.0] | |
| 1.2 Kanamycin, erythromycin and cefotiam versus cefotiam | 1 | Risk Ratio (M‐H, Fixed, 95% CI) | 0.0 [0.0, 0.0] | |
| 1.3 Co‐amoxiclav or cefotaxime versus placebo | 1 | Risk Ratio (M‐H, Fixed, 95% CI) | 0.0 [0.0, 0.0] | |
| 1.4 Vancomycin versus cefuroxime | 1 | Risk Ratio (M‐H, Fixed, 95% CI) | 0.0 [0.0, 0.0] | |
| 2 Overall surgical site infection Show forest plot | 11 | Risk Ratio (M‐H, Fixed, 95% CI) | Totals not selected | |
| 2.1 Cefamendole versus cefamendole and gentamycin | 1 | Risk Ratio (M‐H, Fixed, 95% CI) | 0.0 [0.0, 0.0] | |
| 2.2 Cefazolin and gentamycin versus cefamendole and gentamycin | 1 | Risk Ratio (M‐H, Fixed, 95% CI) | 0.0 [0.0, 0.0] | |
| 2.3 Cefazolin versus cefamendole | 1 | Risk Ratio (M‐H, Fixed, 95% CI) | 0.0 [0.0, 0.0] | |
| 2.4 Cefazolin versus cefazolin and gentamycin | 1 | Risk Ratio (M‐H, Fixed, 95% CI) | 0.0 [0.0, 0.0] | |
| 2.5 Co‐amoxiclav or cefotaxime versus placebo | 1 | Risk Ratio (M‐H, Fixed, 95% CI) | 0.0 [0.0, 0.0] | |
| 2.6 Daptomycin and cefazolin versus cefazolin | 1 | Risk Ratio (M‐H, Fixed, 95% CI) | 0.0 [0.0, 0.0] | |
| 2.7 Kanamycin, erythromycin and cefotiam versus cefotiam | 1 | Risk Ratio (M‐H, Fixed, 95% CI) | 0.0 [0.0, 0.0] | |
| 2.8 Levofloxacin versus ofloxacin | 1 | Risk Ratio (M‐H, Fixed, 95% CI) | 0.0 [0.0, 0.0] | |
| 2.9 One day of piperacillin, cefazolin, cefmetazole, or cefotiam versus three days of piperacillin, cefazolin, cefmetazole, or cefotiam | 1 | Risk Ratio (M‐H, Fixed, 95% CI) | 0.0 [0.0, 0.0] | |
| 2.10 One dose of cefotiam or cefmetazol versus four doses of cefotiam or cefmetazol | 1 | Risk Ratio (M‐H, Fixed, 95% CI) | 0.0 [0.0, 0.0] | |
| 2.11 Pefloxacin versus cefazolin and oxacillin | 1 | Risk Ratio (M‐H, Fixed, 95% CI) | 0.0 [0.0, 0.0] | |
| 2.12 Vancomycin and cefazolin versus cefazolin (open fractures) | 1 | Risk Ratio (M‐H, Fixed, 95% CI) | 0.0 [0.0, 0.0] | |
| 2.13 Vancomycin and cefazolin versus cefazolin (vascular surgery) | 1 | Risk Ratio (M‐H, Fixed, 95% CI) | 0.0 [0.0, 0.0] | |
| 2.14 Vancomycin and cefazolin versus daptomycin and cefazolin | 1 | Risk Ratio (M‐H, Fixed, 95% CI) | 0.0 [0.0, 0.0] | |
| 2.15 Vancomycin versus teicoplanin | 1 | Risk Ratio (M‐H, Fixed, 95% CI) | 0.0 [0.0, 0.0] | |
| 2.16 Vancomycin versus cefuroxime | 1 | Risk Ratio (M‐H, Fixed, 95% CI) | 0.0 [0.0, 0.0] | |
| 3 MRSA surgical site infection Show forest plot | 12 | Risk Ratio (M‐H, Fixed, 95% CI) | Totals not selected | |
| 3.1 Cefamendole versus cefamendole and gentamycin | 1 | Risk Ratio (M‐H, Fixed, 95% CI) | 0.0 [0.0, 0.0] | |
| 3.2 Cefazolin and gentamycin versus cefamendole and gentamycin | 1 | Risk Ratio (M‐H, Fixed, 95% CI) | 0.0 [0.0, 0.0] | |
| 3.3 Cefazolin versus cefamendole | 1 | Risk Ratio (M‐H, Fixed, 95% CI) | 0.0 [0.0, 0.0] | |
| 3.4 Cefazolin versus cefazolin and gentamycin | 1 | Risk Ratio (M‐H, Fixed, 95% CI) | 0.0 [0.0, 0.0] | |
| 3.5 Co‐amoxiclav or cefotaxime versus placebo | 1 | Risk Ratio (M‐H, Fixed, 95% CI) | 0.0 [0.0, 0.0] | |
| 3.6 Daptomycin and cefazolin versus cefazolin | 1 | Risk Ratio (M‐H, Fixed, 95% CI) | 0.0 [0.0, 0.0] | |
| 3.7 Ertapenem versus cefotetan | 1 | Risk Ratio (M‐H, Fixed, 95% CI) | 0.0 [0.0, 0.0] | |
| 3.8 Kanamycin, erythromycin and cefotiam versus cefotiam | 1 | Risk Ratio (M‐H, Fixed, 95% CI) | 0.0 [0.0, 0.0] | |
| 3.9 Levofloxacin versus ofloxacin | 1 | Risk Ratio (M‐H, Fixed, 95% CI) | 0.0 [0.0, 0.0] | |
| 3.10 One day of piperacillin, cefazolin, cefmetazole, or cefotiam versus three days of piperacillin, cefazolin, cefmetazole, or cefotiam | 1 | Risk Ratio (M‐H, Fixed, 95% CI) | 0.0 [0.0, 0.0] | |
| 3.11 One dose of cefotiam or cefmetazol versus four doses of cefotiam or cefmetazol | 1 | Risk Ratio (M‐H, Fixed, 95% CI) | 0.0 [0.0, 0.0] | |
| 3.12 Pefloxacin versus cefazolin and oxacillin | 1 | Risk Ratio (M‐H, Fixed, 95% CI) | 0.0 [0.0, 0.0] | |
| 3.13 Vancomycin and cefazolin versus cefazolin (open fractures) | 1 | Risk Ratio (M‐H, Fixed, 95% CI) | 0.0 [0.0, 0.0] | |
| 3.14 Vancomycin and cefazolin versus cefazolin (vascular surgery) | 1 | Risk Ratio (M‐H, Fixed, 95% CI) | 0.0 [0.0, 0.0] | |
| 3.15 Vancomycin and cefazolin versus daptomycin and cefazolin | 1 | Risk Ratio (M‐H, Fixed, 95% CI) | 0.0 [0.0, 0.0] | |
| 3.16 Vancomycin versus teicoplanin | 1 | Risk Ratio (M‐H, Fixed, 95% CI) | 0.0 [0.0, 0.0] | |
| 3.17 Vancomycin versus cefuroxime | 1 | Risk Ratio (M‐H, Fixed, 95% CI) | 0.0 [0.0, 0.0] | |
| 4 Overall MRSA infections Show forest plot | 2 | Risk Ratio (M‐H, Fixed, 95% CI) | Totals not selected | |
| 4.1 One dose of cefotiam or cefmetazol versus four doses of cefotiam or cefmetazol | 1 | Risk Ratio (M‐H, Fixed, 95% CI) | 0.0 [0.0, 0.0] | |
| 4.2 Kanamycin, erythromycin and cefotiam versus cefotiam | 1 | Risk Ratio (M‐H, Fixed, 95% CI) | 0.0 [0.0, 0.0] | |
| Outcome or subgroup title | No. of studies | No. of participants | Statistical method | Effect size |
| 1 Mortality (kanamycin, erythromycin and cefotiam versus cefotiam) Show forest plot | 1 | Risk Ratio (M‐H, Fixed, 95% CI) | Totals not selected | |
| 1.1 Best‐best scenario | 1 | Risk Ratio (M‐H, Fixed, 95% CI) | 0.0 [0.0, 0.0] | |
| 1.2 Worst‐worst scenario | 1 | Risk Ratio (M‐H, Fixed, 95% CI) | 0.0 [0.0, 0.0] | |
| 1.3 Best‐worst scenario | 1 | Risk Ratio (M‐H, Fixed, 95% CI) | 0.0 [0.0, 0.0] | |
| 1.4 Worst‐best scenario | 1 | Risk Ratio (M‐H, Fixed, 95% CI) | 0.0 [0.0, 0.0] | |
| 2 Mortality (vancomycin versus cefuroxime) Show forest plot | 1 | Risk Ratio (M‐H, Fixed, 95% CI) | Totals not selected | |
| 2.1 Best‐best scenario | 1 | Risk Ratio (M‐H, Fixed, 95% CI) | 0.0 [0.0, 0.0] | |
| 2.2 Worst‐worst scenario | 1 | Risk Ratio (M‐H, Fixed, 95% CI) | 0.0 [0.0, 0.0] | |
| 2.3 Best‐worst scenario | 1 | Risk Ratio (M‐H, Fixed, 95% CI) | 0.0 [0.0, 0.0] | |
| 2.4 Worst‐best scenario | 1 | Risk Ratio (M‐H, Fixed, 95% CI) | 0.0 [0.0, 0.0] | |
| 3 Surgical site infection (kanamycin, erythromycin and cefotiam versus cefotiam) Show forest plot | 1 | Risk Ratio (M‐H, Fixed, 95% CI) | Totals not selected | |
| 3.1 Best‐best scenario | 1 | Risk Ratio (M‐H, Fixed, 95% CI) | 0.0 [0.0, 0.0] | |
| 3.2 Worst‐worst scenario | 1 | Risk Ratio (M‐H, Fixed, 95% CI) | 0.0 [0.0, 0.0] | |
| 3.3 Best‐worst scenario | 1 | Risk Ratio (M‐H, Fixed, 95% CI) | 0.0 [0.0, 0.0] | |
| 3.4 Worst‐best scenario | 1 | Risk Ratio (M‐H, Fixed, 95% CI) | 0.0 [0.0, 0.0] | |
| 4 Surgical site infection (vancomycin versus teicoplanin) Show forest plot | 1 | Risk Ratio (M‐H, Fixed, 95% CI) | Totals not selected | |
| 4.1 Best‐best scenario | 1 | Risk Ratio (M‐H, Fixed, 95% CI) | 0.0 [0.0, 0.0] | |
| 4.2 Worst‐worst scenario | 1 | Risk Ratio (M‐H, Fixed, 95% CI) | 0.0 [0.0, 0.0] | |
| 4.3 Best‐worst scenario | 1 | Risk Ratio (M‐H, Fixed, 95% CI) | 0.0 [0.0, 0.0] | |
| 4.4 Worst‐best scenario | 1 | Risk Ratio (M‐H, Fixed, 95% CI) | 0.0 [0.0, 0.0] | |
| 5 Surgical site infection (vancomycin and cefazolin versus daptomycin and cefazolin) Show forest plot | 1 | Risk Ratio (M‐H, Fixed, 95% CI) | Totals not selected | |
| 5.1 Best‐best scenario | 1 | Risk Ratio (M‐H, Fixed, 95% CI) | 0.0 [0.0, 0.0] | |
| 5.2 Worst‐worst scenario | 1 | Risk Ratio (M‐H, Fixed, 95% CI) | 0.0 [0.0, 0.0] | |
| 5.3 Best‐worst scenario | 1 | Risk Ratio (M‐H, Fixed, 95% CI) | 0.0 [0.0, 0.0] | |
| 5.4 Worst‐best scenario | 1 | Risk Ratio (M‐H, Fixed, 95% CI) | 0.0 [0.0, 0.0] | |
| 6 Surgical site infection (vancomycin and cefazolin versus cefazolin) Show forest plot | 1 | Risk Ratio (M‐H, Fixed, 95% CI) | Totals not selected | |
| 6.1 Best‐best scenario | 1 | Risk Ratio (M‐H, Fixed, 95% CI) | 0.0 [0.0, 0.0] | |
| 6.2 Worst‐worst scenario | 1 | Risk Ratio (M‐H, Fixed, 95% CI) | 0.0 [0.0, 0.0] | |
| 6.3 Best‐worst scenario | 1 | Risk Ratio (M‐H, Fixed, 95% CI) | 0.0 [0.0, 0.0] | |
| 6.4 Worst‐best scenario | 1 | Risk Ratio (M‐H, Fixed, 95% CI) | 0.0 [0.0, 0.0] | |
| 7 Surgical site infection (daptomycin and cefazolin versus cefazolin) Show forest plot | 1 | Risk Ratio (M‐H, Fixed, 95% CI) | Totals not selected | |
| 7.1 Best‐best scenario | 1 | Risk Ratio (M‐H, Fixed, 95% CI) | 0.0 [0.0, 0.0] | |
| 7.2 Worst‐worst scenario | 1 | Risk Ratio (M‐H, Fixed, 95% CI) | 0.0 [0.0, 0.0] | |
| 7.3 Best‐worst scenario | 1 | Risk Ratio (M‐H, Fixed, 95% CI) | 0.0 [0.0, 0.0] | |
| 7.4 Worst‐best scenario | 1 | Risk Ratio (M‐H, Fixed, 95% CI) | 0.0 [0.0, 0.0] | |
| 8 Surgical site infection (vancomycin versus cefuroxime) Show forest plot | 1 | Risk Ratio (M‐H, Fixed, 95% CI) | Totals not selected | |
| 8.1 Best‐best scenario | 1 | Risk Ratio (M‐H, Fixed, 95% CI) | 0.0 [0.0, 0.0] | |
| 8.2 Worst‐worst scenario | 1 | Risk Ratio (M‐H, Fixed, 95% CI) | 0.0 [0.0, 0.0] | |
| 8.3 Best‐worst scenario | 1 | Risk Ratio (M‐H, Fixed, 95% CI) | 0.0 [0.0, 0.0] | |
| 8.4 Worst‐best scenario | 1 | Risk Ratio (M‐H, Fixed, 95% CI) | 0.0 [0.0, 0.0] | |
| 9 MRSA surgical site infection (kanamycin, erythromycin and cefotiam versus cefotiam) Show forest plot | 1 | Risk Ratio (M‐H, Fixed, 95% CI) | Totals not selected | |
| 9.1 Best‐best scenario | 1 | Risk Ratio (M‐H, Fixed, 95% CI) | 0.0 [0.0, 0.0] | |
| 9.2 Worst‐worst scenario | 1 | Risk Ratio (M‐H, Fixed, 95% CI) | 0.0 [0.0, 0.0] | |
| 9.3 Best‐worst scenario | 1 | Risk Ratio (M‐H, Fixed, 95% CI) | 0.0 [0.0, 0.0] | |
| 9.4 Worst‐best scenario | 1 | Risk Ratio (M‐H, Fixed, 95% CI) | 0.0 [0.0, 0.0] | |
| 10 MRSA surgical site infection (vancomycin versus teicoplanin) Show forest plot | 1 | Risk Ratio (M‐H, Fixed, 95% CI) | Totals not selected | |
| 10.1 Best‐best scenario | 1 | Risk Ratio (M‐H, Fixed, 95% CI) | 0.0 [0.0, 0.0] | |
| 10.2 Worst‐worst scenario | 1 | Risk Ratio (M‐H, Fixed, 95% CI) | 0.0 [0.0, 0.0] | |
| 10.3 Best‐worst scenario | 1 | Risk Ratio (M‐H, Fixed, 95% CI) | 0.0 [0.0, 0.0] | |
| 10.4 Worst‐best scenario | 1 | Risk Ratio (M‐H, Fixed, 95% CI) | 0.0 [0.0, 0.0] | |
| 11 MRSA surgical site infection (vancomycin and cefazolin versus daptomycin and cefazolin) Show forest plot | 1 | Risk Ratio (M‐H, Fixed, 95% CI) | Totals not selected | |
| 11.1 Best‐best scenario | 1 | Risk Ratio (M‐H, Fixed, 95% CI) | 0.0 [0.0, 0.0] | |
| 11.2 Worst‐worst scenario | 1 | Risk Ratio (M‐H, Fixed, 95% CI) | 0.0 [0.0, 0.0] | |
| 11.3 Best‐worst scenario | 1 | Risk Ratio (M‐H, Fixed, 95% CI) | 0.0 [0.0, 0.0] | |
| 11.4 Worst‐best scenario | 1 | Risk Ratio (M‐H, Fixed, 95% CI) | 0.0 [0.0, 0.0] | |
| 12 MRSA surgical site infection (vancomycin and cefazolin versus cefazolin) Show forest plot | 1 | Risk Ratio (M‐H, Fixed, 95% CI) | Totals not selected | |
| 12.1 Best‐best scenario | 1 | Risk Ratio (M‐H, Fixed, 95% CI) | 0.0 [0.0, 0.0] | |
| 12.2 Worst‐worst scenario | 1 | Risk Ratio (M‐H, Fixed, 95% CI) | 0.0 [0.0, 0.0] | |
| 12.3 Best‐worst scenario | 1 | Risk Ratio (M‐H, Fixed, 95% CI) | 0.0 [0.0, 0.0] | |
| 12.4 Worst‐best scenario | 1 | Risk Ratio (M‐H, Fixed, 95% CI) | 0.0 [0.0, 0.0] | |
| 13 MRSA surgical site infection (daptomycin and cefazolin versus cefazolin) Show forest plot | 1 | Risk Ratio (M‐H, Fixed, 95% CI) | Totals not selected | |
| 13.1 Best‐best scenario | 1 | Risk Ratio (M‐H, Fixed, 95% CI) | 0.0 [0.0, 0.0] | |
| 13.2 Worst‐worst scenario | 1 | Risk Ratio (M‐H, Fixed, 95% CI) | 0.0 [0.0, 0.0] | |
| 13.3 Best‐worst scenario | 1 | Risk Ratio (M‐H, Fixed, 95% CI) | 0.0 [0.0, 0.0] | |
| 13.4 Worst‐best scenario | 1 | Risk Ratio (M‐H, Fixed, 95% CI) | 0.0 [0.0, 0.0] | |
| 14 MRSA surgical site infection (vancomycin versus cefuroxime) Show forest plot | 1 | Risk Ratio (M‐H, Fixed, 95% CI) | Totals not selected | |
| 14.1 Best‐best scenario | 1 | Risk Ratio (M‐H, Fixed, 95% CI) | 0.0 [0.0, 0.0] | |
| 14.2 Worst‐worst scenario | 1 | Risk Ratio (M‐H, Fixed, 95% CI) | 0.0 [0.0, 0.0] | |
| 14.3 Best‐worst scenario | 1 | Risk Ratio (M‐H, Fixed, 95% CI) | 0.0 [0.0, 0.0] | |
| 14.4 Worst‐best scenario | 1 | Risk Ratio (M‐H, Fixed, 95% CI) | 0.0 [0.0, 0.0] | |
| 15 Overall MRSA infections (kanamycin, erythromycin and cefotiam versus cefotiam) Show forest plot | 1 | Risk Ratio (M‐H, Fixed, 95% CI) | Totals not selected | |
| 15.1 Best‐best scenario | 1 | Risk Ratio (M‐H, Fixed, 95% CI) | 0.0 [0.0, 0.0] | |
| 15.2 Worst‐worst scenario | 1 | Risk Ratio (M‐H, Fixed, 95% CI) | 0.0 [0.0, 0.0] | |
| 15.3 Best‐worst scenario | 1 | Risk Ratio (M‐H, Fixed, 95% CI) | 0.0 [0.0, 0.0] | |
| 15.4 Worst‐best scenario | 1 | Risk Ratio (M‐H, Fixed, 95% CI) | 0.0 [0.0, 0.0] | |