Rayos láser para la extracción de caries en dientes deciduos y permanentes
Información
- DOI:
- https://doi.org/10.1002/14651858.CD010229.pub2Copiar DOI

- Base de datos:
-
- Cochrane Database of Systematic Reviews
- Versión publicada:
-
- 26 septiembre 2016see what's new
- Tipo:
-
- Intervention
- Etapa:
-
- Review
- Grupo Editorial Cochrane:
-
Grupo Cochrane de Salud oral
- Copyright:
-
- Copyright © 2016 The Cochrane Collaboration. Published by John Wiley & Sons, Ltd.
Cifras del artículo
Altmetric:
Citado por:
Autores
Contributions of authors
Co‐ordinating the review: Alessandro Montedori, Guido Lombardo.
Data collection for the review: Alessandro Montedori, Iosief Abraha, Massimiliano Orso, Potito Giuseppe D'Errico, Stefano Pagano, Guido Lombardo.
Data management for the review: Alessandro Montedori, Iosief Abraha, Guido Lombardo.
Analysis of data: Alessandro Montedori, Iosief Abraha, Guido Lombardo.
Interpretation of data: Alessandro Montedori, Iosief Abraha, Massimiliano Orso, Potito Giuseppe D'Errico, Stefano Pagano, Guido Lombardo.
Writing the review: Alessandro Montedori, Iosief Abraha, Massimiliano Orso, Potito Giuseppe D'Errico, Stefano Pagano, Guido Lombardo.
Providing general advice on the review: Guido Lombardo, Stefano Pagano.
Conception of the review: Guido Lombardo.
Sources of support
Internal sources
-
University of Perugia, Italy.
Dipartimento di Scienze Chirurgiche, Radiologiche e Odontostomatologiche
-
Regional Health Authority of Umbria, Italy.
Office of Regional Health Planning, Perugia
-
University of Perugia, Italy.
Department of General Surgery
External sources
-
Cochrane Oral Health Global Alliance, Other.
The production of Cochrane Oral Health reviews has been supported financially by our Global Alliance since 2011 (ohg.cochrane.org/partnerships‐alliances). Contributors over the last year have been: British Association for the Study of Community Dentistry, UK; British Society of Paediatric Dentistry, UK; Centre for Dental Education and Research at All India Institute of Medical Sciences, India; National Center for Dental Hygiene Research & Practice, USA; New York University College of Dentistry, USA; NHS Education for Scotland, UK.
-
National Institute for Health Research (NIHR), UK.
This project was supported by the NIHR, via Cochrane Infrastructure funding to Cochrane Oral Health. The views and opinions expressed therein are those of the review authors and do not necessarily reflect those of the Systematic Reviews Programme, the NIHR, the NHS or the Department of Health.
Declarations of interest
Alessandro Montedori: None known.
Iosief Abraha: None known.
Massimiliano Orso: None known.
Potito Giuseppe D'Errico: None known.
Stefano Pagano: None known.
Guido Lombardo: None known.
Acknowledgements
The review authors would like to thank Cochrane Oral Health for their support and assistance in conducting this review. Thanks also to Philip Riley, Valeria Marinho, Tanya Walsh and Anne Littlewood for their assistance and invaluable input. In addition, the review authors would like to thank Zhang and colleagues for sending a copy of their article translated from Chinese into English.
We thank Paolo Eusebi for his assistance in statistics.
Version history
| Published | Title | Stage | Authors | Version |
| 2016 Sep 26 | Lasers for caries removal in deciduous and permanent teeth | Review | Alessandro Montedori, Iosief Abraha, Massimiliano Orso, Potito Giuseppe D'Errico, Stefano Pagano, Guido Lombardo | |
| 2012 Nov 14 | Lasers for caries removal in deciduous and permanent teeth | Protocol | Alessandro Montedori, Iosief Abraha, Massimiliano Orso, Potito Giuseppe D'Errico, Stefano Pagano, Guido Lombardo | |
Differences between protocol and review
In the protocol, we said we would search the metaRegister of Controlled Trials (www.isrctn.com/page/mrct) for ongoing trials. However, this is no longer available; we conducted searches of the US National Institutes of Health Ongoing Trials Register ClinicalTrials.gov and the WHO International Clinical Trials Registry Platform instead.
PICO
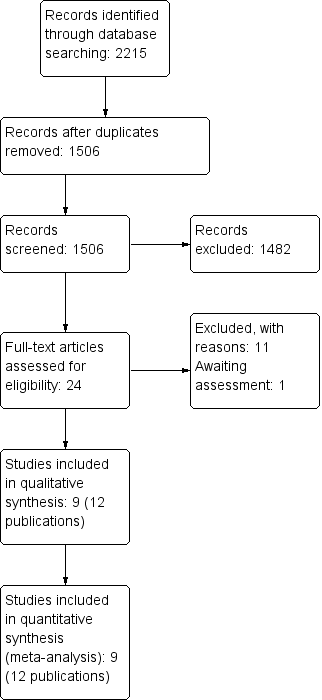
Study flow diagram.

Risk of bias summary: review authors' judgements about each risk of bias item for each included study.
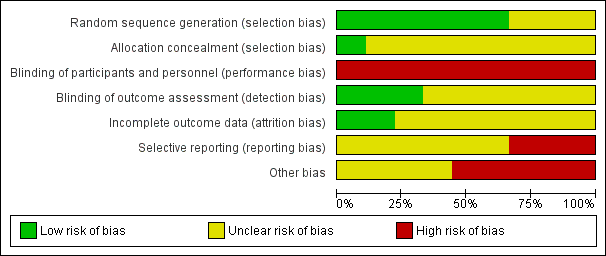
Risk of bias graph: review authors' judgements about each risk of bias item presented as percentages across all included studies.

Forest plot of comparison: 1 Laser versus standard drill, outcome: 1.1 Caries removal (clinical).

Forest plot of comparison: 1 Laser versus standard drill, outcome: 1.2 Pain.

Forest plot of comparison: 1 Laser versus standard drill, outcome: 1.4 Durability of restoration.

Forest plot of comparison: 1 Laser versus standard drill, outcome: 1.5 Pulpal inflammation or necrosis.

Forest plot of comparison: 1 Laser versus standard drill, outcome: 1.8 Need for anaesthesia.

Comparison 1 Laser versus standard drill, Outcome 1 Caries removal (clinical).

Comparison 1 Laser versus standard drill, Outcome 2 Pain.
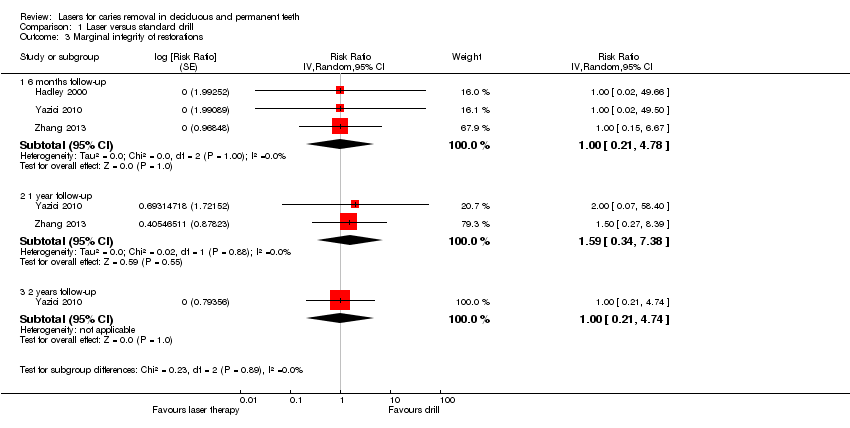
Comparison 1 Laser versus standard drill, Outcome 3 Marginal integrity of restorations.
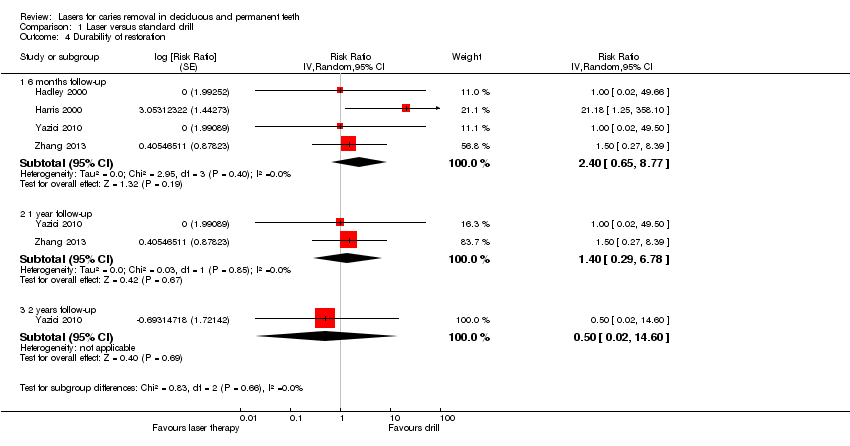
Comparison 1 Laser versus standard drill, Outcome 4 Durability of restoration.

Comparison 1 Laser versus standard drill, Outcome 5 Pulpal inflammation or necrosis.
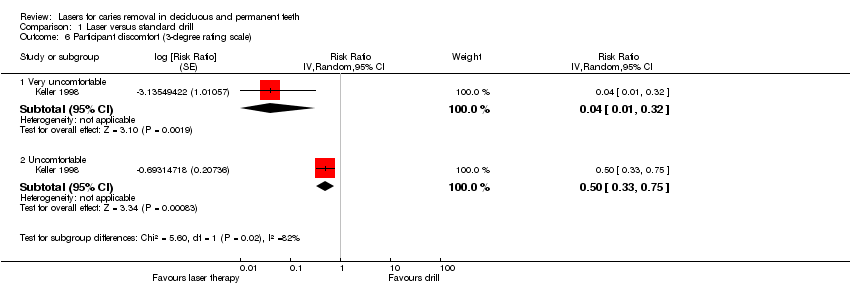
Comparison 1 Laser versus standard drill, Outcome 6 Participant discomfort (3‐degree rating scale).

Comparison 1 Laser versus standard drill, Outcome 7 Participant discomfort (5‐degree rating scale).
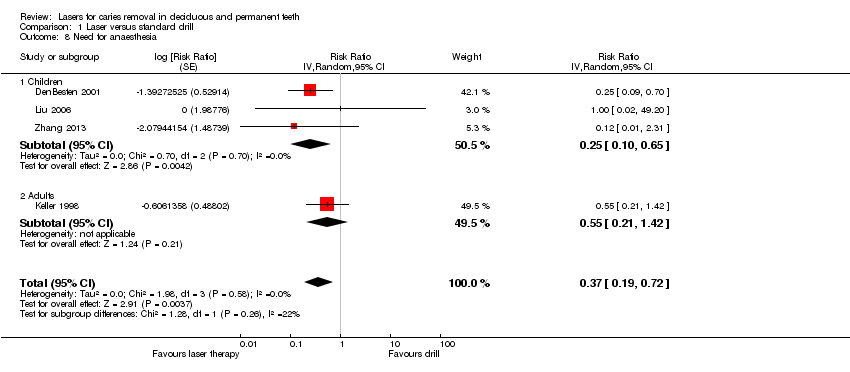
Comparison 1 Laser versus standard drill, Outcome 8 Need for anaesthesia.
| Laser compared to standard drill for caries removal in deciduous and permanent teeth | ||||||
| Patient or population: people with caries in deciduous and permanent teeth | ||||||
| Outcomes | Illustrative comparative risks* (95% CI) | Relative effect | No of participants | Quality of the evidence | Comments | |
| Assumed risk | Corresponding risk | |||||
| Standard drill | Laser | |||||
| Caries removal (during treatment) | 995 per 1000 | 995 per 1000 | RR 1.00 | 190 participants; 256 teeth; 256 cavity preparations | ⊕⊕⊝⊝ | |
| Pain ‐ 6‐face rating scale (moderate and high pain) (during treatment) | 760 per 1000 | 304 per 1000 | RR 0.40 | 143 participants | ⊕⊕⊝⊝ | |
| Need for anaesthesia ‐ children (during treatment) | 97 per 1000 | 24 per 1000 | RR 0.25 | 217 participants | ⊕⊕⊝⊝ | |
| Durability of restoration ‐ 6 months follow‐up | 8 per 1000 | 20 per 1000 | RR 2.40 | 236 participants; 682 teeth | ⊕⊕⊝⊝ | |
| Marginal integrity of restorations ‐ 6 months follow‐up | 7 per 1000 | 7 per 1000 | RR 1.00 | 146 participants; 306 teeth | ⊕⊕⊝⊝ | |
| Pulpal inflammation or necrosis ‐ 1 week follow‐up | 5 per 1000 | 7 per 1000 | RR 1.51 | 317 participants; 694 teeth; 752 cavity preparations | ⊕⊕⊝⊝ | |
| Pulpal inflammation or necrosis ‐ 6 months follow‐up | 4 per 1000 | 4 per 1000 | RR 0.99 | 156 participants; 508 teeth; 554 cavity preparations | ⊕⊕⊝⊝ | |
| *The basis for the assumed risk (e.g. the median control group risk across studies) is provided in footnotes. The corresponding risk (and its 95% confidence interval) is based on the assumed risk in the comparison group and the relative effect of the intervention (and its 95% CI). | ||||||
| GRADE Working Group grades of evidence | ||||||
| 1The evidence was downgraded by two levels because of very serious concern regarding the risk of bias: (1) the two studies did not report sufficient information regarding the allocation concealment (DenBesten 2001; Hadley 2000); (2) both studies were at high risk of performance bias; (3) neither of the two studies was at low risk of selective reporting bias; (4) serious concern related to funding (other bias). | ||||||
| Outcome or subgroup title | No. of studies | No. of participants | Statistical method | Effect size |
| 1 Caries removal (clinical) Show forest plot | 2 | Risk Ratio (Random, 95% CI) | 1.00 [0.99, 1.01] | |
| 2 Pain Show forest plot | 3 | Risk Ratio (Random, 95% CI) | Subtotals only | |
| 2.1 6‐face rating scale (moderate and high pain) | 2 | Risk Ratio (Random, 95% CI) | 0.40 [0.28, 0.57] | |
| 2.2 Modified simple 4‐face scale | 1 | Risk Ratio (Random, 95% CI) | 0.21 [0.11, 0.42] | |
| 3 Marginal integrity of restorations Show forest plot | 3 | Risk Ratio (Random, 95% CI) | Subtotals only | |
| 3.1 6 months follow‐up | 3 | Risk Ratio (Random, 95% CI) | 1.0 [0.21, 4.78] | |
| 3.2 1 year follow‐up | 2 | Risk Ratio (Random, 95% CI) | 1.59 [0.34, 7.38] | |
| 3.3 2 years follow‐up | 1 | Risk Ratio (Random, 95% CI) | 1.0 [0.21, 4.74] | |
| 4 Durability of restoration Show forest plot | 4 | Risk Ratio (Random, 95% CI) | Subtotals only | |
| 4.1 6 months follow‐up | 4 | Risk Ratio (Random, 95% CI) | 2.40 [0.65, 8.77] | |
| 4.2 1 year follow‐up | 2 | Risk Ratio (Random, 95% CI) | 1.40 [0.29, 6.78] | |
| 4.3 2 years follow‐up | 1 | Risk Ratio (Random, 95% CI) | 0.50 [0.02, 14.60] | |
| 5 Pulpal inflammation or necrosis Show forest plot | 4 | Risk Ratio (Random, 95% CI) | 1.29 [0.32, 5.14] | |
| 5.1 1 week | 3 | Risk Ratio (Random, 95% CI) | 1.51 [0.26, 8.75] | |
| 5.2 6 months | 2 | Risk Ratio (Random, 95% CI) | 0.99 [0.10, 9.41] | |
| 6 Participant discomfort (3‐degree rating scale) Show forest plot | 1 | Risk Ratio (Random, 95% CI) | Subtotals only | |
| 6.1 Very uncomfortable | 1 | Risk Ratio (Random, 95% CI) | 0.04 [0.01, 0.32] | |
| 6.2 Uncomfortable | 1 | Risk Ratio (Random, 95% CI) | 0.50 [0.33, 0.75] | |
| 7 Participant discomfort (5‐degree rating scale) Show forest plot | 1 | Risk Ratio (Random, 95% CI) | Subtotals only | |
| 7.1 Mild discomfort | 1 | Risk Ratio (Random, 95% CI) | 0.12 [0.01, 2.32] | |
| 7.2 Moderate discomfort | 1 | Risk Ratio (Random, 95% CI) | 0.33 [0.04, 3.12] | |
| 8 Need for anaesthesia Show forest plot | 4 | Risk Ratio (Random, 95% CI) | 0.37 [0.19, 0.72] | |
| 8.1 Children | 3 | Risk Ratio (Random, 95% CI) | 0.25 [0.10, 0.65] | |
| 8.2 Adults | 1 | Risk Ratio (Random, 95% CI) | 0.55 [0.21, 1.42] | |