Inhibidores selectivos de la recaptación de noradrenalina para la esquizofrenia
Información
- DOI:
- https://doi.org/10.1002/14651858.CD010219.pub2Copiar DOI

- Base de datos:
-
- Cochrane Database of Systematic Reviews
- Versión publicada:
-
- 25 enero 2018see what's new
- Tipo:
-
- Intervention
- Etapa:
-
- Review
- Grupo Editorial Cochrane:
-
Grupo Cochrane de Esquizofrenia
- Copyright:
-
- Copyright © 2018 The Cochrane Collaboration. Published by John Wiley & Sons, Ltd.
Cifras del artículo
Altmetric:
Citado por:
Autores
Contributions of authors
Paul Matthews: screening retrieved papers against eligibility criteria, appraising the quality of papers, extracting data, contacting authors for additional information, handsearching references, calculating additional useable data from reported values, entering data into RevMan 5, analysis of data, interpretation of data, writing the protocol and review, liaison with the Cochrane Schizophrenia Group.
Mike Pearce: appraising the quality of papers, extracting data, interpretation of data, writing the review.
Jamie Horder: screening retrieved papers against eligibility criteria, writing the protocol and review.
Sources of support
Internal sources
-
Oxford Health NHS Foundation Trust, Oxford, UK.
Previously employed lead author Paul RL Matthews and employs review author Michael Pearce.
-
King's College London, UK.
Employs review author Jamie Horder.
-
Berkshire Healthcare NHS Foundation Trust (Bracknell), UK.
Previously employed review authors Paul Matthews and Michael Pearce.
External sources
-
No sources of support supplied
Declarations of interest
Paul Matthews: had a short clinical attachment to the Schizophrenia Research Program at NIMH in 2009 during the period that Apud 2007a was conducted there, but did not have direct involvement in the trial. From 2011 to 2016 PM has attended a total of two days of educational meetings organised by Lundbeck and one day organised by Eli Lilly in the UK and received travel expenses on two of these occasions.
Jamie Horder: none known.
Michael Pearce: none known.
Acknowledgements
The Cochrane Schizophrenia Group (CSG) Editorial Base in Nottingham produces and maintains standard text for use in the Methods section of their reviews. We have used this text as the basis of what appears here and adapted it as required. Our thanks to Clive Adams and Claire Irving for providing editorial support and advice and particular thanks to Farhad Shokraneh for his help and advice in designing the search strategy and Clive Adams for extensive assistance in revising the final text.
We would like to thank Dr Qi Pei for her assistance with Chinese translations and checking the accuracy of data extraction from Chinese papers.
We are grateful to those authors who responded to enquiries to provide additional data or to clarify methods.
Version history
| Published | Title | Stage | Authors | Version |
| 2018 Jan 25 | Selective noradrenaline reuptake inhibitors for schizophrenia | Review | Paul R L Matthews, Jamie Horder, Michael Pearce | |
| 2012 Nov 14 | Selective noradrenaline reuptake inhibitors for schizophrenia | Protocol | Paul Matthews, Jamie Horder | |
Differences between protocol and review
The protocol for this review was published as Matthews 2012.
1. Inclusion criteria
We decided to broaden the inclusion criteria of the review beyond placebo‐controlled trials to better reflect the title of the review and identified two trials using citalopram as an active comparator that were also included in the placebo‐controlled analysis.
2. Search methods
After discussion with the Cochrane Schizophrenia Group TSC we broadened the search terms in order to include more potential selective NRIs. One additional study was identified utilising viloxazine.
In the protocol we stated that we would contact the first author of each study but due to the practicalities involved we made the pragmatic decision to contact the corresponding author for each study instead as contact details were more readily accessible and we considered they would be more likely to have relevant data available.
3. Data collection and analysis
We specified in the protocol that PM and JH would extract data and analyse risk of bias but PM and MP carried out this role when MP joined the final review.
In the protocol we stated that we would use the equation from the Cochrane manual for relating baseline, change, and endpoint SD in order to impute the SD for endpoint data where we only have baseline and change scores. However, this was mathematically underdetermined and we instead substituted the baseline SD as advised in the Cochrane Handbook for Systematic Reviews of Interventions (Higgins 2011).
We continued to utilise the assumption of a 0.5 correlation between baseline and endpoint scores to estimate the SD of change scores as outlined in the protocol but we were unable to validate this assumption by deriving empirical estimates of the correlation from other studies as none reported all the relevant values.
It was not clear in the original protocol that we would analyse outcomes based on the duration of the trial as we had also listed these under subgroup analyses, so we clarified this in the Methods and specified how to handle multiple outcomes within the same duration.
We made the post hoc decision to perform subgroup and sensitivity analyses for secondary outcomes as well as for the primary outcomes. This was because there was limited data available for our primary outcome measures and interpretation of secondary outcomes of significant interest (e.g. negative symptom scores) was difficult without this.
In the original protocol we had specified that we would only produce a meta‐analytic outcome when there were at least three trials available to combine; however this restriction is the not the usual practice of the Cochrane Schizophrenia Group and after discussions we agreed to remove this requirement. As a consequence of this decision we added the clarification that subgroup and sensitivity analyses would only be conducted when there were more than three studies as sensitivity analysis is not meaningful if there are only one or two trials.
Although we could not determine whether change scores were skewed we were often able to calculate endpoint scores from these and to estimate the SD which frequently suggested skew. While using the change scores rather than endpoint scores could correct this skew it was not possible to test this so we made a post hoc decision to perform a sensitivity analysis where we excluded those change scores which were associated with skewed endpoint scores.
In the protocol we stated that we would produce a 'Summary of findings' table listing an important specific adverse effect but did not define what this adverse effect would be. Prior to performing the analysis of adverse effects, we selected 'nausea' based on the most common adverse effects listed for reboxetine and atomoxetine in the British National Formulary (BNF 2016).
As we had not specified in advance the duration of studies to include in the 'Summary of findings' table we made a post hoc decision to use the analysis with the longest period of follow‐up providing there were more than three studies to include for that time period; otherwise we used the duration which included the most studies. Where there was more than one outcome measure for a time point, we used the one with the most studies.
Keywords
MeSH
Medical Subject Headings (MeSH) Keywords
- Adrenergic Uptake Inhibitors [*therapeutic use];
- Atomoxetine Hydrochloride [therapeutic use];
- Citalopram [therapeutic use];
- Cognition [drug effects];
- Morpholines [therapeutic use];
- Quality of Life;
- Randomized Controlled Trials as Topic;
- Reboxetine;
- Schizophrenia [*drug therapy];
- Serotonin and Noradrenaline Reuptake Inhibitors [*therapeutic use];
- Viloxazine [therapeutic use];
Medical Subject Headings Check Words
Adult; Humans;
PICO

Study flow diagram.
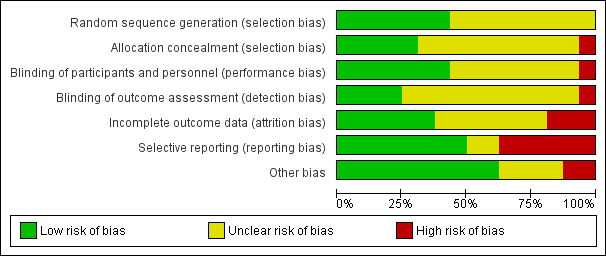
Risk of bias graph: review authors' judgements about each risk of bias item presented as percentages across all included studies.

Risk of bias summary: review authors' judgements about each risk of bias item for each included study.
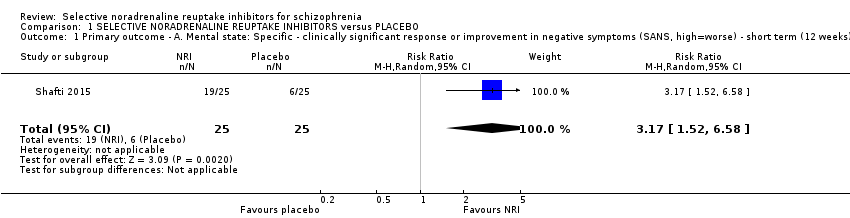
Comparison 1 SELECTIVE NORADRENALINE REUPTAKE INHIBITORS versus PLACEBO, Outcome 1 Primary outcome ‐ A. Mental state: Specific ‐ clinically significant response or improvement in negative symptoms (SANS, high=worse) ‐ short term (12 weeks).

Comparison 1 SELECTIVE NORADRENALINE REUPTAKE INHIBITORS versus PLACEBO, Outcome 2 Primary outcome ‐ B. Clinical global response: Clinically significant response or improvement in global status (CGI‐S, high=worse) ‐ short term (4 weeks).

Comparison 1 SELECTIVE NORADRENALINE REUPTAKE INHIBITORS versus PLACEBO, Outcome 3 Mental state: 1. General ‐ clinically significant response or improvement in general/overall symptoms as defined in each study ‐ short term (2‐12 weeks).

Comparison 1 SELECTIVE NORADRENALINE REUPTAKE INHIBITORS versus PLACEBO, Outcome 4 Mental state: 2a. General: Average general/overall symptoms score (various scales, high=worse) ‐ short term (2 ‐ 12 weeks).

Comparison 1 SELECTIVE NORADRENALINE REUPTAKE INHIBITORS versus PLACEBO, Outcome 5 Mental state: 2b. General: Average general/overall symptoms score (various scales, high=worse) ‐ medium term (13 ‐ 26 weeks).
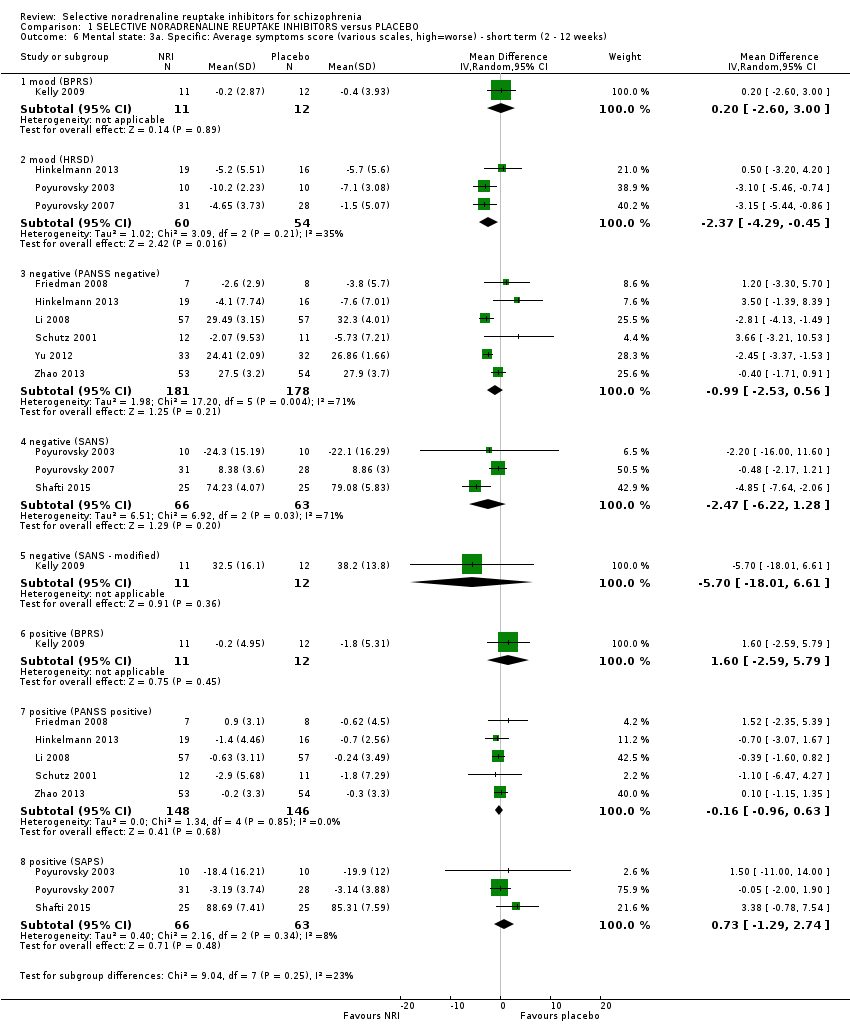
Comparison 1 SELECTIVE NORADRENALINE REUPTAKE INHIBITORS versus PLACEBO, Outcome 6 Mental state: 3a. Specific: Average symptoms score (various scales, high=worse) ‐ short term (2 ‐ 12 weeks).

Comparison 1 SELECTIVE NORADRENALINE REUPTAKE INHIBITORS versus PLACEBO, Outcome 7 Mental state: 3b. Specific: Average symptoms score (various scales, high=worse) ‐ medium term (13 ‐ 26 weeks).
| Study | NRI | NRI mean | NRI SD | NRI N | Placebo mean | Placebo SD | Placebo N |
| general ‐ overall symptoms (BPRS total) | |||||||
| Kelly 2009 | Atomoxetine | 30.2 | 8.2 | 11 | 36 | 11.6 | 12 |
| general ‐ overall symptoms (PANSS general) | |||||||
| Friedman 2008 | Atomoxetine | 26.7 | 4.4 | 10 | 32 | 8 | 10 |
| Hinkelmann 2013 | Reboxetine | 28.7 | 9.4 | 19 | 28.4 | 10.1 | 16 |
| Schutz 2001 | Reboxetine | 29.6 | 8.92 | 12 | 30.4 | 7.44 | 11 |
| general ‐ overall symptoms (PANSS total) | |||||||
| Schutz 2001 | Reboxetine | 67.67 | 20.66 | 12 | 70.67 | 14.96 | 11 |
| specific ‐ mood (BPRS anxiety/depression) | |||||||
| Kelly 2009 | Atomoxetine | 6.4 | 1.9 | 11 | 8.3 | 3.6 | 12 |
| specific ‐ mood (HRSD) | |||||||
| Hinkelmann 2013 | Reboxetine | 8.3 | 6.1 | 19 | 6.5 | 5.6 | 16 |
| Poyurovsky 2003 | Reboxetine | 4.6 | 3.5 | 10 | 4.6 | 3.5 | 10 |
| Poyurovsky 2007 | Reboxetine | 4.53 | 2 | 16 | 3 | 2 | 17 |
| Schutz 2001 | Reboxetine | 6.93 | 4.95 | 12 | 6.93 | 3.17 | 11 |
| specific ‐ negative symptoms (SANS) | |||||||
| Poyurovsky 2003 | Reboxetine | 18.9 | 13.4 | 10 | 23.2 | 18.8 | 10 |
| specific ‐ negative symptoms (PANSS negative) | |||||||
| Friedman 2008 | Atomoxetine | 15.2 | 4.8 | 10 | 15.5 | 5.9 | 10 |
| Hinkelmann 2013 | Reboxetine | 21.5 | 8.6 | 19 | 19.1 | 5.5 | 16 |
| Schutz 2001 | Reboxetine | 25.13 | 9.53 | 12 | 23.27 | 7.21 | 11 |
| specific ‐ positive symptoms (BPRS positive) | |||||||
| Kelly 2009 | Atomoxetine | 9.8 | 4.9 | 11 | 10.3 | 5.5 | 12 |
| specific ‐ positive symptoms (PANSS positive) | |||||||
| Friedman 2008 | Atomoxetine | 13.2 | 4.5 | 10 | 14.6 | 4.5 | 10 |
| Hinkelmann 2013 | Reboxetine | 10.6 | 4.6 | 19 | 8.6 | 2.4 | 16 |
| Li 2008 | Reboxetine | 9.02 | 2.64 | 57 | 8.72 | 3.21 | 57 |
| Schutz 2001 | Reboxetine | 14.1 | 5.68 | 12 | 15.8 | 7.29 | 11 |
| Zhao 2013 | Reboxetine | 9.1 | 3.4 | 54 | 9.1 | 3.1 | 53 |
| specific ‐ positive symptoms (SAPS) | |||||||
| Poyurovsky 2003 | Reboxetine | 4.8 | 3.9 | 10 | 11.8 | 12.2 | 10 |
| Poyurovsky 2007 | Reboxetine | 3.21 | 3.2 | 31 | 2.66 | 2.4 | 28 |
Comparison 1 SELECTIVE NORADRENALINE REUPTAKE INHIBITORS versus PLACEBO, Outcome 8 Mental state: 4a. General and specific: Average score (various scales, high=worse) ‐ skewed results ‐ short term (2 ‐ 12 weeks).
| Study | NRI | NRI mean | NRI SD | NRI N | Placebo mean | Placebo SD | Placebo N |
| general ‐ overall symptoms (BPRS total) | |||||||
| Ball 2011 | Atomoxetine | 30.8 | 5.8 | 14 | 31 | 8.9 | 12 |
| general ‐ overall symptoms (PANSS general) | |||||||
| Usall 2014 | Reboxetine | 28.83 | 8.1 | 24 | 30.09 | 7.93 | 23 |
| general ‐ overall symptoms (PANSS total) | |||||||
| Usall 2014 | Reboxetine | 59.96 | 17.89 | 24 | 62.04 | 19.9 | 23 |
| Yu 2012 | Reboxetine | 24.24 | 3.54 | 33 | 26.86 | 1.66 | 32 |
| specific ‐ negative symptoms (PANSS negative) | |||||||
| Usall 2014 | Reboxetine | 19.67 | 8.41 | 24 | 22.65 | 5.54 | 23 |
| specific ‐ negative symptoms (SANS) | |||||||
| Usall 2014 | Reboxetine | 46.75 | 26.12 | 24 | 54.61 | 19.13 | 23 |
| specific ‐ positive symptoms (PANSS positive) | |||||||
| Usall 2014 | Reboxetine | 11.46 | 4.14 | 24 | 12 | 5.68 | 23 |
| Zhao 2013 | Reboxetine | 9 | 3.2 | 54 | 9.3 | 3.4 | 53 |
Comparison 1 SELECTIVE NORADRENALINE REUPTAKE INHIBITORS versus PLACEBO, Outcome 9 Mental state: 4b. General and specific: Average score (various scales, high=worse) ‐ skewed results ‐ medium term (13 ‐ 26 weeks).

Comparison 1 SELECTIVE NORADRENALINE REUPTAKE INHIBITORS versus PLACEBO, Outcome 10 Cognitive functioning: 1. General ‐ average composite cognitive functioning score (SMD).

Comparison 1 SELECTIVE NORADRENALINE REUPTAKE INHIBITORS versus PLACEBO, Outcome 11 Cognitive functioning: 2. Specific ‐ average individual scores (SMD) ‐ short term (2 ‐ 12 weeks).

Comparison 1 SELECTIVE NORADRENALINE REUPTAKE INHIBITORS versus PLACEBO, Outcome 12 Quality of life: Average quality of life score (GQOLI‐74, high=better) ‐ short term (2 ‐ 12 weeks).
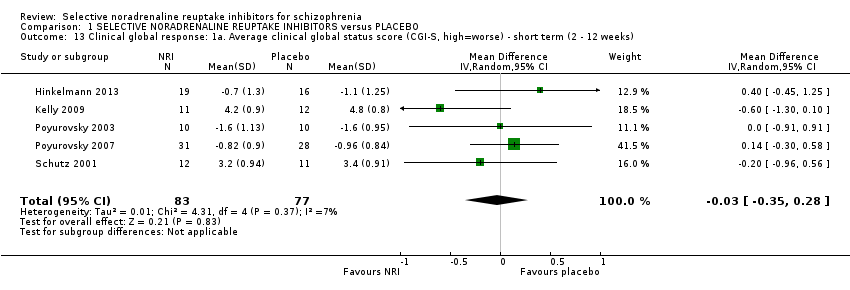
Comparison 1 SELECTIVE NORADRENALINE REUPTAKE INHIBITORS versus PLACEBO, Outcome 13 Clinical global response: 1a. Average clinical global status score (CGI‐S, high=worse) ‐ short term (2 ‐ 12 weeks).
| Study | NRI | NRI mean | NRI SD | NRI N | Placebo mean | Placebo SD | Placebo N |
| CGI‐I | |||||||
| Schutz 2001 | Reboxetine | 3.4 | 1.35 | 12 | 3.07 | 1.22 | 11 |
| CGI‐S | |||||||
| Hinkelmann 2013 | Reboxetine | 4.2 | 1.5 | 19 | 3.6 | 1.3 | 16 |
| Poyurovsky 2003 | Reboxetine | 3.1 | 1.3 | 10 | 3 | 1.1 | 10 |
Comparison 1 SELECTIVE NORADRENALINE REUPTAKE INHIBITORS versus PLACEBO, Outcome 14 Clinical global response: 1b. Average clinical global status score (various scales, high=worse) ‐ short term (2 ‐ 12 weeks) ‐ skewed results.

Comparison 1 SELECTIVE NORADRENALINE REUPTAKE INHIBITORS versus PLACEBO, Outcome 15 Leaving the study early: 1a. Short term (2 ‐ 12 weeks).

Comparison 1 SELECTIVE NORADRENALINE REUPTAKE INHIBITORS versus PLACEBO, Outcome 16 Leaving the study early: 1b. Medium term (13 ‐ 26 weeks).
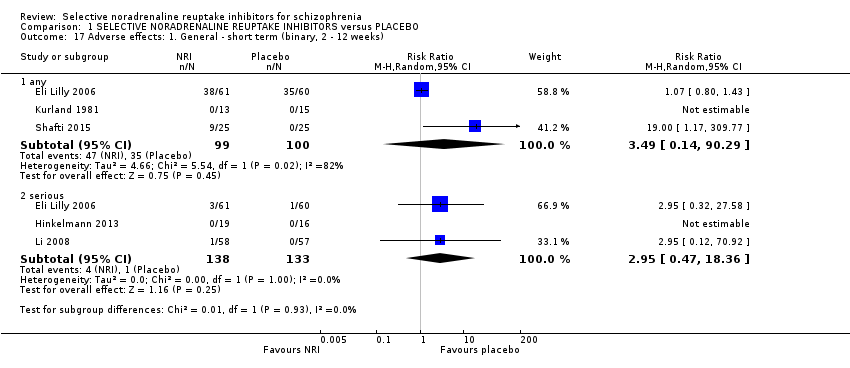
Comparison 1 SELECTIVE NORADRENALINE REUPTAKE INHIBITORS versus PLACEBO, Outcome 17 Adverse effects: 1. General ‐ short term (binary, 2 ‐ 12 weeks).

Comparison 1 SELECTIVE NORADRENALINE REUPTAKE INHIBITORS versus PLACEBO, Outcome 18 Adverse effects: 2a.i. Specific ‐ short term (binary, 2 ‐ 12 weeks).

Comparison 1 SELECTIVE NORADRENALINE REUPTAKE INHIBITORS versus PLACEBO, Outcome 19 Adverse effects: 2a.ii. Specific ‐ extrapyramidal ‐ average change score (continuous, various scales, high=worse) ‐ short term (2 ‐ 12 weeks).
| Study | NRI | NRI mean | NRI SD | NRI N | Placebo mean | Placebo SD | Placebo N |
| AIMS | |||||||
| Kelly 2009 | Atomoxetine | 1.33 | 1.88 | 12 | 0.93 | 1.94 | 11 |
| SAS | |||||||
| Kelly 2009 | Atomoxetine | 0.4 | 0.5 | 11 | 1.9 | 2.6 | 15 |
| Schutz 2001 | Reboxetine | 2.5 | 3.4 | 11 | 2.3 | 2.9 | 15 |
Comparison 1 SELECTIVE NORADRENALINE REUPTAKE INHIBITORS versus PLACEBO, Outcome 20 Adverse effects: 2a.iii. Specific ‐ extrapyramidal ‐ average change score (continuous, various scales, high=worse) ‐ short term (2 ‐ 12 weeks) ‐ skewed results.

Comparison 1 SELECTIVE NORADRENALINE REUPTAKE INHIBITORS versus PLACEBO, Outcome 21 Adverse effects: 2b.i. Specific ‐ medium term (binary, 13 ‐ 26 weeks).

Comparison 1 SELECTIVE NORADRENALINE REUPTAKE INHIBITORS versus PLACEBO, Outcome 22 Adverse effects: 2a.iv. Specific ‐ metabolic ‐ average weight gain (continuous, increase in kg).

Comparison 1 SELECTIVE NORADRENALINE REUPTAKE INHIBITORS versus PLACEBO, Outcome 23 Social or general functioning: Average social functioning score (various subscales) ‐ short‐term (2 ‐ 12 weeks).

Comparison 2 SELECTIVE NORADRENALINE REUPTAKE INHIBITORS versus ACTIVE CONTROL, Outcome 1 Mental state: 1a. General: Average general/overall symptoms score (PANSS general, high=worse) ‐ short term (2 ‐ 12 weeks).

Comparison 2 SELECTIVE NORADRENALINE REUPTAKE INHIBITORS versus ACTIVE CONTROL, Outcome 2 Mental state: 1b. General: Average general/overall symptoms score (various scales, high=worse) ‐ medium term (13 ‐ 26 weeks).

Comparison 2 SELECTIVE NORADRENALINE REUPTAKE INHIBITORS versus ACTIVE CONTROL, Outcome 3 Mental state: 2a. Specific: Average symptoms score (various scales, high=worse) ‐ short term (2 ‐ 12 weeks).

Comparison 2 SELECTIVE NORADRENALINE REUPTAKE INHIBITORS versus ACTIVE CONTROL, Outcome 4 Mental state: 2b. Specific: Average symptoms score (various scales, high=worse) ‐ medium term (13 ‐ 26 weeks).
| Study | NRI | NRI mean | NRI SD | NRI N | Active control | Control mean | Control SD | Control N |
| general ‐ overall symptoms (PANSS general) | ||||||||
| Hinkelmann 2013 | Reboxetine | 28.7 | 9.4 | 19 | Citalopram | 26.5 | 6.2 | 16 |
| specific ‐ mood (HRSD) | ||||||||
| Hinkelmann 2013 | Reboxetine | 8.3 | 6.1 | 19 | Citalopram | 9.6 | 5.8 | 16 |
| specific ‐ negative symptoms (PANSS negative) | ||||||||
| Hinkelmann 2013 | Reboxetine | 21.5 | 8.6 | 19 | Citalopram | 19.1 | 8.8 | 16 |
| specific ‐ positive symptoms (PANSS positive) | ||||||||
| Hinkelmann 2013 | Reboxetine | 10.6 | 4.6 | 19 | Citalopram | 11.1 | 4.8 | 16 |
Comparison 2 SELECTIVE NORADRENALINE REUPTAKE INHIBITORS versus ACTIVE CONTROL, Outcome 5 Mental state: 3a. General and specific: Average score (various scales, high=worse) ‐ skewed results ‐ short term (2 ‐ 12 weeks).
| Study | NRI | NRI mean | NRI SD | NRI N | Active control | Control mean | Control SD | Control N |
| general ‐ overall symptoms (PANSS general) | ||||||||
| Usall 2014 | Reboxetine | 28.83 | 8.1 | 24 | Citalopram | 28.88 | 5.32 | 17 |
| general ‐ overall symptoms (PANSS total) | ||||||||
| Usall 2014 | Reboxetine | 59.96 | 17.89 | 24 | Citalopram | 59.41 | 11.72 | 17 |
| specific ‐ negative symptoms (PANSS negative) | ||||||||
| Usall 2014 | Reboxetine | 19.67 | 8.41 | 24 | Citalopram | 19.82 | 4.99 | 17 |
| specific ‐ negative symptoms (SANS) | ||||||||
| Usall 2014 | Reboxetine | 46.75 | 26.12 | 24 | Citalopram | 46.63 | 15.84 | 17 |
| specific ‐ positive symptoms (PANSS positive) | ||||||||
| Usall 2014 | Reboxetine | 11.46 | 4.14 | 24 | Citalopram | 10.71 | 3.58 | 17 |
Comparison 2 SELECTIVE NORADRENALINE REUPTAKE INHIBITORS versus ACTIVE CONTROL, Outcome 6 Mental state: 3b. General and specific: Average score (various scales, high=worse) ‐ skewed results ‐ medium term (13 ‐ 26 weeks).

Comparison 2 SELECTIVE NORADRENALINE REUPTAKE INHIBITORS versus ACTIVE CONTROL, Outcome 7 Clinical global response: Average clinical global status score (CGI‐S, high=worse) ‐ short term (2 ‐ 12 weeks).

Comparison 2 SELECTIVE NORADRENALINE REUPTAKE INHIBITORS versus ACTIVE CONTROL, Outcome 8 Leaving the study early: 1a. Short term (2 ‐ 12 weeks).

Comparison 2 SELECTIVE NORADRENALINE REUPTAKE INHIBITORS versus ACTIVE CONTROL, Outcome 9 Leaving the study early: 1b. Medium term (13 ‐ 26 weeks).
| Study tag | Specific patient characteristics | Intervention | Control | Relevant Cochrane Reviews |
| Negative symptoms | Citalopram | Placebo | ||
| Negative symptoms | Citalopram | Placebo | ||
| Celecoxib | Placebo | |||
| Citalopram | Placebo | ‐ | ||
| Clomipramine | Placebo | ‐ | ||
| Citalopram | ‐ | |||
| Fluoxetine | Placebo | ‐ | ||
| Nortiptyline | ‐ | |||
| Fluvoxamine | Placebo | ‐ | ||
| Maprotiline | ‐ | |||
| Negative symptoms | Reboxetine | Placebo | ||
| Negative symptoms | Reboxetine | Placebo | ||
| Negative symptoms | Reboxetine | Placebo | ||
| Negative symptoms | Reboxetine | Placebo | ||
| Negative symptoms | Reboxetine | Control | ||
| Negative symptoms | Reboxetine | Placebo |
| Methods | Allocation: randomised (with sequence generation and allocation concealment clearly described) |
| Participants | Diagnosis: people with schizophrenia (duration > 6m) and prominent negative symptoms (e.g. PANSS negative > 30) N=300 Age: Any, but with recruitment focused on those aged 18‐65yrs Sex: Men and women |
| Interventions | 1. Reboxetine (8‐12mg daily) in combination with any antipsychotic treatment including clozapine 2. Placebo in combination with any antipsychotic treatment including clozapine |
| Outcomes | Mental state: significant improvement in negative symptoms defined as 20% reduction in the PANSS negative scale*, average scores on the PANSS negative scale, significant improvement and average scores on the PANSS total, general, and positive scales and the HRSD Cognitive functioning: significant improvement in a clinical scale of cognitive functioning such as the Schizophrenia Cognition Rating Scale (SCoRS) total score, average scores on neurocognitive testing such as the MATRICS Consensus Cognitive Battery (MCCB) overall composite T‐score and individual domain scores Quality of life: significant improvement in a quality of life scale, average scores on a quality of life scale Clinical global response: significant improvment in clinical global status defined as CGI‐I scores of 1 or 2, average scores on the CGI‐S Service utilisation Adverse effects: leaving the study early (for any reason), serious adverse effects, average weight gain Satisfaction with treatment Social or general functioning |
| Notes | * recommended primary outcome, other outcomes listed are suggestions rather than an exhaustive list |
| Selective noradrenaline reuptake inhibitor (NRI) versus placebo in schizophrenia | ||||||
| Patient or population: adults with schizophrenia | ||||||
| Outcomes | Anticipated absolute effects* (95% CI) | Relative effect | № of participants | Quality of the evidence | Comments | |
| Risk with placebo | Risk with NRI | |||||
| Mental state: significant response or improvement in negative symptoms (PANSS negative subscale, high = worse) ‐ short term (12 weeks) | Study population | RR 3.17 | 50 | ⊕⊝⊝⊝ | Additional information from average negative symptoms score was equivocal | |
| 240 per 1000 | 761 per 1000 | |||||
| Mental state: specific ‐ average positive symptoms score (PANSS positive subscale, high = worse) ‐ short term (2 to 12 weeks) | ‐ | The mean PANSS positive score in the intervention group was 0.16 less (0.96 less to 0.63 more) | ‐ | 294 | ⊕⊕⊝⊝ | No data reported for our prespecified outcome: significant response or improvement in positive symptoms SAPS and BPRS positive subscale outcomes showed similar results |
| Clinical global response: significant response or improvement in global status (CGI‐S, high = worse) ‐ short term (4 weeks) | Study population | RR 0.99 | 28 | ⊕⊝⊝⊝ | Additional information from average clinical global status score found a similar lack of effect | |
| 467 per 1000 | 462 per 1000 | |||||
| Cognitive functioning: significant response or improvement in cognitive functioning | no data reported for this outcome | |||||
| Cognitive functioning: average compostive endpoint score (SMD, low = favours NRI) ‐ short term (2 to 12 weeks) | The mean composite cognitive functioning SMD in the intervention group was 0.04 standard deviations more (0.28 less to 0.36 more) | ‐ | 180 | ⊕⊕⊝⊝ | ||
| Quality of life: Average endpoint score (GQOLI‐74, high = better) ‐ short term (2 to 12 weeks) | ‐ | The mean GQOLI‐74 score in the intervention group was 9.36 more (7.89 more to 10.83 more) | ‐ | 114 | ⊕⊝⊝⊝ | No data reported for our prespecified outcome of significant response or improvement in quality of life |
| Adverse effects: Nausea ‐ short term (2 to 12 weeks) | Study population | RR 0.49 | 176 | ⊕⊕⊝⊝ | ||
| 148 per 1000 | 72 per 1000 | |||||
| *The risk in the intervention group (and its 95% confidence interval) is based on the assumed risk in the comparison group and the relative effect of the intervention (and its 95% CI). | ||||||
| GRADE Working Group grades of evidence | ||||||
| 1 Imprecision: 'Serious' ‐ Small sample size ‐ Downgraded by 1 level 2 Risk of bias: 'Serious' ‐ Methods of random sequence generation and allocation concealment are poorly described ‐ Downgraded by 1 level 3 Risk of bias: 'Serious' ‐ Evidence of selective reporting bias ‐ Downgraded by 1 level 4 Inconsistency: 'No' ‐ Only 1 study ‐ Not downgraded 5 Publication bias: 'Strongly suspected' ‐ Evidence of significant relevant unpublished or unusable results ‐ Downgraded by 1 level 6 Indirectness: 'Serious' ‐ Outcome of interest was not reported so a related outcome was substituted as a surrogate ‐ Downgraded by 1 level 7 Imprecision: 'Serious' ‐ Small sample size, confidence intervals include clinically significant benefits or harms ‐ Downgraded by 1 level 8 Risk of bias: 'Serious' ‐ Includes studies with high risk of attrition, reporting, and other sources of bias ‐ Downgraded by 1 level 9 Indirectness: 'Serious' ‐ Participants recruited specifically with depressive symptoms so unrepresentative of most patients with schizophrenia ‐ Downgraded by 1 level | ||||||
| Subgroup or sensitivity analysis (see text for details) | Number of trials | N | Mean difference | 95% Confidence interval | I² |
| Overall outcome | 5 | 294 | ‐2.17 | ‐3.93 to ‐0.40* | 44% |
| Reboxetine | 4 | 279 | ‐2.20 | ‐4.15 to ‐0.25* | 55% |
| Clozapine‐only studies; excluding skewed change‐scores | 2 | 221 | ‐2.80 | ‐4.87 to ‐0.72* | 75% |
| Excluding studies without clozapine; negative symptoms | 3 | 256 | ‐2.40 | ‐4.48 to ‐0.31* | 65% |
| Excluding studies with imputed SD | 3 | 236 | ‐2.66 | ‐4.50 to ‐0.82* | 55% |
| Fixed‐effect model | 5 | 294 | ‐2.73 | ‐3.71 to ‐1.74* | 44% |
| Low risk of randomisation bias | 2 | 58 | 0.89 | ‐3.60 to 5.37 | 0% |
| * Statistically significant at p<0.05 | |||||
| Subgroup or sensitivity analysis (see text for details) | Number of trials | N | Mean difference | 95% Confidence interval | I² |
| Overall outcome | 4 | 309 | ‐2.84 | ‐5.28 to ‐0.40* | 72% |
| Clozapine‐only studies | 2 | 220 | ‐4.25 | ‐5.89 to ‐2.62* | 0% |
| Excluding outlier; excluding high risk of bias | 3 | 244 | ‐4.20 | ‐5.82 to ‐2.58* | 0% |
| Negative symptoms; excluding imputed SD | 3 | 186 | ‐2.94 | ‐5.54 to ‐0.34* | 81% |
| Fixed‐effect model | 4 | 309 | ‐2.12 | ‐3.12 to ‐1.11* | 72% |
| * Statistically significant at p<0.05 | |||||
| Subgroup or sensitivity analysis (see text for details) | Number of trials | N | Mean difference | 95% Confidence interval | I² |
| Overall outcome | 3 | 219 | ‐3.67 | ‐10.07 to 2.72 | 94% |
| Excluding outlier; excluding clozapine study | 2 | 112 | ‐1.07 | ‐2.59 to 0.46 | 0% |
| Fixed‐effect model | 3 | 219 | ‐3.63 | ‐4.87 to ‐2.39* | 94% |
| * Statistically significant at p<0.05 | |||||
| Subgroup or sensitivity analysis (see text for details) | Number of trials | N | Mean difference | 95% Confidence interval | I² |
| Overall outcome | 6 | 359 | ‐0.99 | ‐2.53 to 0.56 | 71% |
| Reboxetine | 5 | 341 | ‐1.20 | ‐2.80 to 0.40 | 74% |
| Clozapine‐only studies | 2 | 221 | ‐1.60 | ‐3.96 to 0.76 | 84% |
| Excluding studies without clozapine | 3 | 256 | ‐0.75 | ‐3.25 to 1.75 | 81% |
| Negative symptoms | 4 | 321 | ‐1.47 | ‐3.04 to 0.09 | 77% |
| Excluding imputed SD | 4 | 301 | ‐1.68 | ‐3.04 to ‐0.32* | 70% |
| Excluding skewed change scores | 3 | 286 | ‐1.92 | ‐3.28 to ‐0.55* | 75% |
| Fixed‐effect model | 6 | 259 | ‐1.82 | ‐2.46 to ‐1.18* | 71% |
| Low risk of randomisation bias | 2 | 58 | 3.55 | ‐0.43 to 7.54 | 0% |
| Excluding high risk of bias | 5 | 294 | ‐0.12 | ‐2.31 to 2.07 | 71% |
| * Statistically significant at p<0.05 | |||||
| Subgroup or sensitivity analysis (see text for details) | Number of trials | N | Mean difference | 95% Confidence interval | I² |
| Overall outcome | 5 | 294 | ‐0.16 | ‐0.96 to 0.63 | 0% |
| Reboxetine | 4 | 279 | ‐0.24 | ‐1.05 to 0.57 | 0% |
| Clozapine‐only studies | 2 | 221 | ‐0.15 | ‐1.02 to 0.72 | 0% |
| Excluding studies without clozapine; negative symptoms | 3 | 256 | ‐0.22 | ‐1.04 to 0.60 | 0% |
| Fixed‐effect model | 5 | 294 | ‐0.16 | ‐0.96 to 0.63 | 0% |
| Low risk of randomisation bias | 2 | 58 | ‐0.76 | ‐2.93 to 1.40 | 0% |
| Subgroup or sensitivity analysis (see text for details) | Number of trials | N | Mean difference | 95% Confidence interval | I² |
| Overall outcome | 4 | 180 | 0.04 | ‐0.28 to 0.36 | 8% |
| Atomoxetine | 3 | 147 | ‐0.07 | ‐0.55 to 0.41 | 33% |
| Fixed‐effect model | 4 | 180 | 0.06 | ‐0.24 to 0.35 | 8% |
| Low risk of randomisation bias | 2 | 55 | ‐0.18 | ‐1.06 to 0.69 | 61% |
| Excluding high risk of other bias | 2 | 48 | 0.14 | ‐0.42 to 0.71 | 0% |
| Excluding high risk of attrition and reporting bias | 3 | 70 | ‐0.12 | ‐0.66 to 0.43 | 22% |
| Subgroup or sensitivity analysis (see text for details) | Number of trials | N | Mean difference | 95% Confidence interval | I² |
| Overall outcome | 4 | 177 | 0.08 | ‐0.21 to 0.38 | 0% |
| Atomoxetine | 3 | 144 | 0.04 | ‐0.29 to 0.37 | 0% |
| Fixed‐effect model | 4 | 177 | 0.08 | ‐0.21 to 0.38 | 0% |
| Low risk of randomisation bias | 2 | 53 | 0.13 | ‐0.41 to 0.68 | 0% |
| Excluding high risk of attrition and other bias | 2 | 48 | 0.23 | ‐0.34 to 0.80 | 0% |
| Excluding high risk of reporting bias | 3 | 68 | 0.13 | ‐0.34 to 0.61 | 0% |
| Subgroup or sensitivity analysis (see text for details) | Number of trials | N | Mean difference | 95% Confidence interval | I² |
| Overall outcome | 4 | 181 | 0.01 | ‐0.31 to 0.32 | 7% |
| Atomoxetine | 3 | 148 | ‐0.08 | ‐0.40 to 0.25 | 0% |
| Fixed‐effect model | 4 | 181 | 0.01 | ‐0.28 to 0.30 | 7% |
| Low risk of randomisation bias | 2 | 55 | ‐0.06 | ‐1.04 to 0.93 | 69% |
| Excluding high risk of other bias | 2 | 48 | 0.26 | ‐0.31 to 0.83 | 0% |
| Excluding high risk of attrition and reporting bias | 3 | 70 | ‐0.04 | ‐0.66 to 0.58 | 38% |
| Subgroup or sensitivity analysis (see text for details) | Number of trials | N | Mean difference | 95% Confidence interval | I² |
| Overall outcome | 5 | 160 | ‐0.03 | ‐0.35 to 0.28 | 7% |
| Reboxetine; excluding high risk of bias | 4 | 137 | 0.10 | ‐0.23 to 0.42 | 0% |
| Excluding imputed SD; excluding skewed change scores | 3 | 105 | ‐0.15 | ‐0.60 to 0.29 | 37% |
| Fixed‐effect model | 5 | 160 | ‐0.03 | ‐0.32 to 0.27 | 7% |
| Subgroup or sensitivity analysis (see text for details) | Number of trials | N | Relative risk | 95% Confidence interval | I² |
| Overall outcome | 8 | 401 | 0.94 | 0.63 to 1.39 | 0% |
| Atomoxetine | 3 | 173 | 0.89 | 0.49 to 1.59 | 0% |
| Reboxetine | 5 | 200 | 0.95 | 0.54 to 1.70 | 0% |
| Fixed‐effect model | 8 | 401 | 0.95 | 0.64 to 1.41 | 0% |
| Low risk of bias in randomisation | 5 | 182 | 0.92 | 0.54 to 1.56 | 0% |
| Excluding high risk of other bias | 7 | 248 | 1.03 | 0.62 to 1.70 | 0% |
| Excluding high risk of reporting bias | 7 | 252 | 0.97 | 0.58 to 1.60 | 0% |
| Excluding high risk of attrition bias | 8 | 369 | 0.96 | 0.63 to 1.45 | 0% |
| Subgroup or sensitivity analysis (see text for details) | Number of trials | N | Relative risk | 95% Confidence interval | I² |
| Overall outcome | 4 | 178 | 2.08 | 0.70 to 6.21 | 0% |
| Atomoxetine | 3 | 153 | 1.88 | 0.58 to 6.08 | 0% |
| Fixed‐effect model | 4 | 178 | 2.18 | 0.79 to 6.02 | 0% |
| Low risk of bias in randomisation | 2 | 53 | 1.15 | 0.15 to 8.60 | 18% |
| Excluding high risk of other bias | 2 | 45 | 4.48 | 0.56 to 35.52 | 0% |
| Excluding high risk of reporting bias | 3 | 73 | 1.66 | 0.36 to 7.72 | 0% |
| Outcome or subgroup title | No. of studies | No. of participants | Statistical method | Effect size |
| 1 Primary outcome ‐ A. Mental state: Specific ‐ clinically significant response or improvement in negative symptoms (SANS, high=worse) ‐ short term (12 weeks) Show forest plot | 1 | 50 | Risk Ratio (M‐H, Random, 95% CI) | 3.17 [1.52, 6.58] |
| 2 Primary outcome ‐ B. Clinical global response: Clinically significant response or improvement in global status (CGI‐S, high=worse) ‐ short term (4 weeks) Show forest plot | 1 | 28 | Risk Ratio (M‐H, Random, 95% CI) | 0.99 [0.45, 2.20] |
| 3 Mental state: 1. General ‐ clinically significant response or improvement in general/overall symptoms as defined in each study ‐ short term (2‐12 weeks) Show forest plot | 2 | 58 | Risk Ratio (M‐H, Random, 95% CI) | 1.15 [0.64, 2.09] |
| 4 Mental state: 2a. General: Average general/overall symptoms score (various scales, high=worse) ‐ short term (2 ‐ 12 weeks) Show forest plot | 7 | Mean Difference (IV, Random, 95% CI) | Subtotals only | |
| 4.1 BPRS total | 1 | 23 | Mean Difference (IV, Random, 95% CI) | 1.5 [‐6.64, 9.64] |
| 4.2 PANSS general | 5 | 294 | Mean Difference (IV, Random, 95% CI) | ‐2.17 [‐3.93, ‐0.40] |
| 4.3 PANSS total | 4 | 308 | Mean Difference (IV, Random, 95% CI) | ‐2.84 [‐5.28, ‐0.40] |
| 5 Mental state: 2b. General: Average general/overall symptoms score (various scales, high=worse) ‐ medium term (13 ‐ 26 weeks) Show forest plot | 4 | Mean Difference (IV, Random, 95% CI) | Subtotals only | |
| 5.1 BPRS total | 1 | 26 | Mean Difference (IV, Random, 95% CI) | ‐1.4 [‐7.08, 4.28] |
| 5.2 PANSS general | 2 | 154 | Mean Difference (IV, Random, 95% CI) | ‐2.90 [‐7.57, 1.77] |
| 5.3 PANSS total | 3 | 219 | Mean Difference (IV, Random, 95% CI) | ‐3.67 [‐10.07, 2.72] |
| 6 Mental state: 3a. Specific: Average symptoms score (various scales, high=worse) ‐ short term (2 ‐ 12 weeks) Show forest plot | 10 | Mean Difference (IV, Random, 95% CI) | Subtotals only | |
| 6.1 mood (BPRS) | 1 | 23 | Mean Difference (IV, Random, 95% CI) | 0.2 [‐2.60, 3.00] |
| 6.2 mood (HRSD) | 3 | 114 | Mean Difference (IV, Random, 95% CI) | ‐2.37 [‐4.29, ‐0.45] |
| 6.3 negative (PANSS negative) | 6 | 359 | Mean Difference (IV, Random, 95% CI) | ‐0.99 [‐2.53, 0.56] |
| 6.4 negative (SANS) | 3 | 129 | Mean Difference (IV, Random, 95% CI) | ‐2.47 [‐6.22, 1.28] |
| 6.5 negative (SANS ‐ modified) | 1 | 23 | Mean Difference (IV, Random, 95% CI) | ‐5.70 [‐18.01, 6.61] |
| 6.6 positive (BPRS) | 1 | 23 | Mean Difference (IV, Random, 95% CI) | 1.60 [‐2.59, 5.79] |
| 6.7 positive (PANSS positive) | 5 | 294 | Mean Difference (IV, Random, 95% CI) | ‐0.16 [‐0.96, 0.63] |
| 6.8 positive (SAPS) | 3 | 129 | Mean Difference (IV, Random, 95% CI) | 0.73 [‐1.29, 2.74] |
| 7 Mental state: 3b. Specific: Average symptoms score (various scales, high=worse) ‐ medium term (13 ‐ 26 weeks) Show forest plot | 3 | Mean Difference (IV, Random, 95% CI) | Subtotals only | |
| 7.1 negative (PANSS negative) | 3 | 219 | Mean Difference (IV, Random, 95% CI) | ‐3.25 [‐4.04, ‐2.47] |
| 7.2 negative (SANS) | 1 | 47 | Mean Difference (IV, Random, 95% CI) | ‐7.12 [‐19.39, 5.15] |
| 7.3 positive (PANSS positive) | 2 | 154 | Mean Difference (IV, Random, 95% CI) | ‐0.14 [‐1.30, 1.02] |
| 8 Mental state: 4a. General and specific: Average score (various scales, high=worse) ‐ skewed results ‐ short term (2 ‐ 12 weeks) Show forest plot | Other data | No numeric data | ||
| 8.1 general ‐ overall symptoms (BPRS total) | Other data | No numeric data | ||
| 8.2 general ‐ overall symptoms (PANSS general) | Other data | No numeric data | ||
| 8.3 general ‐ overall symptoms (PANSS total) | Other data | No numeric data | ||
| 8.4 specific ‐ mood (BPRS anxiety/depression) | Other data | No numeric data | ||
| 8.5 specific ‐ mood (HRSD) | Other data | No numeric data | ||
| 8.6 specific ‐ negative symptoms (SANS) | Other data | No numeric data | ||
| 8.7 specific ‐ negative symptoms (PANSS negative) | Other data | No numeric data | ||
| 8.8 specific ‐ positive symptoms (BPRS positive) | Other data | No numeric data | ||
| 8.9 specific ‐ positive symptoms (PANSS positive) | Other data | No numeric data | ||
| 8.10 specific ‐ positive symptoms (SAPS) | Other data | No numeric data | ||
| 9 Mental state: 4b. General and specific: Average score (various scales, high=worse) ‐ skewed results ‐ medium term (13 ‐ 26 weeks) Show forest plot | Other data | No numeric data | ||
| 9.1 general ‐ overall symptoms (BPRS total) | Other data | No numeric data | ||
| 9.2 general ‐ overall symptoms (PANSS general) | Other data | No numeric data | ||
| 9.3 general ‐ overall symptoms (PANSS total) | Other data | No numeric data | ||
| 9.4 specific ‐ negative symptoms (PANSS negative) | Other data | No numeric data | ||
| 9.5 specific ‐ negative symptoms (SANS) | Other data | No numeric data | ||
| 9.6 specific ‐ positive symptoms (PANSS positive) | Other data | No numeric data | ||
| 10 Cognitive functioning: 1. General ‐ average composite cognitive functioning score (SMD) Show forest plot | 5 | Std. Mean Difference (Random, 95% CI) | Subtotals only | |
| 10.1 short term (2 ‐ 12 weeks) | 4 | 180 | Std. Mean Difference (Random, 95% CI) | 0.04 [‐0.28, 0.36] |
| 10.2 medium term (13 ‐ 26 weeks) | 1 | 26 | Std. Mean Difference (Random, 95% CI) | ‐0.66 [‐1.46, 0.13] |
| 11 Cognitive functioning: 2. Specific ‐ average individual scores (SMD) ‐ short term (2 ‐ 12 weeks) Show forest plot | 4 | Std. Mean Difference (Random, 95% CI) | Subtotals only | |
| 11.1 working memory | 2 | 53 | Std. Mean Difference (Random, 95% CI) | ‐0.11 [‐0.89, 0.67] |
| 11.2 reasoning/problem solving | 3 | 158 | Std. Mean Difference (Random, 95% CI) | 0.03 [‐0.28, 0.34] |
| 11.3 speed of processing | 4 | 177 | Std. Mean Difference (Random, 95% CI) | 0.08 [‐0.21, 0.38] |
| 11.4 attention | 3 | 161 | Std. Mean Difference (Random, 95% CI) | ‐0.01 [‐0.51, 0.48] |
| 11.5 verbal learning/memory | 4 | 181 | Std. Mean Difference (Random, 95% CI) | 0.01 [‐0.31, 0.32] |
| 11.6 visual learning/memory | 1 | 22 | Std. Mean Difference (Random, 95% CI) | ‐0.44 [‐1.29, 0.41] |
| 12 Quality of life: Average quality of life score (GQOLI‐74, high=better) ‐ short term (2 ‐ 12 weeks) Show forest plot | 1 | Mean Difference (IV, Random, 95% CI) | Subtotals only | |
| 12.1 general ‐ total | 1 | 114 | Mean Difference (IV, Random, 95% CI) | 9.36 [7.89, 10.83] |
| 12.2 specific ‐ well being ‐ material | 1 | 114 | Mean Difference (IV, Random, 95% CI) | 0.21 [‐2.34, 2.76] |
| 12.3 specific ‐ well being ‐ physical | 1 | 114 | Mean Difference (IV, Random, 95% CI) | 0.68 [‐1.35, 2.71] |
| 12.4 specific ‐ well being ‐ psychological | 1 | 114 | Mean Difference (IV, Random, 95% CI) | 10.0 [8.01, 11.99] |
| 12.5 specific ‐ well being ‐ social | 1 | 114 | Mean Difference (IV, Random, 95% CI) | 10.02 [8.03, 12.01] |
| 13 Clinical global response: 1a. Average clinical global status score (CGI‐S, high=worse) ‐ short term (2 ‐ 12 weeks) Show forest plot | 5 | 160 | Mean Difference (IV, Random, 95% CI) | ‐0.03 [‐0.35, 0.28] |
| 14 Clinical global response: 1b. Average clinical global status score (various scales, high=worse) ‐ short term (2 ‐ 12 weeks) ‐ skewed results Show forest plot | Other data | No numeric data | ||
| 14.1 CGI‐I | Other data | No numeric data | ||
| 14.2 CGI‐S | Other data | No numeric data | ||
| 15 Leaving the study early: 1a. Short term (2 ‐ 12 weeks) Show forest plot | 9 | Risk Ratio (M‐H, Random, 95% CI) | Subtotals only | |
| 15.1 any reason | 9 | 401 | Risk Ratio (M‐H, Random, 95% CI) | 0.94 [0.63, 1.39] |
| 15.2 due to adverse effects | 4 | 178 | Risk Ratio (M‐H, Random, 95% CI) | 2.08 [0.70, 6.21] |
| 15.3 due to psychiatric symptoms | 3 | 183 | Risk Ratio (M‐H, Random, 95% CI) | 0.97 [0.44, 2.13] |
| 16 Leaving the study early: 1b. Medium term (13 ‐ 26 weeks) Show forest plot | 3 | Risk Ratio (M‐H, Random, 95% CI) | Subtotals only | |
| 16.1 any reason | 3 | 169 | Risk Ratio (M‐H, Random, 95% CI) | 0.92 [0.52, 1.62] |
| 16.2 due to adverse effects | 1 | 33 | Risk Ratio (M‐H, Random, 95% CI) | 1.47 [0.31, 6.95] |
| 16.3 due to psychiatric symptoms | 1 | 49 | Risk Ratio (M‐H, Random, 95% CI) | 4.44 [0.22, 88.04] |
| 17 Adverse effects: 1. General ‐ short term (binary, 2 ‐ 12 weeks) Show forest plot | 5 | Risk Ratio (M‐H, Random, 95% CI) | Subtotals only | |
| 17.1 any | 3 | 199 | Risk Ratio (M‐H, Random, 95% CI) | 3.49 [0.14, 90.29] |
| 17.2 serious | 3 | 271 | Risk Ratio (M‐H, Random, 95% CI) | 2.95 [0.47, 18.36] |
| 18 Adverse effects: 2a.i. Specific ‐ short term (binary, 2 ‐ 12 weeks) Show forest plot | 7 | Risk Ratio (M‐H, Random, 95% CI) | Subtotals only | |
| 18.1 anticholinergic ‐ constipation | 2 | 146 | Risk Ratio (M‐H, Random, 95% CI) | 0.74 [0.24, 2.29] |
| 18.2 anticholinergic ‐ dry mouth | 3 | 176 | Risk Ratio (M‐H, Random, 95% CI) | 3.46 [1.40, 8.53] |
| 18.3 anticholinergic ‐ impotence | 1 | 30 | Risk Ratio (M‐H, Random, 95% CI) | 3.0 [0.13, 68.26] |
| 18.4 cardiovascular ‐ tachycardia | 1 | 114 | Risk Ratio (M‐H, Random, 95% CI) | 3.33 [0.97, 11.48] |
| 18.5 central nervious system ‐ anorexia | 1 | 32 | Risk Ratio (M‐H, Random, 95% CI) | 0.14 [0.01, 2.56] |
| 18.6 central nervous system ‐ dizziness | 3 | 176 | Risk Ratio (M‐H, Random, 95% CI) | 1.52 [0.54, 4.31] |
| 18.7 central nervous system ‐ fatigue | 2 | 62 | Risk Ratio (M‐H, Random, 95% CI) | 1.00 [0.12, 8.60] |
| 18.8 central nervous system ‐ headache | 1 | 121 | Risk Ratio (M‐H, Random, 95% CI) | 1.23 [0.52, 2.90] |
| 18.9 central nervous system ‐ insomnia | 2 | 146 | Risk Ratio (M‐H, Random, 95% CI) | 4.79 [0.85, 26.84] |
| 18.10 central nervous system ‐ sedation | 2 | 58 | Risk Ratio (M‐H, Random, 95% CI) | 0.74 [0.28, 1.94] |
| 18.11 extrapyramidal ‐ acute dystonia | 1 | 30 | Risk Ratio (M‐H, Random, 95% CI) | 1.0 [0.07, 14.55] |
| 18.12 extrapyramidal ‐ akathisia | 3 | 88 | Risk Ratio (M‐H, Random, 95% CI) | 0.87 [0.25, 3.09] |
| 18.13 extrapyramidal ‐ hypersalivation | 1 | 30 | Risk Ratio (M‐H, Random, 95% CI) | 0.33 [0.01, 7.58] |
| 18.14 extrapyramidal ‐ parkinsonism | 1 | 30 | Risk Ratio (M‐H, Random, 95% CI) | 1.8 [0.79, 4.11] |
| 18.15 extrapyramidal ‐ tremor | 1 | 32 | Risk Ratio (M‐H, Random, 95% CI) | 1.0 [0.24, 4.23] |
| 18.16 extrapyramidal ‐ stiffness | 1 | 32 | Risk Ratio (M‐H, Random, 95% CI) | 0.2 [0.03, 1.53] |
| 18.17 extrapyramidal ‐ use of antiparkinson medication | 3 | 135 | Risk Ratio (M‐H, Random, 95% CI) | 0.80 [0.44, 1.45] |
| 18.18 gastrointestinal ‐ abdominal pain | 1 | 32 | Risk Ratio (M‐H, Random, 95% CI) | 1.5 [0.29, 7.81] |
| 18.19 gastrointestinal ‐ nausea | 3 | 176 | Risk Ratio (M‐H, Random, 95% CI) | 0.49 [0.10, 2.41] |
| 18.20 gastrointestinal ‐ vomiting | 1 | 32 | Risk Ratio (M‐H, Random, 95% CI) | 0.2 [0.01, 3.86] |
| 18.21 gastrointestinal ‐ diarrhoea | 1 | 32 | Risk Ratio (M‐H, Random, 95% CI) | 0.2 [0.01, 3.86] |
| 18.22 immune system ‐ rash | 1 | 30 | Risk Ratio (M‐H, Random, 95% CI) | 3.0 [0.13, 68.26] |
| 18.23 immune system ‐ sore throat | 1 | 32 | Risk Ratio (M‐H, Random, 95% CI) | 0.2 [0.01, 3.86] |
| 18.24 metabolic ‐ weight loss | 1 | 32 | Risk Ratio (M‐H, Random, 95% CI) | 0.33 [0.04, 2.87] |
| 18.25 metabolic ‐ significant weight gain | 2 | 85 | Risk Ratio (M‐H, Random, 95% CI) | 0.38 [0.20, 0.73] |
| 19 Adverse effects: 2a.ii. Specific ‐ extrapyramidal ‐ average change score (continuous, various scales, high=worse) ‐ short term (2 ‐ 12 weeks) Show forest plot | 2 | Mean Difference (IV, Random, 95% CI) | Subtotals only | |
| 19.1 AIMS | 1 | 26 | Mean Difference (IV, Random, 95% CI) | 0.3 [‐2.34, 2.94] |
| 19.2 BAS | 1 | 59 | Mean Difference (IV, Random, 95% CI) | ‐0.18 [‐0.65, 0.29] |
| 19.3 SAS | 2 | 85 | Mean Difference (IV, Random, 95% CI) | ‐0.27 [‐1.79, 1.25] |
| 20 Adverse effects: 2a.iii. Specific ‐ extrapyramidal ‐ average change score (continuous, various scales, high=worse) ‐ short term (2 ‐ 12 weeks) ‐ skewed results Show forest plot | Other data | No numeric data | ||
| 20.1 AIMS | Other data | No numeric data | ||
| 20.2 SAS | Other data | No numeric data | ||
| 21 Adverse effects: 2b.i. Specific ‐ medium term (binary, 13 ‐ 26 weeks) Show forest plot | 2 | Risk Ratio (M‐H, Random, 95% CI) | Subtotals only | |
| 21.1 anticholinergic ‐ constipation | 1 | 107 | Risk Ratio (M‐H, Random, 95% CI) | 4.58 [1.04, 20.23] |
| 21.2 anticholinergic ‐ dry mouth | 1 | 107 | Risk Ratio (M‐H, Random, 95% CI) | 1.53 [0.27, 8.78] |
| 21.3 anticholinergic ‐ sweating | 1 | 107 | Risk Ratio (M‐H, Random, 95% CI) | 13.24 [0.76, 229.32] |
| 21.4 cardiovascular ‐ QT prolongation | 1 | 37 | Risk Ratio (M‐H, Random, 95% CI) | 3.4 [0.42, 27.59] |
| 21.5 cardiovascular ‐ tachycardia | 1 | 107 | Risk Ratio (M‐H, Random, 95% CI) | 1.78 [0.55, 5.74] |
| 21.6 central nervous system ‐ dizziness | 1 | 107 | Risk Ratio (M‐H, Random, 95% CI) | 1.36 [0.32, 5.78] |
| 21.7 central nervous system ‐ insomnia | 1 | 107 | Risk Ratio (M‐H, Random, 95% CI) | 13.24 [0.76, 229.32] |
| 21.8 extrapyramidal ‐ tremor | 1 | 37 | Risk Ratio (M‐H, Random, 95% CI) | 0.43 [0.20, 0.89] |
| 21.9 gastrointestinal ‐ nausea | 1 | 107 | Risk Ratio (M‐H, Random, 95% CI) | 5.09 [0.62, 42.16] |
| 22 Adverse effects: 2a.iv. Specific ‐ metabolic ‐ average weight gain (continuous, increase in kg) Show forest plot | 4 | Mean Difference (IV, Random, 95% CI) | Subtotals only | |
| 22.1 short term (2 ‐ 12 weeks) | 3 | 186 | Mean Difference (IV, Random, 95% CI) | ‐2.17 [‐3.19, ‐1.15] |
| 22.2 medium term (13 ‐ 26 weeks) | 2 | 133 | Mean Difference (IV, Random, 95% CI) | ‐3.12 [‐10.67, 4.42] |
| 23 Social or general functioning: Average social functioning score (various subscales) ‐ short‐term (2 ‐ 12 weeks) Show forest plot | 2 | Mean Difference (IV, Random, 95% CI) | Subtotals only | |
| 23.1 activity ‐ activities (inverted SLOF, high=worse) | 1 | 15 | Mean Difference (IV, Random, 95% CI) | 0.0 [‐3.30, 3.30] |
| 23.2 activity ‐ hospital activity (SSPI, high=worse) | 1 | 114 | Mean Difference (IV, Random, 95% CI) | ‐0.03 [‐0.17, 0.11] |
| 23.3 activity ‐ disease indoor activity (SSPI, high=worse) | 1 | 114 | Mean Difference (IV, Random, 95% CI) | ‐0.14 [‐0.28, ‐0.00] |
| 23.4 activity ‐ physical functioning (inverted SLOF, high=worse) | 1 | 15 | Mean Difference (IV, Random, 95% CI) | ‐0.3 [‐1.12, 0.52] |
| 23.5 personal care ‐ personal care skills (inverted SLOF, high=worse) | 1 | 15 | Mean Difference (IV, Random, 95% CI) | ‐0.20 [‐1.43, 1.03] |
| 23.6 personal care ‐ self‐care (SSPI, high=worse) | 1 | 114 | Mean Difference (IV, Random, 95% CI) | ‐0.03 [‐0.22, 0.16] |
| 23.7 personal care ‐ social acceptability (inverted SLOF, high=worse) | 1 | 15 | Mean Difference (IV, Random, 95% CI) | 0.1 [‐0.72, 0.92] |
| 23.8 relationships ‐ family role (SSPI, high=worse) | 1 | 114 | Mean Difference (IV, Random, 95% CI) | ‐0.09 [‐0.23, 0.05] |
| 23.9 relationships ‐ interest and concern in the external environment (SSPI, high=worse) | 1 | 114 | Mean Difference (IV, Random, 95% CI) | ‐0.19 [‐0.37, ‐0.01] |
| 23.10 relationships ‐ interpersonal relationships (inverted SLOF, high=worse) | 1 | 15 | Mean Difference (IV, Random, 95% CI) | ‐1.20 [‐5.41, 3.01] |
| 23.11 relationships ‐ relationships and caring for others (SSPI, high=worse) | 1 | 114 | Mean Difference (IV, Random, 95% CI) | ‐0.09 [‐0.24, 0.06] |
| 23.12 relationships ‐ sexual role (SSPI, high=worse) | 1 | 114 | Mean Difference (IV, Random, 95% CI) | ‐0.03 [‐0.21, 0.15] |
| 23.13 relationships ‐ social withdrawal (SSPI, high=worse) | 1 | 114 | Mean Difference (IV, Random, 95% CI) | ‐0.32 [‐0.49, ‐0.15] |
| 23.14 work ‐ professional skills (SSPI, high=worse) | 1 | 114 | Mean Difference (IV, Random, 95% CI) | ‐0.19 [‐0.34, ‐0.04] |
| 23.15 work ‐ responsibility and planning (SSPI, high=worse) | 1 | 114 | Mean Difference (IV, Random, 95% CI) | ‐0.03 [‐0.21, 0.15] |
| 23.16 work ‐ work skills (inverted SLOF, high=worse) | 1 | 15 | Mean Difference (IV, Random, 95% CI) | ‐3.0 [‐5.48, ‐0.52] |
| Outcome or subgroup title | No. of studies | No. of participants | Statistical method | Effect size |
| 1 Mental state: 1a. General: Average general/overall symptoms score (PANSS general, high=worse) ‐ short term (2 ‐ 12 weeks) Show forest plot | 1 | 35 | Mean Difference (IV, Random, 95% CI) | 2.90 [‐2.85, 8.65] |
| 2 Mental state: 1b. General: Average general/overall symptoms score (various scales, high=worse) ‐ medium term (13 ‐ 26 weeks) Show forest plot | 1 | Mean Difference (IV, Random, 95% CI) | Subtotals only | |
| 2.1 PANSS total | 1 | 41 | Mean Difference (IV, Random, 95% CI) | 1.62 [‐6.89, 10.13] |
| 2.2 PANSS general | 1 | 41 | Mean Difference (IV, Random, 95% CI) | 0.62 [‐2.00, 5.24] |
| 3 Mental state: 2a. Specific: Average symptoms score (various scales, high=worse) ‐ short term (2 ‐ 12 weeks) Show forest plot | 1 | Mean Difference (IV, Fixed, 95% CI) | Subtotals only | |
| 3.1 mood (HRSD) | 1 | 35 | Mean Difference (IV, Fixed, 95% CI) | 3.00 [‐1.24, 7.24] |
| 3.2 negative (PANSS negative) | 1 | 35 | Mean Difference (IV, Fixed, 95% CI) | 1.5 [‐4.34, 7.34] |
| 3.3 positive (PANSS positive) | 1 | 35 | Mean Difference (IV, Fixed, 95% CI) | 1.7 [‐1.52, 4.92] |
| 4 Mental state: 2b. Specific: Average symptoms score (various scales, high=worse) ‐ medium term (13 ‐ 26 weeks) Show forest plot | 1 | Mean Difference (IV, Random, 95% CI) | Subtotals only | |
| 4.1 negative (PANSS negative) | 1 | 41 | Mean Difference (IV, Random, 95% CI) | 0.26 [‐3.66, 4.18] |
| 4.2 negative (SANS) | 1 | 41 | Mean Difference (IV, Random, 95% CI) | ‐0.27 [‐12.69, 12.15] |
| 4.3 positive (PANSS positive) | 1 | 41 | Mean Difference (IV, Random, 95% CI) | 0.74 [‐1.86, 3.34] |
| 5 Mental state: 3a. General and specific: Average score (various scales, high=worse) ‐ skewed results ‐ short term (2 ‐ 12 weeks) Show forest plot | Other data | No numeric data | ||
| 5.1 general ‐ overall symptoms (PANSS general) | Other data | No numeric data | ||
| 5.2 specific ‐ mood (HRSD) | Other data | No numeric data | ||
| 5.3 specific ‐ negative symptoms (PANSS negative) | Other data | No numeric data | ||
| 5.4 specific ‐ positive symptoms (PANSS positive) | Other data | No numeric data | ||
| 6 Mental state: 3b. General and specific: Average score (various scales, high=worse) ‐ skewed results ‐ medium term (13 ‐ 26 weeks) Show forest plot | Other data | No numeric data | ||
| 6.1 general ‐ overall symptoms (PANSS general) | Other data | No numeric data | ||
| 6.2 general ‐ overall symptoms (PANSS total) | Other data | No numeric data | ||
| 6.3 specific ‐ negative symptoms (PANSS negative) | Other data | No numeric data | ||
| 6.4 specific ‐ negative symptoms (SANS) | Other data | No numeric data | ||
| 6.5 specific ‐ positive symptoms (PANSS positive) | Other data | No numeric data | ||
| 7 Clinical global response: Average clinical global status score (CGI‐S, high=worse) ‐ short term (2 ‐ 12 weeks) Show forest plot | 1 | 35 | Mean Difference (IV, Random, 95% CI) | 0.0 [‐0.89, 0.89] |
| 8 Leaving the study early: 1a. Short term (2 ‐ 12 weeks) Show forest plot | 1 | Risk Ratio (M‐H, Random, 95% CI) | Subtotals only | |
| 8.1 any reason | 1 | 35 | Risk Ratio (M‐H, Random, 95% CI) | 0.63 [0.17, 2.41] |
| 9 Leaving the study early: 1b. Medium term (13 ‐ 26 weeks) Show forest plot | 1 | Risk Ratio (M‐H, Random, 95% CI) | Subtotals only | |
| 9.1 any reason | 1 | 57 | Risk Ratio (M‐H, Random, 95% CI) | 1.13 [0.48, 2.67] |
| 9.2 due to psychiatric symptoms | 1 | 49 | Risk Ratio (M‐H, Random, 95% CI) | 1.77 [0.17, 18.26] |