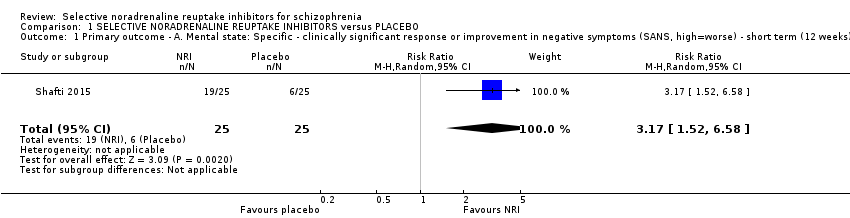
| 1 Primary outcome ‐ A. Mental state: Specific ‐ clinically significant response or improvement in negative symptoms (SANS, high=worse) ‐ short term (12 weeks) Show forest plot | 1 | 50 | Risk Ratio (M‐H, Random, 95% CI) | 3.17 [1.52, 6.58] |
|
| 2 Primary outcome ‐ B. Clinical global response: Clinically significant response or improvement in global status (CGI‐S, high=worse) ‐ short term (4 weeks) Show forest plot | 1 | 28 | Risk Ratio (M‐H, Random, 95% CI) | 0.99 [0.45, 2.20] |
|
| 3 Mental state: 1. General ‐ clinically significant response or improvement in general/overall symptoms as defined in each study ‐ short term (2‐12 weeks) Show forest plot | 2 | 58 | Risk Ratio (M‐H, Random, 95% CI) | 1.15 [0.64, 2.09] |
|
| 4 Mental state: 2a. General: Average general/overall symptoms score (various scales, high=worse) ‐ short term (2 ‐ 12 weeks) Show forest plot | 7 | | Mean Difference (IV, Random, 95% CI) | Subtotals only |
|
| 4.1 BPRS total | 1 | 23 | Mean Difference (IV, Random, 95% CI) | 1.5 [‐6.64, 9.64] |
| 4.2 PANSS general | 5 | 294 | Mean Difference (IV, Random, 95% CI) | ‐2.17 [‐3.93, ‐0.40] |
| 4.3 PANSS total | 4 | 308 | Mean Difference (IV, Random, 95% CI) | ‐2.84 [‐5.28, ‐0.40] |
| 5 Mental state: 2b. General: Average general/overall symptoms score (various scales, high=worse) ‐ medium term (13 ‐ 26 weeks) Show forest plot | 4 | | Mean Difference (IV, Random, 95% CI) | Subtotals only |
|
| 5.1 BPRS total | 1 | 26 | Mean Difference (IV, Random, 95% CI) | ‐1.4 [‐7.08, 4.28] |
| 5.2 PANSS general | 2 | 154 | Mean Difference (IV, Random, 95% CI) | ‐2.90 [‐7.57, 1.77] |
| 5.3 PANSS total | 3 | 219 | Mean Difference (IV, Random, 95% CI) | ‐3.67 [‐10.07, 2.72] |
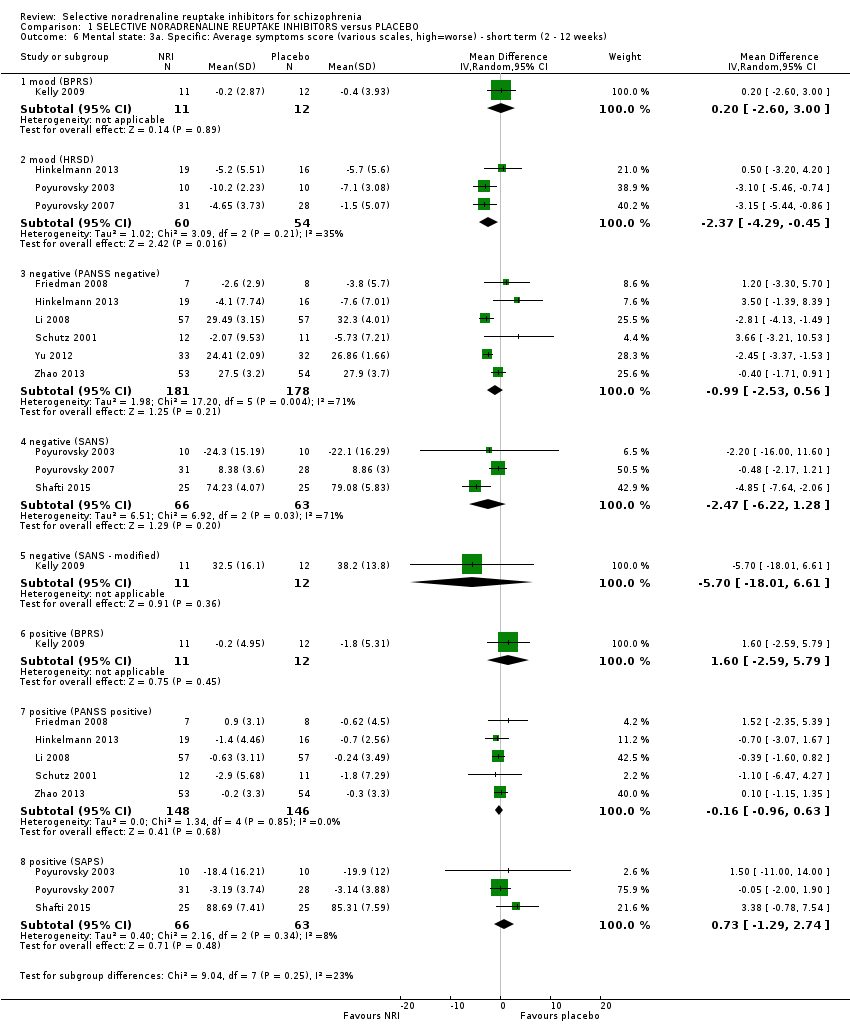
| 6 Mental state: 3a. Specific: Average symptoms score (various scales, high=worse) ‐ short term (2 ‐ 12 weeks) Show forest plot | 10 | | Mean Difference (IV, Random, 95% CI) | Subtotals only |
|
| 6.1 mood (BPRS) | 1 | 23 | Mean Difference (IV, Random, 95% CI) | 0.2 [‐2.60, 3.00] |
| 6.2 mood (HRSD) | 3 | 114 | Mean Difference (IV, Random, 95% CI) | ‐2.37 [‐4.29, ‐0.45] |
| 6.3 negative (PANSS negative) | 6 | 359 | Mean Difference (IV, Random, 95% CI) | ‐0.99 [‐2.53, 0.56] |
| 6.4 negative (SANS) | 3 | 129 | Mean Difference (IV, Random, 95% CI) | ‐2.47 [‐6.22, 1.28] |
| 6.5 negative (SANS ‐ modified) | 1 | 23 | Mean Difference (IV, Random, 95% CI) | ‐5.70 [‐18.01, 6.61] |
| 6.6 positive (BPRS) | 1 | 23 | Mean Difference (IV, Random, 95% CI) | 1.60 [‐2.59, 5.79] |
| 6.7 positive (PANSS positive) | 5 | 294 | Mean Difference (IV, Random, 95% CI) | ‐0.16 [‐0.96, 0.63] |
| 6.8 positive (SAPS) | 3 | 129 | Mean Difference (IV, Random, 95% CI) | 0.73 [‐1.29, 2.74] |
| 7 Mental state: 3b. Specific: Average symptoms score (various scales, high=worse) ‐ medium term (13 ‐ 26 weeks) Show forest plot | 3 | | Mean Difference (IV, Random, 95% CI) | Subtotals only |
|
| 7.1 negative (PANSS negative) | 3 | 219 | Mean Difference (IV, Random, 95% CI) | ‐3.25 [‐4.04, ‐2.47] |
| 7.2 negative (SANS) | 1 | 47 | Mean Difference (IV, Random, 95% CI) | ‐7.12 [‐19.39, 5.15] |
| 7.3 positive (PANSS positive) | 2 | 154 | Mean Difference (IV, Random, 95% CI) | ‐0.14 [‐1.30, 1.02] |
| 8 Mental state: 4a. General and specific: Average score (various scales, high=worse) ‐ skewed results ‐ short term (2 ‐ 12 weeks) Show forest plot | | | Other data | No numeric data |
|
| 8.1 general ‐ overall symptoms (BPRS total) | | | Other data | No numeric data |
| 8.2 general ‐ overall symptoms (PANSS general) | | | Other data | No numeric data |
| 8.3 general ‐ overall symptoms (PANSS total) | | | Other data | No numeric data |
| 8.4 specific ‐ mood (BPRS anxiety/depression) | | | Other data | No numeric data |
| 8.5 specific ‐ mood (HRSD) | | | Other data | No numeric data |
| 8.6 specific ‐ negative symptoms (SANS) | | | Other data | No numeric data |
| 8.7 specific ‐ negative symptoms (PANSS negative) | | | Other data | No numeric data |
| 8.8 specific ‐ positive symptoms (BPRS positive) | | | Other data | No numeric data |
| 8.9 specific ‐ positive symptoms (PANSS positive) | | | Other data | No numeric data |
| 8.10 specific ‐ positive symptoms (SAPS) | | | Other data | No numeric data |
| 9 Mental state: 4b. General and specific: Average score (various scales, high=worse) ‐ skewed results ‐ medium term (13 ‐ 26 weeks) Show forest plot | | | Other data | No numeric data |
|
| 9.1 general ‐ overall symptoms (BPRS total) | | | Other data | No numeric data |
| 9.2 general ‐ overall symptoms (PANSS general) | | | Other data | No numeric data |
| 9.3 general ‐ overall symptoms (PANSS total) | | | Other data | No numeric data |
| 9.4 specific ‐ negative symptoms (PANSS negative) | | | Other data | No numeric data |
| 9.5 specific ‐ negative symptoms (SANS) | | | Other data | No numeric data |
| 9.6 specific ‐ positive symptoms (PANSS positive) | | | Other data | No numeric data |
| 10 Cognitive functioning: 1. General ‐ average composite cognitive functioning score (SMD) Show forest plot | 5 | | Std. Mean Difference (Random, 95% CI) | Subtotals only |
|
| 10.1 short term (2 ‐ 12 weeks) | 4 | 180 | Std. Mean Difference (Random, 95% CI) | 0.04 [‐0.28, 0.36] |
| 10.2 medium term (13 ‐ 26 weeks) | 1 | 26 | Std. Mean Difference (Random, 95% CI) | ‐0.66 [‐1.46, 0.13] |
| 11 Cognitive functioning: 2. Specific ‐ average individual scores (SMD) ‐ short term (2 ‐ 12 weeks) Show forest plot | 4 | | Std. Mean Difference (Random, 95% CI) | Subtotals only |
|
| 11.1 working memory | 2 | 53 | Std. Mean Difference (Random, 95% CI) | ‐0.11 [‐0.89, 0.67] |
| 11.2 reasoning/problem solving | 3 | 158 | Std. Mean Difference (Random, 95% CI) | 0.03 [‐0.28, 0.34] |
| 11.3 speed of processing | 4 | 177 | Std. Mean Difference (Random, 95% CI) | 0.08 [‐0.21, 0.38] |
| 11.4 attention | 3 | 161 | Std. Mean Difference (Random, 95% CI) | ‐0.01 [‐0.51, 0.48] |
| 11.5 verbal learning/memory | 4 | 181 | Std. Mean Difference (Random, 95% CI) | 0.01 [‐0.31, 0.32] |
| 11.6 visual learning/memory | 1 | 22 | Std. Mean Difference (Random, 95% CI) | ‐0.44 [‐1.29, 0.41] |
| 12 Quality of life: Average quality of life score (GQOLI‐74, high=better) ‐ short term (2 ‐ 12 weeks) Show forest plot | 1 | | Mean Difference (IV, Random, 95% CI) | Subtotals only |
|
| 12.1 general ‐ total | 1 | 114 | Mean Difference (IV, Random, 95% CI) | 9.36 [7.89, 10.83] |
| 12.2 specific ‐ well being ‐ material | 1 | 114 | Mean Difference (IV, Random, 95% CI) | 0.21 [‐2.34, 2.76] |
| 12.3 specific ‐ well being ‐ physical | 1 | 114 | Mean Difference (IV, Random, 95% CI) | 0.68 [‐1.35, 2.71] |
| 12.4 specific ‐ well being ‐ psychological | 1 | 114 | Mean Difference (IV, Random, 95% CI) | 10.0 [8.01, 11.99] |
| 12.5 specific ‐ well being ‐ social | 1 | 114 | Mean Difference (IV, Random, 95% CI) | 10.02 [8.03, 12.01] |
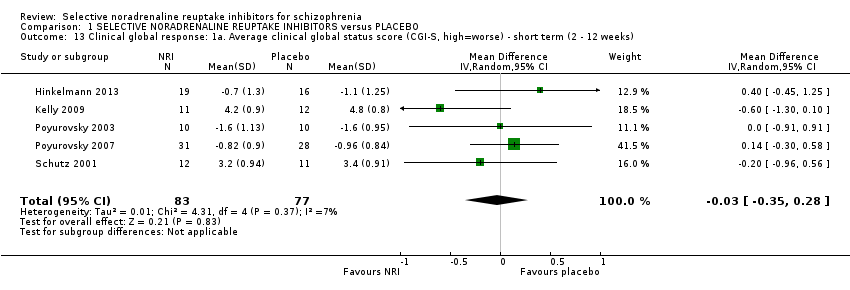
| 13 Clinical global response: 1a. Average clinical global status score (CGI‐S, high=worse) ‐ short term (2 ‐ 12 weeks) Show forest plot | 5 | 160 | Mean Difference (IV, Random, 95% CI) | ‐0.03 [‐0.35, 0.28] |
|
| 14 Clinical global response: 1b. Average clinical global status score (various scales, high=worse) ‐ short term (2 ‐ 12 weeks) ‐ skewed results Show forest plot | | | Other data | No numeric data |
|
| 14.1 CGI‐I | | | Other data | No numeric data |
| 14.2 CGI‐S | | | Other data | No numeric data |
| 15 Leaving the study early: 1a. Short term (2 ‐ 12 weeks) Show forest plot | 9 | | Risk Ratio (M‐H, Random, 95% CI) | Subtotals only |
|
| 15.1 any reason | 9 | 401 | Risk Ratio (M‐H, Random, 95% CI) | 0.94 [0.63, 1.39] |
| 15.2 due to adverse effects | 4 | 178 | Risk Ratio (M‐H, Random, 95% CI) | 2.08 [0.70, 6.21] |
| 15.3 due to psychiatric symptoms | 3 | 183 | Risk Ratio (M‐H, Random, 95% CI) | 0.97 [0.44, 2.13] |
| 16 Leaving the study early: 1b. Medium term (13 ‐ 26 weeks) Show forest plot | 3 | | Risk Ratio (M‐H, Random, 95% CI) | Subtotals only |
|
| 16.1 any reason | 3 | 169 | Risk Ratio (M‐H, Random, 95% CI) | 0.92 [0.52, 1.62] |
| 16.2 due to adverse effects | 1 | 33 | Risk Ratio (M‐H, Random, 95% CI) | 1.47 [0.31, 6.95] |
| 16.3 due to psychiatric symptoms | 1 | 49 | Risk Ratio (M‐H, Random, 95% CI) | 4.44 [0.22, 88.04] |
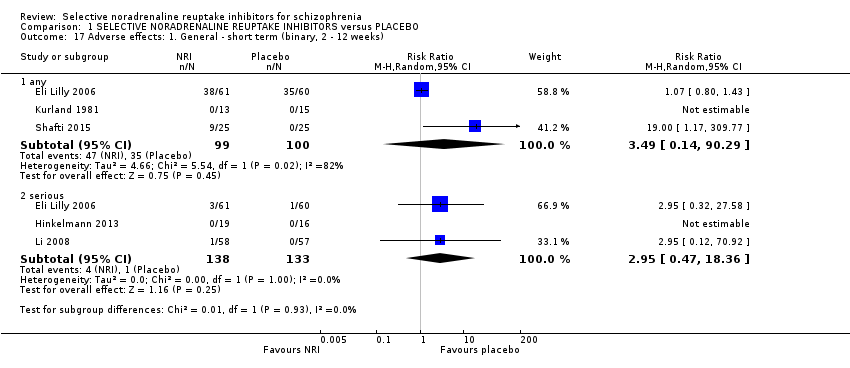
| 17 Adverse effects: 1. General ‐ short term (binary, 2 ‐ 12 weeks) Show forest plot | 5 | | Risk Ratio (M‐H, Random, 95% CI) | Subtotals only |
|
| 17.1 any | 3 | 199 | Risk Ratio (M‐H, Random, 95% CI) | 3.49 [0.14, 90.29] |
| 17.2 serious | 3 | 271 | Risk Ratio (M‐H, Random, 95% CI) | 2.95 [0.47, 18.36] |
| 18 Adverse effects: 2a.i. Specific ‐ short term (binary, 2 ‐ 12 weeks) Show forest plot | 7 | | Risk Ratio (M‐H, Random, 95% CI) | Subtotals only |
|
| 18.1 anticholinergic ‐ constipation | 2 | 146 | Risk Ratio (M‐H, Random, 95% CI) | 0.74 [0.24, 2.29] |
| 18.2 anticholinergic ‐ dry mouth | 3 | 176 | Risk Ratio (M‐H, Random, 95% CI) | 3.46 [1.40, 8.53] |
| 18.3 anticholinergic ‐ impotence | 1 | 30 | Risk Ratio (M‐H, Random, 95% CI) | 3.0 [0.13, 68.26] |
| 18.4 cardiovascular ‐ tachycardia | 1 | 114 | Risk Ratio (M‐H, Random, 95% CI) | 3.33 [0.97, 11.48] |
| 18.5 central nervious system ‐ anorexia | 1 | 32 | Risk Ratio (M‐H, Random, 95% CI) | 0.14 [0.01, 2.56] |
| 18.6 central nervous system ‐ dizziness | 3 | 176 | Risk Ratio (M‐H, Random, 95% CI) | 1.52 [0.54, 4.31] |
| 18.7 central nervous system ‐ fatigue | 2 | 62 | Risk Ratio (M‐H, Random, 95% CI) | 1.00 [0.12, 8.60] |
| 18.8 central nervous system ‐ headache | 1 | 121 | Risk Ratio (M‐H, Random, 95% CI) | 1.23 [0.52, 2.90] |
| 18.9 central nervous system ‐ insomnia | 2 | 146 | Risk Ratio (M‐H, Random, 95% CI) | 4.79 [0.85, 26.84] |
| 18.10 central nervous system ‐ sedation | 2 | 58 | Risk Ratio (M‐H, Random, 95% CI) | 0.74 [0.28, 1.94] |
| 18.11 extrapyramidal ‐ acute dystonia | 1 | 30 | Risk Ratio (M‐H, Random, 95% CI) | 1.0 [0.07, 14.55] |
| 18.12 extrapyramidal ‐ akathisia | 3 | 88 | Risk Ratio (M‐H, Random, 95% CI) | 0.87 [0.25, 3.09] |
| 18.13 extrapyramidal ‐ hypersalivation | 1 | 30 | Risk Ratio (M‐H, Random, 95% CI) | 0.33 [0.01, 7.58] |
| 18.14 extrapyramidal ‐ parkinsonism | 1 | 30 | Risk Ratio (M‐H, Random, 95% CI) | 1.8 [0.79, 4.11] |
| 18.15 extrapyramidal ‐ tremor | 1 | 32 | Risk Ratio (M‐H, Random, 95% CI) | 1.0 [0.24, 4.23] |
| 18.16 extrapyramidal ‐ stiffness | 1 | 32 | Risk Ratio (M‐H, Random, 95% CI) | 0.2 [0.03, 1.53] |
| 18.17 extrapyramidal ‐ use of antiparkinson medication | 3 | 135 | Risk Ratio (M‐H, Random, 95% CI) | 0.80 [0.44, 1.45] |
| 18.18 gastrointestinal ‐ abdominal pain | 1 | 32 | Risk Ratio (M‐H, Random, 95% CI) | 1.5 [0.29, 7.81] |
| 18.19 gastrointestinal ‐ nausea | 3 | 176 | Risk Ratio (M‐H, Random, 95% CI) | 0.49 [0.10, 2.41] |
| 18.20 gastrointestinal ‐ vomiting | 1 | 32 | Risk Ratio (M‐H, Random, 95% CI) | 0.2 [0.01, 3.86] |
| 18.21 gastrointestinal ‐ diarrhoea | 1 | 32 | Risk Ratio (M‐H, Random, 95% CI) | 0.2 [0.01, 3.86] |
| 18.22 immune system ‐ rash | 1 | 30 | Risk Ratio (M‐H, Random, 95% CI) | 3.0 [0.13, 68.26] |
| 18.23 immune system ‐ sore throat | 1 | 32 | Risk Ratio (M‐H, Random, 95% CI) | 0.2 [0.01, 3.86] |
| 18.24 metabolic ‐ weight loss | 1 | 32 | Risk Ratio (M‐H, Random, 95% CI) | 0.33 [0.04, 2.87] |
| 18.25 metabolic ‐ significant weight gain | 2 | 85 | Risk Ratio (M‐H, Random, 95% CI) | 0.38 [0.20, 0.73] |
| 19 Adverse effects: 2a.ii. Specific ‐ extrapyramidal ‐ average change score (continuous, various scales, high=worse) ‐ short term (2 ‐ 12 weeks) Show forest plot | 2 | | Mean Difference (IV, Random, 95% CI) | Subtotals only |
|
| 19.1 AIMS | 1 | 26 | Mean Difference (IV, Random, 95% CI) | 0.3 [‐2.34, 2.94] |
| 19.2 BAS | 1 | 59 | Mean Difference (IV, Random, 95% CI) | ‐0.18 [‐0.65, 0.29] |
| 19.3 SAS | 2 | 85 | Mean Difference (IV, Random, 95% CI) | ‐0.27 [‐1.79, 1.25] |
| 20 Adverse effects: 2a.iii. Specific ‐ extrapyramidal ‐ average change score (continuous, various scales, high=worse) ‐ short term (2 ‐ 12 weeks) ‐ skewed results Show forest plot | | | Other data | No numeric data |
|
| 20.1 AIMS | | | Other data | No numeric data |
| 20.2 SAS | | | Other data | No numeric data |
| 21 Adverse effects: 2b.i. Specific ‐ medium term (binary, 13 ‐ 26 weeks) Show forest plot | 2 | | Risk Ratio (M‐H, Random, 95% CI) | Subtotals only |
|
| 21.1 anticholinergic ‐ constipation | 1 | 107 | Risk Ratio (M‐H, Random, 95% CI) | 4.58 [1.04, 20.23] |
| 21.2 anticholinergic ‐ dry mouth | 1 | 107 | Risk Ratio (M‐H, Random, 95% CI) | 1.53 [0.27, 8.78] |
| 21.3 anticholinergic ‐ sweating | 1 | 107 | Risk Ratio (M‐H, Random, 95% CI) | 13.24 [0.76, 229.32] |
| 21.4 cardiovascular ‐ QT prolongation | 1 | 37 | Risk Ratio (M‐H, Random, 95% CI) | 3.4 [0.42, 27.59] |
| 21.5 cardiovascular ‐ tachycardia | 1 | 107 | Risk Ratio (M‐H, Random, 95% CI) | 1.78 [0.55, 5.74] |
| 21.6 central nervous system ‐ dizziness | 1 | 107 | Risk Ratio (M‐H, Random, 95% CI) | 1.36 [0.32, 5.78] |
| 21.7 central nervous system ‐ insomnia | 1 | 107 | Risk Ratio (M‐H, Random, 95% CI) | 13.24 [0.76, 229.32] |
| 21.8 extrapyramidal ‐ tremor | 1 | 37 | Risk Ratio (M‐H, Random, 95% CI) | 0.43 [0.20, 0.89] |
| 21.9 gastrointestinal ‐ nausea | 1 | 107 | Risk Ratio (M‐H, Random, 95% CI) | 5.09 [0.62, 42.16] |
| 22 Adverse effects: 2a.iv. Specific ‐ metabolic ‐ average weight gain (continuous, increase in kg) Show forest plot | 4 | | Mean Difference (IV, Random, 95% CI) | Subtotals only |
|
| 22.1 short term (2 ‐ 12 weeks) | 3 | 186 | Mean Difference (IV, Random, 95% CI) | ‐2.17 [‐3.19, ‐1.15] |
| 22.2 medium term (13 ‐ 26 weeks) | 2 | 133 | Mean Difference (IV, Random, 95% CI) | ‐3.12 [‐10.67, 4.42] |
| 23 Social or general functioning: Average social functioning score (various subscales) ‐ short‐term (2 ‐ 12 weeks) Show forest plot | 2 | | Mean Difference (IV, Random, 95% CI) | Subtotals only |
|
| 23.1 activity ‐ activities (inverted SLOF, high=worse) | 1 | 15 | Mean Difference (IV, Random, 95% CI) | 0.0 [‐3.30, 3.30] |
| 23.2 activity ‐ hospital activity (SSPI, high=worse) | 1 | 114 | Mean Difference (IV, Random, 95% CI) | ‐0.03 [‐0.17, 0.11] |
| 23.3 activity ‐ disease indoor activity (SSPI, high=worse) | 1 | 114 | Mean Difference (IV, Random, 95% CI) | ‐0.14 [‐0.28, ‐0.00] |
| 23.4 activity ‐ physical functioning (inverted SLOF, high=worse) | 1 | 15 | Mean Difference (IV, Random, 95% CI) | ‐0.3 [‐1.12, 0.52] |
| 23.5 personal care ‐ personal care skills (inverted SLOF, high=worse) | 1 | 15 | Mean Difference (IV, Random, 95% CI) | ‐0.20 [‐1.43, 1.03] |
| 23.6 personal care ‐ self‐care (SSPI, high=worse) | 1 | 114 | Mean Difference (IV, Random, 95% CI) | ‐0.03 [‐0.22, 0.16] |
| 23.7 personal care ‐ social acceptability (inverted SLOF, high=worse) | 1 | 15 | Mean Difference (IV, Random, 95% CI) | 0.1 [‐0.72, 0.92] |
| 23.8 relationships ‐ family role (SSPI, high=worse) | 1 | 114 | Mean Difference (IV, Random, 95% CI) | ‐0.09 [‐0.23, 0.05] |
| 23.9 relationships ‐ interest and concern in the external environment (SSPI, high=worse) | 1 | 114 | Mean Difference (IV, Random, 95% CI) | ‐0.19 [‐0.37, ‐0.01] |
| 23.10 relationships ‐ interpersonal relationships (inverted SLOF, high=worse) | 1 | 15 | Mean Difference (IV, Random, 95% CI) | ‐1.20 [‐5.41, 3.01] |
| 23.11 relationships ‐ relationships and caring for others (SSPI, high=worse) | 1 | 114 | Mean Difference (IV, Random, 95% CI) | ‐0.09 [‐0.24, 0.06] |
| 23.12 relationships ‐ sexual role (SSPI, high=worse) | 1 | 114 | Mean Difference (IV, Random, 95% CI) | ‐0.03 [‐0.21, 0.15] |
| 23.13 relationships ‐ social withdrawal (SSPI, high=worse) | 1 | 114 | Mean Difference (IV, Random, 95% CI) | ‐0.32 [‐0.49, ‐0.15] |
| 23.14 work ‐ professional skills (SSPI, high=worse) | 1 | 114 | Mean Difference (IV, Random, 95% CI) | ‐0.19 [‐0.34, ‐0.04] |
| 23.15 work ‐ responsibility and planning (SSPI, high=worse) | 1 | 114 | Mean Difference (IV, Random, 95% CI) | ‐0.03 [‐0.21, 0.15] |
| 23.16 work ‐ work skills (inverted SLOF, high=worse) | 1 | 15 | Mean Difference (IV, Random, 95% CI) | ‐3.0 [‐5.48, ‐0.52] |