Modalidades de imagenología para la caracterización de las lesiones pancreáticas focales
Información
- DOI:
- https://doi.org/10.1002/14651858.CD010213.pub2Copiar DOI

- Base de datos:
-
- Cochrane Database of Systematic Reviews
- Versión publicada:
-
- 17 abril 2017see what's new
- Tipo:
-
- Diagnostic
- Etapa:
-
- Review
- Grupo Editorial Cochrane:
-
Grupo Cochrane de Salud digestiva
- Copyright:
-
- Copyright © 2017 The Cochrane Collaboration. Published by John Wiley & Sons, Ltd.
Cifras del artículo
Altmetric:
Citado por:
Autores
Contributions of authors
L Best, K Gurusamy, and V Rawji wrote sections of the review. SP Pereira and BR Davidson critically commented on the review.
Sources of support
Internal sources
-
None, Other.
External sources
-
National Institute for Health Research (NIHR), UK.
This project was supported by the National Institute for Health Research, via Cochrane Infrastructure, Cochrane Programme Grant, or Cochrane Incentive funding to the Upper Gastrointestinal and Pancreatic Diseases Group and Cochrane Hepato‐Biliary Group. The views and opinions expressed therein are those of the authors and do not necessarily reflect those of the Systematic Reviews Programme, NIHR, National Health Service (NHS), or the Department of Health.
Declarations of interest
This project was supported by the National Institute for Health Research (NIHR), via Cochrane Infrastructure, Cochrane Programme Grant, or Cochrane Incentive funding to the Upper Gastrointestinal and Pancreatic Diseases Group and Cochrane Hepato‐Biliary Group. The views and opinions expressed therein are those of the authors and do not necessarily reflect those of the Systematic Reviews Programme, NIHR, National Health Service (NHS), or the Department of Health.
LMJB: none known.
VR: none known.
SPP: none known.
BRD: none known.
KSG: none known.
Acknowledgements
Cochrane Upper Gastrointestinal and Pancreatic Diseases and Diagnostic Test Accuracy Reviews groups for their advice in the preparation of this review.
Version history
| Published | Title | Stage | Authors | Version |
| 2017 Apr 17 | Imaging modalities for characterising focal pancreatic lesions | Review | Lawrence MJ Best, Vishal Rawji, Stephen P Pereira, Brian R Davidson, Kurinchi Selvan Gurusamy | |
| 2012 Nov 14 | Imaging modalities for characterising focal pancreatic lesions | Protocol | Kurinchi Selvan Gurusamy, Brian R Davidson | |
Differences between protocol and review
-
We have included sensitivity‐maximising diagnostic filters for searching MEDLINE and Embase databases because the original searches without the filters retrieved more than 50,000 references (Haynes 2004; Wilczynski 2005). We also made some modifications to the search strategy because we needed to balance the possibility of missing some studies against the risk of not being able to complete the review. We decided that it is useful to have evidence from major studies rather than having no information at all.
-
We did not search the Cochrane Register of Diagnostic Test Accuracy Studies, as we believe it is no longer maintained.
-
We have performed the related search function through MEDLINE (OvidSP) rather than MEDLINE (PubMed) and also performed a cited reference search in MEDLINE (via OvidSP).
-
We have reworded the Statistical analysis and data synthesis section to bring this in line with our recent reviews. There were no material differences to the plan of statistical analysis except that we also planned to perform a bivariate analysis, which takes into account the correlation between sensitivity and specificity for tests with explicit thresholds as well. We did this because the summary sensitivity and specificity (and hence the positive likelihood ratio and negative likelihood ratio from which the post‐test probabilities can be calculated) are available from the bivariate model.
-
We have simplified the analysis in the presence of sparse data based on the article by Takwoingi and colleagues (Takwoingi 2015).
-
We have presented the post‐test probabilities only for the median prevalence in the comparison to avoid presenting readers with an overwhelming amount of data.
Keywords
MeSH
Medical Subject Headings (MeSH) Keywords
- Diagnostic Imaging [*methods];
- Elasticity Imaging Techniques;
- Endoscopic Ultrasound‐Guided Fine Needle Aspiration;
- Endosonography;
- Magnetic Resonance Imaging;
- Pancreatic Diseases [diagnostic imaging];
- Pancreatic Neoplasms [*diagnostic imaging];
- Positron‐Emission Tomography;
- Precancerous Conditions [*diagnostic imaging];
- Sensitivity and Specificity;
- Tomography, X‐Ray Computed;
Medical Subject Headings Check Words
Humans;

Clinical pathway.
Abbreviations:
Ca 19‐9: carbohydrate antigen 19‐9
CT: computed tomography
EUS: endoscopic ultrasound
MRI: magnetic resonance imaging
PET: positron emission tomography

Study flow diagram.

Risk of bias and applicability concerns graph: review authors' judgements about each domain presented as percentages across included studies.

Risk of bias and applicability concerns summary: review authors' judgements about each domain for each included study.

Forest plot ‐ Cancerous versus benign or precancerous.

Forest plot ‐ Cancerous versus benign.

Forest plot ‐ Precancerous or cancerous versus benign.

Forest plot ‐ Cancerous (invasive carcinoma) versus precancerous (dysplasia).

Forest plot ‐ Cancerous (high‐grade dysplasia or invasive carcinoma) versus precancerous (low‐ or intermediate‐grade dysplasia).

Forest plot ‐ Cancerous (invasive carcinoma) versus precancerous (low‐grade dysplasia).

Forest plot ‐ Precancerous or cancerous (intermediate‐ or high‐grade dysplasia or invasive carcinoma) versus precancerous (low‐grade dysplasia).

Forest plot of 33 Cancerous (high‐grade dysplasia or invasive carcinoma) versus precancerous (low‐ or intermediate‐grade dysplasia) or benign ‐ EUS.

Forest plot ‐ Cystic lesion subgroup analysis: Cancerous versus benign.

Forest plot ‐ Cystic lesion subgroup analysis: Precancerous or cancerous versus benign ‐ EUS‐FNA.

Cancerous versus benign or precancerous ‐ EUS‐FNA (cytology).

Cancerous versus benign or precancerous ‐ EUS‐FNA (CEA > 500 ng/mL).

Cancerous versus benign or precancerous ‐ PET.

Cancerous versus benign ‐ EUS.

Cancerous versus benign ‐ EUS‐FNA.

Cancerous versus benign ‐ PET.

Cancerous versus benign ‐ PET (SUVmax > 3.5).

Cancerous versus benign ‐ CT.

Cancerous versus benign ‐ MRI.

Precancerous or cancerous versus benign ‐ EUS.

Precancerous or cancerous versus benign ‐ EUS‐FNA.

Precancerous or cancerous versus benign ‐ EUS‐FNA (CEA > 50 ng/mL).

Precancerous or cancerous versus benign ‐ PET (SUVmax > 2.4).

Precancerous or cancerous versus benign ‐ CT.

Precancerous or cancerous versus benign ‐ MRI.

Cancerous (invasive carcinoma) versus precancerous (dysplasia) ‐ EUS.

Cancerous (invasive carcinoma) versus precancerous (dysplasia) ‐ EUS‐FNA.

Cancerous (invasive carcinoma) versus precancerous (dysplasia) ‐ EUS‐FNA (CEA > 200 ng/mL).

Cancerous (invasive carcinoma) versus precancerous (dysplasia) ‐ CT.

Cancerous (invasive carcinoma) versus precancerous (dysplasia) ‐ MRI.

Cancerous (high‐grade dysplasia or invasive carcinoma) versus precancerous (low‐ or intermediate‐grade dysplasia) ‐ EUS.

Cancerous (high‐grade dysplasia or invasive carcinoma) versus precancerous (low‐ or intermediate‐grade dysplasia) ‐ EUS‐FNA.

Cancerous (high‐grade dysplasia or invasive carcinoma) versus precancerous (low‐ or intermediate‐grade dysplasia) ‐ EUS‐FNA (CEA > 200 ng/mL).

Cancerous (high‐grade dysplasia or invasive carcinoma) versus precancerous (low‐ or intermediate‐grade dysplasia) ‐ EUS‐FNA (CA 19‐9 > 1000 U/mL).

Cancerous (high‐grade dysplasia or invasive carcinoma) versus precancerous (low‐ or intermediate‐grade dysplasia) ‐ EUS‐FNA (CEA > 692.8 ng/mL).

Cancerous (high‐grade dysplasia or invasive carcinoma) versus precancerous (low‐ or intermediate‐grade dysplasia) ‐ PET (SUVmax 2 to 2.5).

Cancerous (high‐grade dysplasia or invasive carcinoma) versus precancerous (low‐ or intermediate‐grade dysplasia) ‐ CT.

Cancerous (high‐grade dysplasia or invasive carcinoma) versus precancerous (low‐ or intermediate‐grade dysplasia) ‐ MRI.

Cancerous (invasive carcinoma) versus precancerous (low‐grade dysplasia) ‐ EUS.

Cancerous (invasive carcinoma) versus precancerous (low‐grade dysplasia) ‐ CT.

Precancerous or cancerous (intermediate‐ or high‐grade dysplasia or invasive carcinoma) versus precancerous (low‐grade dysplasia) ‐ CT.
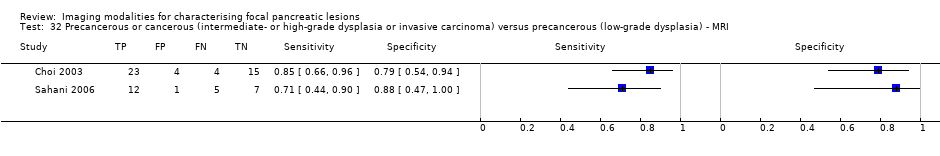
Precancerous or cancerous (intermediate‐ or high‐grade dysplasia or invasive carcinoma) versus precancerous (low‐grade dysplasia) ‐ MRI.

Cancerous (high‐grade dysplasia or invasive carcinoma) versus precancerous (low‐ or intermediate‐grade dysplasia) or benign ‐ EUS.

Cystic lesion subgroup analysis ‐ Cancerous versus benign ‐ EUS‐FNA.

Cystic lesion subgroup analysis ‐ Cancerous versus benign ‐ PET.

Cystic lesion subgroup analysis ‐ Precancerous or cancerous versus benign ‐ EUS‐FNA.
| Name of test | Number of studies (number of participants) | Sensitivity (95% CI) | Specificity (95% CI) | Post‐test probability of positive test* (95% CI) | Post‐test probability of negative test* (95% CI) | Number of false positives per 100 positive index test results (95% CI) | Number of false negatives per 100 negative index test results (95% CI) | Risk of bias | Applicability concerns | Uncertainty (due to inconsistency or inability to assess inconsistency, and random errors because of overall small sample size) |
| Cancerous versus benign or precancerous (median pre‐test probability: 63%) | ||||||||||
| EUS‐FNA (cytology) | 1 (45) | 0.79 (0.60 to 0.91) | 1.00 (0.85 to 1.00) | 98% (79% to 100%) | 26% (14% to 43%) | 2 (0 to 21) | 26 (14 to 43) | Unclear | High | High |
| EUS‐FNA (CEA > 500 ng/mL) | 1 (24) | 0.93 (0.70 to 0.99) | 0.33 (0.12 to 0.65) | 70% (59% to 79%) | 25% (4% to 73%) | 30 (21 to 41) | 25 (4 to 73) | High | High | High |
| PET (criteria unspecified) | 1 (76) | 0.85 (0.73 to 0.92) | 0.91 (0.72 to 0.97) | 94% (81% to 98%) | 21% (12% to 34%) | 6 (2 to 19) | 21 (12 to 34) | Unclear | High | High |
| Cancerous versus benign (median pre‐test probability: 70%) | ||||||||||
| EUS | 2 (133) | 0.95 (0.84 to 0.99) | 0.53 (0.31 to 0.74) | 82% (74% to 88%) | 18% (6% to 45%) | 18 (12 to 26) | 18 (6 to 45) | Unclear or high | High | High |
| EUS‐FNA (cytology) | 3 (147) | 0.79 (0.07 to 1.00) | 1.00 (0.91 to 1.00) | 99% (90% to 100%) | 32% (2% to 92%) | 0 (0 to 9) | 32 (2 to 92) | High | High | High |
| PET (criteria unspecified) | 3 (99) | 0.92 (0.80 to 0.97) | 0.65 (0.39 to 0.85) | 86% (75% to 92%) | 22% (9% to 44%) | 14 (8 to 25) | 22 (9 to 44) | High | High | High |
| PET (SUVmax > 3.5) | 1 (80) | 0.96 (0.87 to 0.99) | 0.62 (0.43 to 0.78) | 85% (78% to 90%) | 12% (3% to 36%) | 15 (10 to 22) | 12 (3 to 36) | High | High | High |
| CT | 2 (123) | 0.98 (0.00 to 1.00) | 0.76 (0.02 to 1.00) | 90% (17% to 100%) | 6% (0% to 100%) | 10 (0 to 83) | 6 (0 to 100) | Unclear or high | High | High |
| MRI | 1 (29) | 0.80 (0.58 to 0.92) | 0.89 (0.57 to 0.98) | 94% (72% to 99%) | 34% (17% to 56%) | 6 (1 to 28) | 34 (17 to 56) | High | High | High |
| Precancerous or cancerous versus benign (median pre‐test probability: 71%) | ||||||||||
| EUS | 1 (34) | 0.92 (0.74 to 0.98) | 0.60 (0.31 to 0.83) | 85% (72% to 92%) | 25% (7% to 58%) | 15 (8 to 28) | 25 (7 to 58) | High | High | High |
| EUS‐FNA (cytology) | 2 (52) | 0.73 (0.01 to 1.00) | 0.94 (0.15 to 1.00) | 97% (25% to 100%) | 41% (1% to 98%) | 3 (0 to 75) | 41 (1 to 98) | Unclear or high | High | High |
| EUS‐FNA (CEA > 50 ng/mL) | 1 (11) | 0.29 (0.08 to 0.64) | 0.25 (0.05 to 0.70) | 48% (20% to 77%) | 87% (54% to 98%) | 52 (23 to 80) | 87 (54 to 98) | High | High | High |
| PET (SUVmax 2.4) | 1 (32) | 0.94 (0.74 to 0.99) | 0.93 (0.69 to 0.99) | 97% (83% to 100%) | 13% (2% to 49%) | 3 (0 to 17) | 13 (2 to 49) | High | High | High |
| CT | 1 (48) | 0.62 (0.45 to 0.76) | 0.64 (0.39 to 0.84) | 81% (66% to 90%) | 59% (44% to 72%) | 19 (10 to 34) | 59 (44 to 72) | Unclear | High | High |
| MRI | 1 (27) | 0.93 (0.69 to 0.99) | 0.85 (0.58 to 0.96) | 94% (80% to 98%) | 17% (3% to 58%) | 6 (2 to 20) | 17 (3 to 58) | High | High | High |
| Cancerous (invasive carcinoma) versus precancerous (dysplasia) (median pre‐test probability: 27%) | ||||||||||
| EUS | 5 (156) | 0.78 (0.45 to 0.94) | 0.91 (0.61 to 0.98) | 75% (37% to 94%) | 8% (3% to 22%) | 25 (6 to 63) | 8 (3 to 22) | Unclear or high | High | High |
| EUS‐FNA (cytology) | 3 (158) | 0.66 (0.03 to 0.99) | 0.92 (0.73 to 0.98) | 75% (29% to 95%) | 12% (1% to 69%) | 25 (5 to 71) | 12 (1 to 69) | Unclear or high | High | High |
| EUS‐FNA (CEA > 200 ng/mL) | 1 (41) | 1.00 (0.57 to 1.00) | 0.64 (0.48 to 0.78) | 51% (40% to 61%) | Not estimable | 49 (39 to 60) | Not estimable | High | High | High |
| CT | 6 (326) | 0.72 (0.50 to 0.87) | 0.92 (0.81 to 0.97) | 78% (57% to 91%) | 10% (5% to 18%) | 22 (9 to 43) | 10 (5 to 18) | Unclear or high | High | High |
| MRI | 1 (32) | 0.75 (0.30 to 0.95) | 0.93 (0.77 to 0.98) | 80% (48% to 94%) | 9% (2% to 35%) | 20 (6 to 52) | 9 (2 to 35) | High | High | High |
| Cancerous (high‐grade dysplasia or invasive carcinoma) versus precancerous (low‐ or intermediate‐grade dysplasia) (median pre‐test probability: 45%) | ||||||||||
| EUS | 4 (196) | 0.86 (0.74 to 0.92) | 0.91 (0.83 to 0.96) | 89% (80% to 94%) | 11% (7% to 19%) | 11 (6 to 20) | 11 (7 to 19) | High | High | High |
| EUS‐FNA (cytology) | 3 (310) | 0.47 (0.24 to 0.70) | 0.91 (0.32 to 1.00) | 81% (19% to 99%) | 32% (22% to 45%) | 19 (1 to 81) | 32 (22 to 45) | Unclear or high | High | High |
| EUS‐FNA (CEA > 200 ng/mL) | 3 (160) | 0.58 (0.28 to 0.83) | 0.51 (0.19 to 0.81) | 49% (28% to 70%) | 40% (19% to 65%) | 51 (30 to 72) | 40 (19 to 65) | High | High | High |
| EUS‐FNA (CA 19‐9 > 1000 U/mL) | 1 (41) | 0.90 (0.60 to 0.98) | 0.42 (0.26 to 0.59) | 56% (47% to 65%) | 16% (3% to 57%) | 44 (35 to 53) | 16 (3 to 57) | High | High | High |
| EUS‐FNA (CEA > 692.8 ng/mL) | 1 (20) | 0.80 (0.49 to 0.94) | 0.90 (0.60 to 0.98) | 87% (50% to 98%) | 15% (5% to 39%) | 13 (2 to 50) | 15 (5 to 39) | Unclear | High | High |
| PET (SUVmax > 2 to 2.5) | 4 (124) | 0.90 (0.79 to 0.96) | 0.94 (0.81 to 0.99) | 93% (78% to 98%) | 8% (4% to 16%) | 7 (2 to 22) | 8 (4 to 16) | High | High | High |
| CT | 3 (139) | 0.87 (0.00 to 1.00) | 0.96 (0.00 to 1.00) | 95% (0% to 100%) | 10% (0% to 100%) | 5 (0 to 100) | 10 (0 to 100) | Unclear or high | High | High |
| MRI | 3 (189) | 0.69 (0.44 to 0.86) | 0.93 (0.43 to 1.00) | 89% (35% to 99%) | 21% (12% to 36%) | 11 (1 to 65) | 21 (12 to 36) | High | High | High |
| Cancerous (invasive carcinoma) versus precancerous (low‐grade dysplasia) (median pre‐test probability: 21%) | ||||||||||
| EUS | 1 (51) | 0.77 (0.50 to 0.92) | 0.89 (0.76 to 0.96) | 67% (43% to 84%) | 7% (3% to 16%) | 33 (16 to 57) | 7 (3 to 16) | Unclear | High | High |
| CT | 1 (46) | 0.50 (0.22 to 0.78) | 0.95 (0.83 to 0.99) | 72% (36% to 92%) | 13% (7% to 22%) | 28 (8 to 64) | 13 (7 to 22) | High | High | High |
| Precancerous or cancerous (intermediate‐ or high‐grade dysplasia or invasive carcinoma) versus precancerous (low‐grade dysplasia) (median pre‐test probability: 59%) | ||||||||||
| CT | 3 (106) | 0.83 (0.68 to 0.92) | 0.83 (0.64 to 0.93) | 89% (56% to 98%) | 33% (18% to 52%) | 11 (2 to 44) | 33 (18 to 52) | High | High | High |
| MRI | 2 (71) | 0.80 (0.58 to 0.92) | 0.81 (0.53 to 0.95) | 86% (67% to 95%) | 27% (13% to 47%) | 14 (5 to 33) | 27 (13 to 47) | High | High | High |
| Precancerous or cancerous (intermediate‐ or high‐grade dysplasia or invasive carcinoma) versus precancerous (low‐grade dysplasia) or benign (median pre‐test probability: 43%) | ||||||||||
| EUS | 1 (70) | 0.97 (0.83 to 0.99) | 0.40 (0.26 to 0.55) | 55% (48% to 61%) | 6% (1% to 31%) | 45 (39 to 52) | 6 (1 to 31) | High | High | High |
| *Post‐test probability was calculated at the median pre‐test probability. Abbreviations: CA 19‐9: carbohydrate antigen 19‐9 | ||||||||||
| Domain | Signalling question | Signalling question | Signalling question | Risk of bias | Concerns for |
| 1: Patient sampling | Was a consecutive or random sample of patients enrolled? | Was a case‐control design avoided? | Did the study avoid inappropriate exclusions? | Could the selection of participants have introduced bias? | Are there concerns that the included participants and setting do not match the review question? |
| Yes: all consecutive patients or random sample of patients with focal pancreatic lesions were enrolled No: selected patients were enrolled Unclear: this was not clear from the report | Yes: case‐control design was avoided No: case‐control design was not avoided Unclear: this was not clear from the report | Yes: the study avoided inappropriate exclusions (i.e. difficult‐to‐diagnose patients) No: the study excluded patients inappropriately Unclear: this was not clear from the report | Low risk: 'yes' for all signalling questions High risk: 'no' or 'unclear' for at least 1 signalling question | Low concern: the selected participants represent the patients in whom the tests will be used in clinical practice (please see diagnostic pathway (Figure 1)) High concern: there is high concern that participant selection was performed in such a way that the included participants did not represent the patients in whom the tests will be used in clinical practice | |
| 2: Index test(s) | Were the index test results interpreted without knowledge of the results of the reference standard? | If a threshold was used, was it prespecified? | — | Could the conduct or interpretation of the index test have introduced bias? | Are there concerns that the index test, its conduct, or its interpretation differ from the review question? |
| Yes: index test results were interpreted without knowledge of the results of the reference standard No: index test results were interpreted with knowledge of the results of the reference standard Unclear: this was not clear from the report | Yes: if the criteria for a positive test were prespecified No: if the criteria for a positive test were not prespecified Unclear: this was not clear from the report | — | Low risk: 'yes' for all signalling questions High risk: 'no' or 'unclear' for at least 1 of the 2 signalling questions | High concern: there is high concern that the conduct or interpretation of the index test differs from the way it is likely to be used in clinical practice Low concern: there is low concern that the conduct or interpretation of the index test differs from the way it is likely to be used in clinical practice | |
| 3: Target condition and reference standard(s) | Is the reference standard likely to classify the target condition correctly? | Were the reference standard results interpreted without knowledge of the results of the index tests? | — | Could the reference standard, its conduct, or its interpretation have introduced bias? | Are there concerns that the target condition as defined by the reference standard does not match the review question? |
| Yes: histopathological examination of the entire lesion by surgical resection No: histopathological examination (irrespective of how the tissues were obtained for histopathological examination) in patients with positive test (for cancerous or precancerous lesions) and clinical follow‐up by a doctor (with or without sequential follow‐up with imaging) of all patients with negative test for a period of at least 6 months and for a maximum period of 24 months Unclear: this was not clear from the report. Such studies will be excluded Yes: reference standard results were interpreted without knowledge of the results of the index test No: reference standard results were interpreted with knowledge of the results of the index test Unclear: this was not clear from the report | — | Low risk: 'yes' for all signalling questions High risk: 'no' or 'unclear' for at least 1 of the 2 signalling questions | Low concern: histopathological examination of the entire lesion by surgical resection High concern: histopathological examination (irrespective of how the tissues were obtained for histopathological examination) in patients with positive test (for cancerous or precancerous lesions) and clinical follow‐up by a doctor (with or without sequential follow‐up with imaging) of all patients with negative test for a period of at least 6 months and for a maximum period of 24 months | — | |
| 4: Flow and timing | Was there an appropriate interval between index test and reference standard? | Did all patients receive the same reference standard? | Were all patients included in the analysis? | Could the patient flow have introduced bias? | — |
| Yes: histopathological examination of the entire lesion (gold standard) ‐ performed within 2 months (chosen arbitrarily). Histopathological examination (irrespective of how the tissues were obtained for histopathological examination) in patients with positive test (for cancerous or precancerous lesions) performed within 2 months and clinical follow‐up (including sequential follow‐up with imaging) of all patients with negative test for a period of at least 6 months No: the histopathological examination was performed beyond 2 months of the index tests. The clinical follow‐up (including sequential follow‐up imaging) was performed less than 6 months after the index test, because some tumours may be slow‐growing Unclear: this was not clear from the report | Yes: histopathological examination of the entire lesion by surgical resection No: histopathological examination (irrespective of how the tissues were obtained for histopathological examination) in patients with positive test (for cancerous or precancerous lesions) and clinical follow‐up by a doctor (with or without sequential follow‐up with imaging) of all patients with negative test for a period of at least 6 months and for a maximum period of 24 months Unclear: this was not clear from the report. Such studies will be excluded | Yes: all patients meeting the selection criteria (selected participants) were included in the analysis, or data on all of the selected participants were available so that a 2 x 2 table including all selected participants could be constructed No: not all patients meeting the selection criteria were included in the analysis, or the 2 x 2 table could not be constructed using data on all selected participants Unclear: this was not clear from the report | Low risk: 'yes' for all signalling questions High risk: 'no' or 'unclear' for at least 1 signalling question | — |
| Comparison | Name of test | Sensitivity | Specificity |
| Cancerous versus benign or precancerous | EUS‐FNA | 0.79 (95% CI 0.60 to 0.91) | 1.00 (95% CI 0.85 to 1.00) |
| Cancerous versus benign or precancerous | EUS‐FNA | 0.93 (95% CI 0.70 to 0.99) | 0.33 (95% CI 0.12 to 0.65) |
| Cancerous versus benign or precancerous | PET | 0.85 (95% CI 0.73 to 0.92) | 0.91 (95% CI 0.72 to 0.97) |
| Cancerous versus benign | EUS | 0.95 (95% CI 0.84 to 0.99) | 0.53 (95% CI 0.31 to 0.74) |
| Cancerous versus benign | EUS‐FNA | 0.79 (95% CI 0.07 to 1.00) | 1.00 (95% CI 0.91 to 1.00) |
| Cancerous versus benign | PET (criteria unspecified) | 0.92 (95% CI 0.80 to 0.97) | 0.65 (95% CI 0.39 to 0.85) |
| Cancerous versus benign | PET (SUVmax > 3.5) | 0.96 (95% CI 0.87 to 0.99) | 0.62 (95% CI 0.43 to 0.78) |
| Cancerous versus benign | CT | 0.98 (95% CI 0.00 to 1.00) | 0.76 (95% CI 0.02 to 1.00) |
| Cancerous versus benign | MRI | 0.80 (95% CI 0.58 to 0.92) | 0.89 (95% CI 0.57 to 0.98) |
| Precancerous or cancerous versus benign | EUS | 0.92 (95% CI 0.74 to 0.98) | 0.60 (95% CI 0.31 to 0.83) |
| Precancerous or cancerous versus benign | EUS‐FNA (cytology) | 0.73 (95% CI 0.01 to 1.00) | 0.94 (95% CI 0.15 to 1.00) |
| Precancerous or cancerous versus benign | EUS‐FNA | 0.29 (95% CI 0.08 to 0.64) | 0.25 (95% CI 0.05 to 0.70) |
| Precancerous or cancerous versus benign | PET | 0.94 (95% CI 0.74 to 0.99) | 0.93 (95% CI 0.69 to 0.99) |
| Precancerous or cancerous versus benign | CT | 0.62 (95% CI 0.45 to 0.76) | 0.64 (95% CI 0.39 to 0.84) |
| Precancerous or cancerous versus benign | MRI | 0.93 (95% CI 0.69 to 0.99) | 0.85 (95% CI 0.58 to 0.96) |
| Cancerous (invasive carcinoma) versus precancerous (dysplasia) | EUS | 0.78 (95% CI 0.45 to 0.94) | 0.91 (95% CI 0.61 to 0.98) |
| Cancerous (invasive carcinoma) versus precancerous (dysplasia) | EUS‐FNA | 0.66 (95% CI 0.03 to 0.99) | 0.92 (95% CI 0.73 to 0.98) |
| Cancerous (invasive carcinoma) versus precancerous (dysplasia) | EUS‐FNA | 1.00 (95% CI 0.57 to 1.00) | 0.64 (95% CI 0.48 to 0.78) |
| Cancerous (invasive carcinoma) versus precancerous (dysplasia) | CT | 0.72 (95% CI 0.50 to 0.87) | 0.92 (95% CI 0.81 to 0.97) |
| Cancerous (invasive carcinoma) versus precancerous (dysplasia) | MRI | 0.75 (95% CI 0.30 to 0.95) | 0.93 (95% CI 0.77 to 0.98) |
| Cancerous (high‐grade dysplasia or invasive carcinoma) versus precancerous (low‐ or intermediate‐grade dysplasia) | EUS | 0.86 (95% CI 0.74 to 0.92) | 0.91 (95% CI 0.83 to 0.96) |
| Cancerous (high‐grade dysplasia or invasive carcinoma) versus precancerous (low‐ or intermediate‐grade dysplasia) | EUS‐FNA | 0.47 (95% CI 0.24 to 0.70) | 0.91 (95% CI 0.32 to 1.00) |
| Cancerous (high‐grade dysplasia or invasive carcinoma) versus precancerous (low‐ or intermediate‐grade dysplasia) | EUS‐FNA | 0.58 (95% CI 0.28 to 0.83) | 0.51 (95% CI 0.19 to 0.81) |
| Cancerous (high‐grade dysplasia or invasive carcinoma) versus precancerous (low‐ or intermediate‐grade dysplasia) | EUS‐FNA | 0.90 (95% CI 0.60 to 0.98) | 0.42 (95% CI 0.26 to 0.59) |
| Cancerous (high‐grade dysplasia or invasive carcinoma) versus precancerous (low‐ or intermediate‐grade dysplasia) | EUS‐FNA | 0.80 (95% CI 0.49 to 0.94) | 0.90 (95% CI 0.60 to 0.98) |
| Cancerous (high‐grade dysplasia or invasive carcinoma) versus precancerous (low‐ or intermediate‐grade dysplasia) | PET | 0.90 (95% CI 0.79 to 0.96) | 0.94 (95% CI 0.81 to 0.99) |
| Cancerous (high‐grade dysplasia or invasive carcinoma) versus precancerous (low‐ or intermediate‐grade dysplasia) | CT | 0.87 (95% CI 0.00 to 1.00) | 0.96 (95% CI 0.00 to 1.00) |
| Cancerous (high‐grade dysplasia or invasive carcinoma) versus precancerous (low‐ or intermediate‐grade dysplasia) | MRI | 0.69 (95% CI 0.44 to 0.86) | 0.93 (95% CI 0.43 to 1.00) |
| Cancerous (invasive carcinoma) versus precancerous (low‐grade dysplasia) | EUS | 0.77 (95% CI 0.50 to 0.92) | 0.89 (95% CI 0.76 to 0.96) |
| Cancerous (invasive carcinoma) versus precancerous (low‐grade dysplasia) | CT | 0.50 (95% CI 0.22 to 0.78) | 0.95 (95% CI 0.83 to 0.99) |
| Precancerous or cancerous (intermediate‐ or high‐grade dysplasia or invasive carcinoma) versus precancerous (low‐grade dysplasia) | CT | 0.83 (95% CI 0.68 to 0.92) | 0.83 (95% CI 0.64 to 0.93) |
| Precancerous or cancerous (intermediate‐ or high‐grade dysplasia or invasive carcinoma) versus precancerous (low‐grade dysplasia) | MRI | 0.80 (95% CI 0.58 to 0.92) | 0.81 (95% CI 0.53 to 0.95) |
| Precancerous or cancerous (intermediate‐ or high‐grade dysplasia or invasive carcinoma) versus precancerous (low‐grade dysplasia) or benign | EUS | 0.97 (95% CI 0.83 to 0.99) | 0.40 (95% CI 0.26 to 0.55) |
| Cystic lesion subgroup analysis | Cancerous versus benign ‐ EUS‐FNA (cytology) | 0.50 (95% CI 0.19 to 0.81) | 1.00 (95% CI 0.84 to 1.00) |
| Cystic lesion subgroup analysis | Cancerous versus benign ‐ PET | 0.96 (95% CI 0.87 to 0.99) | 0.62 (95% CI 0.43 to 0.78) |
| Cystic lesion subgroup analysis | Precancerous or cancerous versus benign ‐ EUS‐FNA | 0.43 (95% CI 0.19 to 0.71) | 1.00 (95% CI 0.74 to 1.00) |
| CA 19‐9: carbohydrate antigen 19‐9 | |||
| Test | No. of studies | No. of participants |
| 1 Cancerous versus benign or precancerous ‐ EUS‐FNA (cytology) Show forest plot | 1 | 45 |
| 2 Cancerous versus benign or precancerous ‐ EUS‐FNA (CEA > 500 ng/mL) Show forest plot | 1 | 24 |
| 3 Cancerous versus benign or precancerous ‐ PET Show forest plot | 1 | 76 |
| 4 Cancerous versus benign ‐ EUS Show forest plot | 2 | 133 |
| 5 Cancerous versus benign ‐ EUS‐FNA Show forest plot | 3 | 147 |
| 6 Cancerous versus benign ‐ PET Show forest plot | 3 | 99 |
| 7 Cancerous versus benign ‐ PET (SUVmax > 3.5) Show forest plot | 1 | 80 |
| 8 Cancerous versus benign ‐ CT Show forest plot | 2 | 123 |
| 9 Cancerous versus benign ‐ MRI Show forest plot | 1 | 29 |
| 10 Precancerous or cancerous versus benign ‐ EUS Show forest plot | 1 | 34 |
| 11 Precancerous or cancerous versus benign ‐ EUS‐FNA Show forest plot | 3 | 52 |
| 12 Precancerous or cancerous versus benign ‐ EUS‐FNA (CEA > 50 ng/mL) Show forest plot | 1 | 11 |
| 13 Precancerous or cancerous versus benign ‐ PET (SUVmax > 2.4) Show forest plot | 1 | 32 |
| 14 Precancerous or cancerous versus benign ‐ CT Show forest plot | 1 | 48 |
| 15 Precancerous or cancerous versus benign ‐ MRI Show forest plot | 1 | 27 |
| 16 Cancerous (invasive carcinoma) versus precancerous (dysplasia) ‐ EUS Show forest plot | 5 | 156 |
| 17 Cancerous (invasive carcinoma) versus precancerous (dysplasia) ‐ EUS‐FNA Show forest plot | 3 | 158 |
| 18 Cancerous (invasive carcinoma) versus precancerous (dysplasia) ‐ EUS‐FNA (CEA > 200 ng/mL) Show forest plot | 1 | 41 |
| 19 Cancerous (invasive carcinoma) versus precancerous (dysplasia) ‐ CT Show forest plot | 6 | 326 |
| 20 Cancerous (invasive carcinoma) versus precancerous (dysplasia) ‐ MRI Show forest plot | 1 | 32 |
| 21 Cancerous (high‐grade dysplasia or invasive carcinoma) versus precancerous (low‐ or intermediate‐grade dysplasia) ‐ EUS Show forest plot | 4 | 196 |
| 22 Cancerous (high‐grade dysplasia or invasive carcinoma) versus precancerous (low‐ or intermediate‐grade dysplasia) ‐ EUS‐FNA Show forest plot | 3 | 310 |
| 23 Cancerous (high‐grade dysplasia or invasive carcinoma) versus precancerous (low‐ or intermediate‐grade dysplasia) ‐ EUS‐FNA (CEA > 200 ng/mL) Show forest plot | 3 | 160 |
| 24 Cancerous (high‐grade dysplasia or invasive carcinoma) versus precancerous (low‐ or intermediate‐grade dysplasia) ‐ EUS‐FNA (CA 19‐9 > 1000 U/mL) Show forest plot | 1 | 41 |
| 25 Cancerous (high‐grade dysplasia or invasive carcinoma) versus precancerous (low‐ or intermediate‐grade dysplasia) ‐ EUS‐FNA (CEA > 692.8 ng/mL) Show forest plot | 1 | 20 |
| 26 Cancerous (high‐grade dysplasia or invasive carcinoma) versus precancerous (low‐ or intermediate‐grade dysplasia) ‐ PET (SUVmax 2 to 2.5) Show forest plot | 4 | 124 |
| 27 Cancerous (high‐grade dysplasia or invasive carcinoma) versus precancerous (low‐ or intermediate‐grade dysplasia) ‐ CT Show forest plot | 3 | 139 |
| 28 Cancerous (high‐grade dysplasia or invasive carcinoma) versus precancerous (low‐ or intermediate‐grade dysplasia) ‐ MRI Show forest plot | 3 | 189 |
| 29 Cancerous (invasive carcinoma) versus precancerous (low‐grade dysplasia) ‐ EUS Show forest plot | 1 | 51 |
| 30 Cancerous (invasive carcinoma) versus precancerous (low‐grade dysplasia) ‐ CT Show forest plot | 1 | 46 |
| 31 Precancerous or cancerous (intermediate‐ or high‐grade dysplasia or invasive carcinoma) versus precancerous (low‐grade dysplasia) ‐ CT Show forest plot | 3 | 106 |
| 32 Precancerous or cancerous (intermediate‐ or high‐grade dysplasia or invasive carcinoma) versus precancerous (low‐grade dysplasia) ‐ MRI Show forest plot | 2 | 71 |
| 33 Cancerous (high‐grade dysplasia or invasive carcinoma) versus precancerous (low‐ or intermediate‐grade dysplasia) or benign ‐ EUS Show forest plot | 1 | 70 |
| 34 Cystic lesion subgroup analysis ‐ Cancerous versus benign ‐ EUS‐FNA Show forest plot | 1 | 26 |
| 35 Cystic lesion subgroup analysis ‐ Cancerous versus benign ‐ PET Show forest plot | 1 | 80 |
| 36 Cystic lesion subgroup analysis ‐ Precancerous or cancerous versus benign ‐ EUS‐FNA Show forest plot | 2 | 34 |