Terapias psicológicas para el trastorno de estrés postraumático y el trastorno por consumo de sustancias concomitante
Información
- DOI:
- https://doi.org/10.1002/14651858.CD010204.pub2Copiar DOI

- Base de datos:
-
- Cochrane Database of Systematic Reviews
- Versión publicada:
-
- 04 abril 2016see what's new
- Tipo:
-
- Intervention
- Etapa:
-
- Review
- Grupo Editorial Cochrane:
-
Grupo Cochrane de Trastornos mentales comunes
- Copyright:
-
- Copyright © 2016 The Cochrane Collaboration. Published by John Wiley & Sons, Ltd.
Cifras del artículo
Altmetric:
Citado por:
Autores
Contributions of authors
NPR drafted the review.
PAR undertook screening of papers, evaluation of risk of bias, data extraction, and commented on the protocol and write‐up of the review.
NJ undertook evaluation of risk of bias, data extraction, and commented on the write‐up of the review.
JIB undertook supervision of the review, arbitrated over issues of contention, and commented on the protocol and write‐up of the review.
Declarations of interest
NPR: None declared.
PAR: None declared.
NJ: None declared.
JIB: None declared.
Acknowledgements
With thanks to the editorial team of the Cochrane Depression, Anxiety and Neurosis Group. Thanks also to Delyth Lloyd, David Forbes, Rosemarie Wolfe, Kim Mueser, Scott Coffey, Catherine Mills, Denise Hien, Sonya Norman, and Ursula Myers for additional data. We would like to thank Lisa Najavits for feedback on an earlier draft of the review.
CRG funding acknowledgement: The National Institute for Health Research (NIHR) is the largest single funder of the Cochrane Depression, Anxiety and Neurosis Group.
Disclaimer: The views and opinions expressed therein are those of the authors and do not necessarily reflect those of the NIHR, NHS, or the Department of Health.
Version history
| Published | Title | Stage | Authors | Version |
| 2016 Apr 04 | Psychological therapies for post‐traumatic stress disorder and comorbid substance use disorder | Review | Neil P Roberts, Pamela A Roberts, Neil Jones, Jonathan I Bisson | |
| 2012 Nov 14 | Psychological interventions for post‐traumatic stress disorder and comorbid substance use disorder | Protocol | Neil P Roberts, Pamela A Roberts, Jonathan I Bisson | |
Differences between protocol and review
We added a section explaining how we would approach meta‐analysis under the heading 'Main planned comparisons' in Data extraction and management. We decided to include studies where less than 80% of participants met our diagnostic inclusion criteria if we were able to obtain study data on the subset that met diagnosis.
In the protocol we framed the section 'Experimental interventions' as a 'catch‐all' list of the types of intervention that we thought might potentially have been investigated in this patient group. It was not our intention to necessarily group our comparisons on this basis. We have therefore revised this section in order to provide a more meaningful structure to the review. Specific treatment models such as COPE and Seeking Safety were subsumed into other types of approaches, as they provided specific examples of these approaches. The distinction between trauma‐focused and non‐trauma‐focused approaches was consistent with that of the review undertaken by van Dam 2012. We also recognised that we needed to articulate that we would undertake separate analysis for group‐ and individual‐based interventions. Group‐based interventions are generally considered to show weaker effects than individual‐based interventions (Najavits 2014 [personal communication]). This finding has been specifically in relation to PTSD (Bisson 2013). We have removed categories for other psychological approaches, stepped care and interventions aimed at enhancing positive well‐being through physiotherapy, occupational therapy, or guided self help. We can say with hindsight that it is highly unlikely we would have found evaluations of these types of interventions in this specific population.
We included a fourth review author, NJ, in order to provide balance to the review author group's expertise in the fields of treatment of PTSD and SUD. NJ is an expert in the treatment of SUDs.
As a post hoc addition, we defined the time points of interest in the Types of outcome measures section. As a further post hoc addition, we described our approach to summarising comparison findings under the heading 'Summary of findings'.
Keywords
MeSH
Medical Subject Headings (MeSH) Keywords
Medical Subject Headings Check Words
Adult; Humans;
PICO
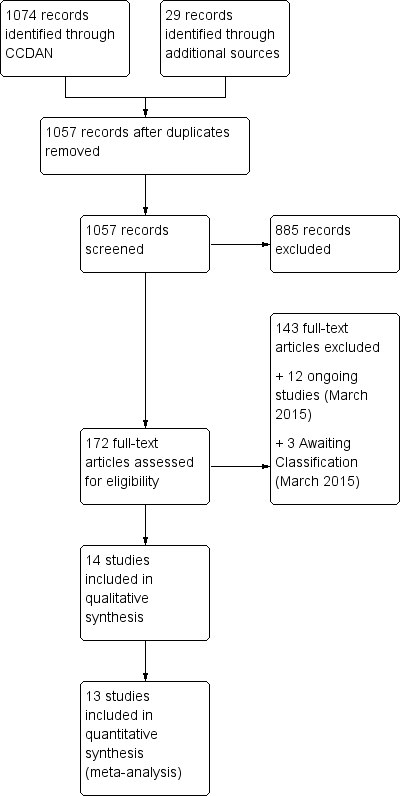
Study flow diagram.
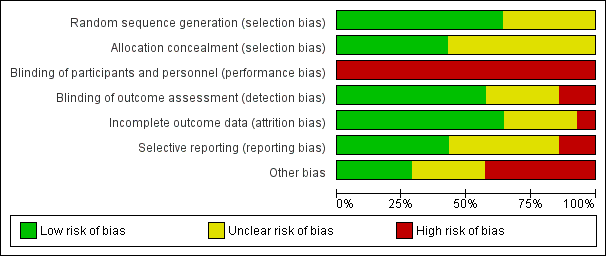
Risk of bias graph: review authors' judgements about each risk of bias item presented as percentages across all included studies.
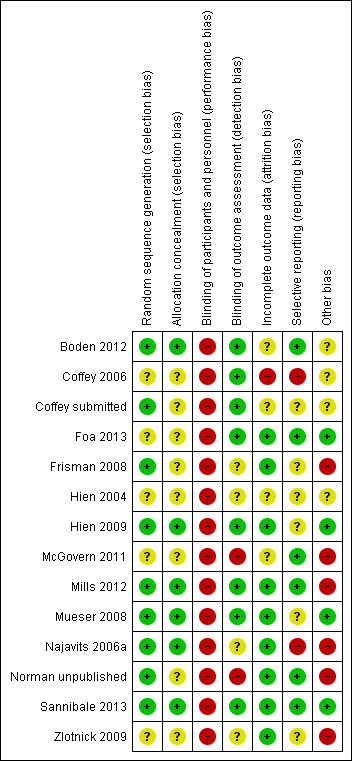
Risk of bias summary: review authors' judgements about each risk of bias item for each included study.
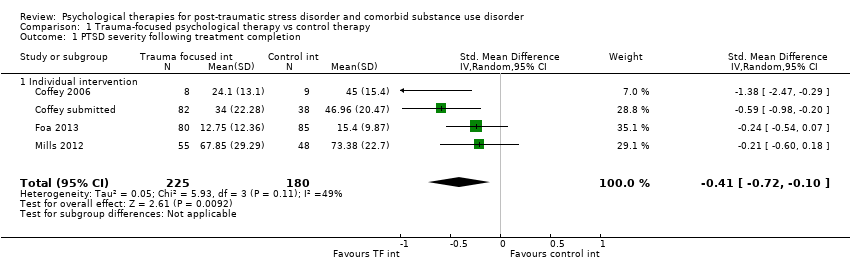
Comparison 1 Trauma‐focused psychological therapy vs control therapy, Outcome 1 PTSD severity following treatment completion.

Comparison 1 Trauma‐focused psychological therapy vs control therapy, Outcome 2 PTSD severity 3‐4 months following treatment completion.
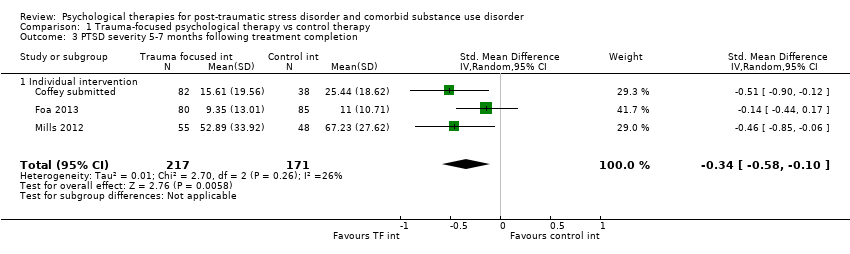
Comparison 1 Trauma‐focused psychological therapy vs control therapy, Outcome 3 PTSD severity 5‐7 months following treatment completion.
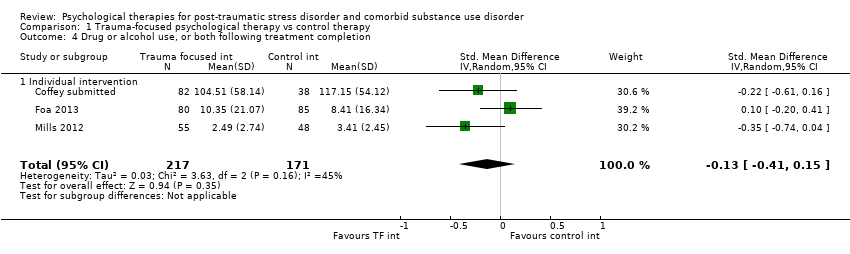
Comparison 1 Trauma‐focused psychological therapy vs control therapy, Outcome 4 Drug or alcohol use, or both following treatment completion.

Comparison 1 Trauma‐focused psychological therapy vs control therapy, Outcome 5 Drug or alcohol use, or both 3‐4 months following treatment completion.
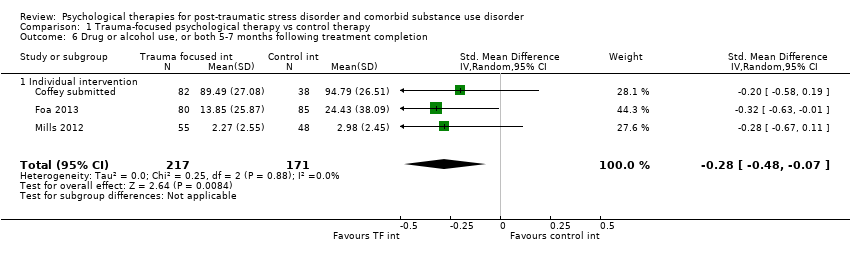
Comparison 1 Trauma‐focused psychological therapy vs control therapy, Outcome 6 Drug or alcohol use, or both 5‐7 months following treatment completion.
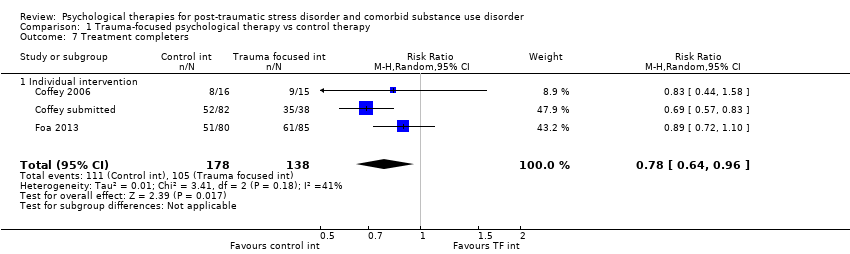
Comparison 1 Trauma‐focused psychological therapy vs control therapy, Outcome 7 Treatment completers.
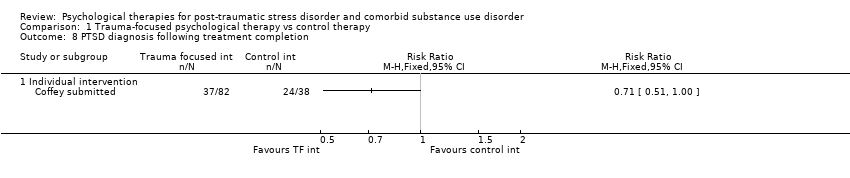
Comparison 1 Trauma‐focused psychological therapy vs control therapy, Outcome 8 PTSD diagnosis following treatment completion.
| Study | |
| Individual intervention | |
| Coffey 2006 | Not reported |
| Coffey submitted | Not reported |
| Foa 2013 | Twelve participants were removed from the study because of serious adverse events (serious suicidal ideation, n = 7; serious medical illness, n = 3; psychotic symptoms, n = 1; death, n = 1; however, none of these events was determined to be related to the study). |
| Mills 2012 | Two participants from the treatment group (3.6%) and 5 participants from the control group (10.4%) attempted suicide during the study (OR, 0.32 [95% CI, 0.06‐1.76]). Although it is possible that these attempts were related to participation in the study, all 7 individuals reported that this was not the case and elected to remain involved with the study. Additionally, 1 participant from the treatment group (1.8%) died as a result of a preexisting medical condition. |
Comparison 1 Trauma‐focused psychological therapy vs control therapy, Outcome 9 Adverse events.

Comparison 1 Trauma‐focused psychological therapy vs control therapy, Outcome 10 Adverse events.
| Study | Mean number sessions attended by intervention group (& SD) | Number sessions available | Percentage attended |
| Studies including intervention for SUD | |||
| Coffey submitted | 8.16 (3.26) approximated | 12 | 68.0% |
| Foa 2013 | 6.33 (5.31) | 18 | 35.2% |
| Mills 2012 | 5.83 (4.94) | 13 | 44.9% |
Comparison 1 Trauma‐focused psychological therapy vs control therapy, Outcome 11 Mean number of sessions attended for intervention group.

Comparison 1 Trauma‐focused psychological therapy vs control therapy, Outcome 12 Sensitivity analysis: PTSD severity following treatment completion.

Comparison 2 Trauma‐focused psychological therapy vs active psychological therapy for SUD only, Outcome 1 PTSD severity following treatment completion.

Comparison 2 Trauma‐focused psychological therapy vs active psychological therapy for SUD only, Outcome 2 PTSD severity 5‐7 months following treatment completion.

Comparison 2 Trauma‐focused psychological therapy vs active psychological therapy for SUD only, Outcome 3 PTSD severity 8‐10 months following treatment completion.
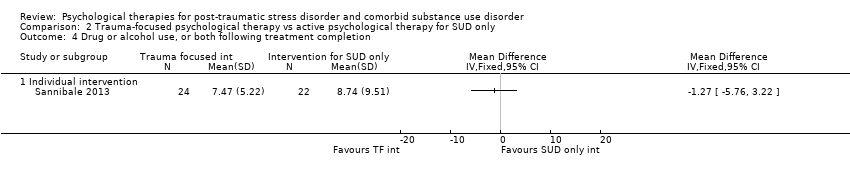
Comparison 2 Trauma‐focused psychological therapy vs active psychological therapy for SUD only, Outcome 4 Drug or alcohol use, or both following treatment completion.
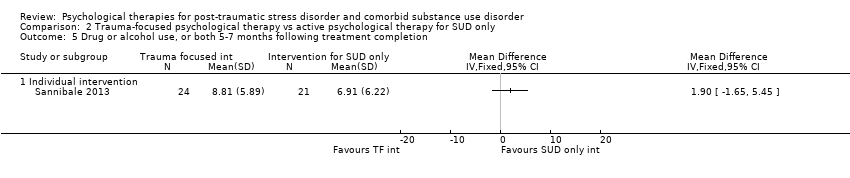
Comparison 2 Trauma‐focused psychological therapy vs active psychological therapy for SUD only, Outcome 5 Drug or alcohol use, or both 5‐7 months following treatment completion.

Comparison 2 Trauma‐focused psychological therapy vs active psychological therapy for SUD only, Outcome 6 Drug or alcohol use, or both 8‐10 months following treatment completion.

Comparison 2 Trauma‐focused psychological therapy vs active psychological therapy for SUD only, Outcome 7 Treatment completers.

Comparison 2 Trauma‐focused psychological therapy vs active psychological therapy for SUD only, Outcome 8 PTSD diagnosis following treatment completion.
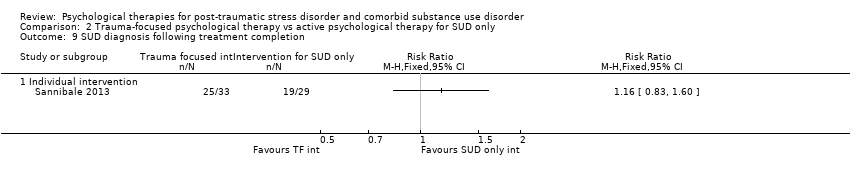
Comparison 2 Trauma‐focused psychological therapy vs active psychological therapy for SUD only, Outcome 9 SUD diagnosis following treatment completion.
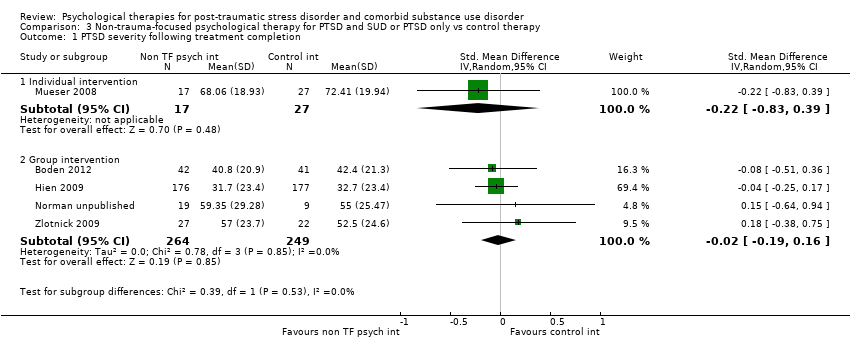
Comparison 3 Non‐trauma‐focused psychological therapy for PTSD and SUD or PTSD only vs control therapy, Outcome 1 PTSD severity following treatment completion.
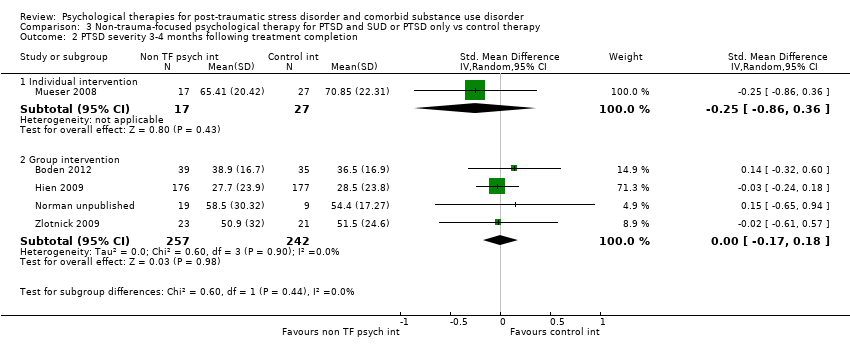
Comparison 3 Non‐trauma‐focused psychological therapy for PTSD and SUD or PTSD only vs control therapy, Outcome 2 PTSD severity 3‐4 months following treatment completion.
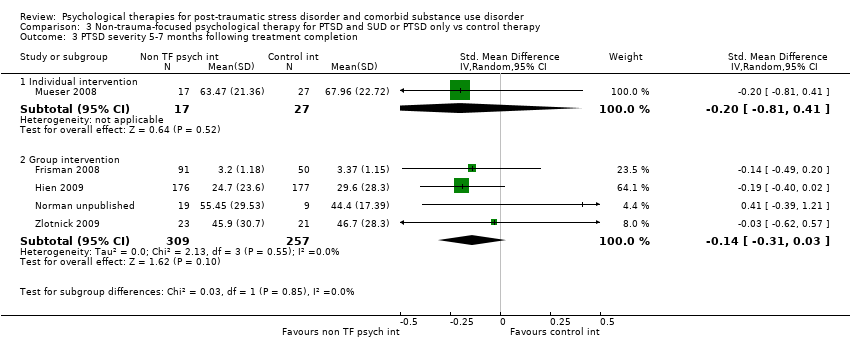
Comparison 3 Non‐trauma‐focused psychological therapy for PTSD and SUD or PTSD only vs control therapy, Outcome 3 PTSD severity 5‐7 months following treatment completion.
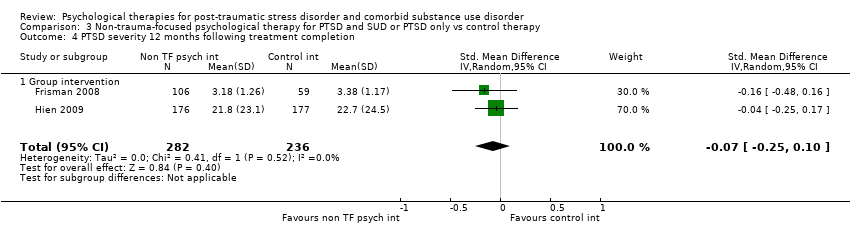
Comparison 3 Non‐trauma‐focused psychological therapy for PTSD and SUD or PTSD only vs control therapy, Outcome 4 PTSD severity 12 months following treatment completion.

Comparison 3 Non‐trauma‐focused psychological therapy for PTSD and SUD or PTSD only vs control therapy, Outcome 5 Drug or alcohol use, or both following treatment completion.

Comparison 3 Non‐trauma‐focused psychological therapy for PTSD and SUD or PTSD only vs control therapy, Outcome 6 Drug or alcohol use, or both 3‐4 months following treatment completion.

Comparison 3 Non‐trauma‐focused psychological therapy for PTSD and SUD or PTSD only vs control therapy, Outcome 7 Drug or alcohol use, or both 5‐7 months following treatment completion.

Comparison 3 Non‐trauma‐focused psychological therapy for PTSD and SUD or PTSD only vs control therapy, Outcome 8 Drug or alcohol use, or both 12 months following treatment completion.
| Study | |
| Individual intervention | |
| Mueser 2008 | 12/16 (70.6%) |
| Group intervention | |
| Frisman 2008 | 39/141 (28%) |
Comparison 3 Non‐trauma‐focused psychological therapy for PTSD and SUD or PTSD only vs control therapy, Outcome 9 Treatment completers.
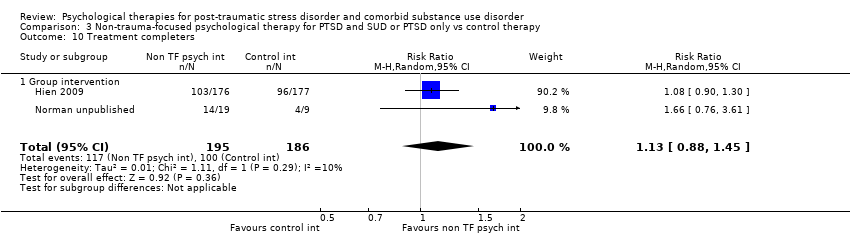
Comparison 3 Non‐trauma‐focused psychological therapy for PTSD and SUD or PTSD only vs control therapy, Outcome 10 Treatment completers.
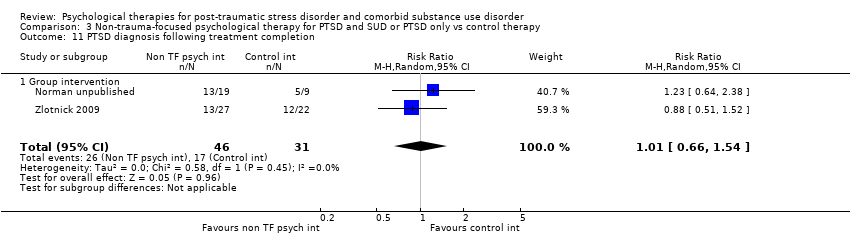
Comparison 3 Non‐trauma‐focused psychological therapy for PTSD and SUD or PTSD only vs control therapy, Outcome 11 PTSD diagnosis following treatment completion.
| Study | |
| Group intervention | |
| Boden 2012 | No harmful or unintended effects were observed during the trial. |
| Frisman 2008 | Not reported |
| Hien 2009 | 83 study related adverse events were identified (Killeen 2008). Of these 61 were rated as moderate to severe: 28 for the experimental condition; 33 for the control condition. |
| Najavits 2006a | Not reported |
| Norman unpublished | No adverse events occurred during the study. |
| Zlotnick 2009 | Not reported |
Comparison 3 Non‐trauma‐focused psychological therapy for PTSD and SUD or PTSD only vs control therapy, Outcome 12 Adverse events.

Comparison 3 Non‐trauma‐focused psychological therapy for PTSD and SUD or PTSD only vs control therapy, Outcome 13 Study‐related adverse events.
| Study | Mean number treatment condition sessions attended by intervention group (& SD) | Number sessions available | Percentage active intervention sessions attended | Mean number sessions attended by control group (& SD) | Percentage attended |
| Group intervention | |||||
| Boden 2012 | Not reported | Not reported | |||
| Frisman 2008 | 3.41 (3.38) active intervention sessions + 30.67 (37.38) TAU sessions | 9 active intervention sessions plus TAU sessions | 37.9% | 39.0 (69.62) TAU sessions | |
| Hien 2009 | 6.2 (4.5) | 12 | 51.7% | 6.9 (4.3) | 57.5% |
| Najavits 2006a | 9.67(5.05) active intervention session (11.78 (6.25) active intervention +TAU sessions) | 25 active intervention sessions plus TAU sessions | 38.7% | Not reported | |
| Norman unpublished | 12.5 (8.77) | 24 | 52.1% | 7.78 (5.78) | 32.4% |
| Zlotnick 2009 | 15.6 (6.2) | 25 | 62.4% | Not reported | |
Comparison 3 Non‐trauma‐focused psychological therapy for PTSD and SUD or PTSD only vs control therapy, Outcome 14 Mean number of sessions attended for intervention group.

Comparison 3 Non‐trauma‐focused psychological therapy for PTSD and SUD or PTSD only vs control therapy, Outcome 15 Mean number of sessions attended.

Comparison 3 Non‐trauma‐focused psychological therapy for PTSD and SUD or PTSD only vs control therapy, Outcome 16 Sensitivity analysis: PTSD severity 5‐7 months following treatment completion.

Comparison 3 Non‐trauma‐focused psychological therapy for PTSD and SUD or PTSD only vs control therapy, Outcome 17 Sensitivity analysis: PTSD severity 12 months following treatment completion.

Comparison 3 Non‐trauma‐focused psychological therapy for PTSD and SUD or PTSD only vs control therapy, Outcome 18 Sensitivity analysis: drug or alcohol use, or both 5‐7 months following treatment completion.

Comparison 3 Non‐trauma‐focused psychological therapy for PTSD and SUD or PTSD only vs control therapy, Outcome 19 Sensitivity analysis: drug or alcohol use, or both 12 months following treatment completion.

Comparison 4 Non‐trauma‐focused psychological therapy for PTSD and SUD or PTSD only vs active psychological therapy for SUD only, Outcome 1 PTSD severity following treatment completion.
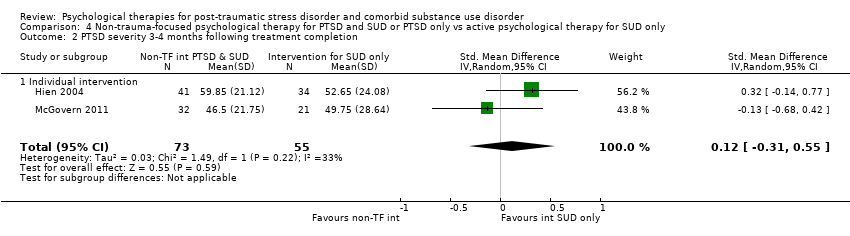
Comparison 4 Non‐trauma‐focused psychological therapy for PTSD and SUD or PTSD only vs active psychological therapy for SUD only, Outcome 2 PTSD severity 3‐4 months following treatment completion.

Comparison 4 Non‐trauma‐focused psychological therapy for PTSD and SUD or PTSD only vs active psychological therapy for SUD only, Outcome 3 PTSD severity 5‐7 months following treatment completion.

Comparison 4 Non‐trauma‐focused psychological therapy for PTSD and SUD or PTSD only vs active psychological therapy for SUD only, Outcome 4 Drug or alcohol use, or both following treatment completion.
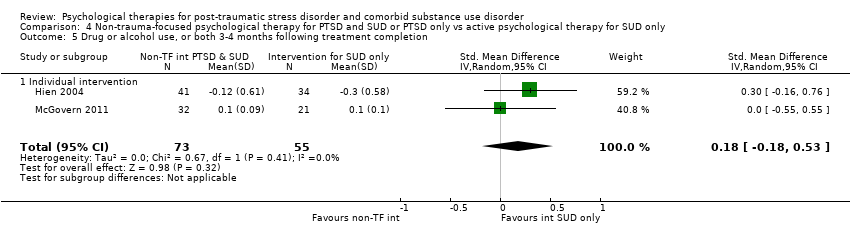
Comparison 4 Non‐trauma‐focused psychological therapy for PTSD and SUD or PTSD only vs active psychological therapy for SUD only, Outcome 5 Drug or alcohol use, or both 3‐4 months following treatment completion.
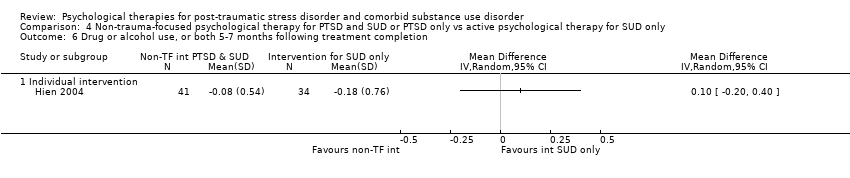
Comparison 4 Non‐trauma‐focused psychological therapy for PTSD and SUD or PTSD only vs active psychological therapy for SUD only, Outcome 6 Drug or alcohol use, or both 5‐7 months following treatment completion.

Comparison 4 Non‐trauma‐focused psychological therapy for PTSD and SUD or PTSD only vs active psychological therapy for SUD only, Outcome 7 Treatment completers.
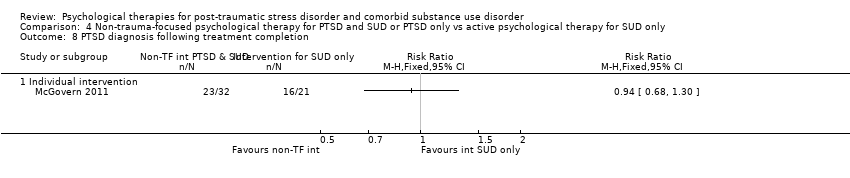
Comparison 4 Non‐trauma‐focused psychological therapy for PTSD and SUD or PTSD only vs active psychological therapy for SUD only, Outcome 8 PTSD diagnosis following treatment completion.

Comparison 4 Non‐trauma‐focused psychological therapy for PTSD and SUD or PTSD only vs active psychological therapy for SUD only, Outcome 9 Mean number of sessions attended.
| Trauma‐focused psychological therapy compared to control intervention | ||||||
| Patient or population: Individuals with post‐traumatic stress disorder and comorbid substance use disorder | ||||||
| Outcomes | Illustrative comparative risks* (95% CI) | Relative effect | No of Participants | Quality of the evidence | Comments | |
| Assumed risk | Corresponding risk | |||||
| TAU/ minimal intervention | Individual‐based psychological therapyincluding a trauma‐focused component | |||||
| PTSD severity following treatment completion As assessed by the CAPS, PSS‐I, or IES‐R. High scores indicate greater symptom severity | ‐ | The mean PTSD severity following treatment completion in the intervention groups was | ‐ | 405 | ⊕⊝⊝⊝ | SMD ‐0.41 (‐0.72 to ‐0.1) Effect sizes of the range 0.2 to 0.5 indicate a small treatment effect |
| Drug or alcohol use, or both following treatment completion As assessed by the TLFB or CIDI. High scores indicate greater symptom severity | ‐ | The mean drug/alcohol use following treatment completion in the intervention groups was | ‐ | 388 | ⊕⊝⊝⊝ | SMD ‐0.13 (‐0.41 to 0.15) Not significant |
| Treatment completers | Study population | RR 0.80 | 316 | ⊕⊕⊝⊝ | Indicates higher drop‐out in the intervention group | |
| 761 per 1000 | 609 per 1000 | |||||
| Moderate | ||||||
| 718 per 1000 | 574 per 1000 | |||||
| *The basis for the assumed risk (e.g. the median control group risk across studies) is provided in footnotes. The corresponding risk (and its 95% confidence interval) is based on the assumed risk in the comparison group and the relative effect of the intervention (and its 95% CI). | ||||||
| GRADE Working Group grades of evidence | ||||||
| 1Quality of evidence downgraded by one point because the risk of bias in most trials was high or unclear in several domains. SUD based adjunctive therapy was not a formal part of either the experimental or control condition in one study (Coffey 2006). However, participants were recruited through an SUD based service and it is likely that they would have had access to adjunctive SUD‐ based therapy on an informal basis. All other studies in this comparison included formal access SUD‐based adjunctive therapy. | ||||||
| Trauma‐focused psychological therapy compared to active psychological therapy for SUD only | ||||||
| Patient or population: Individuals with post‐traumatic stress disorder and comorbid substance use disorder | ||||||
| Outcomes | Illustrative comparative risks* (95% CI) | Relative effect | No of Participants | Quality of the evidence | Comments | |
| Assumed risk | Corresponding risk | |||||
| Active psychological therapyfor SUD only | Individual‐based psychological therapyincluding a trauma‐focused component | |||||
| PTSD severity following treatment completion As assessed by the CAPS. High scores indicate greater symptom severity | ‐ | The mean PTSD severity following treatment completion in the intervention groups was | ‐ | 46 | ⊕⊕⊝⊝ | Not significant |
| Drug or alcohol use, or both following treatment completion As assessed by the TLFB. High scores indicate greater symptom severity | ‐ | The mean drug/alcohol use following treatment completion in the intervention groups was | ‐ | 46 | ⊕⊕⊝⊝ | Not significant |
| Treatment completers | Study population | RR 1 | 62 | ⊕⊕⊝⊝ | Not significant | |
| 724 per 1000 | 724 per 1000 | |||||
| Moderate | ||||||
| 724 per 1000 | 724 per 1000 | |||||
| *The basis for the assumed risk (e.g. the median control group risk across studies) is provided in footnotes. The corresponding risk (and its 95% confidence interval) is based on the assumed risk in the comparison group and the relative effect of the intervention (and its 95% CI). | ||||||
| GRADE Working Group grades of evidence | ||||||
| 1Quality of evidence downgraded by two points because findings were based on outcomes from one study with a small sample size. SUD based adjunctive therapy was not a formal part of either the experimental or control condition in the study contributing to this comparison. | ||||||
| Non‐trauma‐focused psychological therapy for PTSD and SUD or PTSD only compared to control intervention | ||||||
| Patient or population: Individuals with post‐traumatic stress disorder and comorbid substance use disorder | ||||||
| Outcomes | Illustrative comparative risks* (95% CI) | Relative effect | No of Participants | Quality of the evidence | Comments | |
| Assumed risk | Corresponding risk | |||||
| TAU/minimal intervention | Group or Indvidual based non‐trauma‐focused psychological therapy | |||||
| PTSD severity following treatment completion ‐ Individual‐based intervention As assessed by the CAPS. High scores indicate greater symptom severity | ‐ | The mean PTSD severity following treatment completion in the intervention groups was | ‐ | 44 | ⊕⊕⊝⊝ | SMD ‐0.22 (‐0.83 to 0.39) |
| PTSD severity following treatment completion ‐ Group‐based intervention As assessed by the CAPS or IES‐R. High scores indicate greater symptom severity | ‐ | The mean PTSD severity following treatment completion in the intervention groups was | ‐ | 513 | ⊕⊕⊝⊝ | SMD ‐0.02 (‐0.19 to 0.16) |
| Drug or alcohol use, or both following treatment completion ‐ Individual‐based intervention | ‐ | No data | ‐ | ‐ | ‐ | Not estimable |
| Drug or alcohol use, or both following treatment completion ‐ Group‐based intervention As assessed by the ASI, TLFB or CIDI. High scores indicate greater symptom severity | ‐ | The mean drug/alcohol use following treatment completion in the intervention groups was | ‐ | 464 | ⊕⊝⊝⊝ | SMD ‐0.41 (‐0.97 to 0.14) Not significant |
| Treatment completers ‐ Individual‐based intervention | ‐ | No data | ‐ | ‐ | ‐ | Not estimable |
| Treatment completers ‐ Group‐based intervention | Study population | RR 1.13 | 381 | ⊕⊕⊝⊝ | ‐ | |
| 538 per 1000 | 608 per 1000 | |||||
| Moderate | ||||||
| 493 per 1000 | 557 per 1000 | |||||
| *The basis for the assumed risk (e.g. the median control group risk across studies) is provided in footnotes. The corresponding risk (and its 95% confidence interval) is based on the assumed risk in the comparison group and the relative effect of the intervention (and its 95% CI). | ||||||
| GRADE Working Group grades of evidence | ||||||
| 1Quality of evidence downgraded by two points because findings were based on outcomes from one study with a small sample size. The individual‐based study (Mueser 2008) in this comparison did not include access to SUD based adjunctive therapy. Participants in all other studies were able to access SUD‐based adjunctive therapy. | ||||||
| Non‐trauma‐focused psychological therapy for PTSD and SUD or PTSD only compared to active psychological therapy for SUD only | ||||||
| Patient or population: Individuals with post‐traumatic stress disorder and comorbid substance use disorder | ||||||
| Outcomes | Illustrative comparative risks* (95% CI) | Relative effect | No of Participants | Quality of the evidence | Comments | |
| Assumed risk | Corresponding risk | |||||
| Active psychological therapyfor SUD only | Individual‐based combined non‐trauma‐focused psychological therapy | |||||
| PTSD severity following treatment completion As assessed by the CAPS. High scores indicate greater symptom severity | ‐ | The mean PTSD severity following treatment completion in the intervention groups was | ‐ | 128 | ⊕⊝⊝⊝ | SMD ‐0.26 (‐1.29 to 0.77) Not significant |
| Drug or alcohol use, or both following treatment completion As assessed by the SUI or ASI. High scores indicate greater symptom severity | ‐ | The mean drug/alcohol use following treatment completion in the intervention groups was | ‐ | 128 | ⊕⊕⊝⊝ | SMD 0.22 (‐0.13 to 0.57) Not significant |
| Treatment completers | Study population | RR 0.91 | 128 | ⊕⊝⊝⊝ | Not significant | |
| 618 per 1000 | 563 per 1000 | |||||
| Moderate | ||||||
| 591 per 1000 | 538 per 1000 | |||||
| *The basis for the assumed risk (e.g. the median control group risk across studies) is provided in footnotes. The corresponding risk (and its 95% confidence interval) is based on the assumed risk in the comparison group and the relative effect of the intervention (and its 95% CI). | ||||||
| GRADE Working Group grades of evidence | ||||||
| 1Quality of evidence downgraded by one point because the risk of bias in most trials was high or unclear in several domains. Both studies in this comparison involved access to adjunctive SUD‐based therapy. | ||||||
| Outcome or subgroup title | No. of studies | No. of participants | Statistical method | Effect size |
| 1 PTSD severity following treatment completion Show forest plot | 4 | 405 | Std. Mean Difference (IV, Random, 95% CI) | ‐0.41 [‐0.72, ‐0.10] |
| 1.1 Individual intervention | 4 | 405 | Std. Mean Difference (IV, Random, 95% CI) | ‐0.41 [‐0.72, ‐0.10] |
| 2 PTSD severity 3‐4 months following treatment completion Show forest plot | 1 | Mean Difference (IV, Fixed, 95% CI) | Totals not selected | |
| 2.1 Individual intervention | 1 | Mean Difference (IV, Fixed, 95% CI) | 0.0 [0.0, 0.0] | |
| 3 PTSD severity 5‐7 months following treatment completion Show forest plot | 3 | 388 | Std. Mean Difference (IV, Random, 95% CI) | ‐0.34 [‐0.58, ‐0.10] |
| 3.1 Individual intervention | 3 | 388 | Std. Mean Difference (IV, Random, 95% CI) | ‐0.34 [‐0.58, ‐0.10] |
| 4 Drug or alcohol use, or both following treatment completion Show forest plot | 3 | 388 | Std. Mean Difference (IV, Random, 95% CI) | ‐0.13 [‐0.41, 0.15] |
| 4.1 Individual intervention | 3 | 388 | Std. Mean Difference (IV, Random, 95% CI) | ‐0.13 [‐0.41, 0.15] |
| 5 Drug or alcohol use, or both 3‐4 months following treatment completion Show forest plot | 1 | Mean Difference (IV, Fixed, 95% CI) | Totals not selected | |
| 5.1 Individual intervention | 1 | Mean Difference (IV, Fixed, 95% CI) | 0.0 [0.0, 0.0] | |
| 6 Drug or alcohol use, or both 5‐7 months following treatment completion Show forest plot | 3 | 388 | Std. Mean Difference (IV, Random, 95% CI) | ‐0.28 [‐0.48, ‐0.07] |
| 6.1 Individual intervention | 3 | 388 | Std. Mean Difference (IV, Random, 95% CI) | ‐0.28 [‐0.48, ‐0.07] |
| 7 Treatment completers Show forest plot | 3 | 316 | Risk Ratio (M‐H, Random, 95% CI) | 0.78 [0.64, 0.96] |
| 7.1 Individual intervention | 3 | 316 | Risk Ratio (M‐H, Random, 95% CI) | 0.78 [0.64, 0.96] |
| 8 PTSD diagnosis following treatment completion Show forest plot | 1 | Risk Ratio (M‐H, Fixed, 95% CI) | Totals not selected | |
| 8.1 Individual intervention | 1 | Risk Ratio (M‐H, Fixed, 95% CI) | 0.0 [0.0, 0.0] | |
| 9 Adverse events Show forest plot | Other data | No numeric data | ||
| 9.1 Individual intervention | Other data | No numeric data | ||
| 10 Adverse events Show forest plot | 2 | 268 | Risk Ratio (M‐H, Random, 95% CI) | 0.81 [0.34, 1.90] |
| 10.1 Individual intervention | 2 | 268 | Risk Ratio (M‐H, Random, 95% CI) | 0.81 [0.34, 1.90] |
| 11 Mean number of sessions attended for intervention group Show forest plot | Other data | No numeric data | ||
| 11.1 Studies including intervention for SUD | Other data | No numeric data | ||
| 12 Sensitivity analysis: PTSD severity following treatment completion Show forest plot | 3 | 388 | Std. Mean Difference (IV, Random, 95% CI) | ‐0.33 [‐0.56, ‐0.10] |
| 12.1 Individual intervention | 3 | 388 | Std. Mean Difference (IV, Random, 95% CI) | ‐0.33 [‐0.56, ‐0.10] |
| Outcome or subgroup title | No. of studies | No. of participants | Statistical method | Effect size |
| 1 PTSD severity following treatment completion Show forest plot | 1 | Mean Difference (IV, Fixed, 95% CI) | Totals not selected | |
| 1.1 Individual intervention | 1 | Mean Difference (IV, Fixed, 95% CI) | 0.0 [0.0, 0.0] | |
| 2 PTSD severity 5‐7 months following treatment completion Show forest plot | 1 | Mean Difference (IV, Fixed, 95% CI) | Totals not selected | |
| 2.1 Individual intervention | 1 | Mean Difference (IV, Fixed, 95% CI) | 0.0 [0.0, 0.0] | |
| 3 PTSD severity 8‐10 months following treatment completion Show forest plot | 1 | Mean Difference (IV, Fixed, 95% CI) | Totals not selected | |
| 3.1 Individual intervention | 1 | Mean Difference (IV, Fixed, 95% CI) | 0.0 [0.0, 0.0] | |
| 4 Drug or alcohol use, or both following treatment completion Show forest plot | 1 | Mean Difference (IV, Fixed, 95% CI) | Totals not selected | |
| 4.1 Individual intervention | 1 | Mean Difference (IV, Fixed, 95% CI) | 0.0 [0.0, 0.0] | |
| 5 Drug or alcohol use, or both 5‐7 months following treatment completion Show forest plot | 1 | Mean Difference (IV, Fixed, 95% CI) | Totals not selected | |
| 5.1 Individual intervention | 1 | Mean Difference (IV, Fixed, 95% CI) | 0.0 [0.0, 0.0] | |
| 6 Drug or alcohol use, or both 8‐10 months following treatment completion Show forest plot | 1 | Mean Difference (IV, Fixed, 95% CI) | Totals not selected | |
| 6.1 Individual intervention | 1 | Mean Difference (IV, Fixed, 95% CI) | 0.0 [0.0, 0.0] | |
| 7 Treatment completers Show forest plot | 1 | Risk Ratio (M‐H, Fixed, 95% CI) | Totals not selected | |
| 7.1 Individual intervention | 1 | Risk Ratio (M‐H, Fixed, 95% CI) | 0.0 [0.0, 0.0] | |
| 8 PTSD diagnosis following treatment completion Show forest plot | 1 | Risk Ratio (M‐H, Fixed, 95% CI) | Totals not selected | |
| 8.1 Individual intervention | 1 | Risk Ratio (M‐H, Fixed, 95% CI) | 0.0 [0.0, 0.0] | |
| 9 SUD diagnosis following treatment completion Show forest plot | 1 | Risk Ratio (M‐H, Fixed, 95% CI) | Totals not selected | |
| 9.1 Individual intervention | 1 | Risk Ratio (M‐H, Fixed, 95% CI) | 0.0 [0.0, 0.0] | |
| Outcome or subgroup title | No. of studies | No. of participants | Statistical method | Effect size |
| 1 PTSD severity following treatment completion Show forest plot | 5 | Std. Mean Difference (IV, Random, 95% CI) | Subtotals only | |
| 1.1 Individual intervention | 1 | 44 | Std. Mean Difference (IV, Random, 95% CI) | ‐0.22 [‐0.83, 0.39] |
| 1.2 Group intervention | 4 | 513 | Std. Mean Difference (IV, Random, 95% CI) | ‐0.02 [‐0.19, 0.16] |
| 2 PTSD severity 3‐4 months following treatment completion Show forest plot | 5 | Std. Mean Difference (IV, Random, 95% CI) | Subtotals only | |
| 2.1 Individual intervention | 1 | 44 | Std. Mean Difference (IV, Random, 95% CI) | ‐0.25 [‐0.86, 0.36] |
| 2.2 Group intervention | 4 | 499 | Std. Mean Difference (IV, Random, 95% CI) | 0.00 [‐0.17, 0.18] |
| 3 PTSD severity 5‐7 months following treatment completion Show forest plot | 5 | Std. Mean Difference (IV, Random, 95% CI) | Subtotals only | |
| 3.1 Individual intervention | 1 | 44 | Std. Mean Difference (IV, Random, 95% CI) | ‐0.20 [‐0.81, 0.41] |
| 3.2 Group intervention | 4 | 566 | Std. Mean Difference (IV, Random, 95% CI) | ‐0.14 [‐0.31, 0.03] |
| 4 PTSD severity 12 months following treatment completion Show forest plot | 2 | 518 | Std. Mean Difference (IV, Random, 95% CI) | ‐0.07 [‐0.25, 0.10] |
| 4.1 Group intervention | 2 | 518 | Std. Mean Difference (IV, Random, 95% CI) | ‐0.07 [‐0.25, 0.10] |
| 5 Drug or alcohol use, or both following treatment completion Show forest plot | 3 | 464 | Std. Mean Difference (IV, Random, 95% CI) | ‐0.41 [‐0.97, 0.14] |
| 5.1 Group intervention | 3 | 464 | Std. Mean Difference (IV, Random, 95% CI) | ‐0.41 [‐0.97, 0.14] |
| 6 Drug or alcohol use, or both 3‐4 months following treatment completion Show forest plot | 4 | 499 | Std. Mean Difference (IV, Random, 95% CI) | ‐0.08 [‐0.40, 0.23] |
| 6.1 Group intervention | 4 | 499 | Std. Mean Difference (IV, Random, 95% CI) | ‐0.08 [‐0.40, 0.23] |
| 7 Drug or alcohol use, or both 5‐7 months following treatment completion Show forest plot | 4 | 572 | Std. Mean Difference (IV, Random, 95% CI) | ‐0.06 [‐0.23, 0.11] |
| 7.1 Group intervention | 4 | 572 | Std. Mean Difference (IV, Random, 95% CI) | ‐0.06 [‐0.23, 0.11] |
| 8 Drug or alcohol use, or both 12 months following treatment completion Show forest plot | 2 | 528 | Std. Mean Difference (IV, Random, 95% CI) | 0.02 [‐0.15, 0.20] |
| 8.1 Group intervention | 2 | 528 | Std. Mean Difference (IV, Random, 95% CI) | 0.02 [‐0.15, 0.20] |
| 9 Treatment completers Show forest plot | Other data | No numeric data | ||
| 9.1 Individual intervention | Other data | No numeric data | ||
| 9.2 Group intervention | Other data | No numeric data | ||
| 10 Treatment completers Show forest plot | 2 | 381 | Risk Ratio (M‐H, Random, 95% CI) | 1.13 [0.88, 1.45] |
| 10.1 Group intervention | 2 | 381 | Risk Ratio (M‐H, Random, 95% CI) | 1.13 [0.88, 1.45] |
| 11 PTSD diagnosis following treatment completion Show forest plot | 2 | 77 | Risk Ratio (M‐H, Random, 95% CI) | 1.01 [0.66, 1.54] |
| 11.1 Group intervention | 2 | 77 | Risk Ratio (M‐H, Random, 95% CI) | 1.01 [0.66, 1.54] |
| 12 Adverse events Show forest plot | Other data | No numeric data | ||
| 12.1 Group intervention | Other data | No numeric data | ||
| 13 Study‐related adverse events Show forest plot | 1 | Risk Ratio (M‐H, Fixed, 95% CI) | Totals not selected | |
| 13.1 Group intervention | 1 | Risk Ratio (M‐H, Fixed, 95% CI) | 0.0 [0.0, 0.0] | |
| 14 Mean number of sessions attended for intervention group Show forest plot | Other data | No numeric data | ||
| 14.1 Group intervention | Other data | No numeric data | ||
| 15 Mean number of sessions attended Show forest plot | 2 | 381 | Std. Mean Difference (IV, Random, 95% CI) | 0.10 [‐0.59, 0.79] |
| 15.1 Group intervention | 2 | 381 | Std. Mean Difference (IV, Random, 95% CI) | 0.10 [‐0.59, 0.79] |
| 16 Sensitivity analysis: PTSD severity 5‐7 months following treatment completion Show forest plot | 3 | Std. Mean Difference (IV, Random, 95% CI) | Subtotals only | |
| 16.1 Group intervention | 3 | 425 | Std. Mean Difference (IV, Random, 95% CI) | ‐0.12 [‐0.34, 0.10] |
| 17 Sensitivity analysis: PTSD severity 12 months following treatment completion Show forest plot | 1 | 353 | Std. Mean Difference (IV, Random, 95% CI) | ‐0.04 [‐0.25, 0.17] |
| 17.1 Group intervention | 1 | 353 | Std. Mean Difference (IV, Random, 95% CI) | ‐0.04 [‐0.25, 0.17] |
| 18 Sensitivity analysis: drug or alcohol use, or both 5‐7 months following treatment completion Show forest plot | 3 | 425 | Std. Mean Difference (IV, Random, 95% CI) | ‐0.11 [‐0.30, 0.08] |
| 18.1 Group intervention | 3 | 425 | Std. Mean Difference (IV, Random, 95% CI) | ‐0.11 [‐0.30, 0.08] |
| 19 Sensitivity analysis: drug or alcohol use, or both 12 months following treatment completion Show forest plot | 1 | 353 | Std. Mean Difference (IV, Random, 95% CI) | 0.0 [‐0.21, 0.21] |
| 19.1 Group intervention | 1 | 353 | Std. Mean Difference (IV, Random, 95% CI) | 0.0 [‐0.21, 0.21] |
| Outcome or subgroup title | No. of studies | No. of participants | Statistical method | Effect size |
| 1 PTSD severity following treatment completion Show forest plot | 2 | 128 | Std. Mean Difference (IV, Random, 95% CI) | ‐0.26 [‐1.29, 0.77] |
| 1.1 Individual intervention | 2 | 128 | Std. Mean Difference (IV, Random, 95% CI) | ‐0.26 [‐1.29, 0.77] |
| 2 PTSD severity 3‐4 months following treatment completion Show forest plot | 2 | 128 | Std. Mean Difference (IV, Random, 95% CI) | 0.12 [‐0.31, 0.55] |
| 2.1 Individual intervention | 2 | 128 | Std. Mean Difference (IV, Random, 95% CI) | 0.12 [‐0.31, 0.55] |
| 3 PTSD severity 5‐7 months following treatment completion Show forest plot | 1 | Mean Difference (IV, Fixed, 95% CI) | Totals not selected | |
| 3.1 Individual intervention | 1 | Mean Difference (IV, Fixed, 95% CI) | 0.0 [0.0, 0.0] | |
| 4 Drug or alcohol use, or both following treatment completion Show forest plot | 2 | 128 | Std. Mean Difference (IV, Random, 95% CI) | 0.22 [‐0.13, 0.57] |
| 4.1 Individual intervention | 2 | 128 | Std. Mean Difference (IV, Random, 95% CI) | 0.22 [‐0.13, 0.57] |
| 5 Drug or alcohol use, or both 3‐4 months following treatment completion Show forest plot | 2 | 128 | Std. Mean Difference (IV, Random, 95% CI) | 0.18 [‐0.18, 0.53] |
| 5.1 Individual intervention | 2 | 128 | Std. Mean Difference (IV, Random, 95% CI) | 0.18 [‐0.18, 0.53] |
| 6 Drug or alcohol use, or both 5‐7 months following treatment completion Show forest plot | 1 | Mean Difference (IV, Random, 95% CI) | Totals not selected | |
| 6.1 Individual intervention | 1 | Mean Difference (IV, Random, 95% CI) | 0.0 [0.0, 0.0] | |
| 7 Treatment completers Show forest plot | 2 | 128 | Risk Ratio (M‐H, Random, 95% CI) | 0.91 [0.68, 1.20] |
| 7.1 Individual intervention | 2 | 128 | Risk Ratio (M‐H, Random, 95% CI) | 0.91 [0.68, 1.20] |
| 8 PTSD diagnosis following treatment completion Show forest plot | 1 | Risk Ratio (M‐H, Fixed, 95% CI) | Totals not selected | |
| 8.1 Individual intervention | 1 | Risk Ratio (M‐H, Fixed, 95% CI) | 0.0 [0.0, 0.0] | |
| 9 Mean number of sessions attended Show forest plot | 1 | Mean Difference (IV, Fixed, 95% CI) | Totals not selected | |
| 9.1 Individual intervention | 1 | Mean Difference (IV, Fixed, 95% CI) | 0.0 [0.0, 0.0] | |