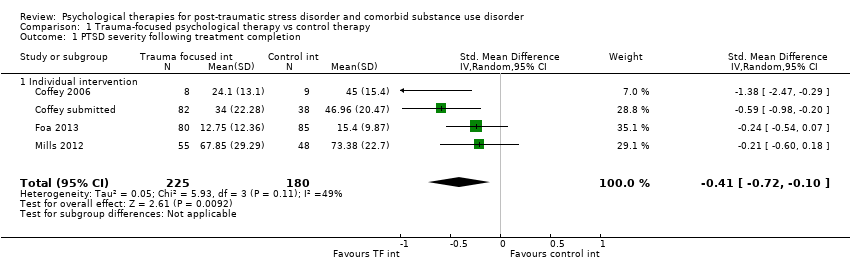
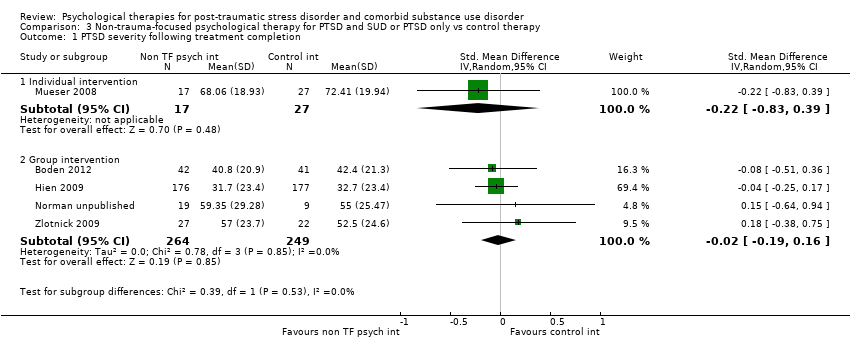
| 1 PTSD severity following treatment completion Show forest plot | 5 | | Std. Mean Difference (IV, Random, 95% CI) | Subtotals only |
|
| 1.1 Individual intervention | 1 | 44 | Std. Mean Difference (IV, Random, 95% CI) | ‐0.22 [‐0.83, 0.39] |
| 1.2 Group intervention | 4 | 513 | Std. Mean Difference (IV, Random, 95% CI) | ‐0.02 [‐0.19, 0.16] |
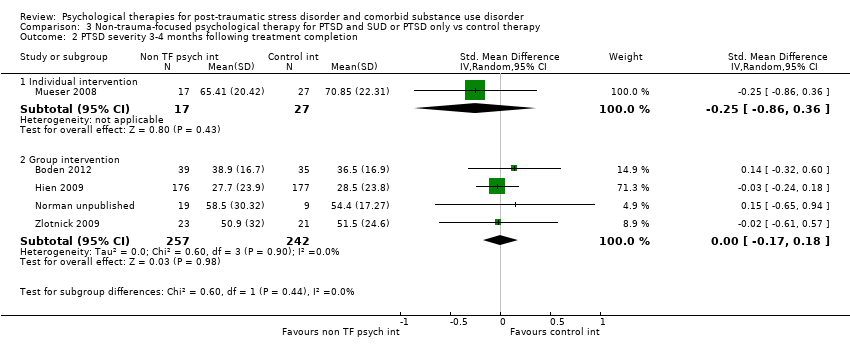
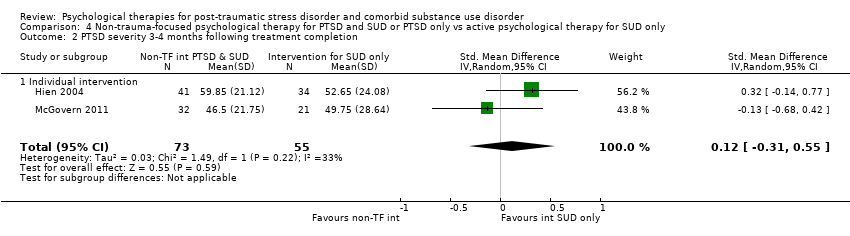
| 2 PTSD severity 3‐4 months following treatment completion Show forest plot | 5 | | Std. Mean Difference (IV, Random, 95% CI) | Subtotals only |
|
| 2.1 Individual intervention | 1 | 44 | Std. Mean Difference (IV, Random, 95% CI) | ‐0.25 [‐0.86, 0.36] |
| 2.2 Group intervention | 4 | 499 | Std. Mean Difference (IV, Random, 95% CI) | 0.00 [‐0.17, 0.18] |
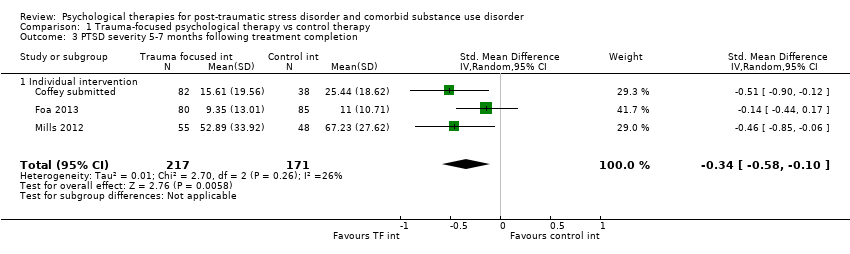
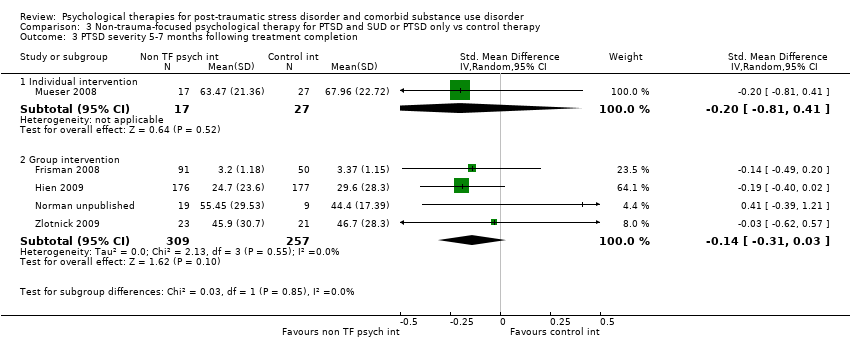
| 3 PTSD severity 5‐7 months following treatment completion Show forest plot | 5 | | Std. Mean Difference (IV, Random, 95% CI) | Subtotals only |
|
| 3.1 Individual intervention | 1 | 44 | Std. Mean Difference (IV, Random, 95% CI) | ‐0.20 [‐0.81, 0.41] |
| 3.2 Group intervention | 4 | 566 | Std. Mean Difference (IV, Random, 95% CI) | ‐0.14 [‐0.31, 0.03] |
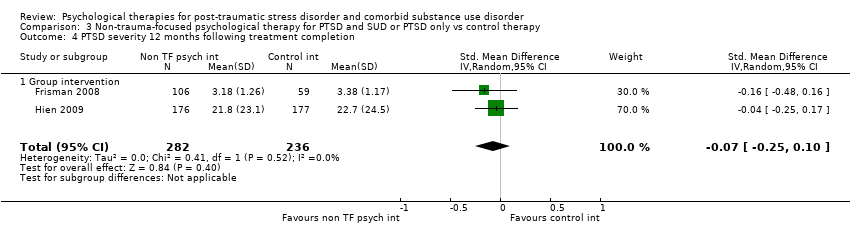
| 4 PTSD severity 12 months following treatment completion Show forest plot | 2 | 518 | Std. Mean Difference (IV, Random, 95% CI) | ‐0.07 [‐0.25, 0.10] |
|
| 4.1 Group intervention | 2 | 518 | Std. Mean Difference (IV, Random, 95% CI) | ‐0.07 [‐0.25, 0.10] |
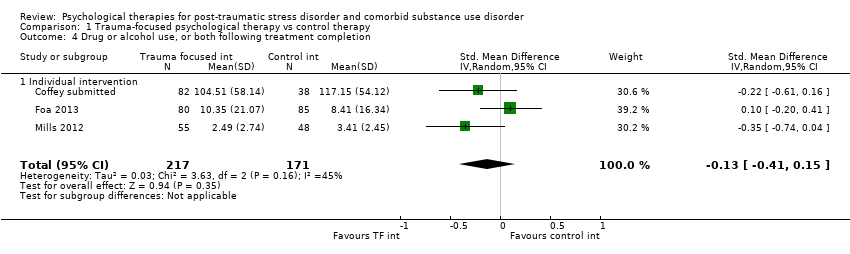
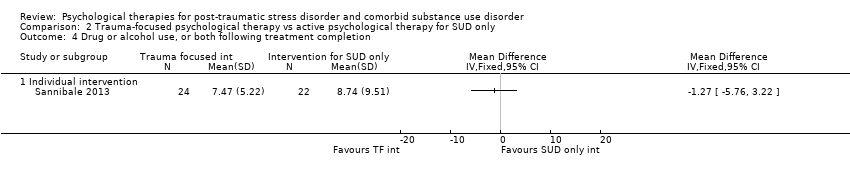
| 5 Drug or alcohol use, or both following treatment completion Show forest plot | 3 | 464 | Std. Mean Difference (IV, Random, 95% CI) | ‐0.41 [‐0.97, 0.14] |
|
| 5.1 Group intervention | 3 | 464 | Std. Mean Difference (IV, Random, 95% CI) | ‐0.41 [‐0.97, 0.14] |
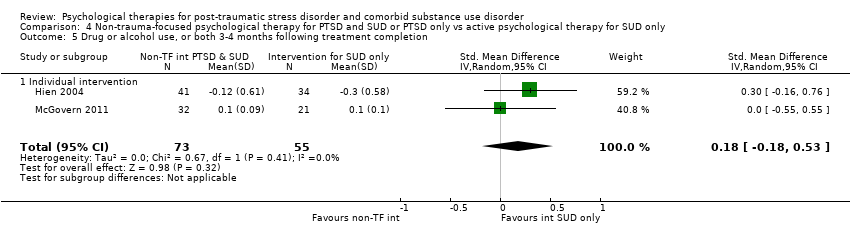
| 6 Drug or alcohol use, or both 3‐4 months following treatment completion Show forest plot | 4 | 499 | Std. Mean Difference (IV, Random, 95% CI) | ‐0.08 [‐0.40, 0.23] |
|
| 6.1 Group intervention | 4 | 499 | Std. Mean Difference (IV, Random, 95% CI) | ‐0.08 [‐0.40, 0.23] |
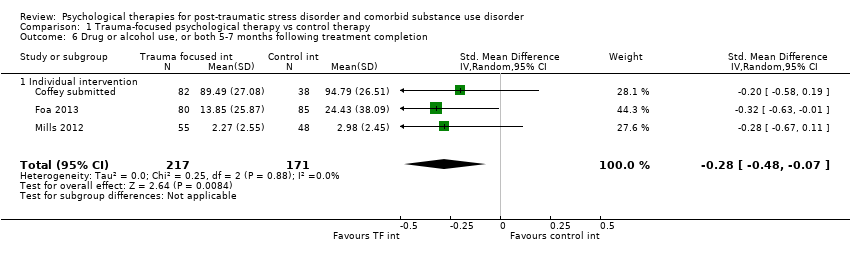
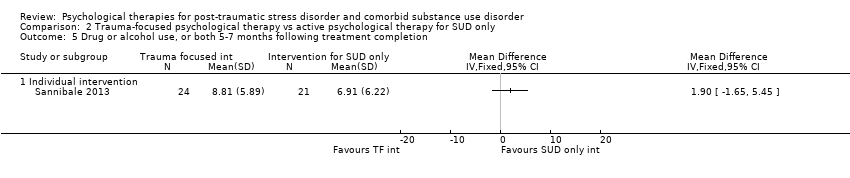
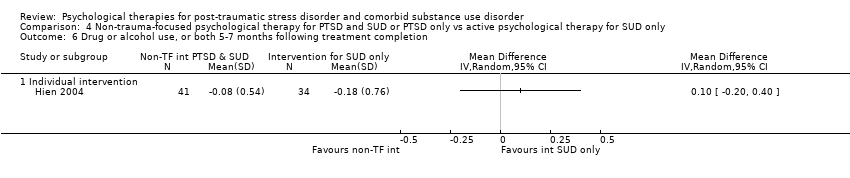
| 7 Drug or alcohol use, or both 5‐7 months following treatment completion Show forest plot | 4 | 572 | Std. Mean Difference (IV, Random, 95% CI) | ‐0.06 [‐0.23, 0.11] |
|
| 7.1 Group intervention | 4 | 572 | Std. Mean Difference (IV, Random, 95% CI) | ‐0.06 [‐0.23, 0.11] |
| 8 Drug or alcohol use, or both 12 months following treatment completion Show forest plot | 2 | 528 | Std. Mean Difference (IV, Random, 95% CI) | 0.02 [‐0.15, 0.20] |
|
| 8.1 Group intervention | 2 | 528 | Std. Mean Difference (IV, Random, 95% CI) | 0.02 [‐0.15, 0.20] |
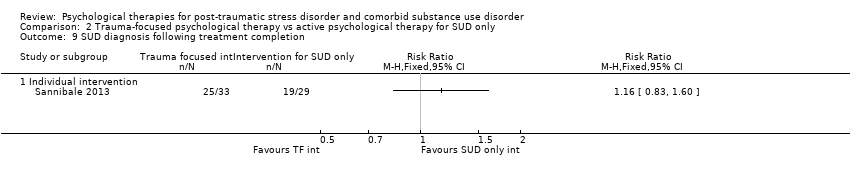
| 9 Treatment completers Show forest plot | | | Other data | No numeric data |
|
| 9.1 Individual intervention | | | Other data | No numeric data |
| 9.2 Group intervention | | | Other data | No numeric data |
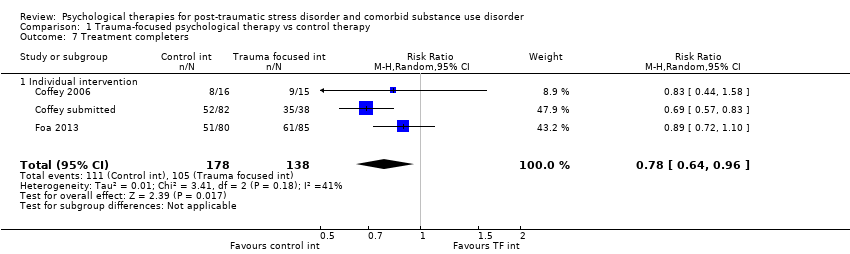
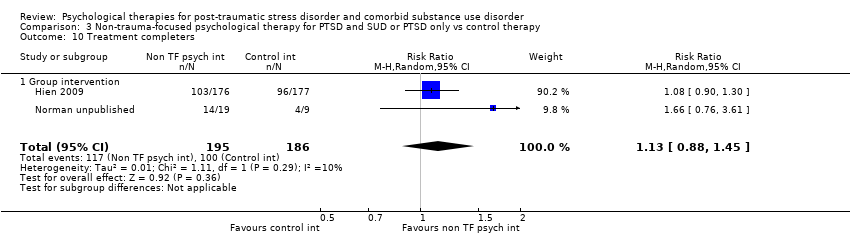
| 10 Treatment completers Show forest plot | 2 | 381 | Risk Ratio (M‐H, Random, 95% CI) | 1.13 [0.88, 1.45] |
|
| 10.1 Group intervention | 2 | 381 | Risk Ratio (M‐H, Random, 95% CI) | 1.13 [0.88, 1.45] |
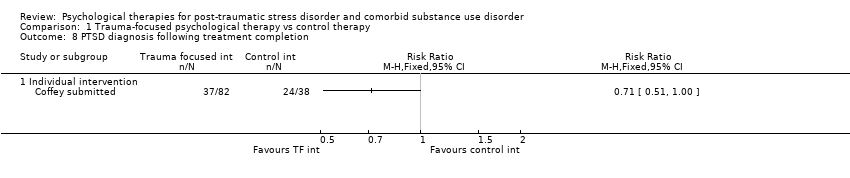
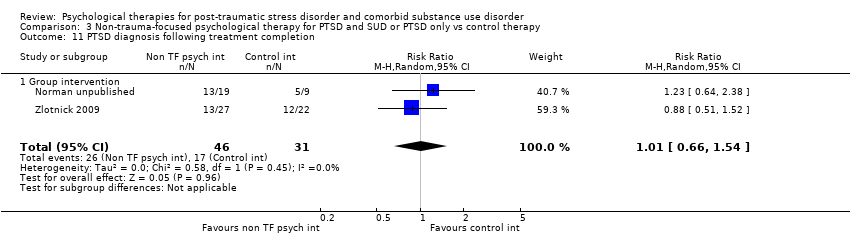
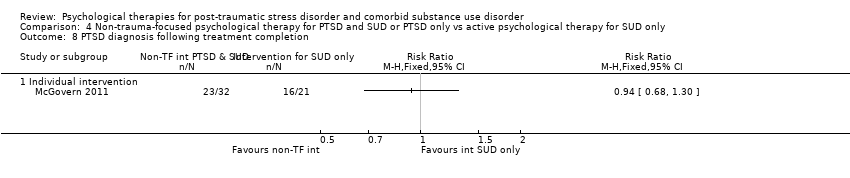
| 11 PTSD diagnosis following treatment completion Show forest plot | 2 | 77 | Risk Ratio (M‐H, Random, 95% CI) | 1.01 [0.66, 1.54] |
|
| 11.1 Group intervention | 2 | 77 | Risk Ratio (M‐H, Random, 95% CI) | 1.01 [0.66, 1.54] |
| 12 Adverse events Show forest plot | | | Other data | No numeric data |
|
| 12.1 Group intervention | | | Other data | No numeric data |
| 13 Study‐related adverse events Show forest plot | 1 | | Risk Ratio (M‐H, Fixed, 95% CI) | Totals not selected |
|
| 13.1 Group intervention | 1 | | Risk Ratio (M‐H, Fixed, 95% CI) | 0.0 [0.0, 0.0] |
| 14 Mean number of sessions attended for intervention group Show forest plot | | | Other data | No numeric data |
|
| 14.1 Group intervention | | | Other data | No numeric data |
| 15 Mean number of sessions attended Show forest plot | 2 | 381 | Std. Mean Difference (IV, Random, 95% CI) | 0.10 [‐0.59, 0.79] |
|
| 15.1 Group intervention | 2 | 381 | Std. Mean Difference (IV, Random, 95% CI) | 0.10 [‐0.59, 0.79] |
| 16 Sensitivity analysis: PTSD severity 5‐7 months following treatment completion Show forest plot | 3 | | Std. Mean Difference (IV, Random, 95% CI) | Subtotals only |
|
| 16.1 Group intervention | 3 | 425 | Std. Mean Difference (IV, Random, 95% CI) | ‐0.12 [‐0.34, 0.10] |
| 17 Sensitivity analysis: PTSD severity 12 months following treatment completion Show forest plot | 1 | 353 | Std. Mean Difference (IV, Random, 95% CI) | ‐0.04 [‐0.25, 0.17] |
|
| 17.1 Group intervention | 1 | 353 | Std. Mean Difference (IV, Random, 95% CI) | ‐0.04 [‐0.25, 0.17] |
| 18 Sensitivity analysis: drug or alcohol use, or both 5‐7 months following treatment completion Show forest plot | 3 | 425 | Std. Mean Difference (IV, Random, 95% CI) | ‐0.11 [‐0.30, 0.08] |
|
| 18.1 Group intervention | 3 | 425 | Std. Mean Difference (IV, Random, 95% CI) | ‐0.11 [‐0.30, 0.08] |
| 19 Sensitivity analysis: drug or alcohol use, or both 12 months following treatment completion Show forest plot | 1 | 353 | Std. Mean Difference (IV, Random, 95% CI) | 0.0 [‐0.21, 0.21] |
|
| 19.1 Group intervention | 1 | 353 | Std. Mean Difference (IV, Random, 95% CI) | 0.0 [‐0.21, 0.21] |