اثر مواد ضد‐عفونی کننده پوست در کاهش عفونتهای ناشی از کاتتر ورید مرکزی
چکیده
پیشینه
کاتتر ورید مرکزی (central venous catheter; CVC) دستگاهی است که در بسیاری از شرایط، از جمله نظارت بر شاخصهای همودینامیک و تزریق داروهای داخل‐وریدی، مایعات، محصولات خون و تغذیه تزریقی مورد استفاده قرار میگیرد. با این حال، به عنوان یک جسم خارجی، مستعد حمله میکرو‐ارگانیسمها است، که منجر به عفونت جریان خون (blood stream infection; BSI) ناشی از کاتتر شده و بهنوبهخود، مورتالیتی، موربیدیتی و هزینههای مراقبتهای سلامت را افزایش میدهد.
اهداف
بررسی اثرات مواد ضد‐عفونی کننده پوست به عنوان بخشی از مراقبت از CVC برای کاهش BSIهای مرتبط با کاتتر، کلونیزاسیون کاتتر (catheter colonisation)، مورتالیتی و موربیدیتیهای بیمار.
روشهای جستوجو
در می 2016 در منابع زیر جستوجو کردیم: پایگاه ثبت تخصصی گروه زخمها در کاکرین؛ پایگاه مرکزی ثبت کارآزماییهای کنترل شده کاکرین (CENTRAL) (کتابخانه کاکرین)؛ Ovid MEDLINE (شامل In‐Process & Other Non‐Indexed Citations و Epub Ahead of Print)؛ OVID EMBASE و EBSCO CINAHL Plus. همچنین پایگاههای ثبت کارآزمایی را برای یافتن مطالعات در حال انجام و منتشر نشده جستوجو کردیم. هیچ محدودیتی از نظر زبان نگارش، تاریخ انتشار یا شرایط مطالعه وجود نداشت.
معیارهای انتخاب
کارآزماییهای تصادفیسازی و کنترلشدهای (RCT ؛Randomised Controlled Trials) را وارد کردیم که انواع مواد ضد‐عفونی کننده پوست را بهتنهایی یا به صورت ترکیبی ارزیابی کرده و با یک یا چند نوع ماده ضد‐عفونی کننده دیگر پوست، دارونما (placebo) یا عدم استفاده از مواد ضدعفونی کننده پوست در بیماران دارای CVC در محل مقایسه کردند.
گردآوری و تجزیهوتحلیل دادهها
دو نویسنده به طور مستقل مطالعات را برای واجد شرایط بودن ارزیابی کرده، دادهها را استخراج کرده و خطر سوگیری (bias) را ارزیابی کردند. نتایج خود را از نظر خطر نسبی (RR)، کاهش خطر مطلق (absolute risk reduction; ARR) و تعداد افراد مورد نیاز به درمان برای رسیدن به یک پیامد مفید بیشتر (number need to treat for an additional beneficial outcome; NNTB) برای دادههای دو‐حالتی، و تفاوت میانگین (MD) برای دادههای پیوسته، با 95% فاصله اطمینان (CI) بیان کردیم.
نتایج اصلی
سیزده مطالعه برای ورود به مطالعه واجد شرایط بودند، اما فقط از دادههای 12 مطالعه استفاده شد که در مجموع 3446 مورد CVC ارزیابی شد. تعداد کل شرکتکنندگانی که وارد کردند، مشخص نبود، زیرا برخی مطالعات چنین اطلاعاتی را ارائه نکردند. شرکتکنندگان عمدتا بزرگسالان بستری در بخش مراقبتهای ویژه، بخشهای سرطان خون یا بخشهای عمومی بودند. اغلب مطالعات، اثر مواد ضد‐عفونی کننده پوست را پیش از جاگذاری و به طور منظم پس از آن، در طول دوره قرارگیری CVC، هر 24 ساعت تا هر 72 ساعت ارزیابی کردند. کیفیت روششناسی مطالعات وارد شده به دلیل تنوع گسترده در خطر سوگیری آنها، مختلط بود. بیشتر کارآزماییها، شرکتکنندگان یا پرسنل را به اندازه کافی کورسازی (blind) نکردند، و چهار مورد از 12 مطالعه در معرض خطر بالای سوگیری برای دادههای ناقص پیامد بودند.
سه مطالعه، انواع مواد ضد‐عفونی کننده را با عدم استفاده از آنها مقایسه کردند. شواهد بارزی مبتنی بر وجود تفاوت در تمام پیامدهای بررسی شده، از جمله BSI ناشی از کاتتر، عفونت خونی (septicaemia)، کلونیزاسیون کاتتر و تعداد بیماران نیازمند به دریافت آنتیبیوتیکهای سیستمیک برای هر یک از سه مقایسه شامل سه نوع مختلف از مواد ضد‐عفونی کننده (پوویدون‐آیوداین آبی، محلول کلرهگزیدین آبی و الکل در مقایسه با عدم استفاده از آنها)، وجود نداشت. با این حال، با توجه به آنالیزهایی با توان پائین و وجود شواهدی با کیفیت بسیار پائین در تمامی برآوردها، عدم‐قطعیت زیادی وجود داشت. چندین مقایسه سر‐به‐سر بین انواع مختلف مواد آنتیسپتیک پوست، با ترکیبهای متفاوت از ماده فعال و محلولهای اصلی به دست آمد. شایعترین مقایسه، محلول کلرهگزیدین در مقابل محلول پوویدون‐آیوداین (با هر پایهای) بود. شواهدی با کیفیت بسیار پائین (به علت خطر سوگیری و عدم‐دقت) نشان داد کلرهگزیدین در مقایسه با پوویدون‐آیوداین میتواند عفونت جریان خون مرتبط با کاتتر را کاهش دهد (RR: 0.64؛ 95% CI؛ 0.41 تا 0.99؛ ARR: 2.30%؛ 95% CI؛ 0.06 تا 3.70%). این شواهد از چهار مطالعه شامل 1436 کاتتر به دست آمد. هیچکدام از مقایسههای زیر‐گروهی کلرهگزیدین آبی در مقابل پوویدون‐آیوداین آبی، کلرهگزیدین الکلی در مقابل پوویدون‐آیوداین آبی و کلرهگزیدین الکلی در مقابل پوویدون‐آیوداین الکلی تفاوت بارزی را برای BSI مرتبط با کاتتر یا مورتالیتی نشان ندادند (و به طور کلی توان آماری پائینی داشتند). مورتالیتی فقط در یک مطالعه گزارش شد.
شواهدی با کیفیت بسیار پائین وجود داشت که ضد‐عفونی کردن پوست با کلرهگزیدین نسبت به پوویدون‐آیوداین میتواند کلونیزاسیون کاتتر را نیز کاهش دهد (RR: 0.68؛ 95% CI؛ 0.56 تا 0.84؛ ARR: 8%؛ 95% CI؛ 3% تا 12%؛ پنج مطالعه؛ 1533 کاتتر؛ به دلیل خطر سوگیری، غیر‐مستقیم بودن و ناهمگونی، سطح کیفیت کاهش یافت).
ارزیابیهای دیگر عوامل آنتیسپتیک پوست عموما در مطالعات کوچک و تکی صورت گرفتند که بسیاری از آنها پیامد اولیه BSI مرتبط با کاتتر را گزارش نکردند. کارآزماییها، دیگر پیامدها را مانند عفونتهای پوستی و عوارض جانبی بهطور ضعیفی گزارش کردند.
نتیجهگیریهای نویسندگان
مشخص نیست پاکسازی پوست اطراف نواحی قرار دادن CVC با آنتیسپتیک در مقایسه با عدم پاکسازی پوست، عفونت جریان خون مرتبط با کاتتر را کاهش میدهد یا خیر. پاکسازی پوست با محلول کلرهگزیدین در مقایسه با پاکسازی با پوویدون آیوداین، میتواند نرخ CRBSI و کلونیزاسیون کاتتر را کاهش دهد. این نتایج بر اساس شواهدی با کیفیت بسیار پائین به دست آمدهاند، بدان معنی که اثرات واقعی ممکن است بسیار متفاوت باشند. علاوه بر این، این نتایج ممکن است تحت تاثیر ماهیت محلول آنتیسپتیک (یعنی مبتنی بر آب یا الکل) قرار گیرند. برای ارزیابی اثربخشی و بیخطری (safety) مواد مختلف ضد‐عفونی کننده پوست در مراقبت از CVC، انجام RCTهای بیشتری مورد نیاز است؛ این مطالعات باید پیامدهای بالینی مهم را مانند سپسیس، مورتالیتی و BSI مرتبط با کاتتر اندازهگیری و گزارش کنند.
PICO
خلاصه به زبان ساده
اثر مواد ضد‐عفونی کننده پوست در کاهش عفونتهای ناشی از کاتتر ورید مرکزی
سوال مطالعه مروری
شواهدی را در مورد اینکه استفاده از درمانهای آنتیسپتیک روی پوست افراد به کاهش عفونتهای مربوط به کاتترهای ورید مرکزی (CVC) کمک میکند یا خیر، مرور کردیم.
پیشینه
کاتترهای ورید مرکزی (CVC) لولههای پلاستیکی انعطافپذیر و نازکی هستند که از طریق پوست، داخل ورید بزرگ، اغلب در بازو یا سینه، قرار داده میشوند. سپس میتوان از طریق لوله برای تجویز مایعات، دارو و تغذیه در بیماران به شدت بد‐حال استفاده کرد. با این حال، CVCها با ایجاد راهی برای انتشار میکروارگانیسمها (میکروبها) در بدن در نقطهای که کاتتر وارد میشود، خطر عفونت را به همراه دارند. به منظور تلاش برای کاهش عفونتهای ناشی از کاتتر، کارکنان مراکز مراقبت سلامت، اغلب از محلولهای آنتیسپتیک برای تمیز کردن پوست اطراف محل ورود کاتتر، هم پیش از جایگذاری کاتتر و هم در حالی که کاتتر وارد محل شده، استفاده میکنند. در این مطالعه مروری، شواهدی را از فواید و مضرات استفاده از آنتیسپتیکها روی پوست، و اثرات محلولهای مختلف آنتیسپتیک را خلاصه کردیم.
تاریخ جستوجو
بانکهای اطلاعاتی متعدد پزشکی را در می 2016 جستوجو کردیم.
ویژگیهای مطالعه
در می 2016، بانکهای اطلاعاتی پزشکی را برای پیدا کردن کارآزماییهای تصادفیسازی و کنترل شده جهت ارزیابی استفاده از مواد ضد‐عفونی کننده در افراد دارای CVC جستوجو کردیم. در این مطالعه مروری 13 مطالعه را وارد کردیم، اگر چه فقط 12 مورد برای مجموع 3446 مورد CVC، در ارائه اطلاعات همکاری کردند. شرکتکنندگان مطالعه عمدتا بزرگسالان بستری در بخشهای مراقبت ویژه یا دیگر واحدهای تخصصی بیمارستان بودند. یافتههای خود را بر حسب تعداد کاتترها گزارش کردیم، زیرا برخی از مطالعات تعداد بیماران ارزیابیشده را ارائه نکردند، و برخی از بیماران بیش از یک CVC داشتند. یک مطالعه توسط یک نهاد تحقیقاتی ملی، پنج مطالعه بهطور کامل یا قسمتی از آن توسط حداقل یک شرکت داروسازی تامین مالی شدند، و در هفت مطالعه باقیمانده، منابع مالی ذکر نشدند.
نتایج کلیدی
سه مطالعه اثر پاکسازی پوست را در مقابل عدم پاکسازی بررسی کرده و هیچ شواهد بارزی را مبنی بر وجود تفاوت در عفونتهای خون، عفونتهای کاتتر و نیاز بیمار به دریافت آنتیبیوتیک بین بیماران دو گروه بالا پیدا نکردند. محلول کلرهگزیدین در مقایسه با محلول پوویدون‐آیوداین میتواند عفونت خون مرتبط با کاتتر را کاهش دهد (کاهش نرخ عفونت از 64 مورد در هر 1000 بیمار دارای CVC با پوویدون آیوداین به 41 مورد عفونت در هر 1000 بیمار با کلرهگزیدین). این به معنای نیاز به درمان 44 نفر برای پیشگیری از بروز یک عفونت بیشتر جریان خون است. محلول کلرهگزیدین (در مقایسه با محلول پوویدون آیوداین) ممکن است حضور ارگانیسمهای عفونتزا را داخل کاتتر کاهش دهد (از 240 مورد کاتتر آلوده در هر 1000 نفر به 189 کاتتر آلوده در هر 1000 نفر کاهش یافت). مشخص نیست که پاکسازی پوست با آنتیسپتیک بر نرخ مورتالیتی تاثیر میگذارد یا خیر، زیرا فقط یک مطالعه این پیامد را گزارش کرد و اگرچه نرخ مرگومیر مشابهی با پوویدون آیوداین و کلرهگزیدین دیده شد، تعداد کم آنها به این معنی است که نمیتوان وجود تفاوت را رد کرد.
کیفیت شواهد
به دلیل نقص در نحوه طراحی مطالعات، حجم نمونه کوچک مطالعات، ناهمگونی نتایج بین مطالعات وارد شده و ماهیت پیامدهای گزارش شده، کیفیت کلی شواهد ضعیف بود. این معایب، اطمینان ما را به نتایج حاصل از مطالعات کاهش داد. این بدان معناست که نمیتوانیم مطمئن باشیم تمیز کردن پوست اطراف محلهای ورود CVC با آنتیسپتیک در مقایسه با عدم انجام پاکسازی پوست، عفونت جریان خون ناشی از کاتتر و دیگر اثرات مضر را، مانند عفونت کلی خون و مورتالیتی، کاهش میدهد یا خیر. پاکسازی با محلول کلرهگزیدین ممکن است موثرتر از پوویدون آیوداین باشد، اما کیفیت شواهد بسیار پائین بود.
Authors' conclusions
Summary of findings
| Chlorhexidine compared to povidone‐iodine for patients with a central venous catheter | |||||
| Patient or population: patients with a central venous catheter | |||||
| Outcomes | Illustrative comparative risks* (95% CI) | Relative effect | No. of Participants | Quality of the evidence | |
| Assumed risk | Corresponding risk | ||||
| Povidone‐iodine | Chlorhexidine | ||||
| Catheter‐related BSI ‐ overall comparison between chlorhexidine and povidone‐iodine (during in‐patient stay) | Study population | RR 0.64 | 1436 | ⊕⊝⊝⊝ | |
| 64 per 1000 | 41 per 1000 | ||||
| Moderatea | |||||
| 46 per 1000 | 29 per 1000 | ||||
| Catheter‐related BSI ‐ subgroup: chlorhexidine in aqueous solution versus povidone‐iodine in aqueous solution | Study population | RR 0.64 | 452 | ⊕⊝⊝⊝ | |
| 86 per 1000 | 55 per 1000 | ||||
| Moderate | |||||
| 84 per 1000 | 54 per 1000 | ||||
| Catheter‐related BSI ‐ subgroup: chlorhexidine in alcohol versus povidone‐iodine in aqueous solution | Study population | RR 0.77 | 503 | ⊕⊝⊝⊝ | |
| 70 per 1000 | 54 per 1000 | ||||
| Moderate | |||||
| 69 per 1000 | 53 per 1000 | ||||
| Catheter‐related BSI ‐ subgroup: chlorhexidine in alcohol versus povidone‐iodine in alcohol | Study population | RR 0.4 | 481 | ⊕⊕⊕⊝ | |
| 42 per 1000 | 17 per 1000 | ||||
| Moderate | |||||
| 42 per 1000 | 17 per 1000 | ||||
| Primary BSI or clinical sepsis | No studies under this comparison assessed this outcome. | ||||
| All‐cause mortality ‐ Chlorhexidine in aqueous solution versus povidone‐iodine in aqueous solution | Study population | RR 1.15 | 213 | ⊕⊕⊝⊝ | |
| 236 per 1000 | 271 per 1000 | ||||
| Moderate | |||||
| 236 per 1000 | 271 per 1000 | ||||
| All‐cause mortality ‐ Chlorhexidine in alcohol versus povidone‐iodine in aqueous solution | Study population | RR 0.8 | 222 | ⊕⊕⊝⊝ | |
| 236 per 1000 | 189 per 1000 | ||||
| Moderate | |||||
| 236 per 1000 | 189 per 1000 | ||||
| Mortality attributable the CVC‐related infections. | No studies under this comparison assessed this outcome. | ||||
| *The basis for the assumed risk (e.g. the median control group risk across studies) is provided in footnotes. The corresponding risk (and its 95% confidence interval) is based on the assumed risk in the comparison group and the relative effect of the intervention (and its 95% CI). | |||||
| GRADE Working Group grades of evidence | |||||
| a'Moderate risk' was calculated from the median control event rate for each outcome. | |||||
Background
Please refer to Appendix 1 for a glossary of terms (lay definitions in the context of this review only).
Description of the condition
The concept of central venous catheterisation was first introduced in the early part of the last century by Bleichroder, Forssmann, Duffy and Authaniac, after Bleichroder reportedly inserted the first central venous catheter (CVC) in a human in 1905 (Puri 2009). In the past four decades, the use of the CVC has become important in the management of many critically and chronically ill patients. Insertion of a CVC provides secure vascular access for the administration of intravenous medications, fluids, blood products and parenteral nutrition. It also serves as an essential conduit for blood sampling, haemodynamic monitoring, renal replacement therapy and plasmapheresis.
It is estimated that 5 million CVCs are inserted every year in the United States and 200,000 each year in the UK (Worthington 2005). One of the major problems associated with the use of CVCs is colonisation by micro‐organisms that could result in local or systemic infection. Research has shown that infectious complications associated with CVCs cause significant morbidity and mortality, with considerable costs to the healthcare system (CDC 2011; Cicalini 2004). In the USA, approximately 80,000 reported cases of CVC‐associated blood stream infections (BSIs) occur in intensive care units (ICUs) every year; this number more than triples when considering the entire hospital system (CDC 2011). Although the exact mortality attributable to these BSIs remains unclear, reports have cited figures up to 35% (CDC 2011). The associated cost incurred due to BSIs is considerable, including costs of additional medication, nursing time and increased length of hospital stay. The total annual cost of caring for patients with CVC‐associated BSIs in the USA alone is estimated to range anywhere from USD 296 million to USD 2.3 billion (CDC 2011).
Micro‐organisms colonise the CVCs and gain access to the blood stream of the patients via three main routes (CDC 2011; Cicalini 2004; Pagani 2008):
-
External surface of CVC through contaminated insertion site
-
Internal surface of CVC through contamination of catheter hubs, injection ports and lines; usually by the hands of healthcare workers or patients
-
Contaminated intravenous drugs, infusates and nutritional preparations.
For short‐term CVCs, investigators have proposed colonisation from the skin to the external surface of the CVCs as the major route of infection, while for long‐term CVCs, the internal surface route becomes increasingly important, as the micro‐organisms gain access to the internal surface as a result of contamination from repeated handling of the CVCs (Cicalini 2004).
Description of the intervention
A number of evidence‐based guidelines have been developed in recent years aimed at reducing CVC‐associated BSIs. Important measures recommended by two of the major guidelines include the following (CDC 2011; Pratt 2007):
-
Staff education
-
Quality assurance: systematically monitoring compliance to the established guidelines and evaluating issues relating to compliance
-
Hand hygiene
-
The use of aseptic technique during insertion and use of CVCs
-
Effective skin antisepsis at the insertion site
-
Maximum sterile barrier precautions (i.e. wearing sterile gloves, sterile gown, a cap and a mask and using a large sterile drape)
-
Use of subclavian vein as the preferred site of insertion rather than the internal jugular or femoral veins, as this has been shown to reduce infectious, mechanical and thrombotic complications (Hamilton 2007)
-
The use of antimicrobial or antiseptic impregnated CVCs.
Effective skin antisepsis throughout the in‐dwelling period of the catheter may prevent microbial contamination of the insertion site, thus delaying or reducing the risk of catheter colonisation and the subsequent development of infective complications. Given that insertion site contamination leads to colonisation on the external catheter surface and infection, one would expect skin antisepsis to have some impact on reducing BSIs, especially with short‐term CVCs.
Pioneering work by Pasteur, Semmelweis and Lister laid the foundation for the practice of antisepsis in medicine (Bankston 2005; Bynum 2008; Nuland 2003). Antisepsis is defined as the prevention of infection by inhibiting the growth of causative micro‐organisms, while antiseptics are antimicrobial substances capable of producing antisepsis (Taber 2016). An ideal antiseptic agent would need to be immediately and persistently effective when applied to living tissues, including when a small amount of blood is present, and to be effective against all pathogenic bacteria, viruses, fungi, protozoa, tubercle bacilli and bacterial spores (Taber 2016). At the same time it should be non‐toxic to living tissue, hypoallergenic and safe to use repetitively on all parts of the body (Edwards 2008; Hardin 1997). Human skin naturally has abundant microbiological flora which include resident (i.e. colonising) flora and transient (i.e. contaminating or non‐colonising) flora. Resident flora tend to inhabit deeper layers of the skin and therefore are not readily removed by the mechanical action of washing with soap and water. In contrast, transient flora are not consistently present in most people and can usually be removed by mechanical action (Larson 1995; Ryan 2004). Both resident and transient flora are implicated in the pathogenesis of CVC‐associated infections, thus effective skin antisepsis may require not only mechanical removal but also the chemical killing and inhibition of both the resident and transient flora of the human skin (Edwards 2008).
How the intervention might work
There is a large number of antiseptic agents available and three are considered particularly important in skin antisepsis: chlorhexidine, iodine and alcohol. All three agents have a broad spectrum of activity against gram positive, gram negative, aerobic and anaerobic bacteria, enveloped viruses such as human immunodeficiency virus (HIV), herpes simplex virus (HSV) and cytomegalovirus (CMV), as well as fungi, although they differ in their effects against tubercle bacilli and bacterial spores. We summarise their characteristics here:
-
Chlorhexidine, which is available mostly as chlorhexidine gluconate and less commonly as chlorhexidine acetate or hydrochloride (Martindale 2016), exercises its antimicrobial action chiefly by causing a disruption of microbial cell membranes. Its activity against tubercle bacilli and bacterial spores is limited (Larson 1995; Russell 1986). Chlorhexidine gluconate has an intermediate onset of effect, which is reported to be minimally affected by organic materials such as blood, pus or sputum. It also appears to cause relatively low level of skin irritation and has little allergenic potential. However, its activity is pH dependent, and its effect is known to be compromised by many substances, including those used in natural soaps (Larson 1995; Martindale 2016).
-
Iodine and iodophors exert their antimicrobial effects through chemical destruction of the microbial cell wall and cellular contents. They are effective against tubercle bacilli and bacterial spores. They kill bacteria within seconds to minutes but are rapidly inactivated in the presence of organic materials such as blood, pus or sputum. There have been reports of frequent skin irritation, allergic reactions and systemic toxicity in susceptible individuals (Edwards 2008; Hardin 1997; Larson 1995).
-
Alcohols are available as either ethyl (ethanol), normal‐propyl (n‐propyl) or isopropyl alcohol for use as antiseptic agents. Alcohols derive their antimicrobial activity from denaturation of cellular proteins. They are effective against tubercle bacilli but less so against bacterial spores. Alcohols have a rapid onset of action, but they lose their antimicrobial effects very quickly. Importantly for this review, they are often combined with other agents such as chlorhexidine gluconate or iodine to achieve optimal antisepsis. Alcohols are also poor cleaning agents, and their use is usually not recommended when significant amounts of blood or dirt are present. There have been reports of excessive skin drying and discomfort following application (Larson 1995; Martindale 2016).
Other antiseptic agents include the following (Larson 1995; Martindale 2016):
-
Triclosan
-
Hexachlorophene
-
Chloroxylenol
-
Quarternary ammonium compounds such as cetrimide and benzalkonium chloride
-
Octenidine dihydrochloride
-
Phenolic or carbolic acid compounds
-
Hydrogen peroxide.
Why it is important to do this review
A meta‐analysis showed that using chlorhexidine gluconate for catheter site care reduced the risk of catheter‐related BSIs by 49% when compared with povidone iodine (Chaiyakunapruk 2002). However, the meta‐analysis only evaluated chlorhexidine gluconate and povidone‐iodine as skin antiseptics, and some studies within it assessed a combination of arterial catheters as well as central and peripheral venous catheters. Some uncertainties remain regarding the best agent, or combination of agents, for use as skin antisepsis for CVCs alone; the optimal interval between application of antiseptics as well as the best method for applying these agents. Examination of the latest National Healthcare Safety Network report, which superseded the National Nosocomial Infections Surveillance (NNIS 2004), revealed that the CVC‐associated BSI rate in different ICUs in the USA ranges from 1.0 to 5.6 BSI per 1000 CVC‐days (Edwards 2008). These figures compare favourably with the previous NNIS figures of 2.7 to 7.4 BSI per 1000 CVC‐days (NNIS 2004). The observed improvement in CVC‐associated BSI rate is probably multifactorial in nature, but the recent educational and awareness campaigns about nosocomial infections and the implementation of infection control measures in many hospitals in the USA may have played a role. The impact of different skin antisepsis regimens in the presence of comprehensive infection control measures and lower baseline BSI rates remains unclear. Furthermore, the availability of new studies using different skin antiseptic preparations and the continuing emergence of drug resistant micro‐organisms necessitates a systematic review to aid clinical decision‐making and to highlight future research needs (O'Grady 2002; Parienti 2004; Pratt 2007).
Objectives
To assess the effects of skin antisepsis around central venous catheter sites, on rates of catheter‐related BSIs, catheter colonisation, and patient mortality and morbidities.
Methods
Criteria for considering studies for this review
Types of studies
We included randomised controlled trials (RCTs) and cluster RCTs comparing one skin antiseptic regimen (a single agent or a combination of agents) with another regimen (a single agent or a combination of agents, placebo or no antisepsis). We excluded cross‐over studies due to the possible contaminating effect of one intervention over another. We also excluded studies assessing CVCs for haemodialysis, as this is covered by another Cochrane review (McCann 2010).
Types of participants
We included studies involving adults and children cared for in a hospital setting (in adult or paediatric wards or ICUs) with any underlying illness and a CVC inserted for any reason during the study period. Studies that enrolled a patient more than once were acceptable provided that the enrolment took place in separate hospital admissions. We excluded studies conducted in neonatal settings, for example in a neonatal intensive care unit (NICU), as the types of catheters used, the insertion site and techniques, the possible complications as well as the risk factors for sepsis are different compared with those in older children and adults (Trieschmann 2007).
Types of interventions
Intervention
The use of any skin antiseptic regimen (a single agent or a combination of agents) used for cleansing the skin around CVC insertion sites.
Comparisons
A different skin antisepsis regimen (a single agent or a combination of agents), placebo or no skin antisepsis for CVC insertion sites.
We required that the selection, insertion, use, maintenance and removal of CVCs in the intervention and comparison groups followed the standard protocol of the hospital setting in the study. The skin antisepsis regimen had to be the only systematic difference between comparison groups (i.e., not catheter material or concurrent CVC‐related antiseptic measures).
We accepted the duration of the studies as variously specified by the authors. We did not place any limit on the minimum and maximum duration of the follow‐up period for each study.
Types of outcome measures
Primary outcomes
Number of patients with CVC‐related blood stream infection (BSI)
-
Catheter‐related BSI confirmed by laboratory
-
Primary BSI or clinical sepsis.
We present the criteria for the diagnosis of CVC‐related BSI in Appendix 2 (Pagani 2008).
Mortality
-
All‐cause mortality
-
Mortality attributable to CVC‐related infections.
We included suitable studies using other definitions of CVC‐related and associated infections, provided the authors justified their definitions with valid sources.
Secondary outcomes
-
Number of patients with insertion site infection, either microbiologically documented (i.e. exudates at catheter insertion site yield a micro‐organism with or without concomitant BSI) or clinically documented (i.e. erythema or induration within 2 cm of the catheter insertion site in the absence of associated BSI and without accompanying purulence) (Pagani 2008)
-
Number of patients with catheter colonisation, as defined by the study authors using well‐accepted definitions such as a significant growth of micro‐organism (more than 15 colony‐forming units (CFU)) from the catheter tip, subcutaneous segment or catheter hub in the absence of clinical signs of infection (Pagani 2008)
-
Number of drug‐resistant organisms from cultures, including insertion site cultures, catheter cultures and blood cultures
-
Number of adverse events associated with the use of antiseptic agents, including skin irritation, contact dermatitis, systemic allergic reaction and anaphylaxis
-
Antibiotic usage during hospitalisation
-
Length of hospitalisation, either ICU stay or overall hospital stay
-
Cost of care, including cost of the antiseptic agent and the cost of treating any adverse effects
-
Quality of life, measured using validated tools.
Search methods for identification of studies
Electronic searches
We searched the following databases for relevant RCTs:
-
The Cochrane Wounds Specialised Register (searched 23 May 2016);
-
The Cochrane Central Register of Controlled Trials (CENTRAL) (The Cochrane Library) (2016, Issue 4);
-
Ovid MEDLINE (including In‐Process & Other Non‐Indexed Citations and Epub Ahead of Print) (1946 to 23 May 2016);
-
Ovid EMBASE (1974 to 23 May 2016);
-
EBSCO CINAHL Plus (1937 to 23 May 2016).
We used the search strategy in Appendix 3 to search the Cochrane Central Register of Controlled Trials (CENTRAL). We adapted this strategy for Ovid MEDLINE, Ovid EMBASE and EBSCO CINAHL Plus which can be found in Appendix 4, Appendix 5 and Appendix 6, respectively. We combined the MEDLINE search with the Cochrane Highly Sensitive Search Strategy for identifying randomised trials in MEDLINE: sensitivity‐ and precision‐maximising version (2011 revision) (Lefebvre 2011). We combined the EMBASE search with the Ovid EMBASE filter developed by the UK Cochrane Centre (Lefebvre 2011). We combined the CINAHL searches with the trial filters developed by the Scottish Intercollegiate Guidelines Network (SIGN 2015).
We searched the following trial registries for details of ongoing clinical trials and unpublished studies.
-
ClinicalTrials.gov (http://www.clinicaltrials.gov/).
-
WHO International Clinical Trials Registry Platform (http://apps.who.int/trialsearch/Default.aspx).
-
EU Clinical Trials Register (https://www.clinicaltrialsregister.eu/).
Searching other resources
We checked for further reports of eligible studies using the citation lists of papers identified by the above strategies. We also scanned references lists of relevant Cochrane reviews and guidelines and contacted experts in the field.
Data collection and analysis
Selection of studies
Two review authors (NML, EOR) independently assessed the first round of search results for potentially relevant studies. We retrieved in full those that appeared to meet the inclusion criteria, or where this could not be determined, for further assessment. Two review authors independently assessed the full papers retrieved, resolving any disagreement with input from a third review author (NC). We included the studies if they fulfilled the criteria for inclusion as outlined above and if the amount of information contained in the article enabled the extraction of outcome data for meta‐analysis.
We screened publications for duplicate reports of the same trial and contacted the trial authors for clarification when necessary. If we confirmed a duplicate publication, we identified a primary reference, but extracted unique data from all versions.
Data extraction and management
Two pairs of review authors (NAL and NML, PL and EOR) independently extracted and coded all data for each included study using a pro forma designed specifically for this review. Each pair was responsible for half of the total number of included studies. We extracted the following information on each study: study design, participants, setting, sample size, nature of intervention, comparison, outcomes, methods (unit of allocation and analysis) and results. We screened for duplicate entries of patients, where possible, by matching the initial number of patients recruited against the total number along each step in the conduct of the study.
We found a discrepancy between the number of catheter and the number of patients in most studies. This was due to multiple catheters being inserted in some patients who were enrolled after each insertion. We were unable to limit our analysis to one catheter per participant as none of the studies provided the data in this format.
We resolved any disagreement among the review authors by discussion and formulation of a consensus acceptable to all members of the review team.
Assessment of risk of bias in included studies
Two authors (NAL and NML) independently assessed each included study using the Cochrane tool for 'Risk of bias' assessment (Higgins 2011a). This tool addresses six specific domains.
-
Sequence generation
-
Allocation concealment
-
Blinding
-
Incomplete outcome data
-
Selective outcome reporting
-
Other issues (e.g. extreme baseline imbalance, design‐specific risks of bias such as recruitment in cluster for cluster‐RCT, block randomisation of unblinded trials or fraud).
We present detailed criteria on which we based our judgement in Appendix 7. We assessed blinding and completeness of outcome data for each outcome separately. We completed a 'Risk of bias' table for each eligible study. We resolved any disagreement among the review authors by discussion to achieve a consensus. We presented an overall assessment of the risk of bias using a 'Risk of bias summary figure', which presented all of the judgement in a cross‐tabulation of study by entry. This display of internal validity indicated the weight the reader may give to the results of each study.
In addition, we assessed whether trials followed a standard protocol for all groups under study with regard to the insertion, use, maintenance and removal of CVC, and regarding the concurrent use of other antiseptic measures such as antimicrobial impregnated CVCs, antiseptic‐soaked dressing and prophylactic antibiotics. We referred to the study protocol, where available, for further details if necessary. We made relevant remarks in the corresponding 'Risk of bias' table for each study if there were significant concerns in this aspect.
Measures of treatment effect
For dichotomous data, we used risk ratio (RR) to measure outcome estimates of the same scale. We estimated the number needed to treat for an additional beneficial outcome (NNTB) from the pooled risk difference (RD) using an online NNTB calculator (http://nntonline.net/visualrx/). For continuous data, we pooled measures at a similar time point using the mean difference (MD). Two studies reported the measure of variance as a standard error (SE) or 95% confidence intervals (CI) (Humar 2000; Dettenkofer 2010). We obtained standard deviations (SD) for the above‐mentioned studies from the SE using the formula SD = SE x square root of the number of participants, and from the 95% CI using the formula SD = square root of the number of participants x (upper limit or CI − lower limit of CI)/3.92.
Unit of analysis issues
One potential unit of analysis issue that we had anticipated was the issue that arose as a result of the studies using catheters, rather than patients, as the unit of analysis in catheter‐related outcomes such as catheter‐related BSI and catheter colonisation. Ideally, if the study performed randomisation and analysis based on the participants, and each participant had only one catheter evaluated, adjustment for clustering would not have been necessary. However, if a study included multiple catheters per patient and clearly stated so, we would have assessed whether the authors had undertaken statistical adjustment to account for the effects of clustering by using appropriate analysis models such as the 'generalised estimating equation' (GEE) model (Higgins 2011b). If investigators had made adjustments for clustering, we would have combined the study with other studies in the meta‐analysis. If they had not, or if it was unclear whether there were adjustments made, we would have assessed the number of catheters as well as participants in the study. If the studies had also reported the number of participants with events and the total number analysed, we would have only reported the outcomes using the participants, rather than catheters as the unit of analysis. However, if the study did not provide participant‐level data, we would not have been able to avoid the unit of analysis issues. We would have acknowledged this as a major limitation of the review in our discussion and undertaken sensitivity analysis to assess the pooled results after excluding studies with no adjustments for clustering.
However, in this review, none of the included studies provided participant‐level data for catheter‐specific outcomes. As a result, we could not adjust for the unit of analysis issue, nor could we perform sensitivity analysis to assess the results with and without studies with unadjusted unit of analysis issues. We have acknowledged this in our discussion, as planned.
Another possible unit of analysis issue that could have arisen was the effects of clustering that arose in cluster‐RCTs in which randomisation was performed at the unit, rather than the participant level. However, we did not include any cluster‐RCTs in this review.
Had we identified an eligible cluster‐RCT (e.g. trial in which the assignment to intervention or control group was made at the level of the unit or ward rather than the individual), we would have addressed the possible unit of analysis issues as follows.
First, we would have assessed whether the authors had made adjustments for the effects of clustering to account for non‐independence among the participants by using appropriate analysis models such as the 'generalised estimating equation' (GEE) model (Higgins 2011b).
If investigators did not make adjustments for the effects of clustering, we would have performed adjustment by multiplying the SEs of the final effect estimates by the square root of the 'design effect', represented by the formula '1 + (m − 1) x ICC', where m is the average cluster size (number of participants per cluster) and ICC is the intracluster correlation. We would have determined the average cluster size m by dividing the total number of participants by the total number of clusters. We would have used an assumed ICC of 0.10, which has been proposed to be a realistic general estimate based on previous similar studies (Campbell 2001). We would also have combined the adjusted final effect estimates from each trial with their SEs in our meta‐analysis using the generic inverse‐variance methods, as stated in the Cochrane Handbook for Systematic Reviews of Interventions (Higgins 2011b).
If it were impossible to find out whether trialists made adjustments on the effect of clustering, we would still have included the studies concerned in our meta‐analysis using the effect estimates reported by the authors, and performed sensitivity analyses to assess how excluding those studies would affect the overall pooled estimates.
Dealing with missing data
We assessed whether there was a high attrition rate and whether an intention‐to‐treat analysis was performed. To assess whether the dropout rate was important, we inspected the absolute attrition rate and the attrition rate in relation to the event rates for the intervention and the comparison groups. If the absolute dropout rate was 20% or more, we judged the study to be at high risk of bias due to incomplete outcome data. If the dropout rate was lower than 20%, we used a 'worst‐case‐scenario' method for the primary outcomes (Guyatt 1993). For instance, for an unfavourable outcome such as catheter‐related BSI or mortality, if the results of a trial favoured the intervention group, we assumed all dropouts from the intervention group to have developed the outcome, and all dropouts from the comparison group to have not developed the outcome. We then analysed to see if such an assumption changed the direction of the results (e.g. from favouring the intervention group to favouring the comparison group). If so, we considered the dropout rate to be significant. We made the reverse assumption when a trial favoured the comparison group, or when the outcomes examined were favourable, such as survival or treatment success.
Assessment of heterogeneity
We assessed all the included studies in terms of their clinical and methodological characteristics.
-
Baseline characteristics of the participants
-
Clinical settings of the studies (e.g. intensive care units, oncology wards, renal units)
-
Co‐interventions
-
Methodological quality (as detailed in the 'Risk of bias' assessment, for example studies at high risk of bias are defined as studies with unclear or no allocation concealment, and studies where participants, caregivers or investigators are not blinded, or where blinding is unclear)
-
Nature of intervention (comparison between one skin antiseptic regimen and placebo as opposed to comparison of two active regimens)
-
Outcome assessment and unit of analysis.
We visually inspected the forest plots for any evidence of heterogeneity of treatment effects. We used the I2 statistic (Higgins 2003) to measure inconsistency in the results, with a value of 50% or greater indicating moderate to substantial statistical heterogeneity.
We found significant statistical heterogeneity in one analysis (Analysis 4.4) and provided a plausible explanation the possible reason for heterogeneity in the form of risk of attrition bias in some included studies. We decided to still provide the pooled estimate for this analysis and separated the studies based on the risk of attrition bias in our pre‐specified sensitivity analysis.
Assessment of reporting biases
We planned to screen for publication bias in our review using a funnel plot if there were more than 10 studies included in the analysis. If publication bias was implied by a significant asymmetry of the funnel plot, we would have included a statement in our results with a corresponding note of caution in our discussion. We did not generate any funnel plot in this review as there were fewer than 10 studies included in the analysis across all the comparisons and outcomes.
Data synthesis
We used Review Manager software to perform meta‐analysis of the included studies (RevMan 2014). We used a fixed‐effect model for most of our analyses, as there was no substantial clinical and statistical heterogeneity. For the outcomes with substantial clinical and statistical heterogeneity that was not satisfactorily explained or reduced by subgroup analyses, we used a random‐effects model that took into account between‐study variability within the analysis and lessened the possibility of spurious inferences of significance compared to the fixed‐effect model. We used the Mantel‐Haenszel method to analyse all the dichotomous outcomes, as we anticipated relatively frequent events for most of our outcomes. For continuous outcomes, we employed the inverse variance methods using the effect measure of mean differences. In our assessment of the effects of missing data, we compared our adjusted analysis using the best‐ and worst‐case scenarios to the completer analysis as reported by the study authors.
When there were more than two arms evaluated in a study, for example, aqueous chlorhexidine versus alcoholic chlorhexidine versus aqueous povidone‐iodine, we set up separate pairwise comparisons as subgroups under the major comparison of chlorhexidine versus povidone‐iodine, as follows: aqueous chlorhexidine versus aqueous povidone‐iodine; and alcoholic chlorhexidine versus aqueous povidone‐iodine. In so doing, we halved the total number of participants and events in the povidone‐iodine group to avoid double‐counting.
Had we identified studies that assessed cost‐effectiveness, we planned to provide only a narrative review of their findings and not directly compare costs in studies using different units of measurement, due to the complexity of analysing cost‐effectiveness if different price‐years were used.
Subgroup analysis and investigation of heterogeneity
In this review, we created subgroups of comparisons based on the solution used, for example, a subgroup for chlorhexidine in aqueous solution versus povidone iodine in aqueous solution, and another subgroup for chlorhexidine in alcohol versus povidone‐iodine in aqueous solution.
Had data been available, we would have carried out the following subgroup analyses:
-
Short term CVCs (less than 10 days) versus longer term CVCs (10 days or more)
-
CVCs with antimicrobial modifications (antimicrobial impregnation, cuffs, hubs) versus CVCs with no antimicrobial modifications
-
Studies undertaken in paediatric patients versus adult patients
-
Studies undertaken in different patient populations with different levels of care (intensive care patients, oncology patients, renal patients and patients in general medical or surgical wards)
-
Studies undertaken with co‐interventions (e.g. sepsis prevention bundle) versus studies done without co‐interventions
-
Studies that used rigorous criteria (e.g. as outlined in Pagani 2008) for determining catheter‐related infections versus studies that used more liberal criteria.
Sensitivity analysis
We performed the following sensitivity analyses.
-
Best‐ and worst‐case scenarios to assess the impact of missing data, as described in the section 'Dealing with missing data'.
-
Including and excluding studies with unclear and high risks of selection bias, namely, studies with unclear or high risk for random sequence generation, allocation concealment or both.
Had sufficient data been available, we would have performed additional sensitivity analyses to include and exclude studies with methodological issues other than selection bias, such as a lack of blinding to the participants, caregivers or investigators, or where blinding was unclear.
'Summary of findings' table
We created a 'Summary of findings' table, which displayed seven major outcomes in our review, using the web‐based GRADEpro software (http://gdt.guidelinedevelopment.org) (Schünemann 2011a). We used the eight GRADE considerations (study limitations, consistency of effect, imprecision, indirectness and publication bias, large effect, plausible confounding and dose response relationship) to assess the overall quality of the body of evidence (Schünemann 2011b). In generating the 'Summary of findings' table, we interpreted the median control group event rate for the outcome as 'moderate risk'.
Results
Description of studies
Results of the search
We identified 609 records from the initial search of the Cochrane Wounds Group Specialised Register, CENTRAL, MEDLINE, EMBASE and CINAHL. We performed additional searches from relevant published studies and identified two further studies that appeared to be relevant. After removing duplicates, there were 574 records. Of these, 107 articles appeared to be relevant after we inspected the titles. We evaluated the abstracts and if necessary, the full text of the articles, excluding 84 of the 107 records, including one duplicate publication of another excluded study. Of the remaining 23 articles, one was an ongoing study, and we could not fully assess six as we are still awaiting their full texts or further information from the authors. Ultimately, 16 articles describing 13 studies were available and met our inclusion criteria. Among these 16 articles, three were additional publications relating to three included studies. The flow diagram of the studies from the initial search to the meta‐analysis is shown in Figure 1. We describe all the included studies in the Characteristics of included studies table and note the reasons for excluding the others in the Characteristics of excluded studies table.

Study flow diagram.
Included studies
We included 13 RCTs, conducted in eight countries, including the USA (four studies), France (two studies), and Canada, Germany, Iran, Japan, Spain, Switzerland and Finland (1 study each). Ten trials were single centre RCTs and three were multicentre RCTs (Dettenkofer 2010; Humar 2000; Yasuda 2013) The number of patients recruited ranged from 50 (with 50 CVCs) in Sadowski 1988 to 420 (with 998 CVCs) in Vallés 2008. Mimoz 1996, Mimoz 2007 and Yasuda 2013 did not report the number of participants. Prager 1984 recruited children (n = 3) in addition to adults (in this case, n = 159), while Sadowski 1988 recruited children and adolescent from 10 weeks to 15 years of age. All studies included participants of both sexes.
Six studies recruited patients from the medical/surgical ICUs (Maki 1991; Mimoz 1996; Mimoz 2007; Vallés 2008; Tuominen 1981; Yasuda 2013), two studies recruited patients who were either pre‐ or post‐cardiac surgery (Levy 1988; Yousefshahi 2013), one study enrolled patients from a burns unit (Sadowski 1988), one from haematology and surgical units (Dettenkofer 2010) and the remaining three studies were conducted hospital‐wide, which included intensive‐care and non intensive‐care patients (Humar 2000; Langgartner 2004; Prager 1984). The average duration of catheterisation, where reported, varied from 2 to 21.1 days (range 1 to > 30 days).
There were ten basic comparisons between two or three arms in the included studies, with subgroups based on type of solution in two comparisons.
-
Comparison 1: povidone‐iodine (in aqueous solution) versus no skin antisepsis (Prager 1984).
-
Comparison 2: chlorhexidine (in aqueous solution) versus no skin antisepsis (Tuominen 1981).
-
Comparison 3: alcohol versus no skin antisepsis (Sadowski 1988).
-
Comparison 4: chlorhexidine versus povidone‐iodine (Humar 2000; Maki 1991; Mimoz 2007; Vallés 2008; Yasuda 2013). The specific subgroups for this comparison are listed below based on the different preparations of chlorhexidine and/or povidone‐iodine:
-
-
Chlorhexidine in aqueous solution versus povidone‐iodine in aqueous solution (Maki 1991; Vallés 2008).
-
Chlorhexidine in alcohol versus povidone‐iodine in aqueous solution (Humar 2000; Vallés 2008).
-
Chlorhexidine in alcohol versus povidone‐iodine in alcohol (Mimoz 2007).
-
Chlorhexidine in alcohol versus povidone‐iodine (base solution unknown) (Yasuda 2013).
-
Among the studies included in this comparison, two (Vallés 2008; Yasuda 2013) carried out three‐arm comparison. Vallés 2008 compared 2% chlorhexidine in aqueous solution (group 1), 0.5% chlorhexidine in alcohol (group 2) and 10% povidone‐iodine in aqueous solution (group 3), while Yasuda 2013 compared 1% chlorhexidine in alcohol (group 1), 0.5% chlorhexidine in alcohol (group 2) and 10% povidone‐iodine (base solution unknown). Because the authors of Yasuda 2013 did not specify the base solution for the povidone‐iodine group, we could not include this study in any subgroup in our meta‐analysis.
-
Comparison 5: chlorhexidine (aqueous) versus alcohol (Maki 1991).
-
Comparison 6: povidone‐iodine versus alcohol.
-
Comparison 7: alcohol versus octenidine in alcohol (Dettenkofer 2010).
-
Comparison 8: chlorhexidine (in alcohol) plus povidone‐iodine (in aqueous solution) versus chlorhexidine in alcohol (Langgartner 2004).
-
Comparison 9: chlorhexidine (in alcohol) plus povidone‐iodine (in aqueous solution) versus povidone‐iodine (in aqueous solution) (Langgartner 2004).
-
Comparison 10: Sanosil (hydrogen peroxide and silver) versus water as adjunct to chlorhexidine 2% aqueous bath plus povidone‐iodine 10% aqueous scrub (Yousefshahi 2013).
In terms of the timing of intervention, most studies assessed skin antisepsis prior to insertion and regularly thereafter during the in‐dwelling period of the catheters, ranging from every 24 h to every 72 h. Three studies evaluated the skin antisepsis intervention only prior to catheter insertion (Levy 1988; Yasuda 2013; Yousefshahi 2013), and one study examined skin antisepsis prior to removal of the catheters (Sadowski 1988). Maki 1991 and Mimoz 1996 evaluated central venous as well as arterial catheters, although only Maki 1991 provided a separate report of patients receiving CVCs for the outcomes of catheter‐related BSI and catheter colonisation, while only Mimoz 1996 provided CVC‐specific reports for both outcomes per 1000 catheter‐days.
The concentration of chlorhexidine‐based solution used in the studies ranged from 0.05% to 2%, with three studies using a combination of chlorhexidine plus alcohol. The concentration of povidone‐iodine was 10% in all studies except Mimoz 2007, which used 5% povidone‐iodine together with 70% ethanol. All of the studies that evaluated alcohol used 70% isopropyl alcohol except Dettenkofer 2010, which used a combination of 45% 2‐propanol or 74% ethanol with 10% 2‐propanol.
In terms of concomitant CVC‐related infection control measures, six studies clearly described the use of maximal sterile barrier precaution (Dettenkofer 2010; Humar 2000; Langgartner 2004; Mimoz 1996; Mimoz 2007; Vallés 2008), three studies described part of the maximal sterile precaution (such as the use of sterile gloves, gown or dressing) without explicitly mentioning maximal sterile precaution (Levy 1988; Maki 1991; Yousefshahi 2013), and four studies did not provide any clear description (Prager 1984; Sadowski 1988; Tuominen 1981; Yasuda 2013).
The included studies assessed almost exclusively two major outcomes, namely, catheter colonisation or equivalent (all 13 studies) and catheter‐related BSI or equivalent (8 studies). The other outcomes assessed were sepsis, skin colonisation, insertion site infection, number of patients who required antibiotics during the period of catheter use and adverse effects (only evaluated in one study). Only one study reported mortality (Vallés 2008), and no study reported cost of care or quality of life.
Control group risk of infection varied from 6.0% to 32.0% for catheter colonisation, and from 4.1% to 9.8% for catheter‐related BSI.
Of the eight studies that evaluated the primary outcome of catheter‐related BSI, all except Yasuda 2013 clearly defined this outcome in line with our definitions, detailed in Appendix 2. The exact wording varied among the studies, but the definitions involved a positive blood culture in the presence of catheter with clinical evidence of sepsis, improvement of the clinical signs following removal of the catheters or both. One study (Yousefshahi 2013) used the Centers for Disease Control and Prevention (CDC) definitions of catheter‐related BSI (CDC 2011), which were also consistent with the definitions adopted in this review. Most studies used previously validated laboratory methods to perform catheter and blood cultures, adopting microbiological definitions for colonisation and bloodstream infection that were consistent with published literature in the evaluation of catheter‐related infections, including the use of molecular subtyping. In Yasuda 2013, the published abstract did not contain the definition of catheter‐related BSI.
All studies reported catheter‐related outcomes such as catheter‐related BSI and catheter colonisation using the catheter as the unit of analysis. Ten of the 13 included studies provided the number of participants alongside the number of catheters, although none provided separate reports of the catheter‐related outcomes using participants as the unit of analysis. The number of catheters matched the number of participants in six studies (Dettenkofer 2010; Levy 1988;Humar 2000; Maki 1991; Sadowski 1988; Yousefshahi 2013); in three studies, the number of catheters exceeded the number of participants: by 10% in Prager 1984, 18% in Langgartner 2004 and 50% in Vallés 2008. In Tuominen 1981, there were fewer catheters analysed than participants enrolled, with no reason provided.
We did not incorporate the outcome data of Yasuda 2013 into our meta‐analysis, as it was published only as an abstract and did not state the base solution used (either aqueous or alcohol) for the povidone‐iodine group. We are awaiting further information from the authors.
In terms of funding source, one study (Dettenkofer 2010) received funding from a national research agency, five studies (Humar 2000; Maki 1991; Mimoz 1996; Mimoz 2007; Prager 1984) were funded in whole or in part by a pharmaceutical company, and in the remaining seven studies (Langgartner 2004; Levy 1988; Sadowski 1988; Tuominen 1981; Vallés 2008; Yasuda 2013; Yousefshahi 2013), the sources of funding were not stated.
Excluded studies
We excluded a total of 83 articles based on one or more of the following reasons.
-
Study design or article type (54 studies): the studies were either retrospective or prospective cohort studies, cross‐over study, before‐and‐after intervention studies, prospective non‐randomised intervention studies, meta‐analyses, economic analyses with no original trial data, in vitro experiments, studies with research questions or outcomes that did not match our review, commentaries or an abstract of an included study, excluded study or a study awaiting classification.
-
Population (17 studies): the participants in the studies were either neonates, people undergoing haemodialysis or all patients in ICU, not only those with CVCs in place.
-
Intervention (25 studies): the studies either assessed antimicrobial‐impregnated dressing or cerebral ventricular catheter.
-
Insufficient information (four studies): the studies either reported combined outcome data for arterial, venous or Swan Gantz catheters (or a combination of these), with no separate reporting for venous catheter and little possibility of contacting the authors for further information, or they reported outcome data that were unsuitable for meta‐analysis.
Among the excluded articles, three articles were merged with other articles as their secondary references on the basis of duplication of information as stated under reason number 1 above, including two included studies (Maki 1991; Mimoz 1996) and one excluded study (Garland 2009b).
A description of each study is available in the 'Characteristics of excluded studies' table.
Risk of bias in included studies
There was a wide variation in the risk of bias of the included studies. Overall, there was approximately a one‐third split in the domains that were judged to be low risk, unclear risk and high risk. There was at least one high‐risk domain in each of the included studies. All studies were judged to be at high risk for blinding of participants, except Dettenkofer 2010 (low risk) and Yousefshahi 2013 (unclear risk). Yasuda 2013 had unclear risks of bias in all domains, as there was insufficient information in the published abstract. The proportions of included studies with low, high and unclear risks of bias in each domain is illustrated in Figure 2, and the risk of bias judgment of each included study in each domain is depicted in Figure 3. Additionally, we have provided a detailed description of the risk of bias of each study in the 'Characteristics of included studies' table. We summarise our risk of bias assessments for each domain below.
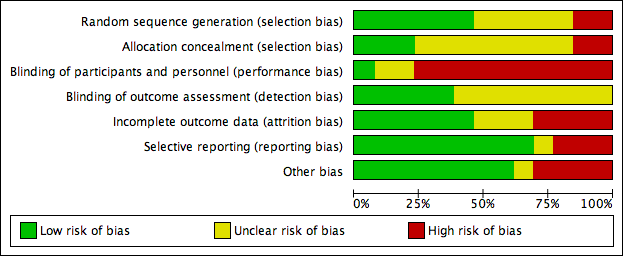
Risk of bias graph: review authors' judgements about each risk of bias item presented as percentages across all included studies.

Risk of bias summary: review authors' judgements about each risk of bias item for each included study.
Allocation
For random sequence generation, we judged 6 of the 13 included studies to have low risk of bias (Dettenkofer 2010; Humar 2000; Mimoz 1996; Mimoz 2007; Tuominen 1981; Vallés 2008). For allocation concealment, three studies had low risk of bias (Dettenkofer 2010; Langgartner 2004; Mimoz 2007). In these studies, the authors clearly stated the method of sequence generation, which involved some form of random number scheme, mostly by computers. There were also clear statements in the 'Methods' that reassured the readers of the independence between sequence generation and allocation. Two studies were judged to be at high risk in sequence generation as well as allocation concealment, as they allocated participants either using an alternate sequence or based on their hospital registration numbers (Prager 1984; Yousefshahi 2013). There was an unclear risk of bias in one or both domains for 8 of the 13 included studies due to insufficient information provided in the articles.
Blinding
All of the studies except Dettenkofer 2010, Yasuda 2013 and Yousefshahi 2013 had a high risk of bias with regard to blinding of participants. Maki 1991, Mimoz 1996 and Mimoz 2007 clearly stated that they did not blind participants, while other studies did not specify. However, blinding was considered very unlikely in these studies because they compared either a skin antisepsis regimen against no regimen, one skin antisepsis solution against another with a different appearance, or a skin antisepsis regimen against a different and clearly distinguishable infection control measure with no documented attempt to mask the participants.
Eight studies did not report blinding of outcome assessors (Humar 2000; Langgartner 2004; Levy 1988; Prager 1984; Sadowski 1988; Tuominen 1981; Yasuda 2013; Yousefshahi 2013), while the other five did not make any clear statements one way or the other (Dettenkofer 2010; Maki 1991; Mimoz 1996; Mimoz 2007; Vallés 2008). Although investigators objectively measured the outcome of catheter colonisation, catheter‐related BSI required some degree of clinical judgment, which might have been affected by lack of blinding.
Incomplete outcome data
We judged studies to have a high risk of attrition bias for the following three reasons, alone or in combination:
-
High absolute attrition rates (≥ 20% attrition) or an attrition rate that was higher than the event rates in the control group
-
Vulnerability of the pooled estimates to best‐ and worst‐case scenarios using the dropouts in the assigned groups
-
Marked imbalance in the attrition rates between the assigned groups.
Four studies had high risk of bias in this domain either because they had more than 20% withdrawals (Dettenkofer 2010; Humar 2000; Langgartner 2004) or because their results changed significantly with best‐ and worst‐case scenarios (Vallés 2008). Six studies had low risk of bias (Levy 1988; Maki 1991; Mimoz 2007; Prager 1984; Sadowski 1988; Yousefshahi 2013), and the information on withdrawal was not sufficient in the remaining three studies (Mimoz 1996; Tuominen 1981; Yasuda 2013).
Selective reporting
Nine studies had low risk of reporting bias (Dettenkofer 2010; Humar 2000; Maki 1991; Mimoz 1996; Mimoz 2007; Prager 1984; Sadowski 1988; Tuominen 1981; Yousefshahi 2013), and three studies carried a high risk (Langgartner 2004; Levy 1988; Sadowski 1988). The three studies that were judged to have high risk of reporting bias did not report key outcomes that would be expected in such types of studies, such as catheter‐related BSI, clinical sepsis or mortality.
Other potential sources of bias
We screened for other potential sources of bias including extreme baseline imbalance, block randomisation of unblinded trials, unit of analysis issues and any evidence of fraud. As blinding was highly unlikely in most included studies, the use of block randomisation posed an additional risk of bias due to the possibility of disrupting the integrity of the random sequence with educated guess on the likely allocation of the future participants (Higgins 2011a). Two studies (Humar 2000; Vallés 2008) were judged to have high risk under 'other potential sources of bias' as they used block randomisation, and the authors did not state whether they used varying block sizes in either trial.
Unit of analysis issues were a particular concern in three studies (Langgartner 2004; Prager 1984; Vallés 2008), in which the number of catheters analysed exceeded the total number of participants. This meant that some participants had multiple catheters analysed in the study as the authors of the three studies did not limit one catheter per participants in the analyses. The results might have been affected as the outcomes data from multiple catheters from the same participants were most likely not independent from each other. A more detailed description of the risk of bias of the trials is provided in 'Assessment of risk of bias in included studies'.
Effects of interventions
In this review, we assessed outcomes for a total of 3446 catheters in our meta‐analysis of 12 studies. The total number of participants was unclear as some studies did not report this detail. Overall, we carried out 10 comparisons, with variations related to the base solution in comparisons 4 and 6.
-
Comparison 1: povidone‐iodine (in aqueous solution) versus no skin antisepsis (Prager 1984).
-
Comparison 2: chlorhexidine (in aqueous solution) versus no skin antisepsis (Tuominen 1981).
-
Comparison 3: alcohol versus no skin antisepsis (Sadowski 1988).
-
Comparison 4: chlorhexidine versus povidone‐iodine.
-
Chlorhexidine in aqueous solution versus povidone‐iodine in aqueous solution (Maki 1991; Vallés 2008).
-
Chlorhexidine in alcohol versus povidone‐iodine in aqueous solution (Humar 2000; Vallés 2008).
-
Chlorhexidine in alcohol versus povidone‐iodine in alcohol (Mimoz 2007).
-
-
Comparison 5: chlorhexidine (in aqueous solution) versus alcohol (Maki 1991).
-
Comparison 6: povidone‐iodine versus alcohol.
-
Comparison 7: alcohol versus octenidine in alcohol (Dettenkofer 2010).
-
Comparison 8: chlorhexidine (in alcohol) plus povidone‐iodine (in aqueous solution) versus chlorhexidine in alcohol (Langgartner 2004).
-
Comparison 9: chlorhexidine (in alcohol) plus povidone‐iodine (in aqueous solution) versus povidone‐iodine (in aqueous solution) (Langgartner 2004).
-
Comparison 10: Sanosil (hydrogen peroxide and silver) versus water as adjunct to chlorhexidine 2% aqueous bath plus povidone‐iodine 10% aqueous scrub (Yousefshahi 2013).
Below, we report on our outcomes of interest in order of the comparisons that examined them.
Primary outcomes
Catheter‐related BSI
Comparison 1: aqueous povidone iodine versus no skin antisepsis (1 RCT, 179 catheters)
Prager 1984 was the only study that compared povidone iodine in aqueous solution versus with no skin antisepsis (dry dressing). There was no clear evidence of a difference in the rate of catheter‐related BSI (RR 0.99, 95% CI 0.37 to 2.61; 179 catheters; Analysis 1.1). The estimate is very uncertain as the comparison was underpowered to detect important differences in the outcome. The quality of evidence for this outcome was rated as very low due to very serious risk of bias issues (random sequence generation, allocation concealment, non‐blinding of participants and unit of analysis issue) as well as imprecision.
Comparisons 2: aqueous chlorhexidine versus no skin antisepsis and comparison 3: alcohol versus no skin antisepsis
No study reported this outcome for these comparisons.
Comparison 4: chlorhexidine versus povidone‐iodine (4 RCTs, 1436 catheters)
Overall, chlorhexidine (any solution) was associated with a lower rate of catheter‐related BSI than povidone‐iodine (any solution) (absolute risk reduction (ARR) of 2.30%, 95% confidence interval (CI) 0.06% to 3.70%; risk ratio (RR) 0.64, 95% CI 0.41 to 0.99; NNTB 44, 95% CI 27 to 1563; four studies, 1436 catheters, I2 = 0%; Analysis 4.1; Figure 4). This evidence was very low quality, downgraded for imprecision (one level) and risks of bias (two levels) in allocation concealment, blinding of participants and unit of analysis issues under "other sources of bias". Analyses of subgroups according to the base solution used showed no clear differences between chlorhexidine and povidone‐iodine in the rates of catheter‐related BSI: chlorhexidine in aqueous solution versus povidone‐iodine in aqueous solution (RR 0.64, 95% CI 0.32 to 1.28, 2 studies, 452 catheters, I2 = 15%), chlorhexidine in alcohol versus povidone‐iodine in aqueous solution (RR 0.77, 95% CI 0.39 to 1.53; 2 studies, 503 catheters, I2 = 0%), chlorhexidine in alcohol versus povidone‐iodine in alcohol (RR 0.40, 95% CI 0.13 to 1.24; 1 study, 481 catheters). The small number of trials in each subgroup means that the comparisons were underpowered, and the results are uncertain. We considered the evidence from the data to be of very low overall quality (downgraded for imprecision (one level) and risks of bias (two levels) in allocation concealment, blinding of participants and unit of analysis issues. We have highlighted the results for these outcomes from the overall comparison of chlorhexidine versus povidone‐iodine as well as the three subgroup comparisons in our summary of findings Table for the main comparison.
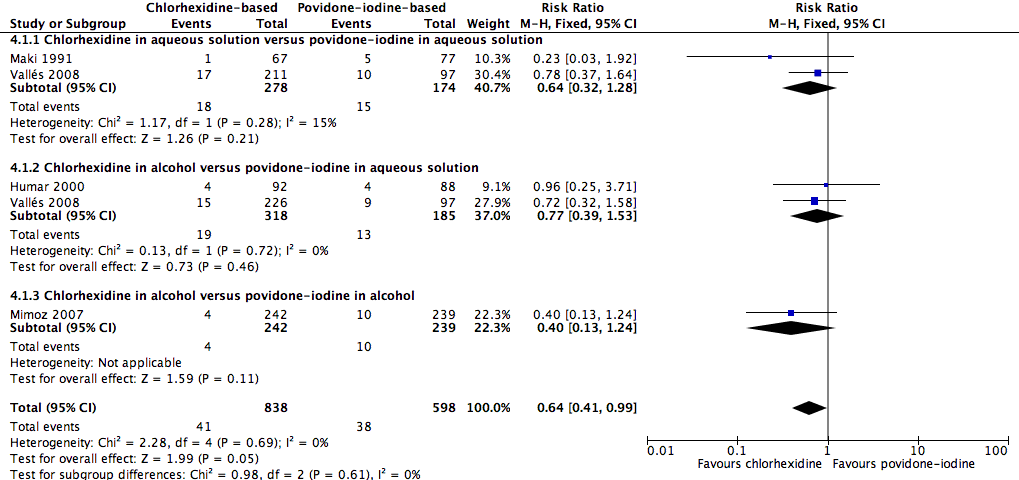
Forest plot of comparison: 1 Chlorhexidine versus povidone‐iodine, outcome: 1.1 Catheter‐related BSI.
For the outcome of catheter‐related BSI per 1000 catheter‐days, chlorhexidine was associated with an apparent lower BSI rate compared with povidone‐iodine (RR 0.53, 95% CI 0.30 to 0.94; 4 studies, 1450 catheters, I2 = 0%; Analysis 4.2). Analyses of subgroups according to the base solution used found evidence of a possible difference between chlorhexidine in alcohol versus povidone‐iodine in aqueous solution (RR 0.49, 95% CI 0.25 to 0.95; 3 studies, 661 catheters, I2 = 31%), but relative effects were unclear for the other base solutions in comparison (chlorhexidine in aqueous solution versus povidone‐iodine in aqueous solution (RR 0.82, 95% CI 0.23 to 2.93; 1 study, 308 catheters), and chlorhexidine in alcohol versus povidone‐iodine in alcohol (RR 0.41, 95% CI 0.06 to 2.92; 1 study, 481 catheters). All subgroup comparisons were underpowered and the overall quality of evidence for this outcome was very low due to very serious risk of bias issues (non‐blinding of participants, incomplete outcome data and unit of analysis issues).
Comparison 5: aqueous chlorhexidine versus alcohol (1 RCT, 99 catheters)
A single small study compared chlorhexidine in aqueous solution with alcohol (Maki 1991) and found no clear difference in the absolute rate of catheter‐related BSI between the alcohol‐based solution and the chlorhexidine‐based solution (RR 0.24, 95% CI 0.02 to 2.54; 99 catheters; Analysis 5.1). The comparison was underpowered and the quality of evidence for this outcome was low due to risk of bias of the study (non‐blinding) and imprecision.
Comparison 6: aqueous povidone‐iodine versus alcohol (1 RCT, 109 catheters)
Maki 1991, the only study that compared povidone‐iodine in aqueous solution with alcohol did not find a clear difference in the rate of catheter‐related BSI between the two groups (RR 1.04, 95% CI 0.24 to 5.08; 109 catheters; Analysis 6.1). The comparison was underpowered and the quality of evidence for this outcome was low due to risk of bias issue (non‐blinding of the participants) and imprecision.
Comparison 7: alcohol versus octenidine in alcohol (1 RCT, 387 catheters)
Dettenkofer 2010 was the only study to compare alcohol versus octenidine in alcohol, and found no clear difference between groups in the absolute rate of catheter‐related BSI (RR 2.01, 95% CI 0.88 to 4.59; 387 catheters; Analysis 7.1) or catheter‐related BSI per 1000 catheter‐days (RR 2.18, 95% CI 0.54 to 8.77; 387 catheters; Analysis 7.2). The comparison was underpowered and the quality of evidence for both outcomes was low due to risk of bias issue (incomplete outcome data) and imprecision.
Septicaemia (whether or not CVC‐related)
Comparison 2: chlorhexidine versus no skin antisepsis (1 RCT, 136 participants)
The only study that reported the outcome of septicaemia (irrespective of its relationship with CVC) was Tuominen 1981, which compared chlorhexidine with no skin antisepsis. This study of 136 participants compared the use of 0.05% chlorhexidine in aqueous solution with no skin antisepsis and found no clear difference in the rate of septicaemia between the two groups, but the result was inconclusive due to imprecision (RR 2.91, 95% CI 0.31 to 27.31; Analysis 2.1). The quality of evidence for this outcome was low due to risk of bias issue (non‐blinding of participants) and imprecision, as stated above.
Mortality (all‐cause or CVC‐related)
Comparison 4: chlorhexidine versus povidone‐iodine (1 RCT, 329 participants analysed, 106 participants in povidone‐iodine group were included in both subgroup comparisons below)
A single study (Vallés 2008) reported mortality. The study divided the participants into three groups: chlorhexidine in aqueous solution, chlorhexidine in alcohol and povidone‐iodine in aqueous solution. Analyses according to subgroups showed no clear differences in the rates of mortality between chlorhexidine in aqueous solution and povidone‐iodine in aqueous solution (RR 1.15, 95% CI 0.72 to 1.83; 213 participants) (Analysis 4.3), or between chlorhexidine in alcohol and povidone‐iodine in aqueous solution (RR 0.80, 95% CI 0.48 to 1.34; 222 participants) (Analysis 4.3)(Figure 5). However, the comparison was underpowered to detect important differences in the outcome, and the quality of evidence for both analyses was low due to a combination of risk of bias issues and imprecision in the outcome estimates (summary of findings Table for the main comparison). Consequently true differences in the mortality associated with use of chlorhexidine or povidone iodine cannot be ruled out.
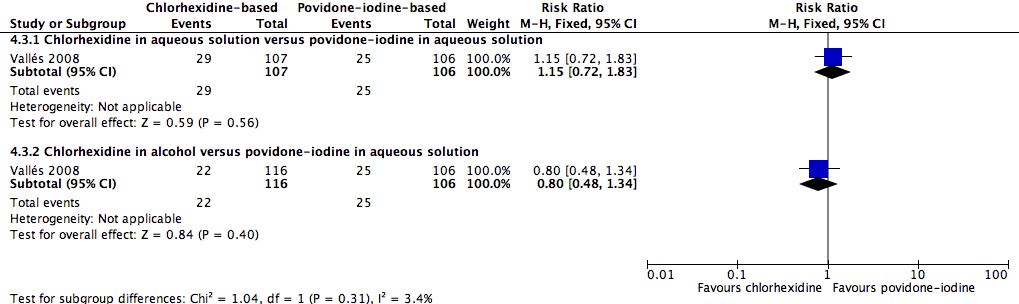
Forest plot of comparison: 1 Chlorhexidine versus povidone‐iodine, outcome: 1.3 All‐cause mortality.
Secondary outcomes
Catheter colonisation
Comparison 1: aqueous povidone‐iodine versus no skin antisepsis (1 RCT, 179 catheters)
Based on Prager 1984, the only study in this underpowered comparison, it is unclear whether there is any difference in the effect on catheter colonisation of aqueous povidone iodine and no skin antisepsis (RR 0.93, 95% CI 0.53 to 1.60; 179 catheters; Analysis 1.2). There was very low quality evidence due to serious risk of bias (random sequence generation, allocation concealment, non‐blinding of participants and unit of analysis issue) and indirectness of the outcome.
Comparison 2: aqueous chlorhexidine versus no skin antisepsis (1 RCT, 124 catheters)
Based on Tuominen 1981, the only study to compare chlorhexidine in aqueous solution with no skin antisepsis, there was no clear difference in the rate of catheter colonisation and therefore uncertainty as to their relative effects remains (RR 1.26, 95% CI 0.61 to 2.59; 124 catheters; Analysis 2.2). The quality of evidence was very low due to risk of bias (non‐blinding of participants), indirectness of the outcome and imprecise estimate from an underpowered analysis.
Comparison 3: alcohol versus no skin antisepsis (1 RCT, 50 catheters)
Based on a single study in this underpowered analysis (Sadowski 1988), it remains unclear whether there is a difference between cleansing the skin with alcohol and no skin antisepsis prior to catheter removal (RR 0.75, 95% CI 0.30 to 1.85; 50 catheters; Analysis 3.1). The quality of evidence was very low due to risk of bias (non‐blinding of the participants), indirectness and imprecision.
Comparison 4: chlorhexidine versus povidone‐iodine (5 RCTs, 1533 catheters)
Pooled analysis of five studies that compared chlorhexidine with povidone iodine showed an overall reduction in the risk of catheter colonisation with chlorhexidine (RR 0.68, 95% CI 0.56 to 0.84; ARR 8%, 95% CI 3 to 12%; NNTB 13, 95% CI 9 to 34; 5 studies, 1533 catheters, I2 = 55%; Analysis 4.4; Figure 6). Analysing subgroups according to the solution, there appeared to be reductions in rates of catheter colonisation favouring chlorhexidine in the following comparisons:

Forest plot of comparison: 1 Chlorhexidine versus povidone‐iodine, outcome: 1.4 Catheter colonisation.
-
Chlorhexidine in aqueous solution versus povidone‐iodine in aqueous solution (RR 0.60, 95% CI 0.40 to 0.91; 2 studies, 442 catheters, I2 = 56%).
-
Chlorhexidine in alcohol versus povidone‐iodine in alcohol (RR 0.52, 95% CI 0.34 to 0.80; 1 study, 481 catheters).
However, the rate of catheter colonisation between chlorhexidine in alcohol versus povidone‐iodine in aqueous solution appeared to be similar (RR 0.86, 95% CI 0.64 to 1.14; 3 studies, 600 catheters, I2 = 58%).
There was moderate heterogeneity present for the overall pooled analysis, as indicated by the I2 of 55%. The extent of heterogeneity remained even with the studies separated into subgroups according to the solution used, as shown above. We investigated other possible sources of heterogeneity by exploring factors that were present in the population, intervention, comparison, outcome definitions and risk of bias among the included studies. We noted that although there were some differences in the characteristics of the included studies in terms of population (surgical versus cardiac versus general ICUs) and intervention (different concentrations of chlorhexidine used, duration of catheterisation and the concurrent use of other antiseptic substances alongside chlorhexidine‐based solution), these differences did not plausibly explain the degree of heterogeneity, as separating the studies into subgroups according to these factors did not reduce the degree of heterogeneity.
However, we identified one plausible source of heterogeneity under the risk of bias criterion. We found that only two out of five included studies (Maki 1991; Mimoz 1996) had low risk of attrition bias, while the other three were at high risk of bias in this domain. The two studies with low risk of attrition bias showed significant benefits of chlorhexidine compared with povidone‐iodine, whilst the remaining studies showed no significant difference between the two groups. Grouping studies with low risk and high risk of attrition bias separately reduced the I2 statistic to 0% and 41%, respectively.
We undertook best‐ and worst‐case scenarios to determine the impact of missing data from these three studies and found that the overall pooled analysis was substantially altered, with the best‐case scenario moving the direction of the pooled estimate to significantly and substantially favour the chlorhexidine group, and the worst‐case scenario moving the pooled estimate to significantly favour the povidone‐iodine group (see 'Sensitivity analysis' for details).
Having identified a plausible explanation for the observed heterogeneity, we still decided to combine all five studies under three different subgroups according to the type of solution used (either aqueous or alcohol). Taking all considerations, the overall quality of evidence for this outcome was very low, as there were very serious concerns regarding risk of bias (non‐blinding of participants, incomplete outcome data and unit of analysis issue), indirectness of the outcome and inconsistency among the study results.
Comparison 5: aqueous chlorhexidine versus alcohol (1 RCT, 99 catheters)
According to a single study (Maki 1991), it remains unclear whether there is a difference in the rates of catheter colonisation between chlorhexidine in aqueous solution and alcohol (RR 0.38, 95% CI 0.11 to 1.33; 99 catheters; Analysis 5.2), but the comparison was underpowered. The quality of evidence for this outcome was very low due to risk of bias (non‐blinding of participants), indirectness and imprecision.
Comparison 6: aqueous povidone‐iodine versus alcohol (3 RCTs, 169 catheters)
It is unclear whether there is a difference in the rates of catheter colonisation between patients who received CVC cleansing with povidone‐iodine and those who receive cleansing with alcohol, either overall (RR 1.76, 95% CI 0.76 to 4.09; 2 studies, 169 catheters, I2 = 43%), or in subgroups comparing povidone‐iodine in aqueous solution versus alcohol (RR 1.25, 95% CI 0.49 to 3.14; 1 study, 109 catheters) or povidone‐iodine‐impregnated adherent film versus alcohol (RR 9.00, 95% CI 0.51 to 160.17; 1 study, 60 catheters; Analysis 6.2). The comparisons were underpowered, and the overall quality of evidence for this outcome was very low due to risk of bias (non‐blinding of participants), indirectness of the outcome and imprecision.
Comparison 7: alcohol versus octenidine in alcohol (1 RCT, 322 catheters)
Dettenkofer 2010, the only study to compare alcohol versus octenidine in alcohol, showed that alcohol alone is probably associated with a higher rate of catheter colonisation compared to octenidine (RR 2.26, 95% CI 1.22 to 4.21; 322 catheters; Analysis 7.3). However, there appeared to be no clear difference between the two groups in terms of catheter colonisation per 1000 catheter‐days (RR 2.23, 95% CI 0.79 to 6.29; 322 catheters; Analysis 7.4). The quality of evidence for both outcomes was low, due to concerns in risk of bias (non‐blinding of participants) and indirectness of the outcomes.
Comparison 8: chlorhexidine in alcohol plus povidone‐iodine in aqueous solution versus chlorhexidine in alcohol (1 RCT, 88 catheters)
In an underpowered analysis from a single study (Langgartner 2004), a combination of chlorhexidine plus povidone‐iodine appeared to be associated with lower rate of catheter colonisation (RR 0.19, 95% CI 0.04 to 0.81; 88 catheters; Analysis 8.1) as well as catheter colonisation per 1000 catheter‐days (RR 0.19, 95% CI 0.06 to 0.59; 88 catheters; Analysis 8.2) compared with chlorhexidine alone, although the effects were uncertain due to the very low quality of evidence, which was reduced by risk of bias (non‐blinding of participants, incomplete outcome data, unit of analysis issue), indirectness and imprecision.
Comparison 9: chlorhexidine in alcohol plus povidone‐iodine in aqueous solution versus povidone‐iodine in aqueous solution (1 RCT, 95 catheters)
In another single‐study, underpowered analysis based on Langgartner 2004, there appeared to be lower rate of catheter colonisation (RR 0.15, 95% CI 0.04 to 0.62; 95 catheters; Analysis 9.1) as well as catheter colonisation per 1000 catheter‐days (RR 0.17, 95% CI 0.05 to 0.52; 95 catheters; Analysis 9.2) using a combination of chlorhexidine and povidone‐iodine compared with using povidone‐iodine alone, but the effects were very uncertain due to the very low quality of evidence, which was reduced by risk of bias (non‐blinding of participants, incomplete outcome data, unit of analysis issue), indirectness and imprecision.
Comparison 10: Sanosil (hydrogen peroxide and silver) versus water as adjunct to chlorhexidine 2% aqueous bath plus povidone‐iodine 10% aqueous scrub (1 RCT, 249 catheters)
From the single study in this underpowered comparison (Yousefshahi 2013), it is uncertain whether there is any clear difference between the two groups in the rate of catheter colonisation (RR 1.08, 95% CI 0.68 to 1.72; 249 catheters; Analysis 10.1) due to the very low quality of evidence, which was reduced by risk of bias (random sequence generation, allocation concealment), indirectness and imprecision.
Insertion site infection
Comparison 4: Chlorhexidine versus povidone‐iodine (1 RCT, 242 catheters)
Based on the result of a single study (Humar 2000) in an underpowered analysis, it is uncertain whether there is any clear difference between chlorhexidine (in alcohol) and povidone‐iodine (in aqueous solution) with regard to insertion site infection, as the quality of evidence was very low due to risk of bias (non‐blinding of the participants, incomplete outcome data), indirectness and imprecision. The authors reported this outcome as the mean CFU count (MD − 2.80, 95% CI − 9.10 to 3.50; 242 catheters; Analysis 4.6).
Skin colonisation
Comparison 7: Alcohol versus octenidine in alcohol (1 RCT, 365 catheters)
Based on the results of Dettenkofer 2010, using alcohol alone probably resulted in higher mean CFU compared with octenidine in alcohol (MD 79.00 CFUs, 95% CI 32.76 to 125.24; 365 catheters; Analysis 7.5). The quality of evidence was moderate as it was reduced by imprecision of the effect estimates from an underpowered analysis.
Adverse effects
Comparison 7: Alcohol versus octenidine in alcohol (1 RCT, 398 participants)
A single study, Dettenkofer 2010, reported the rates of various adverse effects on the skin, the definitions of which appeared to overlap. For example, the authors reported "skin irritation", "burning", "skin irritation and burning", "itching", "skin lesions", "burning and skin lesions", "itching and skin irritation" as the outcomes under adverse effects. To avoid duplication, we included only the most commonly reported adverse effect, namely, skin irritation. For this outcome, there was moderate quality evidence showing no clear difference between in adverse effect rates between patients whose CVC sites were cleansed with alcohol and those who were cleansed with octenidine in alcohol (RR 0.85, 95% CI 0.60 to 1.20; 398 participants; Analysis 7.6). The quality of evidence was reduced by imprecision of the effect estimates from an underpowered analysis.
Number of patients who were on antibiotics during the period of catheter use
Comparison 2: Chlorhexidine in aqueous solution versus no skin antisepsis ( 1 RCT, 136 participants)
The only study that evaluated this outcome, Tuominen 1981 found no clear difference between the two groups with regard to the number of patients who required antibiotics during the period of catheter use (RR 0.84, 95% CI 0.55 to 1.27; 136 participants; Analysis 2.3). The quality of evidence was low due to risk of bias (non‐blinding of participants) and imprecision from an underpowered analysis.
Number of drug‐resistant organisms from culture, length of hospitalisation, cost of care and quality of life
No studies in any comparison assessed these outcomes.
Subgroup analyses
Other than separating the subgroups according to the type of solution used in comparisons 4 and 6, we did not perform any additional subgroup analyses as specified in our 'Methods' because the data in each study were not presented separately for various potential subgroups (for short term versus longer term CVCs, for paediatric versus adult patients and for patients in ICU versus those in other wards). Likewise, there was only a single study included in many comparisons, and all studies in the meta‐analysis used diagnostic criteria for catheter‐related infections that were in line with our pre‐specified criteria (see 'Included studies').
Sensitivity analysis
We performed sensitivity analyses on the most commonly assessed outcomes, namely, catheter‐related BSI (primary outcome) and catheter colonisation (secondary outcome) to evaluate the impact of excluding some studies based our predefined criteria (unclear or no allocation concealment (selection bias) and significant dropout rates (attrition bias)). We assessed the impact of missing data in studies with high dropout rates using the best‐ and worst‐case scenarios. We did not carry out a sensitivity analysis according to the criterion of blinding because we considered that all but one study were at high risk in this domain.
Catheter‐related BSI
Comparison 4: Chlorhexidine versus povidone‐iodine
Selection bias: None of the four studies included were at low risk of bias for both random sequence generation and allocation concealment. Maki 1991 was at unclear risk for both items while the other three studies were at low risk for at least one of the items. We decided to perform the sensitivity analysis by excluding Maki 1991. While the point estimate changed only slightly, the confidence interval expanded to cross the line of no effect, shifting the result to become non‐significant (before exclusion: RR 0.64, 95% CI 0.41 to 0.99; after exclusion: RR 0.68, 95% CI 0.43 to 1.08).
Attrition bias: Two studies had a high risk of attrition bias (Humar 2000, Vallés 2008). We conducted best‐ and worst‐case scenarios by assuming the outcome for the patients with missing data as described in the Dealing with missing data section. The direction of the pooled estimate differed markedly between the best‐ and worst‐case scenarios as well as from the actual results reported, namely the 'completer analysis' (best‐case scenario: RR 0.35, 95% CI 0.24 to 0.50, I2: 0%; worst‐case scenario: RR 1.47, 95% CI 1.01 to 2.14, I2: 64%; actual results reported: RR 0.64, 95% CI 0.41 to 0.99, I2: 0%).
There was only a single study included for all the other comparisons.
Catheter colonisation
Comparison 4: Chlorhexidine versus povidone‐iodine
Selection bias: One study (Maki 1991) had unclear risk of bias in both random sequence generation and allocation concealment, whilst the other studies were at low risk of bias for at least one item. The exclusion of Maki 1991 did not result in a substantial change in the pooled estimates (before exclusion: RR 0.68, 95% CI 0.56 to 0.84; after exclusion: RR 0.72, 95% CI 0.58 to 0.88).
Attrition bias: Three of the five studies (Humar 2000; Langgartner 2004; Vallés 2008) included in this comparison had high or unclear risk of attrition bias. We conducted best‐ and worst‐case scenarios. With the best‐case scenario, the pooled estimate showed substantial reduction in the risk of catheter colonisation favouring the chlorhexidine group (RR 0.56, 95% CI 0.47 to 0.68, I2: 73%), and with the worst‐case scenario, there was no significant difference between the two groups (RR 0.90, 95% CI 0.74 to 1.09, I2: 72%). Results from both the best‐ and worst‐case scenarios differed markedly with the actual results reported, namely the 'completer analysis' (RR 0.68, 95% CI 0.56 to 0.84, I2: 55%).
There were insufficient studies in all the other comparisons to enable a meaningful sensitivity analysis.
Discussion
Summary of main results
This review identified a wide variety of skin antisepsis regimens that comprised different combinations of an active substance (such as chlorhexidine) and base solution (such as aqueous or alcoholic solution). However, a limited number of studies (and sometimes just one) examined each regimen. Based on very limited evidence, there were no clear differences between various skin antisepsis regimens for our primary outcome of catheter‐related BSI, although for the overall comparison between chlorhexidine and povidone‐iodine, there appeared to be a reduction in catheter‐related BSI associated with chlorhexidine. Notably, two studies conducted in the 1980s, one comparing povidone‐iodine in aqueous solution with no skin antisepsis and the other comparing chlorhexidine in aqueous solution with no skin antisepsis, found no difference in the rates of BSI between the intervention group and the control group (Prager 1984; Tuominen 1981). However, these were small studies with some methodological issues, and the evidence they provide is very inconclusive.
Based on a single study (Vallés 2008), there were similar rates of mortality between chlorhexidine‐based solution and povidone‐iodine based solution. However, the analyses were underpowered for any clear conclusion to be drawn with regards to this outcome.
In the outcome of catheter colonisation, some differences existed between different skin antisepsis regimens, with regimens containing chlorhexidine appearing to be more effective than regimens containing povidone‐iodine in reducing risk.
One trial showed that octenidine in alcohol appeared to be more effective than alcohol alone in reducing catheter colonisation. Three separate studies that compared chlorhexidine, povidone‐iodine and alcohol‐based solution, respectively, with no skin antisepsis did not find any clear difference in the rates of catheter colonisation between the intervention group and the control group, although the amount of evidence based on these studies is insufficient to draw any clear conclusion. Analysis based on very small number of studies and catheters suggested that a combination of chlorhexidine and povidone‐iodine appeared to be more effective than either agent alone in reducing catheter colonisation. Single‐study analyses showed that there were no clear differences in the rates of insertion site infection, skin colonisation or adverse events between different skin antisepsis regimens examined. Overall, the results of this meta‐analysis need to be interpreted with caution, as the majority of the included studies were not sufficiently powered to detect a clear difference in the outcomes, and some significant results came from small, methodologically flawed studies, as mentioned above.
Overall completeness and applicability of evidence
We identified 13 studies that matched our selection criteria in terms of population, intervention, comparison and outcomes, and data were unavailable for analysis in 1 out of 13 studies. A total of 3446 catheters were assessed. The studies took place in Europe, the USA and Asia, from 1981 to 2013, in settings where CVCs are commonly used, such as the ICUs and haematology and oncology units. However, there are certain limitations in the completeness of this review. For example, among the participants, children were grossly underrepresented, and most of the included studies did not adequately asses some of the key prespecified outcomes of this review, including primary BSIs, mortality, adverse effects and costs. Furthermore, we were unable to undertake most of the subgroup analyses because there were insufficient data.
Quality of the evidence
Overall, the quality the evidence for the majority of outcomes assessed was very low to moderate due to the small number of studies included in each comparison and variable risk of bias of the included studies. The strongest evidence comes from the overall comparison between antiseptic solutions containing chlorhexidine against antiseptic solutions containing povidone‐iodine, for which there were five studies. However, all comparisons in this review suffered from a lack of power in the analysis, as evidenced by the small number of trials and catheters in each comparison. The lack of power in the analysis has seriously affected our confidence in interpreting the results in general, as we were unable to determine whether non‐statistically significant results were indicative of true (null) effects or of insufficient data for detecting differences. Also, in the case of a statistically significant difference, an analysis with a small number of trials and catheters lessens the reliability of the results due to concerns about the effects of small studies in exacerbating the impact of biases (Sterne 2011).
A second major limitation in the quality of the evidence gathered was the risk of attrition bias, as four studies had high risks and three had unclear risks. In studies with high risk of attrition bias, the pooled results varied substantially between the best‐ and worst‐case scenarios and from the actual results reported, and this precluded us from drawing a firm conclusion on the results of the outcomes concerned. Besides, a lack of blinding of the participants in most studies, as well as the unit of analysis issues in some studies in which multiple catheters in the same participants were analysed as separate units has further affected the overall methodological rigour of the included studies, and in turn the quality of evidence. Overall, the body of evidence gathered in this review did not allow us to reach a robust conclusion regarding the effectiveness and safety of various skin antisepsis regimes in reducing CVC‐related infections (see summary of findings Table for the main comparison for the outcome data under the major comparisons in this review).
Potential biases in the review process
We performed a comprehensive search of multiple databases with independent screening, selection and assessment of eligible studies. However, we were unable to obtain all relevant data; five studies are awaiting assessment, as there were difficulties obtaining full texts, and another one is an ongoing study. Many of the excluded studies assessed a combination of arterial and venous catheters but did not report outcome data separately for CVC, which prevented us from including a larger body of potentially relevant information. We are currently waiting for authors of the studies concerned to provide us relevant data for our future updates.
There are some unresolved unit of analysis issues in this review: for catheter‐specific outcomes such as catheter‐related BSI and catheter colonisation, we reported the results in the same way as the original studies, using catheters rather than participants as the unit of analysis. As a result, the review included multiple catheters in the same participants. Our failure to adjust for this unit of analysis issue might have affected the results.
Agreements and disagreements with other studies or reviews
The findings of this review are broadly in line with two other reviews on this topic (Adams 2007; Chaiyakunapruk 2002), which concluded that antiseptic solutions containing chlorhexidine are more effective than those containing povidone‐iodine in reducing catheter colonisation and catheter‐related BSI. Of the two reviews, Adams 2007 was a narrative review and Chaiyakunapruk 2002 was a systematic review that evaluated chlorhexidine against povidone‐iodine in all vascular catheters, including arterial and central and peripheral venous catheters. Chaiyakunapruk 2002 showed that antiseptic solutions containing chlorhexidine reduced catheter‐related BSI on average by 49% compared with povidone‐iodine, although there was a great degree of uncertainty on the magnitude of its benefit, as reflected by a wide confidence interval (RR 0.51, CI 0.27 to 0.97; 8 RCTs including three that evaluated only CVCs, 4143 arterial and venous catheters combined including 1493 CVCs). Our review, which is focused only on central venous catheters, included two more trials but a slightly smaller number of CVCs, and we showed that a solution containing chlorhexidine reduced catheter‐related BSI by an average of 36% (relative effect) compared with povidone‐iodine (RR 0.64, CI 0.41 to 0.99; 5 studies, 1436 CVCs).
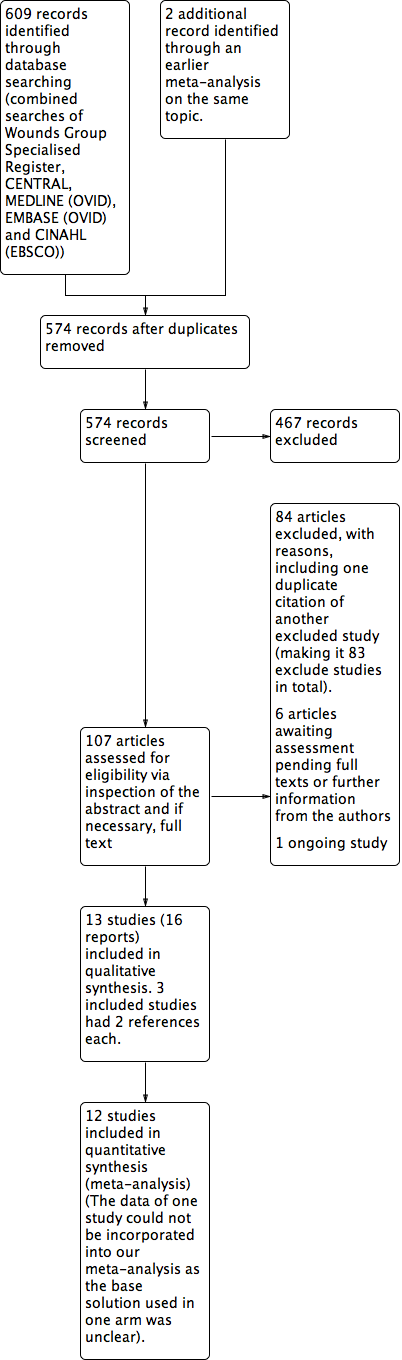
Study flow diagram.

Risk of bias graph: review authors' judgements about each risk of bias item presented as percentages across all included studies.
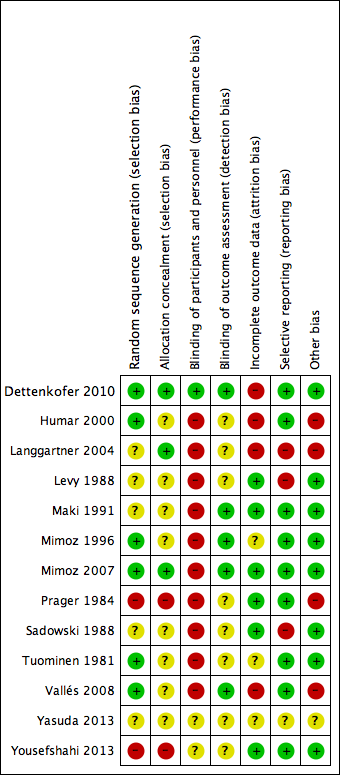
Risk of bias summary: review authors' judgements about each risk of bias item for each included study.

Forest plot of comparison: 1 Chlorhexidine versus povidone‐iodine, outcome: 1.1 Catheter‐related BSI.

Forest plot of comparison: 1 Chlorhexidine versus povidone‐iodine, outcome: 1.3 All‐cause mortality.

Forest plot of comparison: 1 Chlorhexidine versus povidone‐iodine, outcome: 1.4 Catheter colonisation.

Comparison 1 Povidone‐iodine (in aqueous solution) versus no skin antisepsis, Outcome 1 Catheter‐related BSI.
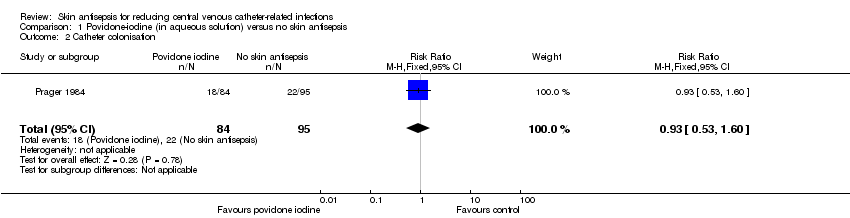
Comparison 1 Povidone‐iodine (in aqueous solution) versus no skin antisepsis, Outcome 2 Catheter colonisation.

Comparison 2 Chlorhexidine (in aqueous solution) versus no skin antisepsis, Outcome 1 Septicaemia.
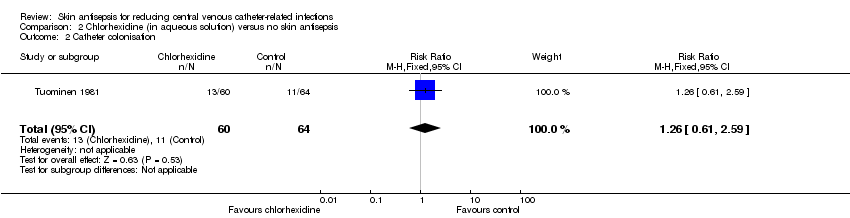
Comparison 2 Chlorhexidine (in aqueous solution) versus no skin antisepsis, Outcome 2 Catheter colonisation.

Comparison 2 Chlorhexidine (in aqueous solution) versus no skin antisepsis, Outcome 3 Number of patients who required antibiotics during in‐dwelling period of catheter.

Comparison 3 Alcohol versus no skin antisepsis, Outcome 1 Catheter colonisation.

Comparison 4 Chlorhexidine versus povidone‐iodine, Outcome 1 Catheter‐related BSI.
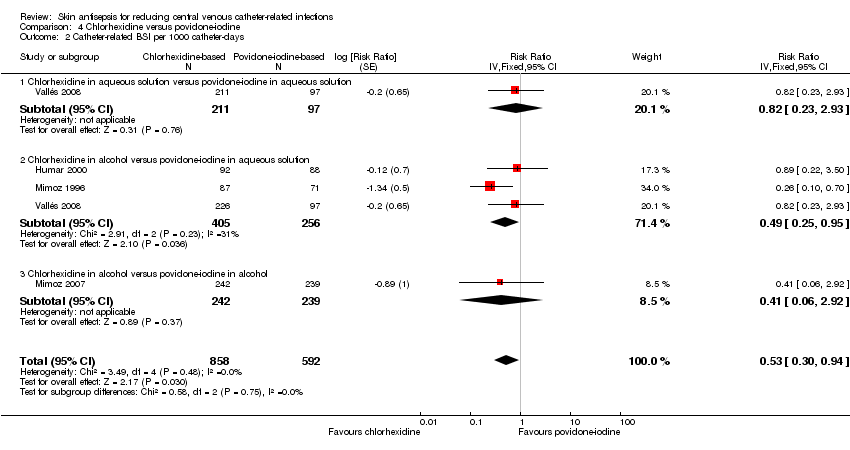
Comparison 4 Chlorhexidine versus povidone‐iodine, Outcome 2 Catheter‐related BSI per 1000 catheter‐days.

Comparison 4 Chlorhexidine versus povidone‐iodine, Outcome 3 All‐cause mortality.

Comparison 4 Chlorhexidine versus povidone‐iodine, Outcome 4 Catheter colonisation.

Comparison 4 Chlorhexidine versus povidone‐iodine, Outcome 5 Catheter colonisation per 1000 catheter‐days.
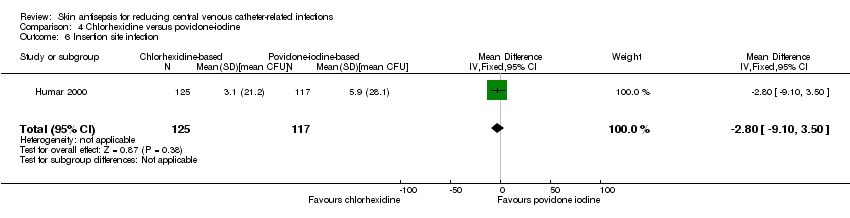
Comparison 4 Chlorhexidine versus povidone‐iodine, Outcome 6 Insertion site infection.
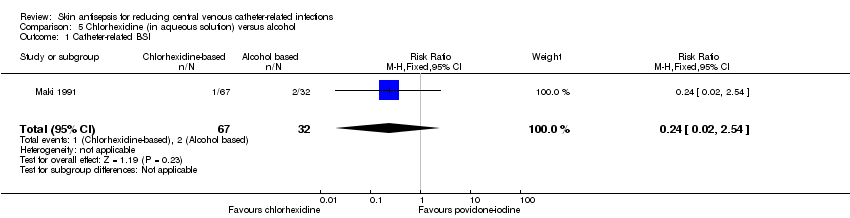
Comparison 5 Chlorhexidine (in aqueous solution) versus alcohol, Outcome 1 Catheter‐related BSI.
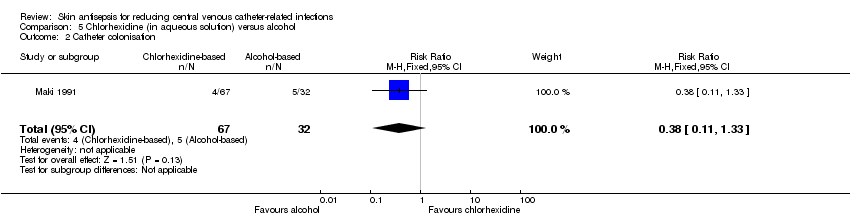
Comparison 5 Chlorhexidine (in aqueous solution) versus alcohol, Outcome 2 Catheter colonisation.

Comparison 6 Povidone‐iodine (in aqueous solution) versus alcohol, Outcome 1 Catheter‐related BSI.

Comparison 6 Povidone‐iodine (in aqueous solution) versus alcohol, Outcome 2 Catheter colonisation.
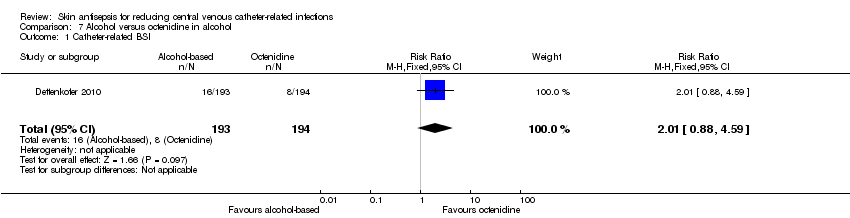
Comparison 7 Alcohol versus octenidine in alcohol, Outcome 1 Catheter‐related BSI.

Comparison 7 Alcohol versus octenidine in alcohol, Outcome 2 Catheter‐related BSI per 1000 catheter‐days.

Comparison 7 Alcohol versus octenidine in alcohol, Outcome 3 Catheter colonisation.
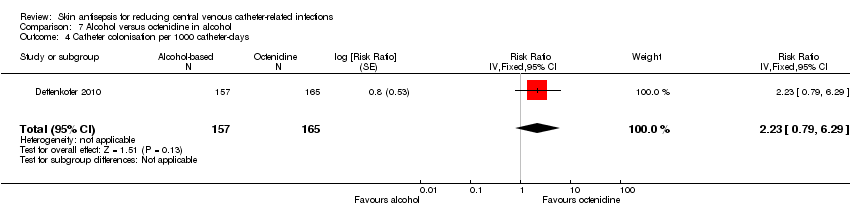
Comparison 7 Alcohol versus octenidine in alcohol, Outcome 4 Catheter colonisation per 1000 catheter‐days.

Comparison 7 Alcohol versus octenidine in alcohol, Outcome 5 Skin colonisation.

Comparison 7 Alcohol versus octenidine in alcohol, Outcome 6 Adverse effects.
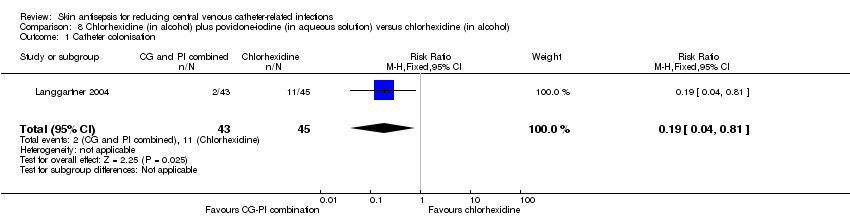
Comparison 8 Chlorhexidine (in alcohol) plus povidone‐iodine (in aqueous solution) versus chlorhexidine (in alcohol), Outcome 1 Catheter colonisation.
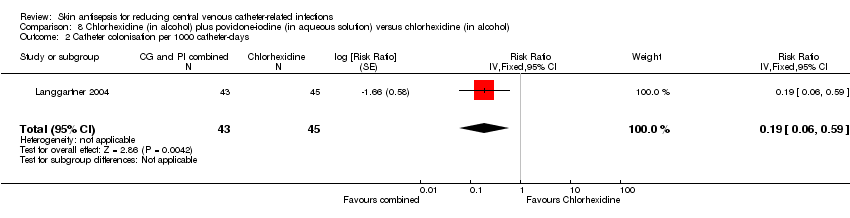
Comparison 8 Chlorhexidine (in alcohol) plus povidone‐iodine (in aqueous solution) versus chlorhexidine (in alcohol), Outcome 2 Catheter colonisation per 1000 catheter‐days.

Comparison 9 Chlorhexidine (in alcohol) plus povidone‐iodine (in aqueous solution) versus povidone‐iodine (in aqueous solution), Outcome 1 Catheter colonisation.

Comparison 9 Chlorhexidine (in alcohol) plus povidone‐iodine (in aqueous solution) versus povidone‐iodine (in aqueous solution), Outcome 2 Catheter colonisation per 1000 catheter‐days.

Comparison 10 Sanosil (hydrogen peroxide and silver) versus water as adjunct to chlorhexidine 2% aqueous bath plus povidone‐iodine aqueous 10% scrub, Outcome 1 Catheter colonisation.
| Chlorhexidine compared to povidone‐iodine for patients with a central venous catheter | |||||
| Patient or population: patients with a central venous catheter | |||||
| Outcomes | Illustrative comparative risks* (95% CI) | Relative effect | No. of Participants | Quality of the evidence | |
| Assumed risk | Corresponding risk | ||||
| Povidone‐iodine | Chlorhexidine | ||||
| Catheter‐related BSI ‐ overall comparison between chlorhexidine and povidone‐iodine (during in‐patient stay) | Study population | RR 0.64 | 1436 | ⊕⊝⊝⊝ | |
| 64 per 1000 | 41 per 1000 | ||||
| Moderatea | |||||
| 46 per 1000 | 29 per 1000 | ||||
| Catheter‐related BSI ‐ subgroup: chlorhexidine in aqueous solution versus povidone‐iodine in aqueous solution | Study population | RR 0.64 | 452 | ⊕⊝⊝⊝ | |
| 86 per 1000 | 55 per 1000 | ||||
| Moderate | |||||
| 84 per 1000 | 54 per 1000 | ||||
| Catheter‐related BSI ‐ subgroup: chlorhexidine in alcohol versus povidone‐iodine in aqueous solution | Study population | RR 0.77 | 503 | ⊕⊝⊝⊝ | |
| 70 per 1000 | 54 per 1000 | ||||
| Moderate | |||||
| 69 per 1000 | 53 per 1000 | ||||
| Catheter‐related BSI ‐ subgroup: chlorhexidine in alcohol versus povidone‐iodine in alcohol | Study population | RR 0.4 | 481 | ⊕⊕⊕⊝ | |
| 42 per 1000 | 17 per 1000 | ||||
| Moderate | |||||
| 42 per 1000 | 17 per 1000 | ||||
| Primary BSI or clinical sepsis | No studies under this comparison assessed this outcome. | ||||
| All‐cause mortality ‐ Chlorhexidine in aqueous solution versus povidone‐iodine in aqueous solution | Study population | RR 1.15 | 213 | ⊕⊕⊝⊝ | |
| 236 per 1000 | 271 per 1000 | ||||
| Moderate | |||||
| 236 per 1000 | 271 per 1000 | ||||
| All‐cause mortality ‐ Chlorhexidine in alcohol versus povidone‐iodine in aqueous solution | Study population | RR 0.8 | 222 | ⊕⊕⊝⊝ | |
| 236 per 1000 | 189 per 1000 | ||||
| Moderate | |||||
| 236 per 1000 | 189 per 1000 | ||||
| Mortality attributable the CVC‐related infections. | No studies under this comparison assessed this outcome. | ||||
| *The basis for the assumed risk (e.g. the median control group risk across studies) is provided in footnotes. The corresponding risk (and its 95% confidence interval) is based on the assumed risk in the comparison group and the relative effect of the intervention (and its 95% CI). | |||||
| GRADE Working Group grades of evidence | |||||
| a'Moderate risk' was calculated from the median control event rate for each outcome. | |||||
| Outcome or subgroup title | No. of studies | No. of participants | Statistical method | Effect size |
| 1 Catheter‐related BSI Show forest plot | 1 | 179 | Risk Ratio (M‐H, Fixed, 95% CI) | 0.99 [0.37, 2.61] |
| 2 Catheter colonisation Show forest plot | 1 | 179 | Risk Ratio (M‐H, Fixed, 95% CI) | 0.93 [0.53, 1.60] |
| Outcome or subgroup title | No. of studies | No. of participants | Statistical method | Effect size |
| 1 Septicaemia Show forest plot | 1 | 136 | Risk Ratio (M‐H, Fixed, 95% CI) | 2.91 [0.31, 27.31] |
| 2 Catheter colonisation Show forest plot | 1 | 124 | Risk Ratio (M‐H, Fixed, 95% CI) | 1.26 [0.61, 2.59] |
| 3 Number of patients who required antibiotics during in‐dwelling period of catheter Show forest plot | 1 | 136 | Risk Ratio (M‐H, Fixed, 95% CI) | 0.84 [0.55, 1.27] |
| Outcome or subgroup title | No. of studies | No. of participants | Statistical method | Effect size |
| 1 Catheter colonisation Show forest plot | 1 | 50 | Risk Ratio (M‐H, Fixed, 95% CI) | 0.75 [0.30, 1.85] |
| Outcome or subgroup title | No. of studies | No. of participants | Statistical method | Effect size |
| 1 Catheter‐related BSI Show forest plot | 4 | 1436 | Risk Ratio (M‐H, Fixed, 95% CI) | 0.64 [0.41, 0.99] |
| 1.1 Chlorhexidine in aqueous solution versus povidone‐iodine in aqueous solution | 2 | 452 | Risk Ratio (M‐H, Fixed, 95% CI) | 0.64 [0.32, 1.28] |
| 1.2 Chlorhexidine in alcohol versus povidone‐iodine in aqueous solution | 2 | 503 | Risk Ratio (M‐H, Fixed, 95% CI) | 0.77 [0.39, 1.53] |
| 1.3 Chlorhexidine in alcohol versus povidone‐iodine in alcohol | 1 | 481 | Risk Ratio (M‐H, Fixed, 95% CI) | 0.40 [0.13, 1.24] |
| 2 Catheter‐related BSI per 1000 catheter‐days Show forest plot | 4 | 1450 | Risk Ratio (Fixed, 95% CI) | 0.53 [0.30, 0.94] |
| 2.1 Chlorhexidine in aqueous solution versus povidone‐iodine in aqueous solution | 1 | 308 | Risk Ratio (Fixed, 95% CI) | 0.82 [0.23, 2.93] |
| 2.2 Chlorhexidine in alcohol versus povidone‐iodine in aqueous solution | 3 | 661 | Risk Ratio (Fixed, 95% CI) | 0.49 [0.25, 0.95] |
| 2.3 Chlorhexidine in alcohol versus povidone‐iodine in alcohol | 1 | 481 | Risk Ratio (Fixed, 95% CI) | 0.41 [0.06, 2.92] |
| 3 All‐cause mortality Show forest plot | 1 | Risk Ratio (M‐H, Fixed, 95% CI) | Subtotals only | |
| 3.1 Chlorhexidine in aqueous solution versus povidone‐iodine in aqueous solution | 1 | 213 | Risk Ratio (M‐H, Fixed, 95% CI) | 1.15 [0.72, 1.83] |
| 3.2 Chlorhexidine in alcohol versus povidone‐iodine in aqueous solution | 1 | 222 | Risk Ratio (M‐H, Fixed, 95% CI) | 0.80 [0.48, 1.34] |
| 4 Catheter colonisation Show forest plot | 5 | 1533 | Risk Difference (M‐H, Fixed, 95% CI) | ‐0.08 [‐0.12, ‐0.03] |
| 4.1 Chlorhexidine in aqueous solution versus povidone‐iodine in aqueous solution | 2 | 452 | Risk Difference (M‐H, Fixed, 95% CI) | ‐0.09 [‐0.17, ‐0.02] |
| 4.2 Chlorhexidine in alcohol versus povidone‐iodine in aqueous solution | 3 | 600 | Risk Difference (M‐H, Fixed, 95% CI) | ‐0.04 [‐0.11, 0.03] |
| 4.3 Chlorhexidine in alcohol versus povidone‐iodine in alcohol | 1 | 481 | Risk Difference (M‐H, Fixed, 95% CI) | ‐0.11 [‐0.17, ‐0.04] |
| 5 Catheter colonisation per 1000 catheter‐days Show forest plot | 5 | 1547 | Risk Ratio (Fixed, 95% CI) | 0.64 [0.50, 0.81] |
| 5.1 Chlorhexidine in aqueous solution versus povidone‐iodine in aqueous solution | 1 | 308 | Risk Ratio (Fixed, 95% CI) | 0.69 [0.40, 1.20] |
| 5.2 Chlorhexidine in alcohol versus povidone‐iodine in aqueous solution | 4 | 758 | Risk Ratio (Fixed, 95% CI) | 0.64 [0.48, 0.85] |
| 5.3 Chlorhexidine in alcohol versus povidone‐iodine in alcohol | 1 | 481 | Risk Ratio (Fixed, 95% CI) | 0.53 [0.24, 1.17] |
| 6 Insertion site infection Show forest plot | 1 | 242 | Mean Difference (IV, Fixed, 95% CI) | ‐2.80 [‐9.10, 3.50] |
| Outcome or subgroup title | No. of studies | No. of participants | Statistical method | Effect size |
| 1 Catheter‐related BSI Show forest plot | 1 | 99 | Risk Ratio (M‐H, Fixed, 95% CI) | 0.24 [0.02, 2.54] |
| 2 Catheter colonisation Show forest plot | 1 | 99 | Risk Ratio (M‐H, Fixed, 95% CI) | 0.38 [0.11, 1.33] |
| Outcome or subgroup title | No. of studies | No. of participants | Statistical method | Effect size |
| 1 Catheter‐related BSI Show forest plot | 1 | 109 | Risk Ratio (M‐H, Fixed, 95% CI) | 1.04 [0.21, 5.08] |
| 2 Catheter colonisation Show forest plot | 2 | 169 | Risk Ratio (M‐H, Fixed, 95% CI) | 1.76 [0.76, 4.09] |
| 2.1 Povidone‐iodine in aqueous solution versus alcohol | 1 | 109 | Risk Ratio (M‐H, Fixed, 95% CI) | 1.25 [0.49, 3.14] |
| 2.2 Povidone‐iodine‐impregnated adherent film versus alcohol | 1 | 60 | Risk Ratio (M‐H, Fixed, 95% CI) | 9.0 [0.51, 160.17] |
| Outcome or subgroup title | No. of studies | No. of participants | Statistical method | Effect size |
| 1 Catheter‐related BSI Show forest plot | 1 | 387 | Risk Ratio (M‐H, Fixed, 95% CI) | 2.01 [0.88, 4.59] |
| 2 Catheter‐related BSI per 1000 catheter‐days Show forest plot | 1 | 387 | Risk Ratio (Fixed, 95% CI) | 2.18 [0.54, 8.77] |
| 3 Catheter colonisation Show forest plot | 1 | 322 | Risk Ratio (M‐H, Fixed, 95% CI) | 2.26 [1.22, 4.21] |
| 4 Catheter colonisation per 1000 catheter‐days Show forest plot | 1 | 322 | Risk Ratio (Fixed, 95% CI) | 2.23 [0.79, 6.29] |
| 5 Skin colonisation Show forest plot | 1 | 365 | Mean Difference (IV, Fixed, 95% CI) | 79.00 [32.76, 125.24] |
| 6 Adverse effects Show forest plot | 1 | 398 | Risk Ratio (M‐H, Fixed, 95% CI) | 0.85 [0.60, 1.20] |
| Outcome or subgroup title | No. of studies | No. of participants | Statistical method | Effect size |
| 1 Catheter colonisation Show forest plot | 1 | 88 | Risk Ratio (M‐H, Fixed, 95% CI) | 0.19 [0.04, 0.81] |
| 2 Catheter colonisation per 1000 catheter‐days Show forest plot | 1 | 88 | Risk Ratio (Fixed, 95% CI) | 0.19 [0.06, 0.59] |
| Outcome or subgroup title | No. of studies | No. of participants | Statistical method | Effect size |
| 1 Catheter colonisation Show forest plot | 1 | 95 | Risk Ratio (M‐H, Fixed, 95% CI) | 0.15 [0.04, 0.62] |
| 2 Catheter colonisation per 1000 catheter‐days Show forest plot | 1 | 95 | Risk Ratio (Fixed, 95% CI) | 0.17 [0.05, 0.52] |
| Outcome or subgroup title | No. of studies | No. of participants | Statistical method | Effect size |
| 1 Catheter colonisation Show forest plot | 1 | 249 | Risk Ratio (M‐H, Fixed, 95% CI) | 1.08 [0.68, 1.72] |