واکسنهای آنفلوآنزا برای پیشگیری از وقوع اوتیت میانی حاد در نوزادان و کودکان
چکیده
پیشینه
اوتیت میانی حاد (acute otitis media; AOM) یکی از شایعترین بیماریهای عفونی در کودکان است. گزارش شده که 64% از نوزادان تا سن شش ماهگی و 86% تا سن یک سالگی دچار یک اپیزود از AOM میشوند. اگر چه بیشترین موارد AOM به علت عفونت باکتریال هستند؛ معمولا توسط عفونت ویروسی هم ایجاد میشوند. در اکثر کودکان، AOM خود‐محدود شونده است، اما این امر خطر عوارضی را به همراه دارد. از آنجایی که درمان با آنتیبیوتیک خطر مقاومت آنتیبیوتیک را افزایش میدهد، واکسنهای آنفلوآنزا ممکن است راهی برای کاهش این خطر از طریق پیشگیری از پیشرفت AOM باشند.
اهداف
ارزیابی اثربخشی واکسن آنفلوآنزا در کاهش وقوع اوتیت میانی حاد در نوزادان و کودکان.
روشهای جستوجو
پایگاه ثبت مرکزی کارآزماییهای کنترل شده کاکرین (CENTRAL)؛ MEDLINE؛ Embase؛ CINAHL؛ LILACS؛ Web of Science، پلتفرم بینالمللی پایگاه ثبت کارآزماییهای بالینی سازمان جهانی بهداشت و ClinicalTrials.gov (15 فوریه 2017) را جستوجو کردیم. همچنین فهرست منابع مطالعات وارد شده را برای شناسایی هر گونه کارآزمایی اضافی جستوجو کردیم.
معیارهای انتخاب
کارآزماییهای تصادفیسازی و کنترل شده که به مقایسه واکسن آنفلوآنزا با دارونما (placebo) یا عدم درمان در نوزادان و کودکان زیر شش سال پرداختند. ما کودکان را از هر دو جنس و هر قومیت، با یا بدون سابقه عود AOM وارد کردیم.
گردآوری و تجزیهوتحلیل دادهها
دو نویسنده مرور بهطور مستقل از هم مطالعات را غربالگری کرده، به ارزیابی کیفیت کارآزمایی و استخراج دادهها پرداختند. تجزیهوتحلیل آماری را با استفاده از مدلهای اثرات‐تصادفی و اثر‐ثابت انجام دادیم و نتایج را به صورت خطر نسبی (RR)، تفاوت خطر (RD)، و تعداد افراد مورد نیاز جهت درمان تا حصول یک پیامد مثبت بیشتر (number needed to treat for an additional beneficial outcome; NNTB) برای پیامدهای دو‐حالتی، با 95% فواصل اطمینان (CI) بیان کردیم.
نتایج اصلی
ما 11 کارآزمایی (6 کارآزمایی در کشورهای با سطح درآمد بالا و 5 مطالعه چند‐مرکزی در کشورهای با سطح درآمد بالا، متوسط، و پائین) را که شامل 17,123 کودک 6 ماهه تا 6 ساله بودند، وارد کردیم. هشت کارآزمایی شرکتکنندگانی را از یک مرکز مراقبت سلامت به کار گرفتند. ده کارآزمایی (و هر چهار کارآزمایی که در به دست آوردن اطلاعات پیامد اولیه کمک کردند) اعلام کردند که از تولید کنندگان واکسن حمایت مالی دریافت میکنند. چهار کارآزمایی پنهانسازی تخصیص مناسبی را گزارش کردند، و 10 کارآزمایی کورسازی مناسب شرکتکنندگان و پرسنل را گزارش کردند. ریزش نمونه (attrition) در هشت کارآزمایی وارد شده در تجزیهوتحلیل کم بود.
پیامد اولیه کاهش اندکی را در حداقل یک اپیزود از AOM در حداقل بیش از شش ماه پیگیری نشان داد (4 کارآزمایی؛ 3134 کودک؛ RR: 0.84؛ 95% CI؛ 0.69 تا 1.02؛ RD: ‐0.04؛ 95% CI؛ 0.08‐ تا 0.00‐؛ NNTB: 25؛ 95% CI؛ 12.5 تا 100؛ شواهد با کیفیت پائین).
تجزیهوتحلیل زیر‐گروهها (یعنی تعداد دورهها و انواع واکسن تجویز شده) هیچ تفاوتی را نشان ندادند.
در استفاده از آنتیبیوتیک در کودکان واکسینه شده کاهش وجود داشت (2 کارآزمایی؛ 1223 کودک؛ RR: 0.70؛ 95% CI؛ 0.59 تا 0.83؛ RD: ‐0.11؛ 95% CI؛ 0.16‐ تا 0.06‐؛ شواهد با کیفیت متوسط).
ما نتوانستیم نشان دهیم که در استفاده از خدمات مراقبت سلامت تفاوت وجود داشته یا خیر. استفاده از واکسن آنفلوآنزا موجب افزایش قابل توجهی در تب (7 کارآزمایی؛ 10,615 کودک؛ RR: 1.15؛ 95% CI؛ 1.06 تا 1.24؛ RD: 0.02؛ 95% CI؛ 0.00 تا 0.04؛ شواهد با کیفیت پائین)، رینوره (rhinorrhoea)؛ (6 کارآزمایی؛ 10,563 کودک؛ RR: 1.17؛ 95% CI؛ 1.07 تا 1.29؛ RD: 0.09؛ 95% CI؛ 0.01 تا 0.16؛ شواهد با کیفیت پائین) شد؛ اما هیچ تفاوتی در وقوع فارنژیت وجود نداشت. هیچ گونه حوادث جانبی عمدهای گزارش نشد.
جدا از پروتکل، انتشار اصلی این مرور شامل تجزیهوتحلیل زیر‐گروه اپیزودهای AOM طی فصل آنفلوآنزا بود، و پیامد ثانویه «انواع واکسن آنفلوآنزا» در تجزیهوتحلیل زیر‐گروه تغییر یافت. برای بهروز کردن این مرور، تجزیهوتحلیل زیر‐گروه مربوط به شرایط کارآزمایی، فصل، و استفاده از خدمات مراقبت سلامت را به دلیل تعداد کم کارآزماییها از مرور خارج کردیم. ما Belshe 2000 را از پیامدهای اولیه و ثانویه (دوره واکسن و انواع واکسن) حذف کردیم زیرا اپیزودهای AOM را در هر فرد گزارش کرد. تجزیهوتحلیل زیر‐گروه را بر اساس نوع حادثه جانبی انجام ندادیم. هر نوع حادثه جانبی را به صورت تجزیهوتحلیل جداگانه گزارش کردیم.
نتیجهگیریهای نویسندگان
واکسن آنفلوآنزا منجر به کاهش اندکی در رخداد AOM شد. کاهش قابل مشاهده در استفاده از آنتیبیوتیکها نیاز به بررسی اقدامات توصیه شده فعلی با هدف پیشگیری از مصرف بیش از حد آنتیبیوتیک دارد. دادههای ایمن به دست آمده از این کارآزماییها محدود بود. این مزایا ممکن است استفاده از واکسن آنفلوآنزا را بدون در نظر گرفتن اثربخشی واکسن در کاهش آنفلوآنزا و دادههای ایمن توجیه ننماید. کیفیت شواهد را پائین تا متوسط قضاوت کردیم. پژوهش بیشتری مورد نیاز است.
PICO
خلاصه به زبان ساده
واکسن آنفلوآنزا برای پیشگیری از اوتیت میانی حاد (عفونت گوش میانی)
سوال مطالعه مروری
ما تاثیر واکسن آنفلوآنزا را در پیشگیری از اوتیت میانی حاد (acute otitis media; AOM) در نوزادان و کودکان مرور کردیم.
پیشینه
اوتیت میانی حاد یکی از شایعترین بیماریهای عفونی در نوزادان و کودکان پیشدبستانی است. نشانهها عبارتند از درد گوش و تب، اما ممکن است به علت سوراخ شدن پرده گوش یا تجمع مایع در گوش میانی، باعث از دست دادن شنوایی نیز بشود. این بیماری معمولا منشاء باکتریایی دارد و اغلب با آنتیبیوتیکهایی درمان میشود، که ممکن است خطر مقاومت آنتیبیوتیکی را به همراه داشته باشند. با این حال، AOM اغلب قبل از عفونت ویروسی مانند آنفلوآنزا پیش میآید. پیشگیری از عفونتهای ویروسی ممکن است از AOM پیشگیری کند. بنابراین، این موضوع را که واکسنهای آنفلوآنزا ممکن است وقوع AOM را در نوزادان و کودکان کاهش دهند بررسی کردیم.
ویژگیهای مطالعه
شواهد تا 15 فوریه 2017 بهروز است. ما کارآزماییهای تصادفیسازی و کنترل شدهای را وارد کردیم که به مقایسه واکسن آنفلوآنزا با دارونما (placebo) یا عدم درمان در نوزادان و کودکان شش ماه تا شش سال، با یا بدون سابقه اپیزودهای قبلی AOM پرداختند. ما 11 کارآزمایی را شامل 17,123 کودک وارد کردیم. ده کارآزمایی از 11 کارآزمایی توسط تولید کننده واکسن حمایت مالی شدند.
نتایج کلیدی
ما 4% کاهش در AOM و تقریبا 11% کاهش در تعداد تجویزهای آنتیبیوتیک یافتیم. در تعداد دورهها یا انواع واکسن تجویز شده بین افراد واکسینه شده و افراد واکسینه نشده تفاوتی وجود نداشت. عوارض جانبی واکسن آنفلوآنزا عبارت بود از افزایش تب، آبریزش بینی، و خوابآلودگی. این موضوع که واکسن آنفلوآنزا ویزیت یا پذیرش را در مراکز مراقبت سلامت کاهش میدهد، هنوز هم نامطمئن است. دادهها برای نشان دادن اینکه این مزیت ممکن است در برابر بسیاری از عوارض جانبی جدیتر یا نادرتر واکسن تعادل ایجاد کند، ناکافی بود.
اگر چه، کاهش در مصرف آنتیبیوتیک را مشاهده کردیم، این تاثیر نامطمئن است، زیرا کار عملی حاضر نیز بر پیشگیری از مصرف بیش از حد آنتیبیوتیکها بنا نهاده شده است. همراه با سایر مشکلات مربوط به ایمنی واکسن، استفاده از واکسن آنفلوآنزا برای کاهش AOM هنوز قابل توجیه نیست، و پژوهش بیشتری مورد نیاز است.
کیفیت شواهد
کیفیت کلی شواهد پائین تا متوسط بود.
Authors' conclusions
Summary of findings
| Influenza vaccine compared to control for preventing acute otitis media in infants and children | ||||||
| Patient or population: infants and children | ||||||
| Outcomes | Anticipated absolute effects* (95% CI) | Relative effect | № of participants | Quality of the evidence | Comments | |
| Risk with control | Risk with influenza vaccine | |||||
| At least 1 episode of acute otitis media | Study population | RR 0.84 | 3134 | ⊕⊕⊝⊝ | The basis for the assumed risk is the mean risk in the control group across the included studies. There was moderate unexplained inconsistency across the studies. We downgraded for inconsistency. The effect estimates were all in the same direction, but there was uncertainty in the confidence of the effect estimate. | |
| 292 per 1000 | 245 per 1000 | |||||
| Courses of antibiotics | Study population | RR 0.70 | 1223 | ⊕⊕⊕⊝ | Assumed risk calculated from the mean risk across the control groups of the 2 included studies | |
| 362 per 1000 | 254 per 1000 | |||||
| Fever | Study population | RR 1.15 | 10,615 | ⊕⊕⊝⊝ | Assumed risk calculated from the mean risk across the control groups of the 7 included studies | |
| 174 per 1000 | 200 per 1000 | |||||
| Rhinorrhoea | Study population | RR 1.17 | 10,563 | ⊕⊕⊝⊝ | Assumed risk calculated from the mean risk across the control groups of the 6 included studies | |
| 424 per 1000 | 496 per 1000 | |||||
| Pharyngitis | Study population | RR 1.00 | 4429 | ⊕⊕⊝⊝ | Assumed risk calculated from the mean risk across the control groups of the 3 included studies | |
| 71 per 1000 | 71 per 1000 | |||||
| *The basis for the assumed risk (e.g. the median control group risk across studies) is provided in footnotes. The corresponding risk (and its 95% confidence interval) is based on the assumed risk in the comparison group and the relative effect of the intervention (and its 95% CI). | ||||||
| GRADE Working Group grades of evidence | ||||||
| 1Includes trial(s) at high risk of publication bias. | ||||||
Background
Description of the condition
Acute otitis media (AOM) is one of the most common infectious diseases in children. Eighty per cent of children in high‐income countries experienced at least one episode of AOM by the age of three years (Vergison 2010). With the advent of the pneumococcal conjugate vaccine (PCV), two clinical trials showed a reduction of 7%, Fireman 2003, and 6%, Eskola 2001, in otitis media rates. The rate of ambulatory visits for otitis media also declined by between 6% and 20% in children aged less than two years after the introduction of PCV in the United States vaccination programme, with no significant decrease in outpatient visit rates for pneumonia or other acute respiratory infections (Grijalva 2006; Marom 2014; Poehling 2004).
'Otitis media' is a broad term for any middle ear infection or inflammation. It can present as (i) otitis media with effusion (OME): fluid behind an intact tympanic membrane without the symptoms or signs of AOM; (ii) AOM: fluid behind the tympanic membrane with the symptoms or signs of an acute infection; or (iii) chronic suppurative otitis media (CSOM): persistent discharge of pus through a perforated tympanic membrane for more than six weeks (Leach 2011). Several risk factors for AOM have been identified, such as siblings with otitis media, bottle‐feeding, attending day‐care centres, allergies to environmental entities, belonging to a low socioeconomic group, exposure to tobacco smoke, and family history of otitis media (Erdivanli 2012; Siddartha 2012).
In the past, AOM was generally considered to be viral, but with optimal bacteriological techniques and a good diagnosis it has been shown that over 87% of AOM cases are bacterial in origin (Block 1995; Heikkinen 2003), but commonly triggered by a viral infection. In a 14‐year cohort study among children attending day care, viral pathogens, especially respiratory syncytial virus, influenza virus, and adenovirus, conferred a greater risk of developing AOM (Henderson 1982; Jacobs 1998). Respiratory viruses were isolated in 42% of middle ear fluid specimens from children with AOM (Monobe 2003), and influenza viruses accounted for up to 28.4% of viral detections (Yano 2009).
A Cochrane Review showed that antibiotics reduced tympanic membrane perforations and contralateral AOM episodes. However, adverse events such as vomiting, diarrhoea, and rash were more common in children who received antibiotics (Venekamp 2015). A separate Cochrane Review showed that administration of short‐course antibiotics (less than seven days) increased the likelihood of relapse and recurrence (Kozyrskyj 2010). The findings of these reviews have led to guidelines recommending limiting or delaying the use of antibiotics, and a policy of 'watchful waiting' has been recommended for some children (Lieberthal 2013). Antibiotics given for six weeks or longer reduced the risk of future episodes of AOM by 50%, with no significant reported side effects such as allergic reactions and diarrhoea (Leach 2011). Antibiotics for OME given continuously for four weeks and three months have shown beneficial effects (Venekamp 2016). However, the issue of antibiotic resistance needs to be considered.
Acute otitis media is clinically diagnosed based on a history of acute onset, signs and symptoms of middle ear inflammation, and presence of middle ear effusion with either a bulging tympanic membrane, decreased mobility, or an air‐fluid level. Determination of some of the criteria may necessitate the use of pneumatic otoscopy to demonstrate a decrease in tympanic membrane mobility (Lieberthal 2004).
Description of the intervention
There are two types of influenza vaccine: trivalent inactivated influenza vaccine (TIV) and live attenuated influenza vaccine (LAIV). Trivalent inactivated influenza vaccine is approved for children as young as six months, and LAIV, which is based on cold‐adapted, temperature‐sensitive vaccine viruses, is approved for children aged two years or older. Annual influenza vaccination is recommended for all children aged six months to eight years. If the children have not been previously vaccinated, two doses four weeks apart are recommended. If the child was vaccinated the previous year, the child will receive only one vaccine dose. However, the recommendations regarding the number of doses might change if vaccine antigens change (CDC 2011).
Cochrane Reviews reported that in preventing influenza among children aged more than two years, live influenza vaccines showed a higher efficacy than inactivated influenza vaccines (82% versus 59%), while in preventing influenza‐like illness, the effectiveness was similar (33% versus 36%). Little evidence is available for children younger than two years (Jefferson 2012). A modest effect of the vaccine on influenza was reported in the general population (Jefferson 2014).
A report by the Institute of Medicine looking at 27 adverse events showed that only one study supported a causal relationship between influenza vaccine and anaphylaxis; one study supported a causal relationship for oculo‐respiratory syndrome; and two studies supported rejection of a causal relationship for Bell's palsy and asthma exacerbation or reactive airway disease episodes. The evidence for the remaining 23 adverse events (85%) was insufficient to support or reject a causal link due to weak or absent methodology (Stratton 2011).
How the intervention might work
A Cochrane Review revealed that pneumococcal vaccine had marginally beneficial effects for preventing AOM (Fortanier 2014). However, since AOM is often preceded by a viral infection, it is possible that influenza vaccines might be effective in preventing the development of AOM.
Why it is important to do this review
The Advisory Committee on Immunization Practices (ACIP) has recommended influenza vaccination for all children aged six months or older in the USA (CDC 2011). There are many factors that influence parents' decisions whether or not to vaccinate their child (Bhatt 2011). Information on the effect of influenza vaccine on AOM might help parents in this decision. The aim of this review was therefore to report the effect of influenza vaccine on the occurrence of AOM in infants and children.
Objectives
To assess the effectiveness of influenza vaccine in reducing the occurrence of acute otitis media (AOM) in infants and children.
Methods
Criteria for considering studies for this review
Types of studies
Randomised controlled trials comparing influenza vaccine with placebo or no treatment. We included blinded and open‐label studies.
Types of participants
Infants and children aged younger than six years old of either sex and of any ethnicity, with or without a history of recurrent AOM.
Types of interventions
Vaccination with any influenza vaccine, live or inactivated, and whole, split‐virus, or subunit‐type vaccines. Vaccines may be monovalent or polyvalent, single dose or multidose, and administered by any route of administration.
Comparison: placebo or no treatment.
Types of outcome measures
Acute otitis media must be clinician diagnosed. We excluded studies in which diagnosis of AOM was based on the child or carer report alone. The follow‐up period for primary outcomes was at least six months after vaccination.
Primary outcomes
-
Number of children having at least one episode of AOM during the follow‐up period.
-
Number of episodes of AOM recorded during the follow‐up period.
Secondary outcomes
-
Use of antibiotics to treat AOM and its complications.
-
Causative organism associated with AOM.
-
Utilisation of healthcare and related resources.
-
Number of culture‐confirmed influenza cases.
-
Adverse events (e.g. febrile illness).
Search methods for identification of studies
Electronic searches
We searched:
-
the Cochrane Central Register of Controlled Trials, which includes the Cochrane Acute Respiratory Infections Group's Specialised Register (CENTRAL; 2017, Issue 1) in the Cochrane Library (searched 15 February 2017);
-
MEDLINE Ovid (1946 to 15 February 2017);
-
Embase.com (1947 to 15 February 2017);
-
CINAHL (Cumulative Index to Nursing and Allied Health Literature) (1981 to 15 February 2017);
-
LILACS (Latin American and Caribbean Health Sciences Literature) (1982 to 15 February 2017);
-
Web of Science (1955 to 15 February 2017).
We used the search strategy in Appendix 1 to search MEDLINE and CENTRAL. We combined the MEDLINE search strategy with the Cochrane Highly Sensitive Search Strategy for identifying randomised trials in MEDLINE: sensitivity‐ and precision‐maximising version (2008 revision); Ovid format (Lefebvre 2011). We adapted the search strategy for Embase (Appendix 2), CINAHL (Appendix 3), LILACS (Appendix 4), and Web of Science (Appendix 5). We did not impose any language or publication restrictions.
We searched for completed and ongoing trials in two trial registries:
-
World Health Organization (WHO) International Clinical Trials Registry Platform (ICTRP) (www.who.int/ictrp/en/; searched 15 February 2017).
-
US National Institutes of Health Ongoing Trials Register ClinicalTrials.gov (www.clinicaltrials.gov; searched 15 February 2017).
Searching other resources
We checked the reference lists of all related studies for further references in order to find unpublished trials or trials not identified by the electronic searches. We contacted pharmaceutical companies that market influenza vaccine to identify other related unpublished trials and ongoing trials.
Data collection and analysis
Selection of studies
Two review authors (MNN, MYA) independently scanned the titles and abstracts identified by the searches, obtaining the full‐text articles for records that appeared to meet the eligibility criteria or for which information was insufficient to assess eligibility. We independently assessed the eligibility of the trials and documented the reasons for exclusion. Any disagreements were resolved between the review authors by discussion. We contacted the trial authors for clarification where required. We translated papers in languages other than English with the help of the Cochrane Acute Respiratory Infections Group.
Data extraction and management
We extracted the following from each of the selected studies:
-
study setting;
-
participant characteristics (age, sex, ethnicity);
-
methodology (number of participants randomised and analysed, duration of follow‐up);
-
type of vaccine used;
-
method for diagnosing AOM;
-
occurrence of AOM and middle ear effusion;
-
antibiotics used to treat AOM and its complications;
-
causative organism associated with AOM;
-
utilisation of healthcare and related resources;
-
number of culture‐confirmed influenza cases; and
-
occurrence of adverse events related to influenza vaccine (e.g. febrile illnesses).
We resolved any disagreements by discussion.
Assessment of risk of bias in included studies
We assessed the risk of bias based on random sequence generation, allocation concealment, blinding of participants and personnel, blinding of outcome assessors, completeness of outcome data, selectivity of outcome reporting, and other bias, as described in the Cochrane Handbook for Systematic Reviews of Interventions (Higgins 2011).
Measures of treatment effect
We measured the trials with categorical outcomes using risk ratios (RR) and 95% confidence intervals (CI) and calculated risk differences (RD) and 95% CI. We calculated the number needed to treat for an additional beneficial outcome (NNTB) along with a 95% CI for the first primary outcome. Had we encountered numerical outcomes, we intended to analyse these using mean differences (MD) and 95% CI.
Unit of analysis issues
We checked included trials for unit of analysis errors and did not encounter any. Had we encountered any cluster‐randomised controlled trials, we intended to adjust the results from trials showing unit of analysis errors based on the mean cluster size and intracluster correlation coefficient (Higgins 2011).
Dealing with missing data
We contacted the original trial authors to request missing or inadequately reported data (Bergen 2004; Kosalaraksa 2015). We performed analyses on the available data in the event that missing data were not available.
Assessment of heterogeneity
We assessed the presence of heterogeneity in two steps. First, we assessed obvious heterogeneity at face value by comparing populations, settings, interventions, and outcomes. Second, we assessed statistical heterogeneity by means of the I² statistic (Higgins 2011).
Assessment of reporting biases
If there were sufficient studies, we intended to use funnel plots to assess the possibility of reporting biases or small‐study biases, or both.
Data synthesis
We examined heterogeneity using both fixed‐effect and random‐effects models, depending on the degree of significant clinical or statistical heterogeneity, in Review Manager 5 software (RevMan 2014). Our results are reported with the fixed‐effect model unless it is stated that we have used the random‐effects model. Thresholds for the interpretation of the I² statistic can be misleading, since the importance of inconsistency depends on several factors. We used the guide to interpret heterogeneity as outlined in the Cochrane Handbook for Systematic Reviews of Interventions (Higgins 2011): 0% to 40% might not be important; 30% to 60% may represent moderate heterogeneity; 50% to 90% may represent substantial heterogeneity; and 75% to 100% would be considerable heterogeneity.
GRADE and 'Summary of findings' table
We created a 'Summary of findings' table using the following outcomes: at least one episode of AOM; courses of antibiotics; fever; rhinorrhoea; and pharyngitis.
We used the five GRADE considerations (study limitations, consistency of effect, imprecision, indirectness, and publication bias) to assess the quality of a body of evidence as it relates to the studies that contribute data to the meta‐analyses for the prespecified outcomes (Atkins 2004). We used methods and recommendations described in Section 8.5 and Chapter 12 of the Cochrane Handbook for Systematic Reviews of Interventions (Higgins 2011), employing GRADEpro GDT software (GRADEpro 2014). We justified all decisions to down‐ or upgrade the quality of studies using footnotes, and made comments to aid the reader's understanding of the review where necessary.
Subgroup analysis and investigation of heterogeneity
We planned the following subgroup analyses:
-
age of children, e.g. above and below two years old;
-
first episode and recurrence of AOM;
-
day‐care and non‐day‐care children;
-
type and route of vaccine administration.
We were unable to carry out all of the subgroup analyses in the categories outlined in the protocol due to insufficient data. However, we conducted subgroup analyses on number of children having at least one episode of AOM by course and type of vaccine.
In the original publication of this review we included a subgroup analysis on number of children having at least one episode of AOM by setting and season. We also included subgroup analysis by utilisation of health care, that is hospital admission and patient visits to primary care and the emergency department, because this might differ between different healthcare settings. For example, in some settings, users might be more likely to be hospitalised for relatively minor adverse effects. We specified the subgroup analyses in order to explore this as a possible reason for heterogeneity.
We did not perform a subgroup analysis by type of adverse event, but have reported each type of adverse event in the included studies as a separate analysis.
We explored the potential sources of heterogeneity. When important heterogeneity was present, we use a random‐effects model (DerSimonian 1986).
Sensitivity analysis
We performed a sensitivity analysis to investigate the impact of risk of bias for sequence generation and allocation concealment of included studies.
Results
Description of studies
See: Characteristics of included studies, Characteristics of excluded studies, and Characteristics of studies awaiting classification tables.
Results of the search
In the original publication of this review, we retrieved 319 records from the search of the electronic databases and 12 records from other sources (Figure 1). We screened a total of 331 records. We reviewed full copies of 28 studies, of which 14 articles possibly met the review inclusion criteria and 14 were not eligible for inclusion. Three of those not eligible for inclusion were systematic reviews and meta‐analyses that were related to our research question (Block 2011; Heikkinen 2013; Prutsky 2014). We categorised one trial as awaiting classification, as it included children aged one to eight years (Bergen 2004); we contacted the trial authors for further information on the age group of study participants. Two trials were not eligible as they were quasi‐randomised (Cuhaci 2012; Heikkinen 1991). We therefore included 10 trials and excluded 12 trials from the initial review, while one trial awaited classification.

Study flow diagram.
In this 2017 update, we excluded a study previously awaiting classification because it included children aged one to eight years, and we were not able to ascertain the number or proportion of children below six years of age (Bergen 2004). We retrieved 32 additional records from the search of the electronic databases and four records from other sources. We screened a total of 33 records. We reviewed the full texts of seven studies, identifying one trial as meeting the review inclusion criteria (Kosalaraksa 2015), and six as not eligible for inclusion. We have therefore included a total of 11 trials and excluded 19 trials in this review update.
Included studies
We included 10 trials (N = 16,707) in the initial review (Belshe 2000; Bracco 2009; Clements 1995; Gruber 1996; Hoberman 2003; Lum 2010; Marchisio 2002; Swierkosz 1994; Tam 2007; Vesikari 2006), and added one further trial (N = 416) in this update (Kosalaraksa 2015), resulting in a total of 11 included studies involving 17,123 children. Ten out of the 11 included studies (and all five that contributed to the primary outcome) declared funding from vaccine manufacturers (Belshe 2000; Bracco 2009; Clements 1995; Gruber 1996; Hoberman 2003; Kosalaraksa 2015; Lum 2010; Marchisio 2002; Tam 2007; Vesikari 2006).
Participants
Six of the 11 trials were conducted in high‐income countries (Clements 1995; Gruber 1996; Hoberman 2003; Marchisio 2002; Swierkosz 1994; Vesikari 2006) and five were multicentre trials in high‐, middle‐, and low‐income countries (Belshe 2000; Bracco 2009; Kosalaraksa 2015; Lum 2010; Tam 2007). Eight of the 11 trials recruited participants from healthcare settings (Belshe 2000; Bracco 2009; Gruber 1996; Hoberman 2003; Lum 2010; Marchisio 2002; Tam 2007; Vesikari 2006), and one trial recruited participants from day‐care centres (Clements 1995). Two trials did not mention the setting from which the participants were recruited (Kosalaraksa 2015; Swierkosz 1994). Nine trials reported exclusion of participants due to an acute illness, immunosuppression or receiving medications known to suppress the immune system, or with craniofacial abnormality (Belshe 2000; Bracco 2009; Clements 1995; Hoberman 2003; Kosalaraksa 2015; Lum 2010; Marchisio 2002; Tam 2007; Vesikari 2006). Seven trials involving 8154 children mentioned the sex of the children, and these were equally distributed throughout the seven trials and across the intervention and comparison groups (Clements 1995; Hoberman 2003; Kosalaraksa 2015; Lum 2010; Marchisio 2002; Tam 2007; Vesikari 2006). For one trial, the denominator (number of children who had the outcome measured) was unclear, so we used the number randomised as the denominator based on the intention‐to‐treat principle (Clements 1995).
Intervention
Participants in the trials were randomised into intervention and control groups. The intervention was a trivalent vaccine in six trials (Belshe 2000; Clements 1995; Hoberman 2003; Swierkosz 1994; Tam 2007; Vesikari 2006), reassortant in two trials (Bracco 2009; Lum 2010), and a combination of monovalent and bivalent in one trial (Gruber 1996). Live attenuated vaccine was administered in seven trials (Belshe 2000; Bracco 2009; Gruber 1996; Lum 2010; Swierkosz 1994; Tam 2007; Vesikari 2006), virosomal subunit in one trial (Marchisio 2002), subvirion in two trials (Clements 1995; Hoberman 2003), and split virion in one trial (Kosalaraksa 2015). The vaccines were administered intranasally in seven trials (Belshe 2000; Bracco 2009; Gruber 1996; Marchisio 2002; Swierkosz 1994; Tam 2007; Vesikari 2006), intramuscularly in two trials (Hoberman 2003; Kosalaraksa 2015), and subcutaneously in one trial (Lum 2010). Five trials gave a single course of one to three doses (Clements 1995; Gruber 1996; Lum 2010; Marchisio 2002; Swierkosz 1994), and six trials gave two courses, where the first course was either one or two doses and the second course was a single dose given six months to one year later (Belshe 2000; Bracco 2009; Hoberman 2003; Kosalaraksa 2015; Tam 2007; Vesikari 2006). For those trials that gave two courses, follow‐up was reported for at least six months after each course was completed.
Outcomes
Eight trials reported measuring the number of children with at least one episode of AOM during follow‐up (Bracco 2009; Clements 1995; Gruber 1996; Hoberman 2003; Lum 2010; Marchisio 2002; Swierkosz 1994; Vesikari 2006). However, only three trials met our prespecified duration of follow‐up of at least six months (Hoberman 2003; Lum 2010; Vesikari 2006). We included one additional trial with a five‐month follow‐up period in the review (Clements 1995). This trial was conducted in a setting that had a distinct respiratory season, and the children were followed up for the respiratory season, which explained the shorter follow‐up. Our primary outcomes were reported. We made a post hoc decision to include this trial despite not quite reaching our inclusion criteria of six months' follow‐up, testing this decision in our sensitivity analysis. The remaining trials all had short follow‐up periods of eight weeks or less, therefore we excluded the primary outcome data and only reported secondary outcomes from these trials. One trial randomised children into one of four regimens: (i) two doses of LAIV; (ii) single‐dose LAIV; (iii) excipient placebo; or (iv) saline placebo with six to 36 months' follow‐up (Bracco 2009). However, the numbers of children in group (iii) and (iv) were not reported, therefore we could not include this trial in the meta‐analysis. We included four trials in the meta‐analysis for the primary outcomes (Clements 1995; Hoberman 2003; Lum 2010; Vesikari 2006). One trial involving 1602 children reported the mean episodes per person without a measure of dispersion that could be used to calculate the standard deviation, hence we were unable to analyse this outcome (Belshe 2000). For those trials that gave two courses of vaccine, we reported the first primary outcome for the follow‐up period after the first course (Belshe 2000; Hoberman 2003; Vesikari 2006), which we felt allowed for better consistency across the included trials. However, we have also included a subgroup analysis of the first primary outcome by number of courses.
Ten trials reported our secondary outcomes (Belshe 2000; Bracco 2009; Gruber 1996; Hoberman 2003; Kosalaraksa 2015; Lum 2010; Marchisio 2002; Swierkosz 1994; Tam 2007; Vesikari 2006). One trial randomised children in a 3:2 ratio to receive two doses of vaccine or placebo in year one, and re‐randomised children in year two in a 1:1 ratio to receive a single dose of vaccine or placebo without consideration of their group assignment in the first year (Tam 2007). The findings were therefore obtained cumulatively from both years.
Excluded studies
We excluded 19 trials. Ten trials did not report any of our outcomes of interest (Belshe 1998; Belshe 2007; Esposito 2003; Forrest 2008; Gruber 1997; Longini 2000; Maeda 2004; Principi 2003; Thors 2016; Vesikari 2011). Three trials compared different types of influenza vaccine (Brady 2014; Langley 2015; Loeb 2016), and five trials had no control group (Ashkenazi 2006; Brady 2014; Houdouin 2016; Langley 2015; Loeb 2016). Two trials applied quasi‐randomisation (Cuhaci 2012; Heikkinen 1991), and one trial compared a single dose with two doses of influenza vaccine (Han 2015). We excluded one trial because the data for the number or proportion of children aged less than six years were not available (Bergen 2004). The details of these trials are provided in the Characteristics of excluded studies table.
Risk of bias in included studies
The assessment of risk of bias is shown in Figure 2 and Figure 3. Figure 2 shows the proportion of studies assessed as low, high, or unclear risk of bias for each 'Risk of bias' indicator. Figure 3 shows the 'Risk of bias' indicators for individual studies. See the Characteristics of included studies table.

'Risk of bias' graph: review authors' judgements about each risk of bias item presented as percentages across all included studies.
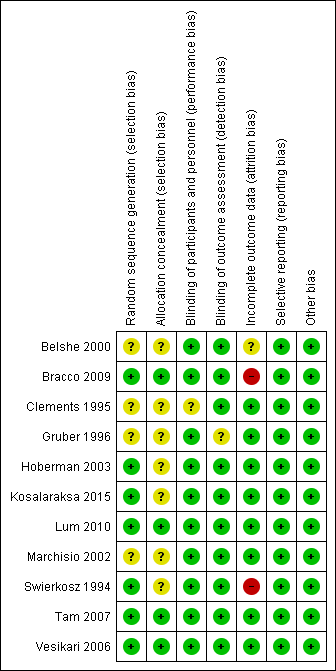
'Risk of bias' summary: review authors' judgements about each risk of bias item for each included study.
Allocation
Seven trials (including one trial of 2821 children not in the meta‐analysis, Bracco 2009) described the method of randomisation used. Two trials randomised the children according to a preprinted allocation list (Bracco 2009; Vesikari 2006); three trials used computer‐generated randomisation (Hoberman 2003; Lum 2010; Tam 2007); and one trial used an internet‐based system (Kosalaraksa 2015). Swierkosz 1994 applied a simple randomisation with a ratio of one placebo to every two or three children who received the intervention. The remaining four trials did not report the method of randomisation, thus we assessed random sequence generation as unclear risk of bias (Belshe 2000; Clements 1995; Gruber 1996; Marchisio 2002). We assessed allocation concealment as unclear in seven trials (Belshe 2000; Clements 1995; Gruber 1996; Hoberman 2003; Kosalaraksa 2015; Marchisio 2002; Swierkosz 1994).
Blinding
Nine trials used a placebo control (Belshe 2000; Bracco 2009; Gruber 1996; Hoberman 2003; Kosalaraksa 2015; Lum 2010; Swierkosz 1994; Tam 2007; Vesikari 2006), and one trial gave no treatment to the control group (Marchisio 2002). In the latter trial, the parents were asked not to inform the outcome assessors of the group assignment, and only the investigators were blinded to group assignment (Marchisio 2002). The control group in one trial received hepatitis B immunisation, and blinding was not described in this trial (Clements 1995).
Incomplete outcome data
Five trials measured the primary outcomes and were included in the meta‐analysis. Of these, three trials administered two courses of vaccine, that is at year one (one or two doses) and year two (single dose) (Belshe 2000; Hoberman 2003; Vesikari 2006), and two trials administered one course of vaccine (one or two doses) (Clements 1995; Lum 2010). Five trials measured the primary outcome at six to eight months (Belshe 2000; Clements 1995; Hoberman 2003; Lum 2010; Vesikari 2006), and one trial measured outcomes at one year (Hoberman 2003). All five trials had less than 20% loss to follow‐up.
We did not include Bracco 2009 in the meta‐analysis for the first primary outcome as the follow‐up period was too short. Due to the treatment allocation coding and a labelling error in the second season, 683 of 2054 children were excluded because they received a treatment other than that to which they were randomised. Thus, the year two per‐protocol response rate was 42.6%. However, data on adverse effects for the second season were supplied by the trial authors and could be included in the meta‐analysis of adverse effects. Ten trials measured secondary outcomes, and in all of these the non‐response rate was less than 10% (Belshe 2000; Bracco 2009; Gruber 1996; Hoberman 2003; Kosalaraksa 2015; Lum 2010; Marchisio 2002; Swierkosz 1994; Tam 2007; Vesikari 2006).
Eight trials performed an intention‐to‐treat analysis in which the children were analysed according to the groups to which they were initially assigned (Belshe 2000; Bracco 2009; Clements 1995; Hoberman 2003; Lum 2010; Marchisio 2002; Tam 2007; Vesikari 2006). In Gruber 1996, 182 children were assigned into vaccine and control groups. However, the analysis of two vaccinated children was not included. In Swierkosz 1994, the analyses were based on 22, 18, and 14 children for day 0, day 60, and day 120, respectively.
Selective reporting
All 11 trials reported the outcomes as specified in their methods section (Belshe 2000; Bracco 2009; Clements 1995; Gruber 1996; Hoberman 2003; Kosalaraksa 2015; Lum 2010; Marchisio 2002; Swierkosz 1994; Tam 2007; Vesikari 2006).
Only two trials were prospectively registered in the WHO ICTRP and ClinicalTrials.gov (Kosalaraksa 2015; Lum 2010). The outcomes listed in the registered protocols were the same as those reported. We had no access to protocols for nine trials, but all the expected outcomes were reported (Belshe 2000; Clements 1995; Gruber 1996; Hoberman 2003; Lum 2010; Marchisio 2002; Swierkosz 1994; Tam 2007; Vesikari 2006).
Other potential sources of bias
We detected no other potential sources of bias.
Effects of interventions
Primary outcomes
1. Number of children having at least one episode of acute otitis media during the follow‐up period
Our prespecified outcome was number of children having at least one episode of AOM. Four trials reported at least one episode of AOM during a follow‐up period of at least six months after one course of vaccine (Clements 1995; Hoberman 2003; Lum 2010; Vesikari 2006) (Analysis 1.1; risk ratio (RR) 0.84, 95% confidence interval (CI) 0.69 to 1.02; risk difference (RD) ‐0.04, 95% CI ‐0.08 to 0.00 random‐effects; I² = 56%, number needed to treat for an additional beneficial outcome (NNTB) 25, 95% CI 12.5 to 100; 4 trials; 3134 children; low‐quality evidence).
Acute otitis media by courses of vaccine
Four trials reported at least one episode of AOM during a follow‐up period of at least six months after the first course of vaccine, and these were included in our primary analysis as above (Analysis 1.1) (Clements 1995; Hoberman 2003; Lum 2010; Vesikari 2006). There was no difference in this outcome by the number of doses (one or two doses in the first course) of vaccine. For those trials that included two courses of vaccine, two trials involving 1447 children showed no difference between the influenza vaccine and control group in AOM during the follow‐up period after the second course (Analysis 1.2) (Hoberman 2003; Vesikari 2006).
Acute otitis media by trial setting
Recruitment for three trials took place in the healthcare setting (Hoberman 2003; Lum 2010; Vesikari 2006), and for one trial in a day‐care setting (Clements 1995). Due to the small number of studies in this subgroup, we did not do a subgroup analysis by trial setting for this update of the review.
Acute otitis media by season
Two trials documented this outcome according to season, either the respiratory or the influenza season. The vaccine was administered at the beginning of the season in two trials (Clements 1995; Hoberman 2003). One trial reported AOM during the respiratory season (Hoberman 2003). We did not perform a subgroup analysis due to the limited number of studies reporting season.
Acute otitis media by type of vaccine
Of the four studies that reported the outcome of at least one episode of AOM during the follow‐up period, only two types of vaccine were used, trivalent cold‐adapted vaccine, in Lum 2010 and Vesikari 2006, and trivalent subvirion vaccines, in Clements 1995 and Hoberman 2003. There was substantial heterogeneity in the two subgroups and in the overall result. The two subgroups failed to show a difference in AOM, and there was no significant difference between the subgroups (Analysis 1.3).
2. Number of episodes of acute otitis media recorded during the follow‐up period
One trial involving 396 children reported this outcome but without a measure of variance, hence we were unable to analyse this outcome (Hoberman 2003).
Secondary outcomes
1. Use of antibiotics to treat acute otitis media and its complications
Two trials reported the number of children who received any antibiotics over the follow‐up period (Marchisio 2002; Vesikari 2006). Marchisio 2002 (N = 133) reported antibiotics prescribed for AOM, and Vesikari 2006 (N = 1090) reported antibiotics prescribed for influenza‐like illness including AOM (Analysis 1.4; 2 trials; 1223 children; RR 0.70, 95% CI 0.59 to 0.83; RD ‐0.11, 95% CI ‐0.16 to ‐0.06; I² = 0%; moderate‐quality evidence). One trial reported the mean courses of antibiotics, but as the data appeared to be skewed, we were unable to perform a meta‐analysis (Hoberman 2003).
2. Causative organism associated with acute otitis media
None of the studies reported on this outcome.
3. Utilisation of healthcare and related resources
Utilisation of healthcare resources refers to any reported self referral by a trial participant to a healthcare provider during the follow‐up period. One trial reported the number of children who were hospitalised during the follow‐up period (Hoberman 2003). This trial showed no difference between the influenza vaccine and control groups in rate of hospitalisation. One trial reported the mean visits to primary care, emergency department, or hospital admission, but as the data appeared to be skewed, we were unable to include these data in a meta‐analysis (Hoberman 2003).
4. Number of culture‐confirmed influenza cases
Three trials reported the number of culture‐confirmed influenza cases (Belshe 2000; Lum 2010; Vesikari 2006). In the vaccine group, there was a significant reduction in the number of culture‐confirmed influenza cases with considerable heterogeneity (3 trials; 4449 children, random‐effects; RR 0.07, 95% CI 0.02 to 0.17; RD ‐0.02, 95% CI ‐0.04 to ‐0.01; I² = 84%).
5. Adverse events
Seven trials reported measuring adverse events. There was a significant increase in the number of children with febrile reaction in the vaccine group (Analysis 1.5; 7 trials; 10,615 children; RR 1.15, 95% CI 1.06 to 1.24; RD 0.02, 95% CI 0.00 to 0.04; I² = 0%; low‐quality evidence) (Bracco 2009; Gruber 1996; Kosalaraksa 2015; Lum 2010; Swierkosz 1994; Tam 2007; Vesikari 2006).
Six trials reported a significant increase in the number of children with rhinorrhoea in the vaccine group (Analysis 1.6; 6 trials; 10,563 children; RR 1.17, 95% CI 1.07 to 1.29; RD 0.09, 95% CI 0.01 to 0.16; I² = 63%; low‐quality evidence) (Bracco 2009; Gruber 1996; Lum 2010; Swierkosz 1994; Tam 2007; Vesikari 2006).
Three trials reported pharyngitis (Bracco 2009; Lum 2010; Vesikari 2006). There was no difference between the vaccine and control groups (Analysis 1.7).
Additional adverse events were reported in this update. One trial reported the number of children with drowsiness, irritability/fussiness, and loss of appetite (Kosalaraksa 2015). This trial showed a significant difference between influenza vaccine and control groups in rate of drowsiness (1 trial; 416 children; RR 1.45, 95% CI 1.01 to 2.06; RD 0.11, 95% CI 0.01 to 0.20; P = 0.04). This trial showed no difference in rates of irritability/fussiness (1 trial; 416 children; RR 1.33, 95% CI 1.00 to 1.77; RD 1.11, 95% CI 0.01 to 0.21) and loss of appetite (1 trial; 416 children; RR 1.13, 95% CI 0.78 to 1.64; RD 0.03, 95% CI ‐0.06 to 0.12) between the influenza vaccine and control groups.
Sensitivity analysis
For all outcomes, there was no substantial change in the effect sizes and CI after removing the trials with unclear risk of bias for allocation concealment and random sequence generation. The inclusion of a trial with a five‐month follow‐up period (Clements 1995), shorter than our predefined follow‐up of at least six months, did not substantially affect our results.
Discussion
Summary of main results
This review was designed to include all randomised controlled trials (RCTs) addressing the effectiveness of influenza vaccine in reducing the occurrence of acute otitis media (AOM) in infants and children. The 11 identified trials formed a heterogeneous group addressing several comparisons and a variety of outcomes, resulting in few trials contributing to each of our predefined outcomes.
There was a 4% absolute reduction in episodes of AOM among vaccinated children during the follow‐up period. The subgroup analyses (i.e. number of courses or types of vaccine administered) showed no difference. There was a clinically important 11% absolute reduction in children receiving an antibiotic for AOM or its complications. We were unable to demonstrate whether there was any difference in utilisation of health care between the vaccine and control groups for the one included trial. Reporting of adverse events was limited to minor side effects, which included episodes of fever, rhinorrhoea, and drowsiness, and these were increased with the vaccine. We were unable to pool the results for all adverse events because some children may have experienced more than one adverse event.
Overall completeness and applicability of evidence
We performed a comprehensive and extensive literature review to assess the effectiveness of influenza vaccine in reducing the occurrence of AOM in infants and children. We included 11 trials, but the findings of this review may not be applicable to children aged less than six months or more than six years, as they were excluded from the included trials. Nevertheless, the age ranges in the included studies do represent the age range of children at risk of AOM (MeReC 2006). We could not include five of the 11 trials in the meta‐analysis because the follow‐up period was too short. One trial was not included due to a very high rate of attrition, and 13,989 children were not included in the primary outcome. This limits the applicability of the findings of this review. None of the 11 included trials examined the causative organism associated with AOM. Our review evaluated monovalent, bivalent, or trivalent influenza vaccine as single, two, or three doses given between seven to 60 days apart, but was not able to show whether the number of doses made a difference in the occurrence of AOM. Although the immunogenicity of the vaccine for one, two, and three doses has been studied (Swierkosz 1994), we are unaware of any direct comparisons of different doses that looked at clinically important outcomes. From the reported incidence of adverse events, we were able to detect common side effects, that is febrile reactions to vaccination, rhinorrhoea, pharyngitis, and drowsiness. The information on adverse events came from seven trials involving about 10,000 children, but there was a lack of information on more rare and serious adverse events. However, in a Cochrane Review examining the efficacy and safety of influenza vaccine in healthy children, there were reports of additional rare or serious adverse events over and above those reported in the trials included in our review (Jefferson 2012). These included lower respiratory infections, septicaemia, and death. However, none of the trial investigators judged these rare events to be due to the vaccine.
Quality of the evidence
Overall, we judged the quality of evidence to be low to moderate, but judged evidence for adverse events to be of low quality. Generally, there was a low or unclear risk of bias for most trials in most domains. There was no access to protocols in nine trials. However, we judged selective reporting bias to be low because all the expected outcomes had been reported. Only two trials were prospectively registered on a trial registration database. Four studies had unclear risk of bias for method of randomisation and allocation concealment, of which two, described as double‐blind, placebo‐controlled studies, contributed to the first primary outcome. Removing these studies on sensitivity analysis did not substantially change the effect estimate or the confidence, so we have not downgraded for this.
Risk of attrition bias was present in two trials. Both of these studies only contributed to the adverse effects outcomes, therefore we have downgraded these outcomes for risk of bias. Attrition bias was unclear in one trial due to unexplained reasons for loss to follow‐up (Figure 3). Loss to follow‐up was less than 20% in six trials, and nine trials carried out intention‐to‐treat analysis. Ten trials declared funding from vaccine manufacturers, and there is a potential for financial competing interest. We have therefore downgraded all outcomes over concerns about potential publication bias. For most of our meta‐analyses, we encountered little or moderate heterogeneity. We have shown the results of the random‐effects meta‐analysis where there was moderate heterogeneity. Where we have done random‐effects meta‐analysis, there was no shift in the effect estimate, and although the 95% confidence interval was wider in all instances, the outcome remained significant. Some outcomes showed substantial heterogeneity; where this occurred we have indicated this and not shown the pooled estimate. We downgraded our first primary outcome due to concerns about this. For all studies contributing to this outcome, the effect estimate favoured influenza vaccine, but heterogeneity (I² = 62%) reduces our certainty about the size of reduction for this outcome. Using the GRADE approach, we therefore assessed the overall level of evidence contributing to this review as low to moderate quality (summary of findings Table for the main comparison).
There was a wide variation among the included studies in the frequency of adverse events reported, suggesting differences in definitions used and difficulty in identifying and reporting adverse events. We have therefore downgraded these adverse events for heterogeneity.
Potential biases in the review process
We attempted to reduce publication bias by checking the reference lists of all related studies for further references and searching multiple databases without language restriction. However, we cannot be certain that we have located all the trials in this area. Although there were 11 included trials, we were not able to construct a funnel plot for detecting bias or heterogeneity due to insufficient studies contributing to each outcome. Not all included trials reported all outcomes. One included trial did not meet our inclusion criteria in terms of the duration of follow‐up (Clements 1995). This trial had a maximum follow‐up period of five months. This was also the only trial carried out in day‐care centres. However, there was no significant difference between this trial and the four trials that recruited children from healthcare settings, although the study with a five‐month follow‐up period actually reported a higher incidence of AOM. In spite of the fact that the included studies all showed the same direction of effect, we encountered moderate heterogeneity in our first primary outcome. We were unable to demonstrate whether the heterogeneity could be explained by subgroup analysis. However, there were differences in the measurement of AOM. Diagnosis of AOM is subjective, and although attempts were made in all the included studies to make this more objective, the definitions used varied across the studies. Since only two of the included studies were prospectively registered, we cannot be certain that we missed studies that measured AOM but did not report it.
A possible bias in this review is that we excluded one study due to uncertainty of the age of the participants (Bergen 2004). However, the results of this study were consistent with the findings of our review, reporting a significant reduction in otitis media in children one to eight years of age, but reported lower febrile illness in the vaccine group.
Agreements and disagreements with other studies or reviews
Three other systematic reviews have examined the effect of influenza vaccine on otitis media (Block 2011; Heikkinen 2013; Prutsky 2014). Block 2011 evaluated the efficacy of live attenuated influenza vaccine (LAIV), trivalent inactivated influenza vaccine (TIV), and placebo for influenza‐associated AOM from RCTs. This review included six placebo‐controlled trials and two TIV‐controlled trials. Five of the eight trials were included in this review, and the others were excluded for absence of relevant primary or secondary outcomes and the absence of a control group (Belshe 2000; Bracco 2009; Lum 2010; Tam 2007; Vesikari 2006).
Heikkinen 2013 included the same trials as in Block 2011. Prutsky 2014 included seven RCTs and two observational studies. Four of the seven RCTs were included in our review, and the remaining three trials were not related to our prespecified primary or secondary outcomes (Gruber 1996; Lum 2010; Swierkosz 1994; Vesikari 2006).
All three reviews found a reduction in the development of AOM with influenza vaccines, similar to our review. Six of the nine studies in the Prutsky 2014 review showed an increased risk of developing fever in the vaccine group compared to the placebo group, similar to our findings. We found no other systematic reviews that reported our other prespecified secondary outcomes.
The review by Jefferson 2012 on vaccines for preventing influenza in healthy children showed that for live attenuated vaccines, there was an 80% overall reduction in influenza (RR 0.20, 95% CI 0.13 to 0.32). The RR for children under the age of six years old was 0.18 (95% CI 0.11 to 0.29), but little evidence was available for children under two years old.
We consider this to be consistent with other data. In a Cochrane Review on pneumococcal conjugate vaccines (PCV), the 7‐valent PCV with CRM197 as carrier protein (CRM197‐PCV7) administered during early infancy was associated with a relative risk reduction of all‐cause AOM of ‐5% in high‐risk children (95% CI ‐25% to 12%). Administering PCV7 in healthy infants with a low baseline risk of AOM showed modest beneficial effects, with relative risk reduction of 7% (95% CI 4% to 9%) in three trials (Fortanier 2014). Pneumococcal vaccine had a small effect on AOM in healthy infants. However, since AOM is preceded by viral infection, a greater reduction in AOM following influenza vaccine is feasible, and the size of the effect we found is consistent with the overall efficacy of the vaccine. Consequently, a reduction in otitis media (RR 0.80) (from 264 to 211 per 1000, i.e. 53 per 1000) (or 5.3%) is compatible with this.

Study flow diagram.
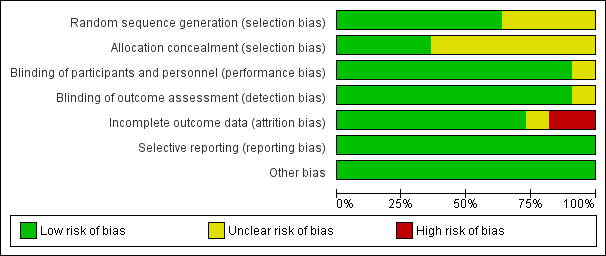
'Risk of bias' graph: review authors' judgements about each risk of bias item presented as percentages across all included studies.

'Risk of bias' summary: review authors' judgements about each risk of bias item for each included study.
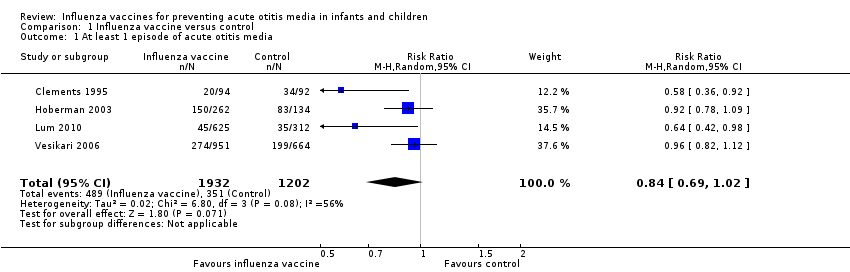
Comparison 1 Influenza vaccine versus control, Outcome 1 At least 1 episode of acute otitis media.

Comparison 1 Influenza vaccine versus control, Outcome 2 Acute otitis media by courses.

Comparison 1 Influenza vaccine versus control, Outcome 3 Acute otitis media by type of vaccine.
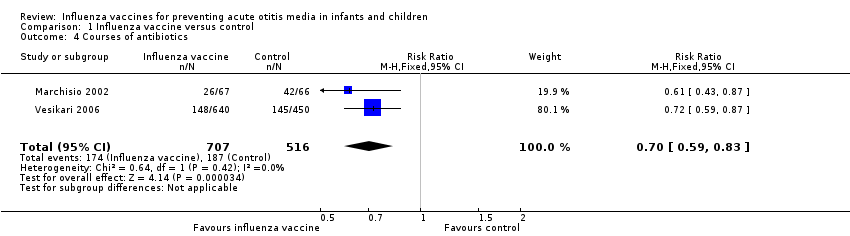
Comparison 1 Influenza vaccine versus control, Outcome 4 Courses of antibiotics.

Comparison 1 Influenza vaccine versus control, Outcome 5 Fever.
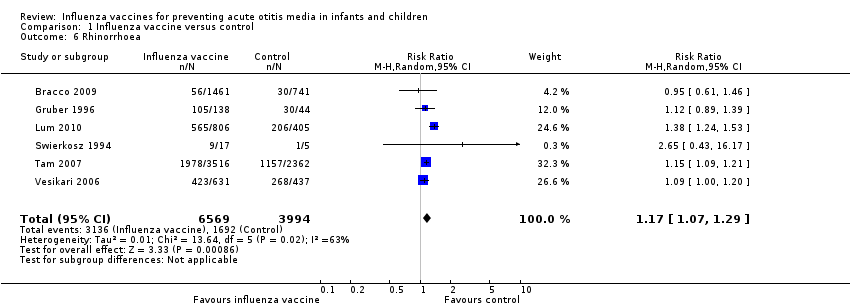
Comparison 1 Influenza vaccine versus control, Outcome 6 Rhinorrhoea.
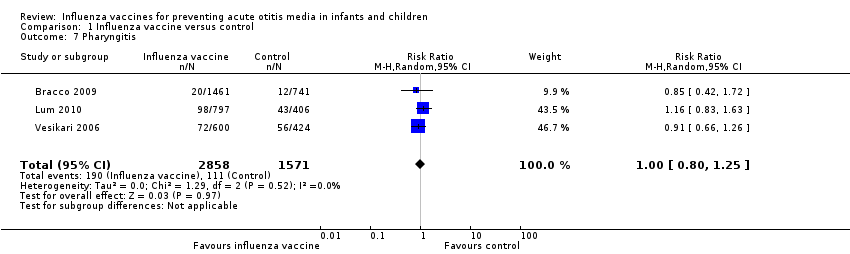
Comparison 1 Influenza vaccine versus control, Outcome 7 Pharyngitis.
| Influenza vaccine compared to control for preventing acute otitis media in infants and children | ||||||
| Patient or population: infants and children | ||||||
| Outcomes | Anticipated absolute effects* (95% CI) | Relative effect | № of participants | Quality of the evidence | Comments | |
| Risk with control | Risk with influenza vaccine | |||||
| At least 1 episode of acute otitis media | Study population | RR 0.84 | 3134 | ⊕⊕⊝⊝ | The basis for the assumed risk is the mean risk in the control group across the included studies. There was moderate unexplained inconsistency across the studies. We downgraded for inconsistency. The effect estimates were all in the same direction, but there was uncertainty in the confidence of the effect estimate. | |
| 292 per 1000 | 245 per 1000 | |||||
| Courses of antibiotics | Study population | RR 0.70 | 1223 | ⊕⊕⊕⊝ | Assumed risk calculated from the mean risk across the control groups of the 2 included studies | |
| 362 per 1000 | 254 per 1000 | |||||
| Fever | Study population | RR 1.15 | 10,615 | ⊕⊕⊝⊝ | Assumed risk calculated from the mean risk across the control groups of the 7 included studies | |
| 174 per 1000 | 200 per 1000 | |||||
| Rhinorrhoea | Study population | RR 1.17 | 10,563 | ⊕⊕⊝⊝ | Assumed risk calculated from the mean risk across the control groups of the 6 included studies | |
| 424 per 1000 | 496 per 1000 | |||||
| Pharyngitis | Study population | RR 1.00 | 4429 | ⊕⊕⊝⊝ | Assumed risk calculated from the mean risk across the control groups of the 3 included studies | |
| 71 per 1000 | 71 per 1000 | |||||
| *The basis for the assumed risk (e.g. the median control group risk across studies) is provided in footnotes. The corresponding risk (and its 95% confidence interval) is based on the assumed risk in the comparison group and the relative effect of the intervention (and its 95% CI). | ||||||
| GRADE Working Group grades of evidence | ||||||
| 1Includes trial(s) at high risk of publication bias. | ||||||
| Outcome or subgroup title | No. of studies | No. of participants | Statistical method | Effect size |
| 1 At least 1 episode of acute otitis media Show forest plot | 4 | 3134 | Risk Ratio (M‐H, Random, 95% CI) | 0.84 [0.69, 1.02] |
| 2 Acute otitis media by courses Show forest plot | 4 | Risk Ratio (M‐H, Random, 95% CI) | Subtotals only | |
| 2.1 First course (1 or 2 doses) | 4 | 3134 | Risk Ratio (M‐H, Random, 95% CI) | 0.84 [0.69, 1.02] |
| 2.2 Second course (1 dose) | 2 | 1447 | Risk Ratio (M‐H, Random, 95% CI) | 1.12 [0.94, 1.34] |
| 3 Acute otitis media by type of vaccine Show forest plot | 4 | 3134 | Risk Ratio (M‐H, Random, 95% CI) | 0.84 [0.69, 1.02] |
| 3.1 Trivalent cold‐adapted influenza vaccine | 2 | 2552 | Risk Ratio (M‐H, Random, 95% CI) | 0.83 [0.56, 1.21] |
| 3.2 Trivalent sub virion influenza vaccine | 2 | 582 | Risk Ratio (M‐H, Random, 95% CI) | 0.77 [0.48, 1.23] |
| 4 Courses of antibiotics Show forest plot | 2 | 1223 | Risk Ratio (M‐H, Fixed, 95% CI) | 0.70 [0.59, 0.83] |
| 5 Fever Show forest plot | 7 | 10615 | Risk Ratio (M‐H, Random, 95% CI) | 1.15 [1.06, 1.24] |
| 6 Rhinorrhoea Show forest plot | 6 | 10563 | Risk Ratio (M‐H, Random, 95% CI) | 1.17 [1.07, 1.29] |
| 7 Pharyngitis Show forest plot | 3 | 4429 | Risk Ratio (M‐H, Random, 95% CI) | 1.00 [0.80, 1.25] |