生活方式干预措施治疗慢性痛风
摘要
研究背景
尽管管理慢性痛风患者时通常推荐使用生活方式干预措施,但在系统综述中,来自试验资料的获益和安全性的证据尚未经过预先评价。
研究目的
本系统综述的目的是评价生活方式干预措施治疗慢性痛风患者的获益和安全性。
检索策略
我们于2013年4月5日检索了Cochrane对照试验中心注册库(Cochrane Central Register of Controlled Trials, CENTRAL),MEDLINE和EMBASE中的研究。我们还检索了2010至2011年间美国风湿病学会(American College of Rheumatology, ACR)、欧洲抗风湿病联盟(European League Against Rheumatism, ULAR)的摘要,并对纳入文章的参考文献进行了手工检索。
纳入排除标准
对慢性痛风患者的生活方式干预措施和其他疗法(活性药或安慰剂)相对比的随机或半随机对照试验(RCT或CCT)都将被纳入。关注的结局是痛风发作频率、关节疼痛、血清尿酸水平、痛风石大小、功能、生活质量和不良反应的变化。
资料收集与分析
两位综述作者独立地根据Cochrane推荐的方法进行文献筛选、评价、资料收集和综合分析。我们使用GRADE方法对每个结局的证据质量进行评价。
主要结果
本综述仅纳入了一项具有中等偏倚风险的研究(120名受试者)。患者被随机分配三种干预措施中的一种:富含糖巨肽(glycomacropeptide, GMP)和G600的脱脂奶粉(skim milk powder, SMP),不富含SMP的,或乳糖粉,为期三个月。在三个月的研究期间,三组的急性痛风发作频率(以每月发作次数衡量)均有所下降。低质量证据表明,SMP/GMP/G600组与联合对照组(SMP和乳糖粉)在三个月时没有差异(平均差(MD)=‐0.21,95%置信区间(CI)[‐0.76, 0.34]))。在因不良反应退出试验(风险比(RR)=1.27,95%CI [0.53, 3.03])和导致住院的严重不良事件(2/40 SMP/GMP/G600组与3/80对照组;RR=1.33,95%CI [0.23, 7.66])方面,组间没有明显差异。胃肠道不良反应是最常报告的。与对照组相比,通过10分制李克特量表(10‐point Likert scale)SMP/GMP/G600组自我报告的痛风发作的疼痛改善得更多(MD=‐1.03,95%CI [‐1.96, ‐0.10]),绝对差异为10%(绝对风险差异=‐0.10,95%CI [‐0.20, ‐0.01])。这不太可能具有临床意义。在三个月的随访中,SMP/GMP/G600组与对照组在身体功能方面无显著差异(MD=‐0.03,95%CI [‐0.14, 0.08])。本研究未报告痛风石消退和血清尿酸正常化。
作者结论
虽然观察性研究有很好的证据表明各种生活方式的风险因素与痛风的发展有关联,但是随机对照试验的高质量证据很少,不能支持或反驳使用生活方式的调整来改善慢性痛风患者的预后。
PICO
简语概要
生活方式干预措施治疗慢性痛风
本Cochrane综述介绍了我们从研究中了解到的关于调整生活方式治疗慢性痛风患者的效果。本综述纳入的一项研究评价了与标准脱脂牛奶或乳糖粉相比,食用富含两种乳制品成分(糖巨肽(glycomacropeptide, GMP)和G600乳脂肪提取物)的脱脂奶粉(skim milk powder, SMP)三个月内减少痛风发作频率的获益和安全性。
本综述表明,在慢性痛风患者中 :
与标准脱脂牛奶或乳糖粉相比,富含GMP和G600的SMP可能不会降低痛风发作的频率,可能不会改善身体机能,但可能会减轻疼痛。我们不知道食用这些乳制品是否会改善痛风石的大小(痛风石是一种常见于皮肤、关节表面或软骨中的痛风晶体沉积物)或血尿酸水平,因为这些都没有被报告过。
我们没有关于副作用和并发症的准确信息。可能的副作用可能包括恶心或腹泻。
痛风是什么?生活方式干预措施是什么?
痛风是一种非常常见的疼痛性关节炎症(关节炎),由关节内或周围形成的尿酸结晶引起。炎症会导致受影响的关节疼痛、发红和肿胀,使该区域难以触摸或运动。人们患上痛风的原因包括:基因组成、超重、服用某些药物(如利尿剂)、肾功能受损、生活习惯(如摄入过量的酒和含糖饮料)。
尽管药物是痛风治疗的主要手段,但鉴于某些生活方式的风险因素与痛风发展之间存在公认的关联,通常建议慢性痛风患者改变生活方式,如减肥、戒烟、多运动、多喝咖啡和乳制品以及少喝含糖饮料,酒精饮料,少吃肉类和海鲜。
对痛风患者食用强化脱脂奶粉后会发生什么的最佳估计:
痛风发作
食用3个月强化脱脂奶粉的人每月痛风发作次数减少0.21次(或每年减少2.5次痛风发作)。
‐ 食用强化脱脂奶粉的人每月有0.49次痛风发作(或每年6次痛风发作)。
‐ 食用标准脱脂奶粉或乳糖的人每月有0.70次痛风发作(或每年8次痛风发作)。
因不良事件退出
食用强化脱脂奶粉的100人中有4人在3个月后停止摄入(退出绝对变化增加4%,从‐10%到+18%)。
‐ 100人中有18人停止食用强化脱脂奶粉。
‐ 100人中有14人停止食用标准脱脂奶粉或乳糖。
疼痛(得分越低代表疼痛程度越低)
在3个月时,食用强化脱脂奶粉的人在0至10分的疼痛量表对他们的疼痛评分降低了1分(绝对改善10%;1%到20%改善)。
‐ 食用强化脱脂奶粉的人在0至10的范围内将他们的疼痛评分为0.67分。
‐ 食用标准脱脂奶粉或乳糖的人在0至10的范围内将他们的疼痛评分为1.7分。
身体机能(分数越低代表机能越好)
食用强化脱脂奶粉的人在3个月时在0至3分(绝对改善1%;从‐3到+5)的评分中将他们的功能评分增加了+0.03(从‐0.08到+0.14)。
‐ 食用强化脱脂奶粉的人在0至3的范围内将其功能评定为0.08分。
‐ 食用标准脱脂奶粉或乳糖的人在0至3的范围内将其功能评定为0.11分。
严重不良事件
食用强化脱脂奶粉的100人中又有1人报告了严重的不良事件。
‐ 食用强化脱脂奶粉的100人中有5人出现严重不良事件。
‐ 食用标准脱脂奶粉或乳糖的100人中有4人出现严重不良事件。
Authors' conclusions
Summary of findings
| Skim milk enriched with GMP/G600 compared to skim milk & lactose powder for chronic gout | ||||||
| Patient or population: patients with chronic gout | ||||||
| Outcomes | Illustrative comparative risks* (95% CI) | Relative effect | No of Participants | Quality of the evidence | Comments | |
| Assumed risk | Corresponding risk | |||||
| Skim milk & lactose powder | Skim milk enriched with GMP/G600 | |||||
| Acute gout attack frequency | The mean acute gout attack frequency in the control groups was | The mean acute gout attack frequency in the intervention groups was | 120 | ⊕⊕⊝⊝ | Not statistically significant2 | |
| Participant withdrawals due to adverse events | Study population | RR 1.27 | 120 | ⊕⊕⊝⊝ | Not statistically significant3 | |
| 138 per 1000 | 175 per 1000 | |||||
| Moderate | ||||||
| Joint pain reduction | The mean joint pain reduction in the control groups was | The mean joint pain reduction in the intervention groups was | 120 | ⊕⊕⊝⊝ | Absolute risk difference = ‐10% (‐20% to ‐1%). Relative percentage change = ‐39% (‐74% to ‐4%). NNTB = 10 (5 to 100)2 | |
| Tophus regression ‐ not measured | See comment | See comment | Not estimable | ‐ | See comment | Not measured |
| Physical function | The mean physical function in the control groups was | The mean physical function in the intervention groups was | 120 | ⊕⊕⊝⊝ | Absolute risk difference = ‐1% (‐5% to 3%). Relative percentage change = ‐13% (‐58% to 33%) NNT n/a, not statistically significant2 | |
| Serum urate normalisation4 ‐ not reported | See comment | See comment | Not estimable4 | ‐ | See comment | Not reported |
| Serious adverse events | 38 per 1000 | 50 per 1000 | RR 1.33 | 120 | ⊕⊕⊝⊝ | Gastrointestinal AEs (diarrhoea, nausea and flatulence) reported most commonly. SAE related to hospital admissions ‐ none were due to the study products.3 |
| *The basis for the assumed risk (e.g. the median control group risk across studies) is provided in footnotes. The corresponding risk (and its 95% confidence interval) is based on the assumed risk in the comparison group and the relative effect of the intervention (and its 95% CI). | ||||||
| GRADE Working Group grades of evidence | ||||||
| 1 There was selective reporting of post‐hoc comparisons between skim milk powder enriched with GMP/G600 and one of the two study controls (lactose) in relation to change in gout attack frequency from baseline | ||||||
Background
Description of the condition
Gout is a potentially progressive and debilitating form of chronic inflammatory arthritis, caused by deposition of monosodium urate crystals in synovial fluid and other tissues (Neogi 2011). It affects 1% to 2% of adults in developed countries (Richette 2010) and can have a significant adverse impact upon a person's quality of life. People who suffer from recurrent attacks frequently experience pain and disability, reduced health‐related quality of life (HRQoL), reduced productivity and increased morbidity (Singh 2011a). Both its incidence and prevalence have appeared to rise in recent decades (Choi 2005a; Richette 2010). The reasons behind this are probably multi‐factorial and potentially related to increasing longevity, rising rates of obesity and the metabolic syndrome, and shifts in dietary habits and lifestyle (Choi 2005a; Choi 2005b; Neogi 2011; Richette 2010).
Dietary risk factors that have been associated with the development of gout include increased dietary intake of purine‐rich foods (particularly meat and seafood), ethanol (particular beer and spirits) and fructose‐sweetened drinks (Choi 2004a; Choi 2004b; Neogi 2011; Singh 2011b). For this reason, lifestyle modifications are commonly co‐prescribed in combination with urate‐lowering medications (xanthine oxidase inhibitors, uricosuric agents, uricase agents) to help maintain monosodium urate levels below the serum saturation point (≤ 0.36 µmol/L or 6 mg/dL) to prevent crystal formation (Neogi 2011; Richette 2010). This has the aim of reducing hyperuricaemia and renal stone formation, promoting resolution of established crystal deposits, and decreasing the risk of recurrent gout flares and chronic arthropathy developing in the long term (Neogi 2011; Richette 2010).
Description of the intervention
Lifestyle interventions that may help in treating chronic gout include weight loss, smoking cessation, exercise, increased coffee and dairy intake, and dietary modification of fructose‐sweetened drinks, alcoholic beverages, meat and seafood intake (either elimination or reduced intake).
How the intervention might work
Lifestyle interventions that involve reducing the dietary intake of purine‐rich foods exert their effect by helping to lower the amount of purine precursors obtained from exogenous sources. Exogenous purine ultimately contributes to the total‐body urate pool and predisposes to the development of hyperuricaemia and gout (Neogi 2011). Beer consumption is associated with increased plasma concentrations of urate precursors, hypoxanthine and xanthine (Dalbeth 2010). Furthermore, ethanol administration has been shown to have a hyperuricaemic effect by causing net adenosine triphosphate (ATP) degradation to adenosine diphosphate (ADP) and adenosine monophosphate (AMP), which can be rapidly degraded to uric acid (Choi 2005a). ATP is the molecule that supplies energy for cellular metabolism and is generated through the biochemical process known as oxidative phosphorylation (Fauci 2008). Fructose phosphorylation similarly consumes ATP in the liver and the accompanying catabolism of accumulated AMP results in increased uric acid production (Choi 2005a; Choi 2010). It is therefore anticipated that curtailment of meat, seafood, ethanol and fructose consumption would help in reducing hyperuricaemia and preventing chronic gout development.
Obesity and insulin resistance are both associated with the development of hyperuricaemia and the risk of incident gout in men. Obesity causes hyperuricaemia via increased urate production and decreased renal urate excretion (Choi 2005b). Insulin resistance is thought to impair oxidative phosphorylation, which, in turn, leads to increased levels of systemic adenosine and renal urate retention (Choi 2005a). Weight loss has been shown to reduce de novo purine synthesis. Both exercise and weight loss help to counteract the hyperuricaemic effects of obesity and insulin resistance.
The ingestion of milk proteins (casein, lactalbumin, orotic acid) has been shown to exert a uricosuric effect in healthy subjects. Soy and milk ingestion also promote renal oxypurine excretion, thereby reducing the availability of precursor substrates necessary for urate production (Choi 2004a; Dalbeth 2010). Coffee consumption helps reduce the risk of gout through several mechanisms. Caffeine (1,3,7‐trimethyl xanthine) is a methyl xanthine and acts as a competitive inhibitor of xanthine oxidase. Mimicking the action of allopurinol, this impedes the endogenous synthesis of uric acid. Furthermore, caffeine promotes weight loss through stimulation of thermogenesis and energy expenditure. Higher long‐term coffee intake also helps lower serum insulin levels and reduce insulin resistance (Choi 2007).
Why it is important to do this review
Despite the fact that lifestyle interventions are commonly recommended in the management of patients with recurrent gout, the evidence for their benefits and safety in clinical trials has not been previously examined in a systematic review. The results of this review are likely to be important for informing clinical practice and/or determining whether further research is required to establish the value of lifestyle interventions for gout.
Objectives
The objective of this systematic review was to evaluate the benefits and safety of lifestyle interventions for the treatment of people with chronic gout.
Methods
Criteria for considering studies for this review
Types of studies
All published randomised or quasi‐randomised controlled trials (RCTs or CCTs) which compared one or more lifestyle interventions to either no treatment, placebo, urate‐lowering medications (uricases, uricosuric agents, xanthine oxidase inhibitors) or another lifestyle intervention for treating chronic gout were considered for inclusion. Studies of dietary supplements are covered in a separate Cochrane review and were excluded. Only trials that were published as full articles or were available as a full trial report were included.
Types of participants
Adult patients (aged 18 years or older) with diagnosed gout (author described or meets 1977 American College of Rheumatology criteria for gout (Wallace 1977) or other criteria as specified in the study).
Types of interventions
All trials that evaluated one or a combination of lifestyle interventions were included. This included trials on weight loss, smoking cessation, exercise, increased coffee or dairy intake, and dietary modification (either elimination or reduced intake) of fructose‐sweetened drinks, ethanol (particularly beer and spirits) and purine‐rich foods (particularly meat and seafood).
Comparators could be:
-
placebo;
-
urate‐lowering medications (uricases, uricosuric agents, xanthine oxidase inhibitors); or
-
other non‐pharmacological interventions including lifestyle interventions used in treating gout.
Types of outcome measures
Main outcomes
-
Benefit: participant‐reported reduction in acute gout attack frequency
-
Safety: number of study participant withdrawals due to adverse events (AEs)
Other outcomes
-
Joint pain reduction: mean change in pain score on a visual analogue scale (VAS) or numerical rating scale
-
Tophus regression
-
Physical function (i.e. activity limitation): as measured by disease‐specific instruments (such as the Health Assessment Questionnaire Disability Index (HAQ‐DI))
-
Health‐related quality of life (HRQoL): as measured by generic instruments (such as the Medical Outcomes Study Short‐Form‐36 Survey (SF‐36))
-
Serum urate (sUA) normalisation: sUA (Trinder Assay) reduction to < 0.36 mmol/L (6.1 mg/dL)
-
Serious adverse events (SAEs, defined as AEs that are fatal, life‐threatening or require hospitalisation)
-
Patient global assessment via VAS
For the purpose of this review, if feasible, we planned to group trials into those of short‐term (less than three months), medium‐term (three to 12 months) and long‐term (more than 12 months) duration.
We presented the following outcomes (at the latest time point) in a 'Summary of findings' tables (Schünemann 2011a; Schünemann 2011b): participant‐reported reduction in acute gout attack frequency, number of study participant withdrawals due to AEs, joint pain reduction, physical function, patient global assessment, sUA normalisation and serious adverse events.
Search methods for identification of studies
Electronic searches
We searched the following databases for RCTs or CCTs using the search strategies detailed in the appendices:
-
Cochrane Central Register of Controlled Trials (CENTRAL, The Cochrane Library, Issue 3, 2013) (Appendix 1);
-
MEDLINE Ovid (1948 to March week 3 2013) (Appendix 2);
-
EMBASE (1980 to week 13 2013) (Appendix 3).
We applied no language restrictions.
Searching other resources
We searched the American College of Rheumatology (ACR) and European League Against Rheumatism (EULAR) conference abstracts from 2010 and 2011. We handsearched the reference lists of included articles and relevant reviews to identify any additional studies not retrieved by the aforementioned search strategy.
Data collection and analysis
Selection of studies
Two review authors (JM, MS) independently assessed all retrieved trials to identify those that fulfilled the criteria for inclusion in this systematic review. We retrieved all relevant articles in full text for closer examination. Disagreements about study inclusion or exclusion were resolved by consensus or by discussion with a third author (RB) if needed. We planned to translate studies into English where necessary.
Data extraction and management
Two authors (JM, MS) independently extracted the following relevant information from included trials using a pre‐defined data extraction form: study design, characteristics of the study population (age, gender, presence or absence of concurrent urate‐lowering medication use or tophi), lifestyle interventions, control interventions, outcome measures (mean and standard deviation for continuous outcomes, number of events and participants for dichotomous outcomes), timing of outcome assessment and methodological domains relevant to 'Risk of bias' assessment. We resolved differences in data extraction by referring back to the original articles and establishing consensus. A third author (RB) was consulted to help resolve differences.
Assessment of risk of bias in included studies
We assessed the potential for bias in the included studies using The Cochrane Collaboration's tool for assessing risk of bias (Higgins 2011). Two review authors (JM, MS) independently assessed the risk of bias in included trials and resolved any disagreements by consensus or consultation with a third author (RB). We assessed the following methodological domains:
-
random sequence generation: to determine if the method of generating the randomisation sequence was adequate to prevent biased allocation to interventions;
-
allocation concealment: to determine if adequate methods were used to conceal allocation to interventions;
-
blinding of participants, personnel and outcome assessors for each outcome measure: to determine if adequate methods to prevent knowledge of the allocated interventions by study participants, personnel and outcome assessors occurred during the study;
-
incomplete outcome data;
-
selective outcome reporting; and
-
other potential sources of bias.
To determine the risk of bias of an included study, for each criterion we evaluated the presence of sufficient information and the likelihood of potential bias. We rated each of these criteria either as 'low risk', 'high risk' or 'unclear risk' (either lack of information or uncertainty over the potential for bias).
Measures of treatment effect
We planned to summarise the data in a meta‐analysis only if there was sufficient clinical and statistical homogeneity. For continuous data, we analysed results as mean differences (MDs) between the intervention and comparator group, with corresponding 95% confidence intervals (CIs). For MDs between intervention and control groups, we planned to weight these by the inverse of the variance in the pooled treatment estimate. However, when different scales were used to measure the same conceptual outcome (e.g. function or pain), we planned to calculate standardised mean differences (SMDs) instead, with corresponding 95% CIs. SMDs are calculated by dividing the MD by the standard deviation, resulting in a unitless measure of treatment effect. For dichotomous data, we calculated a risk ratio (RR) with corresponding 95% CI.
Unit of analysis issues
For studies containing more than two intervention groups, making multiple pair‐wise comparisons between all possible pairs of intervention groups possible, we planned to include the same group of participants only once in the meta‐analysis. In the event that cross‐over trials were identified in which the reporting of continuous outcome data precluded paired analysis, we planned to include these data in a meta‐analysis, in order to avoid unit of analysis error. Where carry‐over effects were thought to exist, and where sufficient data existed, we would include data from the first period only in the analysis (Higgins 2011). Where outcomes were collected at multiple follow‐up times (within the short‐term, medium‐term and long‐term time frames), we extracted the last outcome.
Dealing with missing data
Where data were missing or incomplete, we sought further information from the study authors. In cases where individuals were missing from the reported results and no further information was forthcoming from the study authors, we assumed the missing values had a poor outcome.
For dichotomous outcomes that measured adverse events (e.g. number of withdrawals due to adverse events), we calculated the withdrawal rate using the number of patients that received treatment as the denominator (worst‐case analysis). For dichotomous outcomes that measured benefits (e.g. patient‐reported reduction in gout attack frequency), we calculated the worst‐case analysis using the number of randomised subjects as the denominator.
For continuous outcomes (e.g. pain), we calculated the MD or SMD based on the number of patients analysed at the time point. If the number of patients analysed was not presented for each time point, we used the number of randomised patients in each group at baseline. Where possible, we computed missing standard deviations from other statistics such as standard errors, confidence intervals or P values, according to the methods recommended in the Cochrane Handbook for Systematic Reviews of Interventions (Higgins 2011). If standard deviations could not be calculated, they were to be imputed (e.g. from other studies in the meta‐analysis; Higgins 2011).
Assessment of heterogeneity
Prior to planned meta‐analysis, we assessed studies for clinical homogeneity with respect to type of therapy, control group and the outcomes. For any studies judged as clinically homogeneous, we planned to estimate statistical heterogeneity using the I2 statistic (Deeks 2011), using the following as a rough guide for interpretation: 0% to 40% might not be important, 30% to 60% may represent moderate heterogeneity, 50% to 90% may represent substantial heterogeneity and 75% to 100% considerable heterogeneity. In cases of considerable heterogeneity (defined as I2 ≥ 75%), we planned to explore the data further, including subgroup analysis, in an attempt to explain the heterogeneity.
Assessment of reporting biases
In order to determine whether reporting bias was present, we determined whether the protocol for the RCT was published before recruitment of study patients was started. For studies published after 1 July 2005, we screened the Clinical Trial Register at the International Clinical Trials Registry Platform of the World Health Organization (http://apps.who.int/trialsearch/) (DeAngelis 2004).
We evaluated whether selective reporting of outcomes was present (outcome reporting bias).
We compared the fixed‐effect estimate against the random‐effects model to assess the possible presence of small sample bias in the published literature (i.e. in which the intervention effect was more beneficial in smaller studies). In the presence of small sample bias, the random‐effects estimate of the intervention is more beneficial than the fixed‐effect estimate (Sterne 2011). We planned to further explore the potential for reporting bias with funnel plots if more than 10 studies were included.
Data synthesis
Where studies were sufficiently homogeneous that it was clinically meaningful for them to be pooled, we planned to perform meta‐analysis using a random‐effects model, regardless of the I2 results. We performed analysis using The Cochrane Collaboration's statistical software Review Manager 2011 and produced forest plots.
Subgroup analysis and investigation of heterogeneity
Where sufficient data were available, we planned to perform the following subgroup analyses:
-
men versus postmenopausal women;
-
presence or absence of concurrent urate‐lowering medication use; and
-
presence or absence of tophi.
Thus, ideally we would have liked to extract the main outcome for the above subgroups within each trial (e.g. men versus women). We considered each of the three planned subgroup analyses separately. We planned to informally compare the magnitudes of effect to assess possible differences in response to treatment between the subgroups. We planned to assess the overlap of the confidence intervals; non‐overlap of the confidence intervals indicated statistically significant differences between subgroups. However, we anticipated that the outcomes may not be reported by subgroups within the trials, precluding the planned analyses.
Sensitivity analysis
If sufficient studies existed, we planned sensitivity analyses to assess the impact of any bias attributable to inadequate or unclear treatment allocation (including studies with quasi‐randomised designs) and inadequate blinding of study participants, personnel and outcome assessors.
Presentation of key results
We produced a 'Summary of findings' table to illustrate key information concerning the quality of evidence, the magnitude of effect of the interventions examined, and the sum of available data on the most important patient‐relevant outcomes, as recommended by The Cochrane Collaboration (Schünemann 2011a). The outcomes that were included in the 'Summary of findings' table included participant‐reported reduction in acute gout attack frequency, number of study participant withdrawals due to AEs, joint pain reduction, function, tophus regression, serum urate normalisation and serious adverse events.
The 'Summary of findings' table included an overall grading of the evidence related to each of the main outcomes using the GRADE (Grading of Recommendations Assessment, Development and Evaluation) approach (Schünemann 2011b). In addition to the absolute and relative magnitude of effect provided in the 'Summary of findings' table, for dichotomous outcomes we calculated the number needed to treat to benefit (NNTB) or the number needed to treat to harm (NNTH) from the control group event rate (unless the population event rate was known) and the risk ratio using the 'Visual Rx' programme (Cates 2008). For continuous outcomes, we calculated the NNT using the Wells calculator software available at the Cochrane Musculoskeletal Group editorial office. We determined the minimal clinically important difference (MCID) for each outcome for input into the calculator.
Results
Description of studies
Results of the search
The search strategy yielded 808 references (see Figure 1). After excluding 114 duplicate references, 277 references that were not RCTs or CCTs, 364 non‐gout related references and 50 references with no or incorrect interventions, we retrieved three articles for full assessment. Only one study published in English was found to meet our inclusion criteria (Dalbeth 2012). Two other trials were published in Mandarin and are awaiting translation and classification (Zeng 2012; Zhao 2009). The review will be updated to include data from these studies if they are found to meet the inclusion criteria.
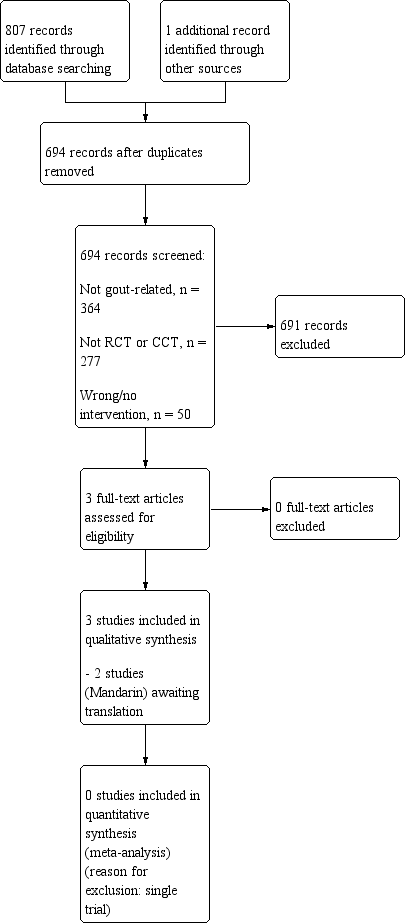
Study flow diagram.
Included studies
Details of the included trial are provided in the table 'Characteristics of included studies'. The RCT was performed in New Zealand, was of parallel‐group design, included 120 participants and was of three months duration (Dalbeth 2012).
Study participants
Dalbeth 2012 included participants with chronic gout who met the American College of Rheumatology's diagnostic classification for gout. Participants were predominantly middle‐aged Caucasian men (mean age in the fifth decade), duration of gout ranged from 13 to 17 years, and 20% to 43% of participants had tophaceous disease. Participants experienced frequent gout flares (defined as at least two flares in the preceding four months) at the time of study enrolment. Renal function was normal in participants (mean serum creatinine 91 µmol/l) and serum urate levels ranged from 0.41 to 0.44 mmol/l. The proportion of patients receiving background non‐steroidal anti‐inflammatory drugs (NSAIDs) was 25% to 28%, colchicine (range 18% to 33%), prednisolone (range 10% to 20%) and diuretics (2.5% to 20%). Participants continued their stable background allopurinol therapy for the duration of the study.
Interventions
Dalbeth 2012 compared two 'active control' dairy products (lactose powder 15 grams per day and skim milk powder (SMP) 15 grams per day) to SMP enriched with dairy fractions glycomacropeptide (GMP) 1.5 grams per day and 0.525 grams per day of G600 milk fat extract (SMP/GMP/G600), over a three‐month period. GMP and G600 have been shown to have anti‐inflammatory properties in experimental models of acute gout (Dalbeth 2012).
Timing of follow‐up
Dalbeth 2012 reported outcomes at one, two and three months after exposure to the dairy interventions.
Outcome assessment
Dalbeth 2012 reported five of the seven essential outcome domains proposed by the Outcome Measures in Rheumatology Clinical Trials (OMERACT) network for use in studies of chronic gout (Schumacher 2009). These study endpoints include reduction in gout attack frequency (measured using a participant‐maintained daily gout flare diary), joint pain (measured with a 10‐point Likert scale and by recording medication usage for treating gout attacks), participant global assessment (100 mm VAS), physical function (measured using the health assessment questionnaire (HAQ‐II)) and serum urate level.
Excluded studies
No studies were excluded after review of the full text of potentially eligible articles.
Risk of bias in included studies
The results of the 'Risk of bias' assessment are presented in Figure 2. The included trial failed to meet all of the criteria for low risk of bias and the results may therefore be biased.
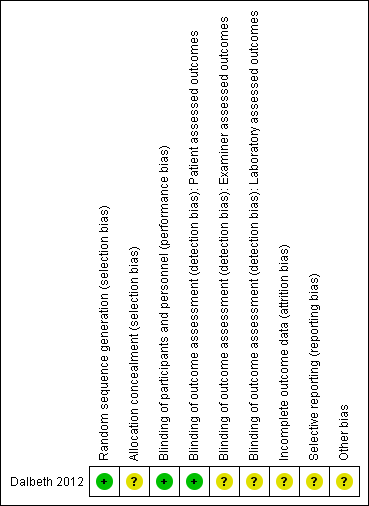
'Risk of bias' summary: review authors' judgements about each risk of bias item for each included study.
Allocation
Dalbeth 2012 adequately described their method of random sequence generation as involving the use of a random block randomisation algorithm. However, insufficient details were provided to confirm allocation concealment to study interventions.
Blinding
Dalbeth 2012 reported blinding of both participants and study personnel to treatment allocation throughout the study. The primary study endpoint was based on patient self report (i.e. change in gout attack frequency, recorded using a participant‐maintained daily gout flare diary). Outcome assessor blinding was only relevant to the assessment of secondary outcome measures including physical examination, evaluation of laboratory tests and enquiry regarding adverse events.
Incomplete outcome data
Dalbeth 2012 reported a 15% study participant drop‐out rate, with the distribution of losses across treatment groups not specified. This study's risk of attrition bias was unclear.
Selective reporting
Dalbeth 2012 reported the data for all pre‐specified outcomes. However, Dalbeth 2012 also reported the findings of a post hoc comparison between two interventions (SMP enriched with GMP and G600, lactose control) and their effects on the study's primary endpoint (change in gout flare frequency), although not the results of the third intervention (standard SMP). The same selective reporting occurred in the study authors' discussion of SMP/GMP/G600's effect on lowering diastolic blood pressure, only reporting the results of its post hoc comparison with the lactose control group.
Other potential sources of bias
Three of the study authors were employed by one of the organisations which helped to fund the study, while three other study authors were named inventors on a patent application related to milk products and gout. Given the declared conflicts of interest, the potential for bias could not be excluded.
Effects of interventions
See: Summary of findings table 1 for the main comparison. A meta‐analysis was not performed as there was only one included trial.
Skim milk enriched with GMP and G600 versus skim milk and lactose powder
One trial (120 participants) indicated that all three dairy preparations, skim milk powder (SMP) enriched with glycomacropeptide (GMP) and G600, standard SMP and lactose powder, significantly reduced the frequency of gout flares over a three‐month study period (Dalbeth 2012). After combining the two control groups (standard SMP, lactose powder) and calculating the standard deviation (SD) from the 95% confidence interval, we found no statistical difference between SMP/GMP/G600 compared to the two control groups in terms of the change in the number of gout flares from baseline: mean difference (MD) ‐0.21 (95% confidence interval (CI) ‐0.76 to 0.34) (Analysis 1.1, Figure 3). There was also no between‐group difference in function (Analysis 1.2, Figure 4).
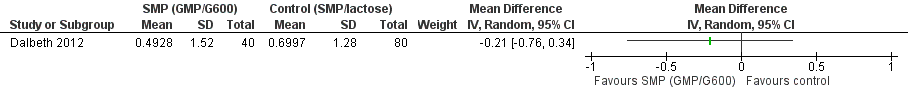
Forest plot of comparison: 1 SMP (GMP/G600) versus control (SMP/lactose), outcome: 1.1 Number of gout flares per month, after 3 months SMP (GMP/G600) versus control (SMP/lactose).
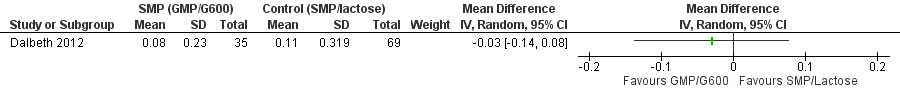
Forest plot of comparison: 1 SMP (GMP/G600) versus control (SMP/lactose), outcome: 1.2 Physical Function.
For the other efficacy outcomes included in this review, we found a statistical difference between SMP/GMP/G600 and the two control groups in change in pain from self reported gout flares (MD ‐1.03, 95% CI ‐1.96 to ‐0.10) and reduction in tender joint count from baseline (MD ‐0.49, 95% CI ‐0.85 to ‐0.12). A change of one point on a 10‐point Likert scale may be a clinically meaningful result, given Khanna 2011 have previously reported this to be the minimally important difference (MID) for pain reduction in a randomised controlled trial (RCT) of rilonacept for preventing gout flares during initiation of allopurinol therapy. MID or minimally clinically important difference (MCID) is defined as the smallest difference in score in the domain of interest that patients perceive as beneficial (or worse) and that may lead to, in the absence of troublesome side effects and excessive costs, a change in the patient's management (Khanna 2011). The clinical significance of a reduction in tender joint count by half a joint over a three‐month period is less clear, however, though it might possibly benefit patients who experience recurrent monoarticular (as opposed to polyarticular) attacks of acute gout. No statistical difference between groups was detected for change in swollen joint count from baseline (MD ‐0.23, 95% CI ‐0.61 to 0.16) and reduction in the number of self reported flares (MD ‐0.49, 95% CI ‐1.08 to 0.09).
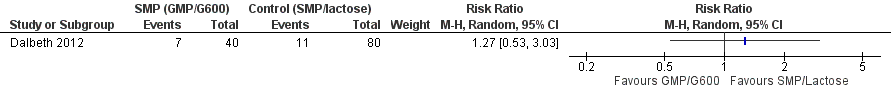
The trial authors reported similar adverse event (AE) and discontinuation rates between the three study groups. We similarly found no differences between SMP/GMP/G600 compared to the two control groups in terms of withdrawals due to AEs (7/40 SMP/GMP/G600 group versus 11/80 control groups; risk ratio (RR) 1.27, 95% CI 0.53 to 3.03) (Analysis 1.3, Figure 5), number of participants reporting AEs (RR 0.97, 95% CI 0.66 to 1.45) and number of participants reporting serious adverse events (SAEs) (2/40 SMP/GMP/G600 group versus 3/80 control groups; RR 1.33, 95% CI 0.23 to 7.66).

Forest plot of comparison: 1 SMP (GMP/G600) versus control (SMP/lactose), outcome: 1.3 Participant withdrawals due to adverse events.
The trial authors reported no statistical difference with the intake of SMP/GMP/G600 in terms of changes in serum creatinine, serum urate concentrations, C‐reactive protein levels, waist circumference, serum lipid profile or weight over time compared with standard SMP and lactose controls. Diastolic blood pressure was reported by the trial authors to decrease by a mean of 3.6 mmHg (95% CI ± 1.8) in the SMP/GMP/G600 group over the study period (P = 0.0002), with a greater reduction in diastolic blood pressure recorded when compared with the lactose control (Tukey post hoc test, P = 0.001).
Discussion
Summary of main results
Only one trial evaluating skim milk enriched with glycomacropeptide (GMP) and G600 for chronic gout was identified. This trial of 120 participants, at moderate risk of bias, compared skim milk enriched with GMP and G600 to standard skim milk and lactose powder controls and found a small reduction in the frequency of gout flares (their primary measure of treatment benefit) in all three treatment groups over a three‐month study period, with no significant between‐group differences. Small reductions in self reported pain from gout flares and a reduction in tender joint count from baseline were also reported, while no differences were seen in physical function, swollen joint count, serum urate and C‐reactive protein levels. There was no evidence of an increase in withdrawals due to adverse events or adverse events in participants in the SMP/GMP/G600 group compared to controls, with gastrointestinal adverse effects cited as the most common complaint in both groups.
Compared to standard skim milk or lactose powder, skim milk enriched with GMP and G600 is of unclear benefit in reducing flares of gout based on a single trial that is at moderate risk of bias.
Overall completeness and applicability of evidence
There was a notable lack of trial data to support commonly prescribed lifestyle interventions used in both primary and secondary prevention of gout. Despite evidence from cross‐sectional observational studies of a harmful association between the consumption of alcohol (beer, liquor), fructose, sugar‐sweetened soft drinks, sweet fruits (apples, oranges), meat, seafood (oily fish, shellfish) and gout development, and the reported protective effects of decaffeinated coffee and vitamin C intake (Choi 2010), there was no trial evidence to support these observations.
Quality of the evidence
Overall we judged the included trial (120 participants) to be at moderate overall risk of bias in view of the fact that we assessed four out of the seven domains of 'Risk of bias' assessment as unclear, with particular concern raised regarding selective reporting bias of post hoc comparison results. We suspect that the small number of trials identified is likely to be a reflection of a lack of high‐quality research in the area rather than publication bias.
Potential biases in the review process
We are confident that the broad literature search used in this review has captured relevant literature and minimised the likelihood that we missed any relevant trials. In the event of incomplete or unclear reporting of trial data, we contacted the trial authors to obtain pertinent unpublished data and sought clarification of results, respectively. In the case of eligible trials being published in languages other than English, we requested translation of trials. Two authors undertook trial selection, data extraction and 'Risk of bias' assessment independently to minimise bias.
Agreements and disagreements with other studies or reviews
The findings of our review are, in part, consistent with the conclusions of a recent paper which aimed to provide recommendations on the use of lifestyle and dietary modifications for the management of gout, while considering the potential health benefits and risks of adopting these changes on comorbidities (e.g. the metabolic syndrome) which frequently co‐exist in the same patients (Choi 2010). One of the recommendations of this review was to drink skim milk or other low‐fat dairy products (up to two servings daily), given their reported benefits in lowering serum uric acid levels (Choi 2004a; Choi 2005c) and reducing the incidence of coronary heart disease (Hu 1999), premenopausal breast cancer (Shin 2002), colon cancer (Kampman 2000) and type 2 diabetes in observational studies (Choi 2005d). We found one trial, at moderate risk of bias, which showed that skim milk had similar effects to consuming lactose powder or skim milk enriched with GMP and G600 on the frequency of gout flares.
While the other lifestyle and dietary modifications advised are likely to be beneficial in the management of comorbid cardiovascular disease and the metabolic syndrome, their role in gout management currently remains unproven, due to the lack of evidence from high‐quality trials.

Study flow diagram.

'Risk of bias' summary: review authors' judgements about each risk of bias item for each included study.

Forest plot of comparison: 1 SMP (GMP/G600) versus control (SMP/lactose), outcome: 1.1 Number of gout flares per month, after 3 months SMP (GMP/G600) versus control (SMP/lactose).

Forest plot of comparison: 1 SMP (GMP/G600) versus control (SMP/lactose), outcome: 1.2 Physical Function.
Forest plot of comparison: 1 SMP (GMP/G600) versus control (SMP/lactose), outcome: 1.3 Participant withdrawals due to adverse events.

Comparison 1 SMP (GMP/G600) versus control (SMP/lactose), Outcome 1 Number of gout flares per month, after 3 months SMP (GMP/G600) versus control (SMP/lactose).

Comparison 1 SMP (GMP/G600) versus control (SMP/lactose), Outcome 2 Physical Function.

Comparison 1 SMP (GMP/G600) versus control (SMP/lactose), Outcome 3 Participant withdrawals due to adverse events.
| Skim milk enriched with GMP/G600 compared to skim milk & lactose powder for chronic gout | ||||||
| Patient or population: patients with chronic gout | ||||||
| Outcomes | Illustrative comparative risks* (95% CI) | Relative effect | No of Participants | Quality of the evidence | Comments | |
| Assumed risk | Corresponding risk | |||||
| Skim milk & lactose powder | Skim milk enriched with GMP/G600 | |||||
| Acute gout attack frequency | The mean acute gout attack frequency in the control groups was | The mean acute gout attack frequency in the intervention groups was | 120 | ⊕⊕⊝⊝ | Not statistically significant2 | |
| Participant withdrawals due to adverse events | Study population | RR 1.27 | 120 | ⊕⊕⊝⊝ | Not statistically significant3 | |
| 138 per 1000 | 175 per 1000 | |||||
| Moderate | ||||||
| Joint pain reduction | The mean joint pain reduction in the control groups was | The mean joint pain reduction in the intervention groups was | 120 | ⊕⊕⊝⊝ | Absolute risk difference = ‐10% (‐20% to ‐1%). Relative percentage change = ‐39% (‐74% to ‐4%). NNTB = 10 (5 to 100)2 | |
| Tophus regression ‐ not measured | See comment | See comment | Not estimable | ‐ | See comment | Not measured |
| Physical function | The mean physical function in the control groups was | The mean physical function in the intervention groups was | 120 | ⊕⊕⊝⊝ | Absolute risk difference = ‐1% (‐5% to 3%). Relative percentage change = ‐13% (‐58% to 33%) NNT n/a, not statistically significant2 | |
| Serum urate normalisation4 ‐ not reported | See comment | See comment | Not estimable4 | ‐ | See comment | Not reported |
| Serious adverse events | 38 per 1000 | 50 per 1000 | RR 1.33 | 120 | ⊕⊕⊝⊝ | Gastrointestinal AEs (diarrhoea, nausea and flatulence) reported most commonly. SAE related to hospital admissions ‐ none were due to the study products.3 |
| *The basis for the assumed risk (e.g. the median control group risk across studies) is provided in footnotes. The corresponding risk (and its 95% confidence interval) is based on the assumed risk in the comparison group and the relative effect of the intervention (and its 95% CI). | ||||||
| GRADE Working Group grades of evidence | ||||||
| 1 There was selective reporting of post‐hoc comparisons between skim milk powder enriched with GMP/G600 and one of the two study controls (lactose) in relation to change in gout attack frequency from baseline | ||||||
| Outcome or subgroup title | No. of studies | No. of participants | Statistical method | Effect size |
| 1 Number of gout flares per month, after 3 months SMP (GMP/G600) versus control (SMP/lactose) Show forest plot | 1 | Mean Difference (IV, Random, 95% CI) | Subtotals only | |
| 2 Physical Function Show forest plot | 1 | Mean Difference (IV, Random, 95% CI) | Subtotals only | |
| 3 Participant withdrawals due to adverse events Show forest plot | 1 | Risk Ratio (M‐H, Random, 95% CI) | Subtotals only | |