生活方式干预措施治疗慢性痛风
Referencias
References to studies included in this review
References to studies awaiting assessment
Additional references
Characteristics of studies
Characteristics of included studies [ordered by study ID]
| Methods | Randomised, double blind, 3‐arm, parallel‐group, controlled trial Duration: 3 months Withdrawals: 18 (distribution of losses not known despite attempts to contact the study author) Pre‐specified sample size calculation: reported Intention‐to‐treat analysis: performed | |
| Participants | N = 120 Inclusion criteria: 1. Adults aged ≥ 18 years 2. Gout diagnosed (according to the American College of Rheumatology diagnostic classification, recurrent gout flares (at least 2 flares in the preceding 4 months) 3. Participants experiencing frequent gout flares at the time of study enrolment (≥ 2 flares in the preceding 4 months) Exclusion criteria: 1. Lactose intolerance Lactose group (n = 40): 1. Males, n (%): 37 (93) 2. Mean age, years (SD): 57 (16) 3. Caucasian ethnicity, n (%): 28 (70) 4. Number of self reported flares in preceding 4 months, mean (SD): 3.9 (2.7) 5. Number of gout flares in baseline month, mean (SD): 1.3 (1.5) 6. Allopurinol use, n (%): 21 (53) 7. Colchicine use, n (%): 12 (30) 8. Prednisone use, n (%): 4 (10) 9. NSAID use, n (%): 11 (28) 10. Diuretic use, n (%): 2 (5) 11. Serum urate, mmol/l, mean (SD): 0.44 (0.11) 13. Serum creatinine, μmol/l, mean (SD): 91 (18) SMP group (n = 40): 1. Males, n (%): 36 (90) 2. Mean age, years (SD): 56 (12) 3. Caucasian ethnicity, n (%): 28 (70) 4. Number of self reported flares in preceding 4 months, mean (SD): 4.5 (2.3) 5. Number of gout flares in baseline month, mean (SD): 1.1 (1.4) 6. Allopurinol use, n (%): 22 (55) 7. Colchicine use, n (%): 7 (18) 8. Prednisone use, n (%): 8 (20) 9. NSAID use, n (%): 10 (25) 10. Diuretic use, n (%): 1 (2.5) 11. Serum urate, mmol/l, mean (SD): 0.41 (0.09) 13. Serum creatinine, μmol/l, mean (SD): 91 (19) SMP/GMP/G600 (n = 40): 1. Males, n (%): 35 (88) 2. Mean age, years (SD): 56 (13) 3. Caucasian ethnicity, n (%): 22 (55) 4. Number of self reported flares in preceding 4 months, mean (SD): 5.1 (9.6) 5. Number of gout flares in baseline month, mean (SD): 1.8 (2.4) 6. Allopurinol use, n (%): 22 (55) 7. Colchicine use, n (%): 13 (33) 11. Serum urate, mmol/l, mean (SD): 0.42 (0.11) 13. Serum creatinine, μmol/l, mean (SD): 93 (20) | |
| Interventions | Intervention 1: lactose powder active control Intervention 2: skim milk powder (SMP) active control Intervention 3: SMP enriched with GMP and G600 (1.5 g GMP protein (10% total protein) and 0.525 g G600 (3.5% of total protein weight)) | |
| Outcomes | Outcome assessments at 1, 2 and 3 months: Primary endpoint: change in frequency of gout flares Secondary endpoints: 1. Change in swollen joint count (/66) 2. Change in tender joint count (/68) 3. Pain (10‐point Likert), (scored 0 to 10) where 0 (no pain) and 10 (severe pain) 4. Patient global assessment (0 to 100), where 0 (very well) and 100 (very poor) 5. C‐reactive protein (CRP) (mg/l) 6. Serum uric acid concentration (mmol/l) 7. Fractional excretion of UA (%) 8. Health Assessment Questionnaire (HAQ‐II), 10‐item questionnaire, each item scored from 0 (without any difficulty) to 3 (unable to perform). Sum of the scores of each questionnaire item is divided by the number of questions answered to obtain a value between 0 (minimal loss of function) and 3 (completely disabled) 9. Open‐ended enquiry to elicit adverse events | |
| Notes | Unpublished data (HAQ results) sought and received from the study author | |
| Risk of bias | ||
| Bias | Authors' judgement | Support for judgement |
| Random sequence generation (selection bias) | Low risk | Quote: "Patients were randomized using a random block randomization algorithm" |
| Allocation concealment (selection bias) | Unclear risk | Quote: "Participants and study staff were blinded to treatment allocation throughout the study..." Comment: insufficient details provided of the actual method of allocation concealment to intervention. No further information obtained in spite of attempts to contact the study author. |
| Blinding of participants and personnel (performance bias) | Low risk | Quote: "The products were dry‐blended and packed into identical, custom‐made aluminium foil sachets...Each intervention was a cream‐coloured powder administered daily as a 250 ml vanilla flavoured shake" |
| Blinding of outcome assessment (detection bias) | Low risk | 1. Gout flare frequency 2. Patient global assessment 3. Health assessment questionnaire (HAQ‐II) |
| Blinding of outcome assessment (detection bias) | Unclear risk | 1. Tender joint count 2. Swollen joint count 3. Adverse events Quote: "Study staff were blinded to treatment allocation throughout the study..." Comment: although not explicitly stated, it was implied from the aforementioned statement that outcome assessors were blinded. No further clarification was available despite attempts to contact the study author. |
| Blinding of outcome assessment (detection bias) | Unclear risk | 1. Serum urate concentration 2. Fractional excretion of uric acid 3. C‐reactive protein Quote: "Study staff were blinded to treatment allocation throughout the study..." Comment: although not explicitly stated, it was implied from the aforementioned statement that outcome assessors were blinded. No further clarification was available despite attempts to contact the study author. |
| Incomplete outcome data (attrition bias) | Unclear risk | Quote: "Of the 120 patients enrolled in the study, two patients discontinued due to adverse events, eight were lost to follow‐up, and eight continued in the study without taking the milk products after experiencing an adverse event (intention to treat). One hundred and two patients completed the study as per protocol." Comment: distribution of drop‐outs between groups not specified. No further clarification was available despite attempts to contact the study author. |
| Selective reporting (reporting bias) | Unclear risk | Comment: all prespecified outcomes reported. There was selective reporting of a post hoc comparison between SMP/GMP/G600 and lactose powder control on change in gout flare frequency and lowering of diastolic BP. |
| Other bias | Unclear risk | Quote: "The study was registered as a clinical trial with the Australian New Zealand Clinical Trials Registry (ACTRN12609000479202)". COI: "This work was funded by LactoPharma (a joint venture between Fonterra Ltd, Fonterra R&D Ltd and Auckland UniServices Ltd) and the New Zealand Government Foundation for Research Science and Technology. Barbara Kuhn‐Sherlock, Alastair MacGibbon and Kate Palmano are employees of Fonterra Co‐operative Group Ltd. Alastair MacGibbon, Nicola Dalbeth and Kate Palmano are named inventors on a patent application related to milk products and gout." |
BP: blood pressure
COI: conflict of interest
NSAID: non‐steroidal anti‐inflammatory drug
SD: standard deviation
SMP: skim milk powder
UA: uric acid
Characteristics of studies awaiting assessment [ordered by study ID]
Ir a:
| Methods | |
| Participants | |
| Interventions | |
| Outcomes | |
| Notes | Awaiting translation |
| Methods | |
| Participants | |
| Interventions | |
| Outcomes | |
| Notes | Awaiting translation |
Data and analyses
| Outcome or subgroup title | No. of studies | No. of participants | Statistical method | Effect size |
| 1 Number of gout flares per month, after 3 months SMP (GMP/G600) versus control (SMP/lactose) Show forest plot | 1 | Mean Difference (IV, Random, 95% CI) | Subtotals only | |
| Analysis 1.1  Comparison 1 SMP (GMP/G600) versus control (SMP/lactose), Outcome 1 Number of gout flares per month, after 3 months SMP (GMP/G600) versus control (SMP/lactose). | ||||
| 2 Physical Function Show forest plot | 1 | Mean Difference (IV, Random, 95% CI) | Subtotals only | |
| Analysis 1.2  Comparison 1 SMP (GMP/G600) versus control (SMP/lactose), Outcome 2 Physical Function. | ||||
| 3 Participant withdrawals due to adverse events Show forest plot | 1 | Risk Ratio (M‐H, Random, 95% CI) | Subtotals only | |
| Analysis 1.3  Comparison 1 SMP (GMP/G600) versus control (SMP/lactose), Outcome 3 Participant withdrawals due to adverse events. | ||||

Study flow diagram.

'Risk of bias' summary: review authors' judgements about each risk of bias item for each included study.

Forest plot of comparison: 1 SMP (GMP/G600) versus control (SMP/lactose), outcome: 1.1 Number of gout flares per month, after 3 months SMP (GMP/G600) versus control (SMP/lactose).

Forest plot of comparison: 1 SMP (GMP/G600) versus control (SMP/lactose), outcome: 1.2 Physical Function.
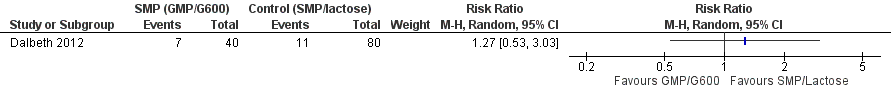
Forest plot of comparison: 1 SMP (GMP/G600) versus control (SMP/lactose), outcome: 1.3 Participant withdrawals due to adverse events.

Comparison 1 SMP (GMP/G600) versus control (SMP/lactose), Outcome 1 Number of gout flares per month, after 3 months SMP (GMP/G600) versus control (SMP/lactose).

Comparison 1 SMP (GMP/G600) versus control (SMP/lactose), Outcome 2 Physical Function.

Comparison 1 SMP (GMP/G600) versus control (SMP/lactose), Outcome 3 Participant withdrawals due to adverse events.
| Skim milk enriched with GMP/G600 compared to skim milk & lactose powder for chronic gout | ||||||
| Patient or population: patients with chronic gout | ||||||
| Outcomes | Illustrative comparative risks* (95% CI) | Relative effect | No of Participants | Quality of the evidence | Comments | |
| Assumed risk | Corresponding risk | |||||
| Skim milk & lactose powder | Skim milk enriched with GMP/G600 | |||||
| Acute gout attack frequency | The mean acute gout attack frequency in the control groups was | The mean acute gout attack frequency in the intervention groups was | 120 | ⊕⊕⊝⊝ | Not statistically significant2 | |
| Participant withdrawals due to adverse events | Study population | RR 1.27 | 120 | ⊕⊕⊝⊝ | Not statistically significant3 | |
| 138 per 1000 | 175 per 1000 | |||||
| Moderate | ||||||
| Joint pain reduction | The mean joint pain reduction in the control groups was | The mean joint pain reduction in the intervention groups was | 120 | ⊕⊕⊝⊝ | Absolute risk difference = ‐10% (‐20% to ‐1%). Relative percentage change = ‐39% (‐74% to ‐4%). NNTB = 10 (5 to 100)2 | |
| Tophus regression ‐ not measured | See comment | See comment | Not estimable | ‐ | See comment | Not measured |
| Physical function | The mean physical function in the control groups was | The mean physical function in the intervention groups was | 120 | ⊕⊕⊝⊝ | Absolute risk difference = ‐1% (‐5% to 3%). Relative percentage change = ‐13% (‐58% to 33%) NNT n/a, not statistically significant2 | |
| Serum urate normalisation4 ‐ not reported | See comment | See comment | Not estimable4 | ‐ | See comment | Not reported |
| Serious adverse events | 38 per 1000 | 50 per 1000 | RR 1.33 | 120 | ⊕⊕⊝⊝ | Gastrointestinal AEs (diarrhoea, nausea and flatulence) reported most commonly. SAE related to hospital admissions ‐ none were due to the study products.3 |
| *The basis for the assumed risk (e.g. the median control group risk across studies) is provided in footnotes. The corresponding risk (and its 95% confidence interval) is based on the assumed risk in the comparison group and the relative effect of the intervention (and its 95% CI). | ||||||
| GRADE Working Group grades of evidence | ||||||
| 1 There was selective reporting of post‐hoc comparisons between skim milk powder enriched with GMP/G600 and one of the two study controls (lactose) in relation to change in gout attack frequency from baseline | ||||||
| Outcome or subgroup title | No. of studies | No. of participants | Statistical method | Effect size |
| 1 Number of gout flares per month, after 3 months SMP (GMP/G600) versus control (SMP/lactose) Show forest plot | 1 | Mean Difference (IV, Random, 95% CI) | Subtotals only | |
| 2 Physical Function Show forest plot | 1 | Mean Difference (IV, Random, 95% CI) | Subtotals only | |
| 3 Participant withdrawals due to adverse events Show forest plot | 1 | Risk Ratio (M‐H, Random, 95% CI) | Subtotals only | |