Medicación antimicótica oral para la onicomicosis de la uña del pie
Información
- DOI:
- https://doi.org/10.1002/14651858.CD010031.pub2Copiar DOI

- Base de datos:
-
- Cochrane Database of Systematic Reviews
- Versión publicada:
-
- 14 julio 2017see what's new
- Tipo:
-
- Intervention
- Etapa:
-
- Review
- Grupo Editorial Cochrane:
-
Grupo Cochrane de Piel
- Copyright:
-
- Copyright © 2017 The Cochrane Collaboration. Published by John Wiley & Sons, Ltd.
Cifras del artículo
Altmetric:
Citado por:
Autores
Contributions of authors
SKK was the contact person with the editorial base.
SKK coordinated contributions from the co‐authors and wrote the final draft of the review.
SKK and KH screened papers against eligibility criteria.
SKK obtained data on ongoing and unpublished studies.
SKK, KH, GK, and LG appraised the quality of papers.
SKK, KH, GK, and LG extracted data for the review and sought additional information about papers.
SKK, KH, GK, and LG entered data into RevMan.
SKK and MVD analysed and interpreted data.
SKK, SB‐S and MVD wrote the Methods section.
SB‐S edited the protocol and the review.
SB‐S and MVD commented on all drafts and advised on methods and interpretation.
SKK drafted the clinical sections of the Background and responded to the clinical comments of the referees.
SKK and MVD responded to the methodology and statistics comments of the referees.
SVB‐S was the consumer co‐author and checked the review for readability and clarity, as well as ensuring outcomes are relevant to consumers.
SKK is the guarantor of the update.
Disclaimer
This project was supported by the National Institute for Health Research, via Cochrane Infrastructure funding to the Cochrane Skin Group. The views and opinions expressed therein are those of the authors and do not necessarily reflect those of the Systematic Reviews Programme, NIHR, NHS or the Department of Health.
Sources of support
Internal sources
-
No sources of support supplied
External sources
-
The National Institute for Health Research (NIHR), UK.
The NIHR, UK, is the largest single funder of the Cochrane Skin Group.
Declarations of interest
Sanne Kreijkamp‐Kaspers: none known.
Kate Hawke: none known.
Linda Guo: none known.
George Kerin: none known.
Sally EM Bell‐Syer: none known.
Parker Magin: none known.
Sophie V Bell‐Syer: none known.
Mieke L van Driel: none known.
Acknowledgements
The Cochrane Skin Group editorial base wishes to thank Sue Jessop who was the Key Editor for this review; Ben Carter and Esther van Zuuren, who were the Statistical and Methods Editors, respectively; and the clinical referees, Chinmanat Tangjaturonrusamee and Shari Lipner. We also thank Meggan Harris, who copy‐edited the review.
Some parts of the Background and Methods sections of this review use text that was originally written by author Sally Bell‐Syer for use in the original review protocol (Bell‐Syer 2004), which has now been withdrawn, and in other Cochrane reviews, in her role as Cochrane Review author or Managing Editor of the Cochrane Wounds Group.
Version history
| Published | Title | Stage | Authors | Version |
| 2017 Jul 14 | Oral antifungal medication for toenail onychomycosis | Review | Sanne Kreijkamp‐Kaspers, Kate Hawke, Linda Guo, George Kerin, Sally EM Bell‐Syer, Parker Magin, Sophie V Bell‐Syer, Mieke L van Driel | |
| 2012 Aug 15 | Oral antifungal medication for toenail onychomycosis | Protocol | Sanne Kreijkamp‐Kaspers, Sally EM Bell‐Syer, Parker Magin, Sophie V Bell‐Syer, Mieke L van Driel | |
Differences between protocol and review
The objectives in the Abstract and Main text have been changed from "To compare the benefits and harms of oral antifungal treatments for toenail onychomycosis'" to "To assess the effects of oral antifungal treatments for toenail onychomycosis" according to the Cochrane recommended format.
Types of studies: we clarified that we would included cross‐over trials in this review; however, we did not identify any.
Types of participants: we edited this from "Participants of all ages with toenail onychomycosis confirmed by positive cultures or confirmed fungal elements on direct microscopy or histological examination of the nail" to "Participants of all ages with toenail onychomycosis confirmed by at least one positive culture or confirmed fungal elements on direct microscopy or histological examination of the nail" to make the number of positive cultures needed clear.
Types of interventions: we added, "we did not consider dose‐finding studies of the same drug unless they also contained a placebo group" to clarify that we aimed to compare different medications, not different doses of the same medication.
Types of outcome measures: when measurements took place at multiple time points during the intervention, we consider the measurement at the predefined endpoint of the study as our primary outcome.
The secondary outcome measure "time to recurrence" was changed to recurrence rate. This is because none of the studies reported time to recurrence, and the review authors agreed to report a recurrence rate instead.
Searching other resources, 'Unpublished literature': in the protocol, we planned to contact further companies producing other products identified from trials, but we did not identify any.
Compared with the published protocol, there were some alterations in the tasks completed by review authors: the third review author acting as arbiter was MvD rather than SaBS; four review authors (SKK, LG, GK, KH) independently extracted data using a data extraction form rather than SKK and PM. Two review authors (SKK plus LG, GK or KH) independently assessed each included study using Cochrane's tool for assessing risk of bias rather than SKK and PM (Higgins 2011). We added authors to the review team after the publication of the protocol to reduce to workload in view of the large number of included studies. To ensure consistency, SKK was involved in the data extraction and 'Risk of bias' assessment of all included studies.
Data collection and analysis: we included six 'Summary of findings' tables for six comparisons, which included all of our primary and secondary outcomes. We also used the GRADE approach to assess the quality of all outcomes using the following five domains: risk of bias, inconsistency, imprecision, indirectness and publication bias. Quality of evidence could be either high, moderate, low, or very low (Higgins 2011; Schünemann 2013).
Measures of treatment effect: we were not able to present continuous data as mean difference (MD) or standardised mean difference or overall effect size with standard deviations (SD) as planned in the protocol, because all data were presented as dichotomous.
Assessment of heterogeneity: we used a random‐effects model for all analyses instead of a fixed‐effect model when statistical heterogeneity was low, as in the absence of heterogeneity the random‐effects model would have similar results as a fixed‐effect model.
Subgroup analysis and investigation of heterogeneity: we conducted subgroup analyses based on short‐ and long‐term follow‐up, based on the notion that a toenail will need at least 12 months to fully grow out (Geyer 2004); this affects the assessment of clinical cure in particular. We could not perform the planned subgroups based on subtype of onychomycosis or underlying health conditions, as we did not identify trials looking at these subgroups specifically.
Keywords
MeSH
Medical Subject Headings (MeSH) Keywords
- Administration, Oral;
- Antifungal Agents [administration & dosage, adverse effects, *therapeutic use];
- Azoles [administration & dosage, adverse effects, *therapeutic use];
- Foot Dermatoses [*drug therapy];
- Griseofulvin [administration & dosage, adverse effects, *therapeutic use];
- Naphthalenes [administration & dosage, adverse effects, *therapeutic use];
- Onychomycosis [*drug therapy];
- Randomized Controlled Trials as Topic;
- Recurrence;
- Secondary Prevention;
- Terbinafine;
Medical Subject Headings Check Words
Adult; Aged; Female; Humans; Male; Middle Aged;
PICO

Study flow diagram.

Risk of bias summary: review authors' judgements about each risk of bias item for each included study.

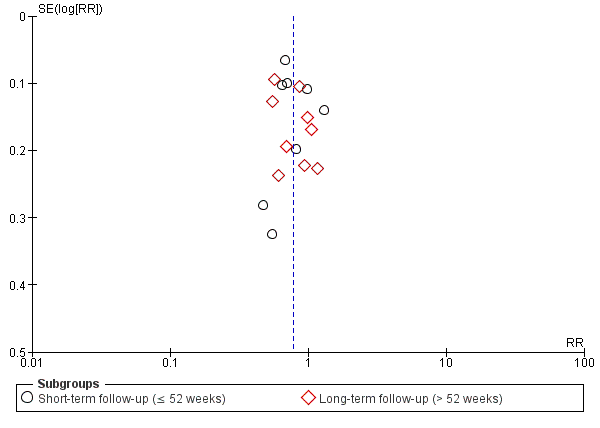
Funnel plot of comparison: 3 Azole versus terbinafine, outcome: 3.1 Clinical cure.
Funnel plot of comparison: 3 Azole versus terbinafine, outcome: 3.2 Mycological cure.
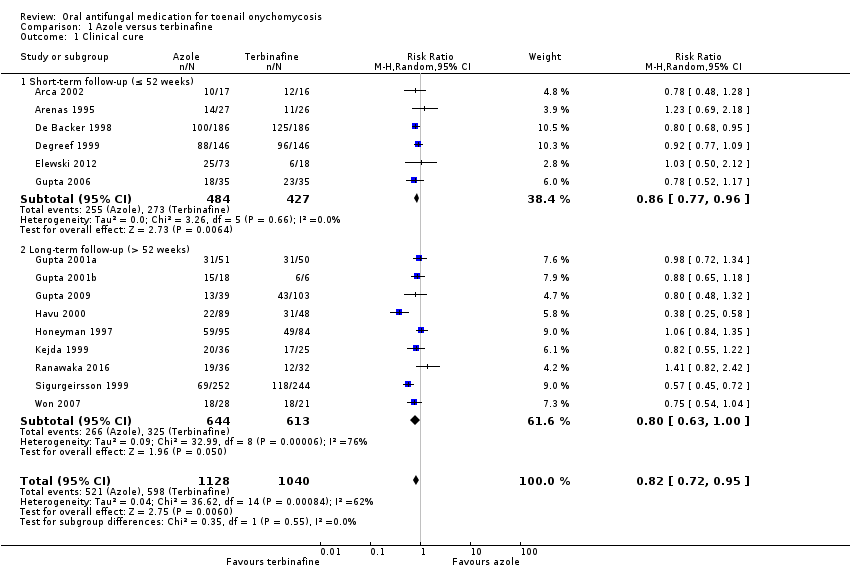
Comparison 1 Azole versus terbinafine, Outcome 1 Clinical cure.

Comparison 1 Azole versus terbinafine, Outcome 2 Mycological cure.

Comparison 1 Azole versus terbinafine, Outcome 3 Adverse events.

Comparison 1 Azole versus terbinafine, Outcome 4 Recurrence rate.

Comparison 2 Terbinafine versus placebo, Outcome 1 Clinical cure.
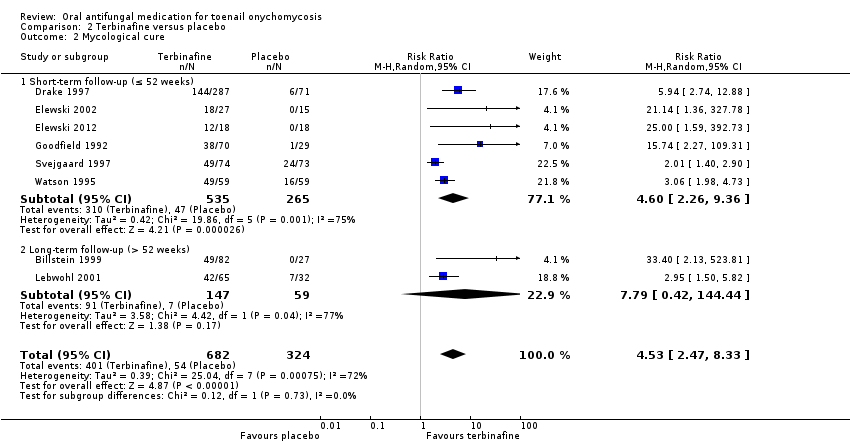
Comparison 2 Terbinafine versus placebo, Outcome 2 Mycological cure.

Comparison 2 Terbinafine versus placebo, Outcome 3 Adverse events.

Comparison 2 Terbinafine versus placebo, Outcome 4 Recurrence rate.
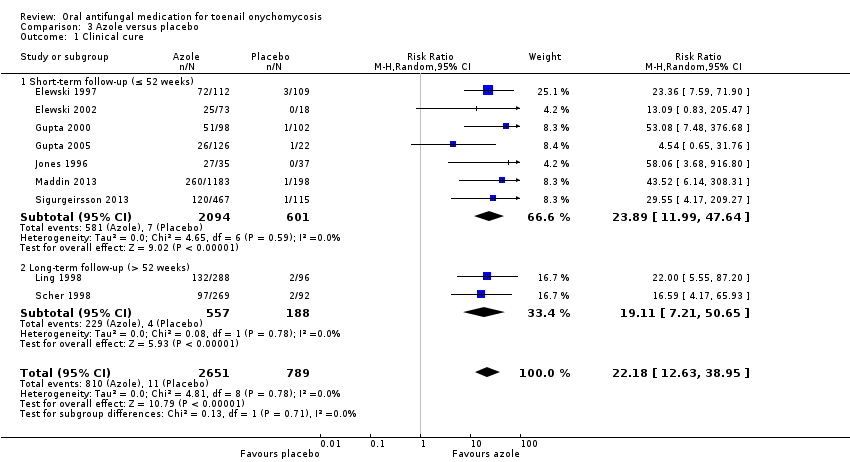
Comparison 3 Azole versus placebo, Outcome 1 Clinical cure.

Comparison 3 Azole versus placebo, Outcome 2 Mycological cure.
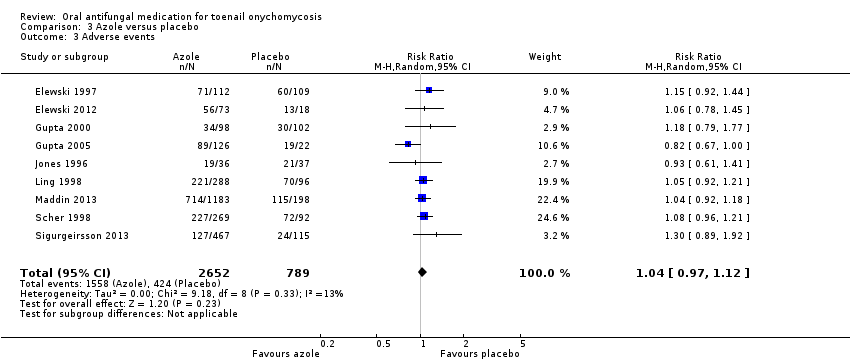
Comparison 3 Azole versus placebo, Outcome 3 Adverse events.
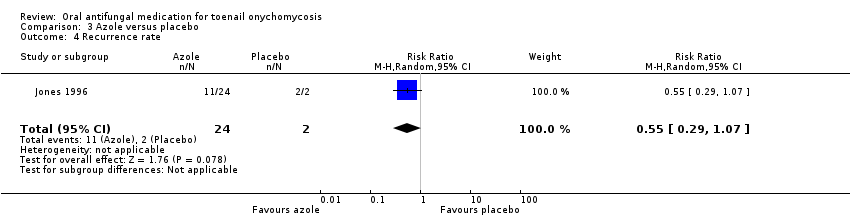
Comparison 3 Azole versus placebo, Outcome 4 Recurrence rate.

Comparison 4 Griseofulvin versus azole, Outcome 1 Clinical cure.

Comparison 4 Griseofulvin versus azole, Outcome 2 Mycological cure.

Comparison 4 Griseofulvin versus azole, Outcome 3 Adverse events.

Comparison 4 Griseofulvin versus azole, Outcome 4 Recurrence rate.

Comparison 5 Griseofulvin versus terbinafine, Outcome 1 Clinical cure.
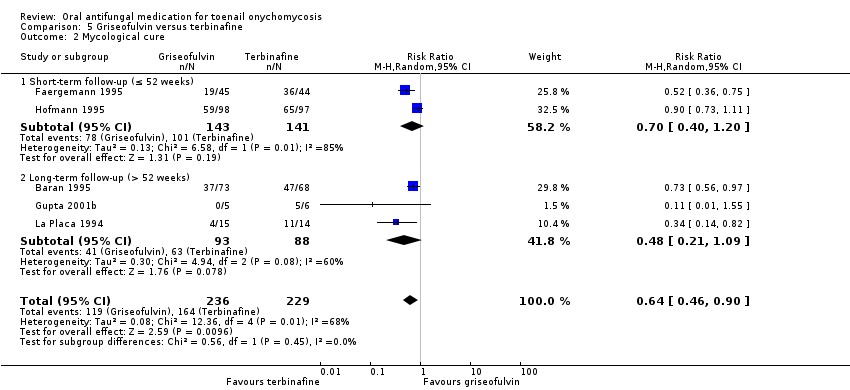
Comparison 5 Griseofulvin versus terbinafine, Outcome 2 Mycological cure.

Comparison 5 Griseofulvin versus terbinafine, Outcome 3 Adverse events.
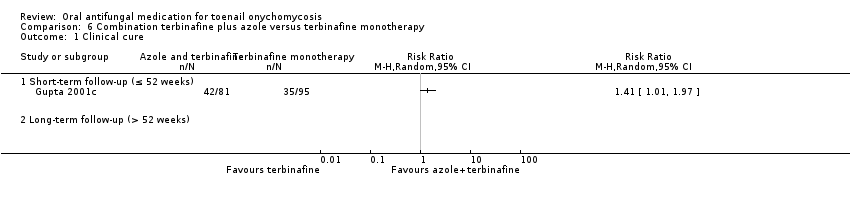
Comparison 6 Combination terbinafine plus azole versus terbinafine monotherapy, Outcome 1 Clinical cure.

Comparison 6 Combination terbinafine plus azole versus terbinafine monotherapy, Outcome 2 Mycological cure.

Comparison 6 Combination terbinafine plus azole versus terbinafine monotherapy, Outcome 3 Adverse events.
| Azole compared to terbinafine for toenail onychomycosis | |||||
| Patient or population: participants with confirmed toenail onychomycosis | |||||
| Outcomes | Anticipated absolute effects* (95% CI) | Relative effect | № of participants | Quality of the evidence | |
| Risk with terbinafine | Risk with azole | ||||
| Clinical cure | Study population | RR 0.82 | 2168 | ⊕⊕⊕⊝ | |
| 575 per 1000 | 471 per 1000 | ||||
| Mycological cure | Study population | RR 0.77 | 2544 | ⊕⊕⊕⊝ | |
| 682 per 1000 | 525 per 1000 | ||||
| Adverse events | Study population | RR 1.00 | 1762 | ⊕⊕⊕⊝ | |
| 346 per 1000 | 346 per 1000 | ||||
| Recurrence rate | Study population | RR 1.11 | 282 | ⊕⊕⊝⊝ | |
| 333 per 1000 | 370 per 1000 | ||||
| Quality of life | None of the studies addressed quality of life. | ||||
| *The risk in the intervention group (and its 95% confidence interval) is based on the assumed risk in the comparison group and the relative effect of the intervention (and its 95% CI). | |||||
| GRADE Working Group grades of evidence | |||||
| aDowngraded by one level for risk of bias because of large number of unblinded studies, lack of description of randomisation process and allocation concealment for most studies. | |||||
| Terbinafine compared to placebo for toenail onychomycosis | |||||
| Patient or population: patients with confirmed toenail onychomycosis | |||||
| Outcomes | Anticipated absolute effects* (95% CI) | Relative effect | № of participants | Quality of the evidence | |
| Risk with placebo | Risk with terbinafine | ||||
| Clinical cure | Study population | RR 6.00 | 1006 | ⊕⊕⊕⊕ | |
| 62 per 1000 | 370 per 1000 | ||||
| Mycological cure | Study population | RR 4.53 | 1006 | ⊕⊕⊕⊕ | |
| 167 per 1000 | 755 per 1000 | ||||
| Adverse events | Study population | RR 1.13 | 399 | ⊕⊕⊕⊝ | |
| 429 per 1000 | 484 per 1000 | ||||
| Recurrence rate | 667 per 1000 | 33 per 1000 (7 to 253) | RR 0.05 (0.01 to 0.38) | 35 | ⊕⊕⊝⊝ |
| Quality of life | Not addressed by any of the trials | ||||
| *The risk in the intervention group (and its 95% confidence interval) is based on the assumed risk in the comparison group and the relative effect of the intervention (and its 95% CI). | |||||
| GRADE Working Group grades of evidence | |||||
| aLarge number of unblinded studies and studies with poor description of blinding and randomisation but large effect estimate; therefore, this outcome was not downgraded for risk of bias as the quality of evidence was considered to be high because of the large effect observed. | |||||
| Azole compared to placebo for toenail onychomycosis | |||||
| Patient or population: participants with confirmed toenail onychomycosis | |||||
| Outcomes | Anticipated absolute effects* (95% CI) | Relative effect | № of participants | Quality of the evidence | |
| Risk with placebo | Risk with azole | ||||
| Clinical cure | Study population | RR 22.18 (12.63 to 38.95) | 3440 | ⊕⊕⊕⊕ | |
| 14 per 1000 | 309 per 1000 (176 to 543) | ||||
| Mycological cure | Study population | RR 5.86 | 3440 | ⊕⊕⊕⊕ | |
| 74 per 1000 | 431 per 1000 | ||||
| Adverse events | Study population | RR 1.04 | 3441 | ⊕⊕⊕⊝ | |
| 537 per 1000 | 559 per 1000 | ||||
| Recurrence rate | Study population | RR 0.55 (0.29 to 1.07) | 26 (1 RCT) | ⊕⊕⊝⊝ | |
| 1000 per 1000 | 550 per 1000 (290 to 1000) | ||||
| Quality of life | None of the studies addressed quality of life. | ||||
| *The risk in the intervention group (and its 95% confidence interval) is based on the assumed risk in the comparison group and the relative effect of the intervention (and its 95% CI). | |||||
| GRADE Working Group grades of evidence | |||||
| aLarge number of unblinded studies and studies with poor description of blinding and randomisation, but large effect estimate; therefore, this outcome was not downgraded for risk of bias as the quality of evidence was considered to be high because of the large effect observed. | |||||
| Griseofulvin compared to azole for toenail onychomycosis | |||||
| Patient or population: participants with confirmed toenail onychomycosis | |||||
| Outcomes | Anticipated absolute effects* (95% CI) | Relative effect | № of participants | Quality of the evidence | |
| Risk with azole | Risk with griseofulvin | ||||
| Clinical cure | Study population | RR 0.94 | 222 | ⊕⊕⊕⊝ | |
| 144 per 1000 | 136 per 1000 | ||||
| Mycological cure | Study population | RR 0.87 | 222 | ⊕⊕⊕⊝ | |
| 186 per 1000 | 161 per 1000 | ||||
| Adverse events | Study population | RR 2.41 | 143 | ⊕⊕⊕⊝ | |
| 276 per 1000 | 665 per 1000 | ||||
| Recurrence rate | Study population | RR 4.00 | 7 | ⊕⊝⊝⊝ | |
| 0 per 1000 | 0 per 1000 | ||||
| Quality of life | None of the studies addressed quality of life. | ||||
| *The risk in the intervention group (and its 95% confidence interval) is based on the assumed risk in the comparison group and the relative effect of the intervention (and its 95% CI). | |||||
| GRADE Working Group grades of evidence | |||||
| aDowngraded by one level due to risk of bias (about half of the studies were not blinded). | |||||
| Griseofulvin compared to terbinafine for toenail onychomycosis | |||||
| Patient or population: participants with confirmed toenail onychomycosis | |||||
| Outcomes | Anticipated absolute effects* (95% CI) | Relative effect | № of participants | Quality of the evidence | |
| Risk with terbinafine | Risk with Griseofulvin | ||||
| Clinical cure | Study population | RR 0.32 | 270 | ⊕⊕⊝⊝ | |
| 561 per 1000 | 179 per 1000 | ||||
| Mycological cure | Study population | RR 0.64 | 465 | ⊕⊕⊝⊝ | |
| 716 per 1000 | 458 per 1000 | ||||
| Adverse events | Study population | RR 2.09 | 100 | ⊕⊕⊝⊝ | |
| 160 per 1000 | 334 per 1000 | ||||
| Recurrence rate | No studies addressed recurrence rate. | ||||
| Quality of life | No studies addressed quality of life. | ||||
| *The risk in the intervention group (and its 95% confidence interval) is based on the assumed risk in the comparison group and the relative effect of the intervention (and its 95% CI). | |||||
| GRADE Working Group grades of evidence | |||||
| aDowngraded by two levels due to risk of bias (two studies not blinded; other studies at unclear risk for blinding of participant and outcome assessor). | |||||
| Combination terbinafine plus azole compared to terbinafine monotherapy for toenail onychomycosis | |||||
| Patient or population: participants with confirmed toenail onychomycosis | |||||
| Outcomes | Anticipated absolute effects* (95% CI) | Relative effect | № of participants | Quality of the evidence | |
| Risk with terbinafine monotherapy | Risk with combination terbinafine plus azole | ||||
| Clinical cure | Study population | RR 1.41 (1.01 to 1.97) | 176 | ⊕⊝⊝⊝ | |
| 368 per 1000 | 519 per 1000 (732 to 726) | ||||
| Mycological cure | Study population | RR 1.41 (1.08 to 1.83) | 176 | ⊕⊝⊝⊝ | |
| 474 per 1000 | 668 per 1000 | ||||
| Adverse events | Study population | RR 0.64 | 176 | ⊕⊕⊝⊝ | |
| 232 per 1000 | 148 per 1000 | ||||
| Recurrence rate | No studies addressed recurrence rate. | ||||
| Quality of life | No studies addressed quality of life. | ||||
| *The risk in the intervention group (and its 95% confidence interval) is based on the assumed risk in the comparison group and the relative effect of the intervention (and its 95% CI). | |||||
| GRADE Working Group grades of evidence | |||||
| aDowngraded by three levels due to risk of bias (two levels: single non‐blinded study) and imprecision (single study). | |||||
| Outcome or subgroup title | No. of studies | No. of participants | Statistical method | Effect size |
| 1 Clinical cure Show forest plot | 15 | 2168 | Risk Ratio (M‐H, Random, 95% CI) | 0.82 [0.72, 0.95] |
| 1.1 Short‐term follow‐up (≤ 52 weeks) | 6 | 911 | Risk Ratio (M‐H, Random, 95% CI) | 0.86 [0.77, 0.96] |
| 1.2 Long‐term follow‐up (> 52 weeks) | 9 | 1257 | Risk Ratio (M‐H, Random, 95% CI) | 0.80 [0.63, 1.00] |
| 2 Mycological cure Show forest plot | 17 | 2544 | Risk Ratio (M‐H, Random, 95% CI) | 0.77 [0.68, 0.88] |
| 2.1 Short‐term follow‐up (≤ 52 weeks) | 8 | 1287 | Risk Ratio (M‐H, Random, 95% CI) | 0.77 [0.64, 0.93] |
| 2.2 Long‐term follow‐up (> 52 weeks) | 9 | 1257 | Risk Ratio (M‐H, Random, 95% CI) | 0.78 [0.64, 0.95] |
| 3 Adverse events Show forest plot | 9 | 1762 | Risk Ratio (M‐H, Random, 95% CI) | 1.00 [0.86, 1.17] |
| 4 Recurrence rate Show forest plot | 5 | 282 | Risk Ratio (M‐H, Random, 95% CI) | 1.11 [0.68, 1.79] |
| Outcome or subgroup title | No. of studies | No. of participants | Statistical method | Effect size |
| 1 Clinical cure Show forest plot | 8 | 1006 | Risk Ratio (M‐H, Random, 95% CI) | 6.00 [3.96, 9.08] |
| 1.1 Short‐term follow‐up (≤ 52 weeks) | 6 | 800 | Risk Ratio (M‐H, Random, 95% CI) | 5.60 [3.66, 8.55] |
| 1.2 Long‐term follow‐up (> 52 weeks) | 2 | 206 | Risk Ratio (M‐H, Random, 95% CI) | 26.01 [3.69, 183.44] |
| 2 Mycological cure Show forest plot | 8 | 1006 | Risk Ratio (M‐H, Random, 95% CI) | 4.53 [2.47, 8.33] |
| 2.1 Short‐term follow‐up (≤ 52 weeks) | 6 | 800 | Risk Ratio (M‐H, Random, 95% CI) | 4.60 [2.26, 9.36] |
| 2.2 Long‐term follow‐up (> 52 weeks) | 2 | 206 | Risk Ratio (M‐H, Random, 95% CI) | 7.79 [0.42, 144.44] |
| 3 Adverse events Show forest plot | 4 | 399 | Risk Ratio (M‐H, Random, 95% CI) | 1.13 [0.87, 1.47] |
| 4 Recurrence rate Show forest plot | 1 | 35 | Risk Ratio (M‐H, Random, 95% CI) | 0.05 [0.01, 0.38] |
| Outcome or subgroup title | No. of studies | No. of participants | Statistical method | Effect size |
| 1 Clinical cure Show forest plot | 9 | 3440 | Risk Ratio (M‐H, Random, 95% CI) | 22.18 [12.63, 38.95] |
| 1.1 Short‐term follow‐up (≤ 52 weeks) | 7 | 2695 | Risk Ratio (M‐H, Random, 95% CI) | 23.89 [11.99, 47.64] |
| 1.2 Long‐term follow‐up (> 52 weeks) | 2 | 745 | Risk Ratio (M‐H, Random, 95% CI) | 19.11 [7.21, 50.65] |
| 2 Mycological cure Show forest plot | 9 | 3440 | Risk Ratio (M‐H, Random, 95% CI) | 5.86 [3.23, 10.62] |
| 2.1 Short‐term follow‐up (≤ 52 weeks) | 7 | 2695 | Risk Ratio (M‐H, Random, 95% CI) | 7.05 [2.91, 17.07] |
| 2.2 Long‐term follow‐up (> 52 weeks) | 2 | 745 | Risk Ratio (M‐H, Random, 95% CI) | 4.22 [2.34, 7.59] |
| 3 Adverse events Show forest plot | 9 | 3441 | Risk Ratio (M‐H, Random, 95% CI) | 1.04 [0.97, 1.12] |
| 4 Recurrence rate Show forest plot | 1 | 26 | Risk Ratio (M‐H, Random, 95% CI) | 0.55 [0.29, 1.07] |
| Outcome or subgroup title | No. of studies | No. of participants | Statistical method | Effect size |
| 1 Clinical cure Show forest plot | 5 | 222 | Risk Ratio (M‐H, Random, 95% CI) | 0.94 [0.45, 1.96] |
| 1.1 Short‐term follow‐up (≤ 52 weeks) | 2 | 60 | Risk Ratio (M‐H, Random, 95% CI) | 0.89 [0.32, 2.45] |
| 1.2 Long‐term follow‐up (> 52 weeks) | 3 | 162 | Risk Ratio (M‐H, Random, 95% CI) | 1.00 [0.34, 2.93] |
| 2 Mycological cure Show forest plot | 5 | 222 | Risk Ratio (M‐H, Random, 95% CI) | 0.87 [0.50, 1.51] |
| 2.1 Short‐term follow‐up (≤ 52 weeks) | 2 | 60 | Risk Ratio (M‐H, Random, 95% CI) | 0.96 [0.52, 1.76] |
| 2.2 Long‐term follow‐up (> 52 weeks) | 3 | 162 | Risk Ratio (M‐H, Random, 95% CI) | 0.58 [0.16, 2.10] |
| 3 Adverse events Show forest plot | 2 | 143 | Risk Ratio (M‐H, Random, 95% CI) | 2.41 [1.56, 3.73] |
| 4 Recurrence rate Show forest plot | 1 | 7 | Risk Ratio (M‐H, Random, 95% CI) | 4.0 [0.26, 61.76] |
| Outcome or subgroup title | No. of studies | No. of participants | Statistical method | Effect size |
| 1 Clinical cure Show forest plot | 4 | 270 | Risk Ratio (M‐H, Random, 95% CI) | 0.32 [0.14, 0.72] |
| 1.1 Short‐term follow‐up (≤ 52 weeks) | 1 | 89 | Risk Ratio (M‐H, Random, 95% CI) | 0.05 [0.01, 0.39] |
| 1.2 Long‐term follow‐up (> 52 weeks) | 3 | 181 | Risk Ratio (M‐H, Random, 95% CI) | 0.51 [0.36, 0.71] |
| 2 Mycological cure Show forest plot | 5 | 465 | Risk Ratio (M‐H, Random, 95% CI) | 0.64 [0.46, 0.90] |
| 2.1 Short‐term follow‐up (≤ 52 weeks) | 2 | 284 | Risk Ratio (M‐H, Random, 95% CI) | 0.70 [0.40, 1.20] |
| 2.2 Long‐term follow‐up (> 52 weeks) | 3 | 181 | Risk Ratio (M‐H, Random, 95% CI) | 0.48 [0.21, 1.09] |
| 3 Adverse events Show forest plot | 2 | 100 | Risk Ratio (M‐H, Random, 95% CI) | 2.09 [1.15, 3.82] |
| Outcome or subgroup title | No. of studies | No. of participants | Statistical method | Effect size |
| 1 Clinical cure Show forest plot | 1 | Risk Ratio (M‐H, Random, 95% CI) | Totals not selected | |
| 1.1 Short‐term follow‐up (≤ 52 weeks) | 1 | Risk Ratio (M‐H, Random, 95% CI) | 0.0 [0.0, 0.0] | |
| 1.2 Long‐term follow‐up (> 52 weeks) | 0 | Risk Ratio (M‐H, Random, 95% CI) | 0.0 [0.0, 0.0] | |
| 2 Mycological cure Show forest plot | 1 | Risk Ratio (M‐H, Random, 95% CI) | Totals not selected | |
| 2.1 Short‐term follow‐up (≤ 52 weeks) | 0 | Risk Ratio (M‐H, Random, 95% CI) | 0.0 [0.0, 0.0] | |
| 2.2 Long‐term follow‐up (> 52 weeks) | 1 | Risk Ratio (M‐H, Random, 95% CI) | 0.0 [0.0, 0.0] | |
| 3 Adverse events Show forest plot | 1 | Risk Ratio (M‐H, Random, 95% CI) | Totals not selected | |