Scolaris Content Display Scolaris Content Display

Study flow diagram.
Figuras y tablas -
Figure 1

Study flow diagram.

Risk of bias summary: review authors' judgements about each risk of bias item for each included study.
Figuras y tablas -
Figure 2

Risk of bias summary: review authors' judgements about each risk of bias item for each included study.

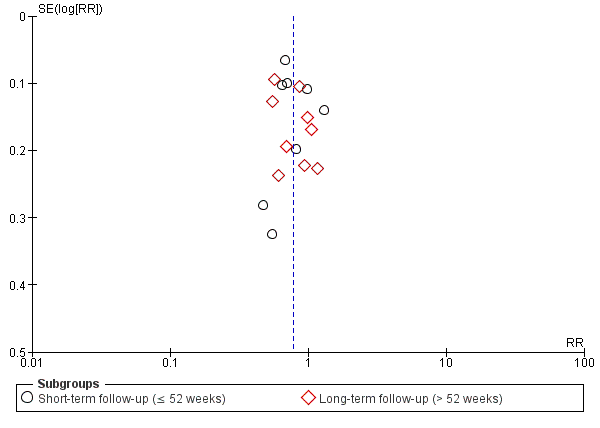
Funnel plot of comparison: 3 Azole versus terbinafine, outcome: 3.1 Clinical cure.
Figuras y tablas -
Figure 3

Funnel plot of comparison: 3 Azole versus terbinafine, outcome: 3.1 Clinical cure.

Funnel plot of comparison: 3 Azole versus terbinafine, outcome: 3.2 Mycological cure.
Figuras y tablas -
Figure 4

Funnel plot of comparison: 3 Azole versus terbinafine, outcome: 3.2 Mycological cure.

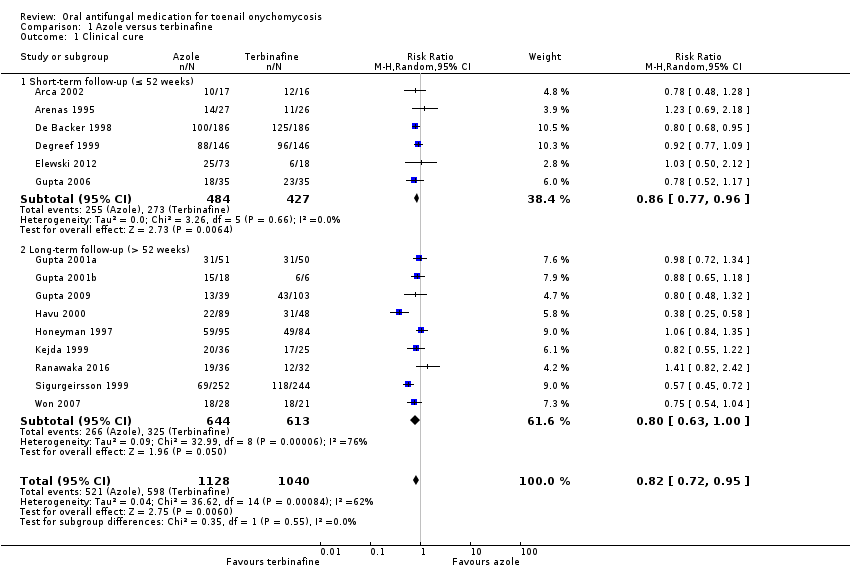
Comparison 1 Azole versus terbinafine, Outcome 1 Clinical cure.
Figuras y tablas -
Analysis 1.1

Comparison 1 Azole versus terbinafine, Outcome 1 Clinical cure.

Comparison 1 Azole versus terbinafine, Outcome 2 Mycological cure.
Figuras y tablas -
Analysis 1.2

Comparison 1 Azole versus terbinafine, Outcome 2 Mycological cure.

Comparison 1 Azole versus terbinafine, Outcome 3 Adverse events.
Figuras y tablas -
Analysis 1.3

Comparison 1 Azole versus terbinafine, Outcome 3 Adverse events.

Comparison 1 Azole versus terbinafine, Outcome 4 Recurrence rate.
Figuras y tablas -
Analysis 1.4

Comparison 1 Azole versus terbinafine, Outcome 4 Recurrence rate.

Comparison 2 Terbinafine versus placebo, Outcome 1 Clinical cure.
Figuras y tablas -
Analysis 2.1

Comparison 2 Terbinafine versus placebo, Outcome 1 Clinical cure.

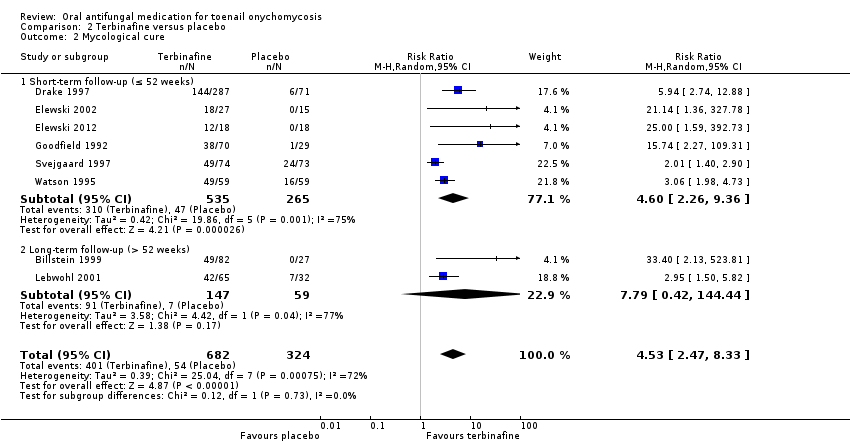
Comparison 2 Terbinafine versus placebo, Outcome 2 Mycological cure.
Figuras y tablas -
Analysis 2.2

Comparison 2 Terbinafine versus placebo, Outcome 2 Mycological cure.

Comparison 2 Terbinafine versus placebo, Outcome 3 Adverse events.
Figuras y tablas -
Analysis 2.3

Comparison 2 Terbinafine versus placebo, Outcome 3 Adverse events.

Comparison 2 Terbinafine versus placebo, Outcome 4 Recurrence rate.
Figuras y tablas -
Analysis 2.4

Comparison 2 Terbinafine versus placebo, Outcome 4 Recurrence rate.

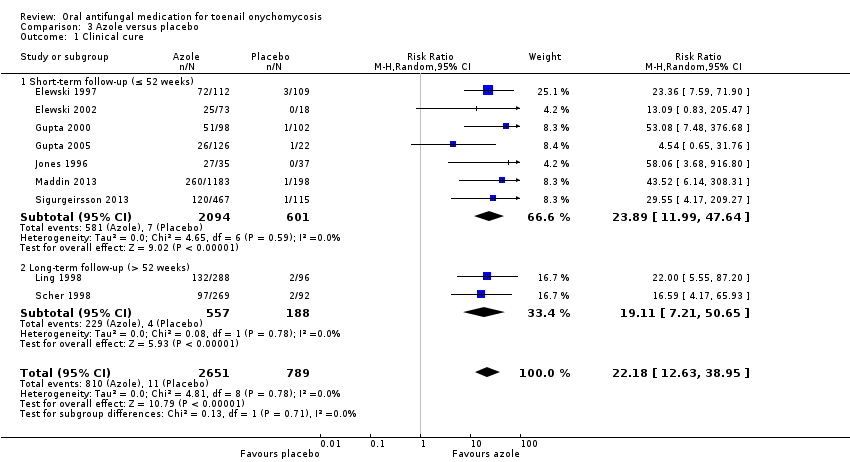
Comparison 3 Azole versus placebo, Outcome 1 Clinical cure.
Figuras y tablas -
Analysis 3.1

Comparison 3 Azole versus placebo, Outcome 1 Clinical cure.

Comparison 3 Azole versus placebo, Outcome 2 Mycological cure.
Figuras y tablas -
Analysis 3.2

Comparison 3 Azole versus placebo, Outcome 2 Mycological cure.

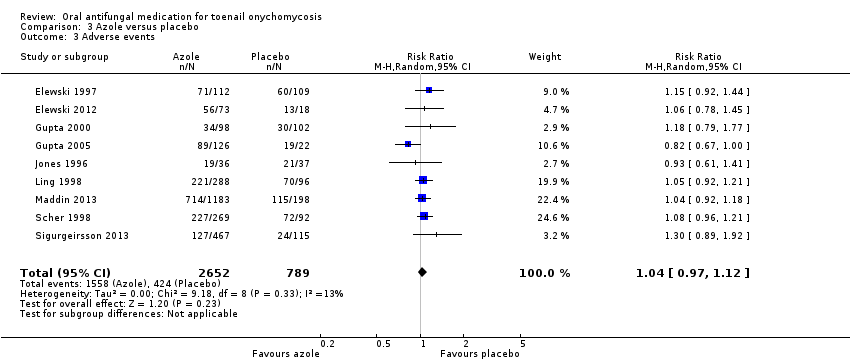
Comparison 3 Azole versus placebo, Outcome 3 Adverse events.
Figuras y tablas -
Analysis 3.3

Comparison 3 Azole versus placebo, Outcome 3 Adverse events.

Comparison 3 Azole versus placebo, Outcome 4 Recurrence rate.
Figuras y tablas -
Analysis 3.4

Comparison 3 Azole versus placebo, Outcome 4 Recurrence rate.

Comparison 4 Griseofulvin versus azole, Outcome 1 Clinical cure.
Figuras y tablas -
Analysis 4.1

Comparison 4 Griseofulvin versus azole, Outcome 1 Clinical cure.

Comparison 4 Griseofulvin versus azole, Outcome 2 Mycological cure.
Figuras y tablas -
Analysis 4.2

Comparison 4 Griseofulvin versus azole, Outcome 2 Mycological cure.

Comparison 4 Griseofulvin versus azole, Outcome 3 Adverse events.
Figuras y tablas -
Analysis 4.3

Comparison 4 Griseofulvin versus azole, Outcome 3 Adverse events.

Comparison 4 Griseofulvin versus azole, Outcome 4 Recurrence rate.
Figuras y tablas -
Analysis 4.4

Comparison 4 Griseofulvin versus azole, Outcome 4 Recurrence rate.

Comparison 5 Griseofulvin versus terbinafine, Outcome 1 Clinical cure.
Figuras y tablas -
Analysis 5.1

Comparison 5 Griseofulvin versus terbinafine, Outcome 1 Clinical cure.

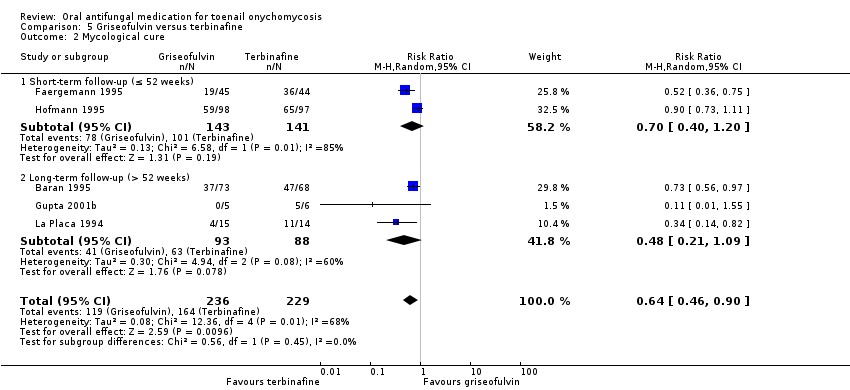
Comparison 5 Griseofulvin versus terbinafine, Outcome 2 Mycological cure.
Figuras y tablas -
Analysis 5.2

Comparison 5 Griseofulvin versus terbinafine, Outcome 2 Mycological cure.

Comparison 5 Griseofulvin versus terbinafine, Outcome 3 Adverse events.
Figuras y tablas -
Analysis 5.3

Comparison 5 Griseofulvin versus terbinafine, Outcome 3 Adverse events.

Comparison 6 Combination terbinafine plus azole versus terbinafine monotherapy, Outcome 1 Clinical cure.
Figuras y tablas -
Analysis 6.1

Comparison 6 Combination terbinafine plus azole versus terbinafine monotherapy, Outcome 1 Clinical cure.

Comparison 6 Combination terbinafine plus azole versus terbinafine monotherapy, Outcome 2 Mycological cure.
Figuras y tablas -
Analysis 6.2

Comparison 6 Combination terbinafine plus azole versus terbinafine monotherapy, Outcome 2 Mycological cure.

Comparison 6 Combination terbinafine plus azole versus terbinafine monotherapy, Outcome 3 Adverse events.
Figuras y tablas -
Analysis 6.3

Comparison 6 Combination terbinafine plus azole versus terbinafine monotherapy, Outcome 3 Adverse events.

Summary of findings for the main comparison. Azole compared to terbinafine for toenail onychomycosis

Azole compared to terbinafine for toenail onychomycosis

Patient or population: participants with confirmed toenail onychomycosis
Setting: outpatients clinics
Intervention: azole
Comparison: terbinafine

Outcomes

Anticipated absolute effects* (95% CI)

Relative effect
(95% CI)

№ of participants
(studies)

Quality of the evidence
(GRADE)

Risk with terbinafine

Risk with azole

Clinical cure

Study population

RR 0.82
(0.72 to 0.95)

2168
(15 RCTs)

⊕⊕⊕⊝
Moderatea

575 per 1000

471 per 1000
(414 to 546)

Mycological cure

Study population

RR 0.77
(0.68 to 0.88)

2544
(17 RCTs)

⊕⊕⊕⊝
Moderatea

682 per 1000

525 per 1000
(464 to 600)

Adverse events

Study population

RR 1.00
(0.86 to 1.17)

1762
(9 RCTs)

⊕⊕⊕⊝
Moderateb

346 per 1000

346 per 1000
(298 to 405)

Recurrence rate

Study population

RR 1.11
(0.68 to 1.79)

282
(5 RCTs)

⊕⊕⊝⊝
Lowc

333 per 1000

370 per 1000
(227 to 597)

Quality of life

None of the studies addressed quality of life.

*The risk in the intervention group (and its 95% confidence interval) is based on the assumed risk in the comparison group and the relative effect of the intervention (and its 95% CI).
CI: confidence interval; RCT: randomised controlled trial; RR: risk ratio.

GRADE Working Group grades of evidence
High quality: we are very confident that the true effect lies close to that of the estimate of the effect.
Moderate quality: we are moderately confident in the effect estimate: the true effect is likely to be close to the estimate of the effect, but there is a possibility that it is substantially different.
Low quality: our confidence in the effect estimate is limited: the true effect may be substantially different from the estimate of the effect.
Very low quality: we have very little confidence in the effect estimate: the true effect is likely to be substantially different from the estimate of effect.

aDowngraded by one level for risk of bias because of large number of unblinded studies, lack of description of randomisation process and allocation concealment for most studies.
bDowngraded by one level for risk of bias (large number of unblinded studies, lack of description of randomisation process and allocation concealment for most studies).
cDowngraded by two levels for risk of bias (large number of unblinded studies, lack of description of randomisation process and allocation concealment for most studies) and imprecision (small numbers of participants in this comparison).

Figuras y tablas -
Summary of findings for the main comparison. Azole compared to terbinafine for toenail onychomycosis
Summary of findings 2. Terbinafine compared to placebo for toenail onychomycosis

Terbinafine compared to placebo for toenail onychomycosis

Patient or population: patients with confirmed toenail onychomycosis
Setting: outpatient clinics
Intervention: terbinafine
Comparison: placebo

Outcomes

Anticipated absolute effects* (95% CI)

Relative effect
(95% CI)

№ of participants
(studies)

Quality of the evidence
(GRADE)

Risk with placebo

Risk with terbinafine

Clinical cure

Study population

RR 6.00
(3.96 to 9.08)

1006
(8 RCTs)

⊕⊕⊕⊕
Higha

62 per 1000

370 per 1000
(244 to 560)

Mycological cure

Study population

RR 4.53
(2.47 to 8.33)

1006
(8 RCTs)

⊕⊕⊕⊕
Higha

167 per 1000

755 per 1000
(412 to 1000)

Adverse events

Study population

RR 1.13
(0.87 to 1.47)

399
(4 RCTs)

⊕⊕⊕⊝
Moderateb

429 per 1000

484 per 1000
(373 to 630)

Recurrence rate

667 per 1000

33 per 1000

(7 to 253)

RR 0.05

(0.01 to 0.38)

35
(1 RCT)

⊕⊕⊝⊝
Lowc

Quality of life

Not addressed by any of the trials

*The risk in the intervention group (and its 95% confidence interval) is based on the assumed risk in the comparison group and the relative effect of the intervention (and its 95% CI).
CI: confidence interval; RCT: randomised controlled trial; RR: risk ratio.

GRADE Working Group grades of evidence
High quality: we are very confident that the true effect lies close to that of the estimate of the effect.
Moderate quality: we are moderately confident in the effect estimate: the true effect is likely to be close to the estimate of the effect, but there is a possibility that it is substantially different.
Low quality: our confidence in the effect estimate is limited: the true effect may be substantially different from the estimate of the effect.
Very low quality: we have very little confidence in the effect estimate: the true effect is likely to be substantially different from the estimate of effect.

aLarge number of unblinded studies and studies with poor description of blinding and randomisation but large effect estimate; therefore, this outcome was not downgraded for risk of bias as the quality of evidence was considered to be high because of the large effect observed.
bDowngraded by one level due to risk of bias (randomisation and blinding was poorly described in most studies).
cDowngraded by two levels due to poor description of randomisation and blinding as well as due to selective follow‐up and only single study with small number of participants.

Figuras y tablas -
Summary of findings 2. Terbinafine compared to placebo for toenail onychomycosis
Summary of findings 3. Azole compared to placebo for toenail onychomycosis

Azole compared to placebo for toenail onychomycosis

Patient or population: participants with confirmed toenail onychomycosis
Setting: outpatient clinics
Intervention: azole
Comparison: placebo

Outcomes

Anticipated absolute effects* (95% CI)

Relative effect
(95% CI)

№ of participants
(studies)

Quality of the evidence
(GRADE)

Risk with placebo

Risk with azole

Clinical cure

Study population

RR 22.18

(12.63 to 38.95)

3440
(9 studies)

⊕⊕⊕⊕
Higha

14 per 1000

309 per 1000

(176 to 543)

Mycological cure

Study population

RR 5.86
(3.23 to 10.62)

3440
(9 RCTs)

⊕⊕⊕⊕
Higha

74 per 1000

431 per 1000
(237 to 781)

Adverse events

Study population

RR 1.04
(0.97 to 1.12)

3441
(9 RCTs)

⊕⊕⊕⊝
Moderateb

537 per 1000

559 per 1000
(521 to 602)

Recurrence rate

Study population

RR 0.55

(0.29 to 1.07)

26

(1 RCT)

⊕⊕⊝⊝
Lowc

1000 per 1000

550 per 1000

(290 to 1000)

Quality of life

None of the studies addressed quality of life.

*The risk in the intervention group (and its 95% confidence interval) is based on the assumed risk in the comparison group and the relative effect of the intervention (and its 95% CI).
CI: confidence interval; RCT: randomised controlled trial; RR: risk ratio.

GRADE Working Group grades of evidence
High quality: we are very confident that the true effect lies close to that of the estimate of the effect.
Moderate quality: we are moderately confident in the effect estimate: the true effect is likely to be close to the estimate of the effect, but there is a possibility that it is substantially different.
Low quality: our confidence in the effect estimate is limited: the true effect may be substantially different from the estimate of the effect.
Very low quality: we have very little confidence in the effect estimate: the true effect is likely to be substantially different from the estimate of effect.

aLarge number of unblinded studies and studies with poor description of blinding and randomisation, but large effect estimate; therefore, this outcome was not downgraded for risk of bias as the quality of evidence was considered to be high because of the large effect observed.
bDowngraded by one level because of risk of bias (high number of unblinded studies and studies with poor description of blinding and randomisation).
cDowngraded by two levels due to poor description of randomisation and blinding as well as selective follow‐up and only single study with small number of participants.

Figuras y tablas -
Summary of findings 3. Azole compared to placebo for toenail onychomycosis
Summary of findings 4. Griseofulvin compared to azole for toenail onychomycosis

Griseofulvin compared to azole for toenail onychomycosis

Patient or population: participants with confirmed toenail onychomycosis
Setting: outpatient clinics
Intervention: griseofulvin
Comparison: azole

Outcomes

Anticipated absolute effects* (95% CI)

Relative effect
(95% CI)

№ of participants
(studies)

Quality of the evidence
(GRADE)

Risk with azole

Risk with griseofulvin

Clinical cure

Study population

RR 0.94
(0.45 to 1.96)

222
(5 RCTs)

⊕⊕⊕⊝
Moderatea

144 per 1000

136 per 1000
(65 to 283)

Mycological cure

Study population

RR 0.87
(0.50 to 1.51)

222
(5 RCTs)

⊕⊕⊕⊝
Moderatea

186 per 1000

161 per 1000
(93 to 280)

Adverse events

Study population

RR 2.41
(1.56 to 3.73)

143
(2 RCTs)

⊕⊕⊕⊝
Moderateb

276 per 1000

665 per 1000
(430 to 1000)

Recurrence rate

Study population

RR 4.00
(0.26 to 61.76)

7
(1 RCT)

⊕⊝⊝⊝
Very lowc

0 per 1000

0 per 1000
(0 to 0)

Quality of life

None of the studies addressed quality of life.

*The risk in the intervention group (and its 95% confidence interval) is based on the assumed risk in the comparison group and the relative effect of the intervention (and its 95% CI).
CI: confidence interval; RCT: randomised controlled trial; RR: risk ratio.

GRADE Working Group grades of evidence
High quality: we are very confident that the true effect lies close to that of the estimate of the effect.
Moderate quality: we are moderately confident in the effect estimate: the true effect is likely to be close to the estimate of the effect, but there is a possibility that it is substantially different.
Low quality: our confidence in the effect estimate is limited: the true effect may be substantially different from the estimate of the effect.
Very low quality: we have very little confidence in the effect estimate: the true effect is likely to be substantially different from the estimate of effect.

aDowngraded by one level due to risk of bias (about half of the studies were not blinded).
bDowngraded by one level due to risk of bias (two unblinded studies; neither participants nor outcome assessors were blinded).
cDowngraded by three levels due to risk of bias (single study; neither participants nor outcome assessors were blinded) and imprecision (two levels due to single study, low number of participants and wide confidence intervals).

Figuras y tablas -
Summary of findings 4. Griseofulvin compared to azole for toenail onychomycosis
Summary of findings 5. Griseofulvin compared to terbinafine for toenail onychomycosis

Griseofulvin compared to terbinafine for toenail onychomycosis

Patient or population: participants with confirmed toenail onychomycosis
Setting: outpatient clinics
Intervention: griseofulvin
Comparison: terbinafine

Outcomes

Anticipated absolute effects* (95% CI)

Relative effect
(95% CI)

№ of participants
(studies)

Quality of the evidence
(GRADE)

Risk with terbinafine

Risk with Griseofulvin

Clinical cure

Study population

RR 0.32
(0.14 to 0.72)

270
(4 RCTs)

⊕⊕⊝⊝
Lowa

561 per 1000

179 per 1000
(78 to 404)

Mycological cure

Study population

RR 0.64
(0.46 to 0.90)

465
(5 RCTs)

⊕⊕⊝⊝
Lowa

716 per 1000

458 per 1000
(329 to 645)

Adverse events

Study population

RR 2.09
(1.15 to 3.82)

100
(2 RCTs)

⊕⊕⊝⊝
Lowb

160 per 1000

334 per 1000
(184 to 611)

Recurrence rate

No studies addressed recurrence rate.

Quality of life

No studies addressed quality of life.

*The risk in the intervention group (and its 95% confidence interval) is based on the assumed risk in the comparison group and the relative effect of the intervention (and its 95% CI).
CI: confidence interval; RCT: randomised controlled trial; RR: risk ratio.

GRADE Working Group grades of evidence
High quality: we are very confident that the true effect lies close to that of the estimate of the effect.
Moderate quality: we are moderately confident in the effect estimate: the true effect is likely to be close to the estimate of the effect, but there is a possibility that it is substantially different.
Low quality: our confidence in the effect estimate is limited: the true effect may be substantially different from the estimate of the effect.
Very low quality: we have very little confidence in the effect estimate: the true effect is likely to be substantially different from the estimate of effect.

aDowngraded by two levels due to risk of bias (two studies not blinded; other studies at unclear risk for blinding of participant and outcome assessor).
bDowngraded by two levels due to risk of bias (two levels: one unblinded study; one study at unclear risk of bias for blinding or participants and outcome assessor).

Figuras y tablas -
Summary of findings 5. Griseofulvin compared to terbinafine for toenail onychomycosis
Summary of findings 6. Combination terbinafine plus azole compared to terbinafine monotherapy for toenail onychomycosis

Combination terbinafine plus azole compared to terbinafine monotherapy for toenail onychomycosis

Patient or population: participants with confirmed toenail onychomycosis
Setting: outpatient clinics
Intervention: combination terbinafine plus azole
Comparison: terbinafine monotherapy

Outcomes

Anticipated absolute effects* (95% CI)

Relative effect
(95% CI)

№ of participants
(studies)

Quality of the evidence
(GRADE)

Risk with terbinafine monotherapy

Risk with combination terbinafine plus azole

Clinical cure

Study population

RR 1.41

(1.01 to 1.97)

176
(1 RCT)

⊕⊝⊝⊝
Very lowa

368 per 1000

519 per 1000

(732 to 726)

Mycological cure

Study population

RR 1.41

(1.08 to 1.83)

176
(1 RCT)

⊕⊝⊝⊝
Very lowa

474 per 1000

668 per 1000
(512 to 867)

Adverse events

Study population

RR 0.64
(0.34 to 1.21)

176
(1 RCT)

⊕⊕⊝⊝
Lowb

232 per 1000

148 per 1000
(79 to 280)

Recurrence rate

No studies addressed recurrence rate.

Quality of life

No studies addressed quality of life.

*The risk in the intervention group (and its 95% confidence interval) is based on the assumed risk in the comparison group and the relative effect of the intervention (and its 95% CI).
CI: confidence interval; RCT: randomised controlled trial; RR: risk ratio.

GRADE Working Group grades of evidence
High quality: we are very confident that the true effect lies close to that of the estimate of the effect.
Moderate quality: we are moderately confident in the effect estimate: the true effect is likely to be close to the estimate of the effect, but there is a possibility that it is substantially different.
Low quality: our confidence in the effect estimate is limited: the true effect may be substantially different from the estimate of the effect.
Very low quality: we have very little confidence in the effect estimate: the true effect is likely to be substantially different from the estimate of effect.

aDowngraded by three levels due to risk of bias (two levels: single non‐blinded study) and imprecision (single study).
bDowngraded by two levels due to risk of bias (single non‐blinded study) and imprecision (single study)

Figuras y tablas -
Summary of findings 6. Combination terbinafine plus azole compared to terbinafine monotherapy for toenail onychomycosis
Comparison 1. Azole versus terbinafine

Outcome or subgroup title

No. of studies

No. of participants

Statistical method

Effect size

1 Clinical cure Show forest plot

15

2168

Risk Ratio (M‐H, Random, 95% CI)

0.82 [0.72, 0.95]

1.1 Short‐term follow‐up (≤ 52 weeks)

6

911

Risk Ratio (M‐H, Random, 95% CI)

0.86 [0.77, 0.96]

1.2 Long‐term follow‐up (> 52 weeks)

9

1257

Risk Ratio (M‐H, Random, 95% CI)

0.80 [0.63, 1.00]

2 Mycological cure Show forest plot

17

2544

Risk Ratio (M‐H, Random, 95% CI)

0.77 [0.68, 0.88]

2.1 Short‐term follow‐up (≤ 52 weeks)

8

1287

Risk Ratio (M‐H, Random, 95% CI)

0.77 [0.64, 0.93]

2.2 Long‐term follow‐up (> 52 weeks)

9

1257

Risk Ratio (M‐H, Random, 95% CI)

0.78 [0.64, 0.95]

3 Adverse events Show forest plot

9

1762

Risk Ratio (M‐H, Random, 95% CI)

1.00 [0.86, 1.17]

4 Recurrence rate Show forest plot

5

282

Risk Ratio (M‐H, Random, 95% CI)

1.11 [0.68, 1.79]

Figuras y tablas -
Comparison 1. Azole versus terbinafine
Comparison 2. Terbinafine versus placebo

Outcome or subgroup title

No. of studies

No. of participants

Statistical method

Effect size

1 Clinical cure Show forest plot

8

1006

Risk Ratio (M‐H, Random, 95% CI)

6.00 [3.96, 9.08]

1.1 Short‐term follow‐up (≤ 52 weeks)

6

800

Risk Ratio (M‐H, Random, 95% CI)

5.60 [3.66, 8.55]

1.2 Long‐term follow‐up (> 52 weeks)

2

206

Risk Ratio (M‐H, Random, 95% CI)

26.01 [3.69, 183.44]

2 Mycological cure Show forest plot

8

1006

Risk Ratio (M‐H, Random, 95% CI)

4.53 [2.47, 8.33]

2.1 Short‐term follow‐up (≤ 52 weeks)

6

800

Risk Ratio (M‐H, Random, 95% CI)

4.60 [2.26, 9.36]

2.2 Long‐term follow‐up (> 52 weeks)

2

206

Risk Ratio (M‐H, Random, 95% CI)

7.79 [0.42, 144.44]

3 Adverse events Show forest plot

4

399

Risk Ratio (M‐H, Random, 95% CI)

1.13 [0.87, 1.47]

4 Recurrence rate Show forest plot

1

35

Risk Ratio (M‐H, Random, 95% CI)

0.05 [0.01, 0.38]

Figuras y tablas -
Comparison 2. Terbinafine versus placebo
Comparison 3. Azole versus placebo

Outcome or subgroup title

No. of studies

No. of participants

Statistical method

Effect size

1 Clinical cure Show forest plot

9

3440

Risk Ratio (M‐H, Random, 95% CI)

22.18 [12.63, 38.95]

1.1 Short‐term follow‐up (≤ 52 weeks)

7

2695

Risk Ratio (M‐H, Random, 95% CI)

23.89 [11.99, 47.64]

1.2 Long‐term follow‐up (> 52 weeks)

2

745

Risk Ratio (M‐H, Random, 95% CI)

19.11 [7.21, 50.65]

2 Mycological cure Show forest plot

9

3440

Risk Ratio (M‐H, Random, 95% CI)

5.86 [3.23, 10.62]

2.1 Short‐term follow‐up (≤ 52 weeks)

7

2695

Risk Ratio (M‐H, Random, 95% CI)

7.05 [2.91, 17.07]

2.2 Long‐term follow‐up (> 52 weeks)

2

745

Risk Ratio (M‐H, Random, 95% CI)

4.22 [2.34, 7.59]

3 Adverse events Show forest plot

9

3441

Risk Ratio (M‐H, Random, 95% CI)

1.04 [0.97, 1.12]

4 Recurrence rate Show forest plot

1

26

Risk Ratio (M‐H, Random, 95% CI)

0.55 [0.29, 1.07]

Figuras y tablas -
Comparison 3. Azole versus placebo
Comparison 4. Griseofulvin versus azole

Outcome or subgroup title

No. of studies

No. of participants

Statistical method

Effect size

1 Clinical cure Show forest plot

5

222

Risk Ratio (M‐H, Random, 95% CI)

0.94 [0.45, 1.96]

1.1 Short‐term follow‐up (≤ 52 weeks)

2

60

Risk Ratio (M‐H, Random, 95% CI)

0.89 [0.32, 2.45]

1.2 Long‐term follow‐up (> 52 weeks)

3

162

Risk Ratio (M‐H, Random, 95% CI)

1.00 [0.34, 2.93]

2 Mycological cure Show forest plot

5

222

Risk Ratio (M‐H, Random, 95% CI)

0.87 [0.50, 1.51]

2.1 Short‐term follow‐up (≤ 52 weeks)

2

60

Risk Ratio (M‐H, Random, 95% CI)

0.96 [0.52, 1.76]

2.2 Long‐term follow‐up (> 52 weeks)

3

162

Risk Ratio (M‐H, Random, 95% CI)

0.58 [0.16, 2.10]

3 Adverse events Show forest plot

2

143

Risk Ratio (M‐H, Random, 95% CI)

2.41 [1.56, 3.73]

4 Recurrence rate Show forest plot

1

7

Risk Ratio (M‐H, Random, 95% CI)

4.0 [0.26, 61.76]

Figuras y tablas -
Comparison 4. Griseofulvin versus azole
Comparison 5. Griseofulvin versus terbinafine

Outcome or subgroup title

No. of studies

No. of participants

Statistical method

Effect size

1 Clinical cure Show forest plot

4

270

Risk Ratio (M‐H, Random, 95% CI)

0.32 [0.14, 0.72]

1.1 Short‐term follow‐up (≤ 52 weeks)

1

89

Risk Ratio (M‐H, Random, 95% CI)

0.05 [0.01, 0.39]

1.2 Long‐term follow‐up (> 52 weeks)

3

181

Risk Ratio (M‐H, Random, 95% CI)

0.51 [0.36, 0.71]

2 Mycological cure Show forest plot

5

465

Risk Ratio (M‐H, Random, 95% CI)

0.64 [0.46, 0.90]

2.1 Short‐term follow‐up (≤ 52 weeks)

2

284

Risk Ratio (M‐H, Random, 95% CI)

0.70 [0.40, 1.20]

2.2 Long‐term follow‐up (> 52 weeks)

3

181

Risk Ratio (M‐H, Random, 95% CI)

0.48 [0.21, 1.09]

3 Adverse events Show forest plot

2

100

Risk Ratio (M‐H, Random, 95% CI)

2.09 [1.15, 3.82]

Figuras y tablas -
Comparison 5. Griseofulvin versus terbinafine
Comparison 6. Combination terbinafine plus azole versus terbinafine monotherapy

Outcome or subgroup title

No. of studies

No. of participants

Statistical method

Effect size

1 Clinical cure Show forest plot

1

Risk Ratio (M‐H, Random, 95% CI)

Totals not selected

1.1 Short‐term follow‐up (≤ 52 weeks)

1

Risk Ratio (M‐H, Random, 95% CI)

0.0 [0.0, 0.0]

1.2 Long‐term follow‐up (> 52 weeks)

0

Risk Ratio (M‐H, Random, 95% CI)

0.0 [0.0, 0.0]

2 Mycological cure Show forest plot

1

Risk Ratio (M‐H, Random, 95% CI)

Totals not selected

2.1 Short‐term follow‐up (≤ 52 weeks)

0

Risk Ratio (M‐H, Random, 95% CI)

0.0 [0.0, 0.0]

2.2 Long‐term follow‐up (> 52 weeks)

1

Risk Ratio (M‐H, Random, 95% CI)

0.0 [0.0, 0.0]

3 Adverse events Show forest plot

1

Risk Ratio (M‐H, Random, 95% CI)

Totals not selected

Figuras y tablas -
Comparison 6. Combination terbinafine plus azole versus terbinafine monotherapy