Monoterapia con topiramato para la epilepsia mioclónica juvenil
Información
- DOI:
- https://doi.org/10.1002/14651858.CD010008.pub2Copiar DOI

- Base de datos:
-
- Cochrane Database of Systematic Reviews
- Versión publicada:
-
- 23 diciembre 2015see what's new
- Tipo:
-
- Intervention
- Etapa:
-
- Review
- Grupo Editorial Cochrane:
-
Grupo Cochrane de Epilepsia
- Copyright:
-
- Copyright © 2015 The Cochrane Collaboration. Published by John Wiley & Sons, Ltd.
Cifras del artículo
Altmetric:
Citado por:
Autores
Contributions of authors
Liu J and Wang LN formulated the idea and developed the basis for the review.
The manuscript was completed by Liu J and Wang LN, and revised by Wang YP.
Liu J will be in charge of updating the review.
Sources of support
Internal sources
-
No sources of support supplied
External sources
-
National Institute for Health Research (NIHR), UK.
This review was supported by the National Institute for Health Research, via Cochrane Infrastructure funding to the Epilepsy Group. The views and opinions expressed therein are those of the authors and do not necessarily reflect those of the Systematic Reviews Programme, NIHR, NHS or the Department of Health.
Declarations of interest
None known.
Acknowledgements
The authors would like to acknowledge the help provided by the Cochrane Epilepsy Group.
Version history
| Published | Title | Stage | Authors | Version |
| 2021 Nov 24 | Topiramate for juvenile myoclonic epilepsy | Review | Jia Liu, Yao-Jun Tai, Lu-Ning Wang | |
| 2019 Jan 28 | Topiramate for juvenile myoclonic epilepsy | Review | Jia Liu, Lu‐Ning Wang, Yu‐Ping Wang | |
| 2017 Apr 23 | Topiramate monotherapy for juvenile myoclonic epilepsy | Review | Jia Liu, Lu‐Ning Wang, Yu‐Ping Wang | |
| 2015 Dec 23 | Topiramate monotherapy for juvenile myoclonic epilepsy | Review | Jia Liu, Lu‐Ning Wang, Yu‐Ping Wang | |
| 2012 Aug 15 | Topiramate monotherapy for juvenile myoclonic epilepsy | Protocol | Jia Liu, Lu‐Ning Wang | |
Differences between protocol and review
We added 'number of participants who were seizure‐free' as the secondary outcome.
Summary of findings tables of all outcomes were added
Keywords
MeSH
Medical Subject Headings (MeSH) Keywords
- Anticonvulsants [adverse effects, *therapeutic use];
- Fructose [adverse effects, *analogs & derivatives, therapeutic use];
- Myoclonic Epilepsy, Juvenile [*drug therapy];
- Randomized Controlled Trials as Topic;
- Seizures [drug therapy];
- Treatment Outcome;
- Valproic Acid [adverse effects, therapeutic use];
Medical Subject Headings Check Words
Adolescent; Child; Humans; Young Adult;
PICO

Study flow diagram.

Risk of bias graph: review authors' judgements about each risk of bias item presented as percentages across all included studies.

Risk of bias summary: review authors' judgements about each risk of bias item for each included study.
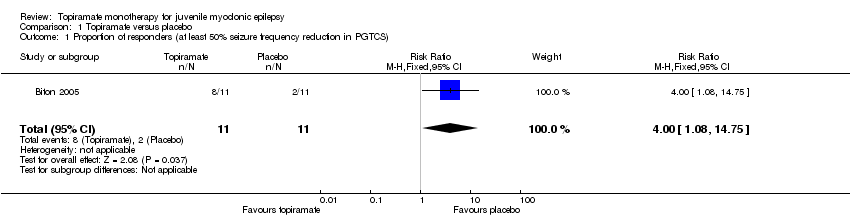
Comparison 1 Topiramate versus placebo, Outcome 1 Proportion of responders (at least 50% seizure frequency reduction in PGTCS).

Comparison 1 Topiramate versus placebo, Outcome 2 Nausea.

Comparison 1 Topiramate versus placebo, Outcome 3 Upper respiratory tract infection.

Comparison 1 Topiramate versus placebo, Outcome 4 Abnormal vision.

Comparison 1 Topiramate versus placebo, Outcome 5 Diarrhoea.

Comparison 2 Topiramate versus valproate, Outcome 1 Proportion of responders (at least 50% seizure frequency reduction in myoclonic seizures).
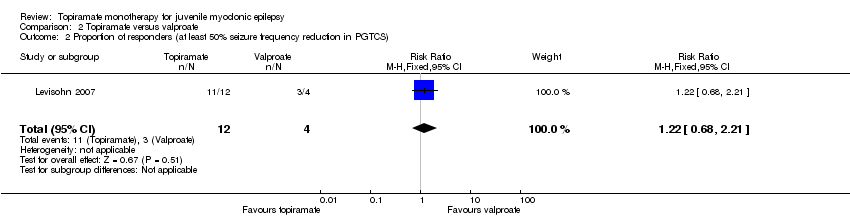
Comparison 2 Topiramate versus valproate, Outcome 2 Proportion of responders (at least 50% seizure frequency reduction in PGTCS).

Comparison 2 Topiramate versus valproate, Outcome 3 Number of participants with seizure‐free.
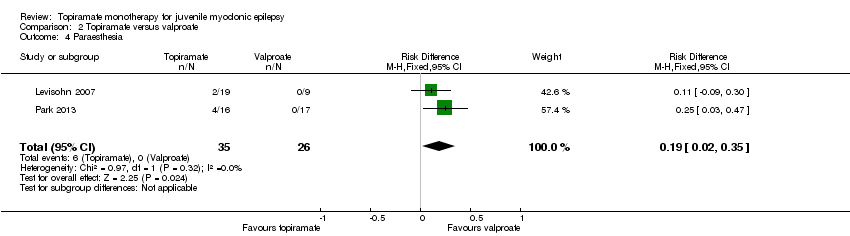
Comparison 2 Topiramate versus valproate, Outcome 4 Paraesthesia.

Comparison 2 Topiramate versus valproate, Outcome 5 Weight gain.

Comparison 2 Topiramate versus valproate, Outcome 6 Tremor.
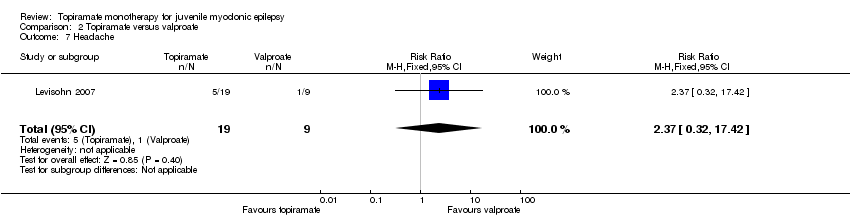
Comparison 2 Topiramate versus valproate, Outcome 7 Headache.
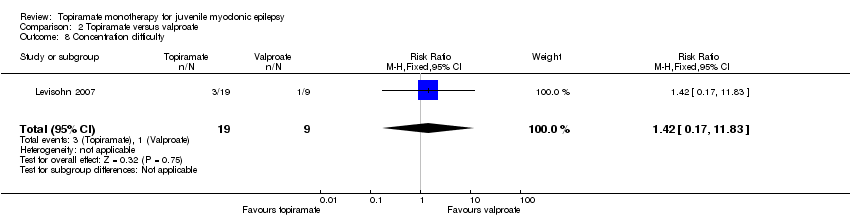
Comparison 2 Topiramate versus valproate, Outcome 8 Concentration difficulty.
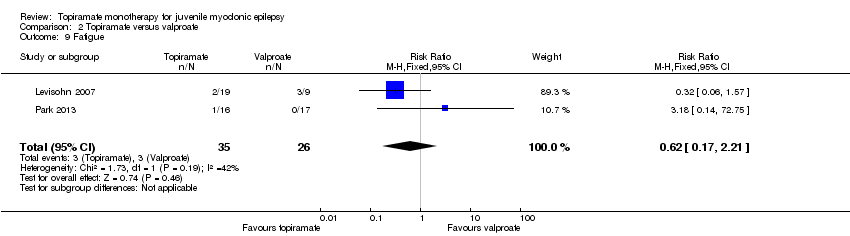
Comparison 2 Topiramate versus valproate, Outcome 9 Fatigue.

Comparison 2 Topiramate versus valproate, Outcome 10 Alopecia.

Comparison 2 Topiramate versus valproate, Outcome 11 Dizziness.

Comparison 2 Topiramate versus valproate, Outcome 12 Weight loss.

Comparison 2 Topiramate versus valproate, Outcome 13 Psychomotor slowing.
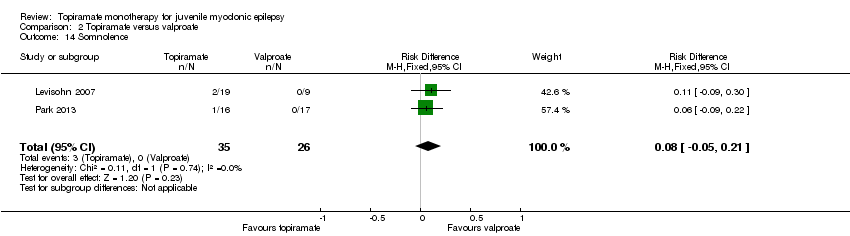
Comparison 2 Topiramate versus valproate, Outcome 14 Somnolence.

Comparison 2 Topiramate versus valproate, Outcome 15 Nausea.

Comparison 2 Topiramate versus valproate, Outcome 16 Appetite increase.

Comparison 2 Topiramate versus valproate, Outcome 17 Insomnia.
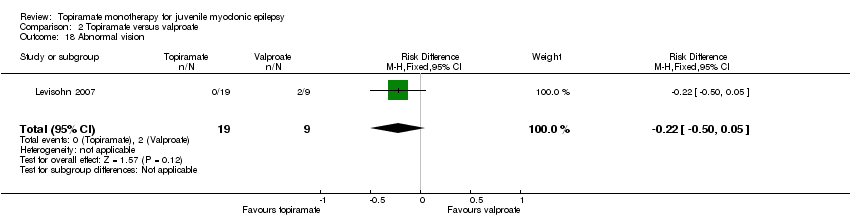
Comparison 2 Topiramate versus valproate, Outcome 18 Abnormal vision.

Comparison 2 Topiramate versus valproate, Outcome 19 Rash.

Comparison 2 Topiramate versus valproate, Outcome 20 Anorexia.

Comparison 2 Topiramate versus valproate, Outcome 21 Hallucination.

Comparison 2 Topiramate versus valproate, Outcome 22 Diarrhoea.
| Topiramate compared with placebo for juvenile myoclonic epilepsy | ||||||
| Patient or population: people with juvenile myoclonic epilepsy Settings: 18 centers in the United States; 10 centers in Europe; 1 center in Costa Rica Intervention: topiramate Comparison: placebo | ||||||
| Outcomes | Illustrative comparative risks* (95% CI) | Relative effect | No of Participants | Quality of the evidence | Comments | |
| Assumed risk | Corresponding risk | |||||
| Placebo | Topiramate | |||||
| Proportion of responders (at least 50% seizure frequency reduction in PGTCS) | 182 per 1000 | 727 per 1000 (197 to 1000) | RR 4.00 (1.08 to 14.75) | 22 (1 study) | ⊕⊝⊝⊝ | More participants taking topiramate responded with a 50% or more reduction in PGTCS compared with placebo (P = 0.03) |
| Proportion of participants who experienced at least one AE and individual AEs | See comment | See comment | NA | 22 (1 study) | ⊕⊝⊝⊝ | Number of participants experiencing at least one AE was not reported. Individual AEs: no significant differences were found in nausea, upper respiratory tract infection, abnormal vision, or diarrhoea between topiramate versus placebo |
| Number of participants who were seizure‐free | Not reported | Not reported | NA | |||
| *The basis for the assumed risk was the event rate in the control group. The corresponding risk (and its 95% confidence interval) is based on the assumed risk in the comparison group and the relative effect of the intervention (and its 95% CI). | ||||||
| GRADE Working Group grades of evidence | ||||||
| 1 The included trials were reported as randomized, double‐blind trials with insufficient methodological information | ||||||
| Topiramate compared with valproate for juvenile myoclonic epilepsy | ||||||
| Patient or population: people with juvenile myoclonic epilepsy Settings: Cincinnati Children’s Hospital Medical Center, Cincinnati, USA; Haeundae Paik Hospital, Busan, Republic of Korea Intervention: topiramate Comparison: valproate | ||||||
| Outcomes | Illustrative comparative risks* (95% CI) | Relative effect | No of Participants | Quality of the evidence | Comments | |
| Assumed risk | Corresponding risk | |||||
| Valproate | Topiramate | |||||
| Proportion of responders (at least 50% seizure frequency reduction in myoclonic seizures) | 1000 per 1000 | 857 per 1000 (670 to 1000) | RR 0.88 (0.67 to 1.15) | 28 | ⊕⊝⊝⊝ | No significant difference was found |
| Proportion of responders (at least 50% seizure frequency reduction in PGTCS) | 750 per 1000 | 917 per 1000 (510 to 1000) | RR 1.22 (0.68 to 2.21) | 28 | ⊕⊝⊝⊝ | No significant difference was found |
| Proportion of participants who experienced at least one AE and individual AEs | See comment | See comment | NA | 61 | ⊕⊝⊝⊝ | Number of participants experiencing at least one AE was not reported. In Levisohn 2007 and Park 2013, we found significant differences in the AEs of paraesthesia, weight gain and tremor. Moreover, no significant difference was found in headache, concentration difficulty, fatigue, alopecia, dizziness, weight loss, psychomotor slowing, somnolence, nausea, appetite increase, insomnia, abnormal vision, rash, anorexia, hallucination or diarrhoea. |
| Number of participants who were seizure‐free | 563 per 1000 | 636 per 1000 (343 to 1188) | RR 1.13 (0.61 to 2.11) | 33 | ⊕⊝⊝⊝ | No significant difference was found (P = 0.08) |
| *The basis for the assumed risk was the event rate in the control group. The corresponding risk (and its 95% confidence interval) is based on the assumed risk in the comparison group and the relative effect of the intervention (and its 95% CI). | ||||||
| GRADE Working Group grades of evidence | ||||||
| 1 The included trials were reported as randomized, double‐blind trials with insufficient methodological information | ||||||
| Outcome or subgroup title | No. of studies | No. of participants | Statistical method | Effect size |
| 1 Proportion of responders (at least 50% seizure frequency reduction in PGTCS) Show forest plot | 1 | 22 | Risk Ratio (M‐H, Fixed, 95% CI) | 4.0 [1.08, 14.75] |
| 2 Nausea Show forest plot | 1 | 22 | Risk Ratio (M‐H, Fixed, 95% CI) | 1.67 [0.52, 5.33] |
| 3 Upper respiratory tract infection Show forest plot | 1 | 22 | Risk Ratio (M‐H, Fixed, 95% CI) | 1.5 [0.31, 7.30] |
| 4 Abnormal vision Show forest plot | 1 | 22 | Risk Ratio (M‐H, Fixed, 95% CI) | 2.0 [0.21, 18.98] |
| 5 Diarrhoea Show forest plot | 1 | 22 | Risk Ratio (M‐H, Fixed, 95% CI) | 2.0 [0.21, 18.98] |
| Outcome or subgroup title | No. of studies | No. of participants | Statistical method | Effect size |
| 1 Proportion of responders (at least 50% seizure frequency reduction in myoclonic seizures) Show forest plot | 1 | 23 | Risk Ratio (M‐H, Fixed, 95% CI) | 0.88 [0.67, 1.15] |
| 2 Proportion of responders (at least 50% seizure frequency reduction in PGTCS) Show forest plot | 1 | 16 | Risk Ratio (M‐H, Fixed, 95% CI) | 1.22 [0.68, 2.21] |
| 3 Number of participants with seizure‐free Show forest plot | 1 | 27 | Risk Ratio (M‐H, Fixed, 95% CI) | 1.13 [0.61, 2.11] |
| 4 Paraesthesia Show forest plot | 2 | 61 | Risk Difference (M‐H, Fixed, 95% CI) | 0.19 [0.02, 0.35] |
| 5 Weight gain Show forest plot | 2 | 61 | Risk Difference (M‐H, Fixed, 95% CI) | ‐0.30 [‐0.49, ‐0.10] |
| 6 Tremor Show forest plot | 1 | 33 | Risk Difference (M‐H, Fixed, 95% CI) | ‐0.24 [‐0.45, ‐0.02] |
| 7 Headache Show forest plot | 1 | 28 | Risk Ratio (M‐H, Fixed, 95% CI) | 2.37 [0.32, 17.42] |
| 8 Concentration difficulty Show forest plot | 1 | 28 | Risk Ratio (M‐H, Fixed, 95% CI) | 1.42 [0.17, 11.83] |
| 9 Fatigue Show forest plot | 2 | 61 | Risk Ratio (M‐H, Fixed, 95% CI) | 0.62 [0.17, 2.21] |
| 10 Alopecia Show forest plot | 2 | 61 | Risk Ratio (M‐H, Fixed, 95% CI) | 0.24 [0.06, 1.02] |
| 11 Dizziness Show forest plot | 1 | 28 | Risk Ratio (M‐H, Fixed, 95% CI) | 0.95 [0.10, 9.13] |
| 12 Weight loss Show forest plot | 1 | 28 | Risk Difference (M‐H, Fixed, 95% CI) | 0.11 [‐0.09, 0.30] |
| 13 Psychomotor slowing Show forest plot | 1 | 28 | Risk Difference (M‐H, Fixed, 95% CI) | 0.11 [‐0.09, 0.30] |
| 14 Somnolence Show forest plot | 2 | 61 | Risk Difference (M‐H, Fixed, 95% CI) | 0.08 [‐0.05, 0.21] |
| 15 Nausea Show forest plot | 2 | 61 | Risk Ratio (M‐H, Fixed, 95% CI) | 0.21 [0.04, 1.18] |
| 16 Appetite increase Show forest plot | 1 | 28 | Risk Difference (M‐H, Fixed, 95% CI) | ‐0.22 [‐0.50, 0.05] |
| 17 Insomnia Show forest plot | 1 | 28 | Risk Difference (M‐H, Fixed, 95% CI) | ‐0.22 [‐0.50, 0.05] |
| 18 Abnormal vision Show forest plot | 1 | 28 | Risk Difference (M‐H, Fixed, 95% CI) | ‐0.22 [‐0.50, 0.05] |
| 19 Rash Show forest plot | 1 | 28 | Risk Difference (M‐H, Fixed, 95% CI) | ‐0.22 [‐0.50, 0.05] |
| 20 Anorexia Show forest plot | 1 | 33 | Risk Ratio (M‐H, Fixed, 95% CI) | 3.19 [0.37, 27.58] |
| 21 Hallucination Show forest plot | 1 | 33 | Risk Difference (M‐H, Fixed, 95% CI) | 0.06 [‐0.09, 0.22] |
| 22 Diarrhoea Show forest plot | 1 | 33 | Risk Difference (M‐H, Fixed, 95% CI) | ‐0.12 [‐0.30, 0.06] |