| 1 Proportion of responders (at least 50% seizure frequency reduction in myoclonic seizures) Show forest plot | 1 | 23 | Risk Ratio (M‐H, Fixed, 95% CI) | 0.88 [0.67, 1.15] |
|
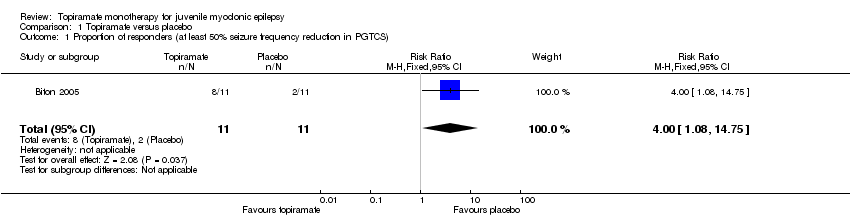
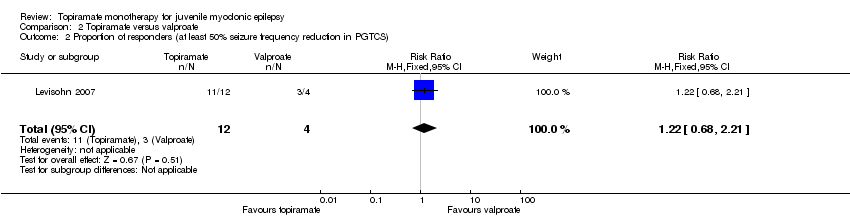
| 2 Proportion of responders (at least 50% seizure frequency reduction in PGTCS) Show forest plot | 1 | 16 | Risk Ratio (M‐H, Fixed, 95% CI) | 1.22 [0.68, 2.21] |
|
| 3 Number of participants with seizure‐free Show forest plot | 1 | 27 | Risk Ratio (M‐H, Fixed, 95% CI) | 1.13 [0.61, 2.11] |
|
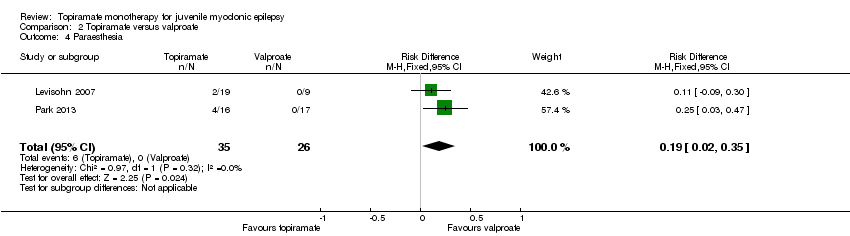
| 4 Paraesthesia Show forest plot | 2 | 61 | Risk Difference (M‐H, Fixed, 95% CI) | 0.19 [0.02, 0.35] |
|
| 5 Weight gain Show forest plot | 2 | 61 | Risk Difference (M‐H, Fixed, 95% CI) | ‐0.30 [‐0.49, ‐0.10] |
|
| 6 Tremor Show forest plot | 1 | 33 | Risk Difference (M‐H, Fixed, 95% CI) | ‐0.24 [‐0.45, ‐0.02] |
|
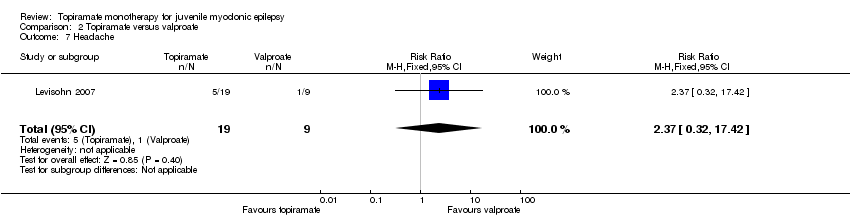
| 7 Headache Show forest plot | 1 | 28 | Risk Ratio (M‐H, Fixed, 95% CI) | 2.37 [0.32, 17.42] |
|
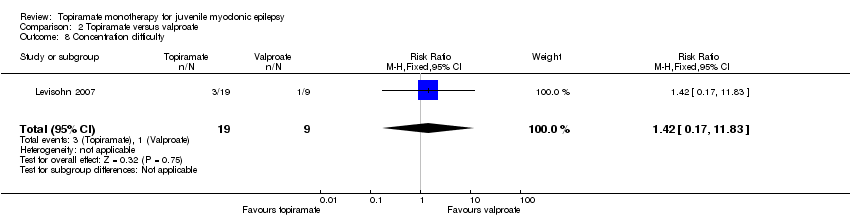
| 8 Concentration difficulty Show forest plot | 1 | 28 | Risk Ratio (M‐H, Fixed, 95% CI) | 1.42 [0.17, 11.83] |
|
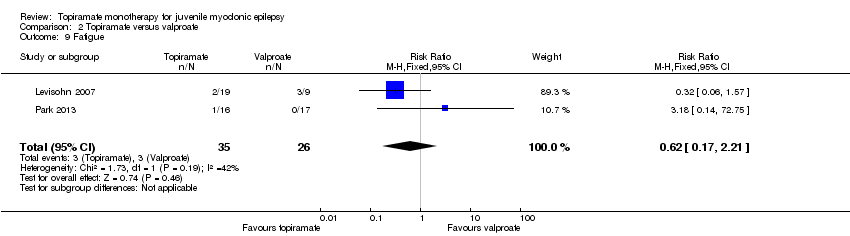
| 9 Fatigue Show forest plot | 2 | 61 | Risk Ratio (M‐H, Fixed, 95% CI) | 0.62 [0.17, 2.21] |
|
| 10 Alopecia Show forest plot | 2 | 61 | Risk Ratio (M‐H, Fixed, 95% CI) | 0.24 [0.06, 1.02] |
|
| 11 Dizziness Show forest plot | 1 | 28 | Risk Ratio (M‐H, Fixed, 95% CI) | 0.95 [0.10, 9.13] |
|
| 12 Weight loss Show forest plot | 1 | 28 | Risk Difference (M‐H, Fixed, 95% CI) | 0.11 [‐0.09, 0.30] |
|
| 13 Psychomotor slowing Show forest plot | 1 | 28 | Risk Difference (M‐H, Fixed, 95% CI) | 0.11 [‐0.09, 0.30] |
|
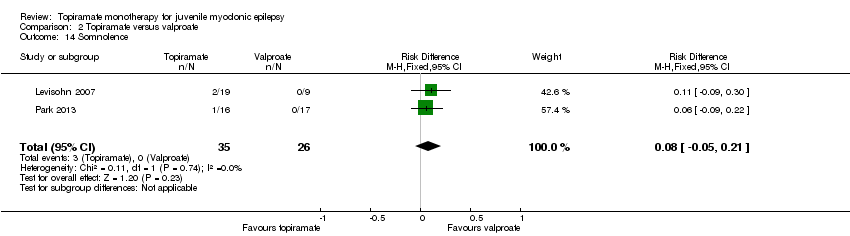
| 14 Somnolence Show forest plot | 2 | 61 | Risk Difference (M‐H, Fixed, 95% CI) | 0.08 [‐0.05, 0.21] |
|
| 15 Nausea Show forest plot | 2 | 61 | Risk Ratio (M‐H, Fixed, 95% CI) | 0.21 [0.04, 1.18] |
|
| 16 Appetite increase Show forest plot | 1 | 28 | Risk Difference (M‐H, Fixed, 95% CI) | ‐0.22 [‐0.50, 0.05] |
|
| 17 Insomnia Show forest plot | 1 | 28 | Risk Difference (M‐H, Fixed, 95% CI) | ‐0.22 [‐0.50, 0.05] |
|
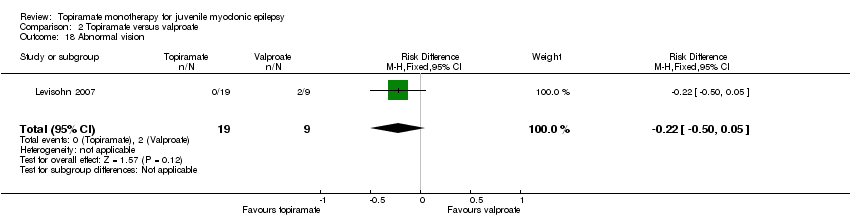
| 18 Abnormal vision Show forest plot | 1 | 28 | Risk Difference (M‐H, Fixed, 95% CI) | ‐0.22 [‐0.50, 0.05] |
|
| 19 Rash Show forest plot | 1 | 28 | Risk Difference (M‐H, Fixed, 95% CI) | ‐0.22 [‐0.50, 0.05] |
|
| 20 Anorexia Show forest plot | 1 | 33 | Risk Ratio (M‐H, Fixed, 95% CI) | 3.19 [0.37, 27.58] |
|
| 21 Hallucination Show forest plot | 1 | 33 | Risk Difference (M‐H, Fixed, 95% CI) | 0.06 [‐0.09, 0.22] |
|
| 22 Diarrhoea Show forest plot | 1 | 33 | Risk Difference (M‐H, Fixed, 95% CI) | ‐0.12 [‐0.30, 0.06] |
|