Anfetaminas para el trastorno de déficit de atención e hiperactividad (TDAH) en niños y adolescentes
Resumen
Antecedentes
El trastorno de déficit de atención e hiperactividad (TDAH) es una de las afecciones psiquiátricas más frecuentes que afectan a niños y adolescentes. Las anfetaminas se encuentran entre los fármacos que se prescriben con mayor frecuencia para el tratamiento del TDAH. Existen tres clases principales de anfetaminas: dexamfetamina, lisdexamfetamina y sales mixtas de anfetamina, que se pueden descomponer adicionalmente en formulaciones de acción corta y prolongada. Nunca se ha realizado una revisión sistemática que evalúe su eficacia y seguridad en esta población.
Objetivos
Evaluar la eficacia y la seguridad de las anfetaminas como tratamiento del TDAH en niños y adolescentes.
Métodos de búsqueda
En agosto 2015, se hicieron búsquedas en CENTRAL, Ovid MEDLINE, Embase, PsycINFO, ProQuest Dissertation and Theses, y en Networked Digital Library of Theses and Dissertations. También se realizaron búsquedas en ClinicalTrials.gov, y se verificaron las listas de referencias de los estudios y las revisiones pertinentes identificados mediante las búsquedas. No se aplicaron restricciones de idioma o de fecha.
Criterios de selección
Ensayos controlados aleatorios (ECA) de grupos paralelos y cruzados (crossover) que compararon derivados de la anfetamina contra placebo en una población pediátrica (< 18 años) con TDAH.
Obtención y análisis de los datos
Dos autores extrajeron de forma independiente los datos sobre los participantes, los contextos, las intervenciones, la metodología y los resultados de cada estudio incluido. Para los resultados continuos se calculó la diferencia de medias estandarizada (DME) y para los resultados dicotómicos se calculó el cociente de riesgos (CR). De ser posible se realizaron metanálisis mediante el modelo de efectos aleatorios. También se realizó un metanálisis de los eventos adversos informados con más frecuencia en los estudios primarios.
Resultados principales
Se incluyeron 23 ensayos (ocho de grupos paralelos y 15 ensayos cruzados) con 2675 niños de tres a 17 años de edad. Todos los estudios compararon anfetaminas con placebo. Las duraciones de los estudios variaron desde 14 días a 365 días, la mayoría con una duración menor de seis meses. La mayoría de los estudios se realizaron en los Estados Unidos; Se realizaron tres estudios en Europa. Se consideró que 11 estudios incluidos tuvieron alto riesgo de sesgo debido a métodos de cegamiento insuficientes, la imposibilidad de justificar los abandonos y las exclusiones del análisis y la imposibilidad de informar todos los resultados definidos a priori. Se consideró que los 12 estudios restantes tuvieron riesgo incierto de sesgo debido al informe insuficiente.
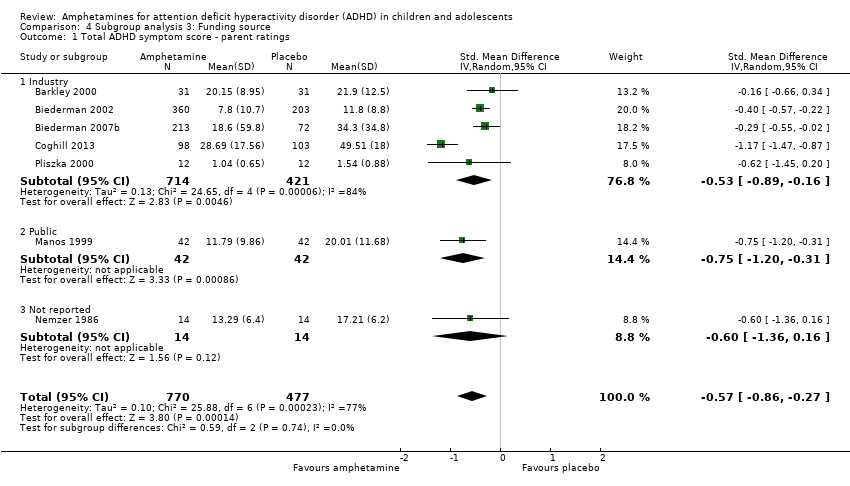
Las anfetaminas mejoraron la gravedad de los síntomas centrales totales del TDAH según las calificaciones de los padres (DME ‐0,57; intervalo de confianza [IC] del 95%: ‐0,86 a ‐0,27; siete estudios; 1247 niños/adolescentes; pruebas de muy baja calidad), las calificaciones de los maestros (DME ‐0,55; IC del 95%: ‐0,83 a ‐0,27; cinco estudios; 745 niños/adolescentes; pruebas de baja calidad) y las calificaciones de los médicos (DME ‐0,84; IC del 95%: ‐1,32 a ‐0,36; tres estudios; 813 niños/adolescentes; pruebas de muy baja calidad). Además, la proporción de los que responden al tratamiento evaluada por la escala Clinical Global Impression ‐ Improvement (CGI‐I) fue mayor cuando los niños recibieron anfetaminas (CR 3,36; IC del 95%: 2,48 a 4,55; nueve estudios; 2207 niños/adolescentes; pruebas de muy baja calidad).
Los eventos adversos informados con más frecuencia incluyeron reducción del apetito, insomnio / dificultad para dormir, dolor abdominal, náuseas / vómitos, cefaleas y ansiedad. Las anfetaminas se asociaron con una proporción mayor de participantes que experimentaron reducción del apetito (CR 6,31; IC del 95%: 2,58 a 15,46; 11 estudios; 2467 niños/adolescentes), insomnio (CR 3,80; IC del 95%: 2,12 a 6,83; diez estudios; 2429 niños/adolescentes), y dolor abdominal (CR 1,44; IC del 95%: 1,03 a 2,00; diez estudios; 2155 niños/adolescentes). Además, la proporción de niños que experimentaron al menos un evento adverso fue mayor en el grupo de anfetamina (CR 1,30; IC del 95%: 1,18 a 1,44; seis estudios; 1742 niños/adolescentes; pruebas de baja calidad).
Se realizaron análisis de subgrupos por la preparación de anfetaminas (dexamfetamina, lisdexamfetamina, sales mixtas de anfetamina), la formulación de liberación de anfetaminas (acción prolongada versus acción corta) y la fuente de financiamiento (industria versus no industria). Se observaron diferencias entre los grupos en la proporción de participantes que experimentaron reducción del apetito en los subgrupos de preparación de anfetaminas (p < 0,00001) y formulación de liberación de anfetaminas (valor de p = 0,008), así como en la retención en el subgrupo de formulación de liberación de anfetaminas (valor de p = 0,03).
Conclusiones de los autores
En su mayoría los estudios incluidos tuvieron alto riesgo de sesgo y la calidad general de las pruebas varió de baja a muy baja en la mayoría de los resultados. Aunque las anfetaminas parecen eficaces para reducir los síntomas centrales del TDAH a corto plazo, estos fármacos se asociaron con varios eventos adversos. Esta revisión no encontró pruebas que apoyen a ningún derivado de la anfetamina sobre otro, y no muestra diferencias entre las preparaciones de anfetaminas de acción prolongada y de acción corta. Los ensayos futuros deben tener una duración más prolongada (es decir, más de 12 meses), incluir más resultados psicosociales (p.ej. calidad de vida y estrés de los padres) e informarse de manera transparente.
PICO
Resumen en términos sencillos
Anfetaminas para el trastorno de déficit de atención e hiperactividad en niños y adolescentes
Antecedentes
El trastorno de déficit de atención e hiperactividad (TDAH) es un problema frecuente que afecta a niños y adolescentes. El TDAH se caracteriza por desatención (se distrae fácilmente, incapaz de centrarse en una tarea), impulsividad (intranquilidad; movimientos constantes) e hiperactividad (impaciente; actúa sin pensar). Uno de los tratamientos más frecuentes para tratar el TDAH es la clase de fármacos anfetaminas, que son una clase de fármacos estimulantes. Se piensa que reducen la gravedad de los síntomas asociados con el TDAH.
Pregunta de la revisión
¿Los niños y adolescentes (menores de 18 años de edad) diagnosticados con TDAH se benefician del tratamiento con anfetaminas para reducir los síntomas centrales del TDAH, en comparación con otros niños y adolescentes que no reciben fármacos o reciben un fármaco falso (placebo)?
Características de los estudios
Hasta agosto de 2015 se identificaron 23 ensayos controlados aleatorios (ECA: un tipo de experimento científico en el cual las personas se asignan al azar a uno de dos o más tratamientos), que incluyeron a 2675 niños y adolescentes entre tres años y 17 años de edad. Estos estudios compararon las anfetaminas con el placebo. Se investigaron tres tipos diferentes de anfetaminas: dexanfetamina, lisdexanfetamina y sales mixtas de anfetamina. La duración de los estudios incluidos varió de 14 a 365 días. Los ECA se realizaron en los Estados Unidos y Europa.
Resultados clave
Se encontró que las anfetaminas fueron eficaces para mejorar los síntomas centrales del TDAH a corto plazo, pero también se vincularon a un riesgo mayor de experimentar eventos adversos como problemas del sueño, reducción del apetito y dolor del estómago. No se encontraron pruebas de que una clase de anfetamina fuera mejor que otra y no se encontraron diferencias entre las anfetaminas que actúan durante períodos más largos versus las que actúan durante períodos más cortos.
Calidad de la evidencia
La calidad de los estudios incluidos fue baja a muy baja debido a problemas en el diseño y a diferencias grandes entre los estudios. Se necesitan ECA bien diseñados y claramente informados con una duración más prolongada, de manera que se puedan comprender mejor los efectos a largo plazo (positivos y negativos) de las anfetaminas.
Conclusiones de los autores
Summary of findings
| Amphetamines compared with placebo for attention deficit hyperactivity disorder in children and adolescents | ||||||
| Patient or population: children or adolescents with ADHD Settings: Beligum, France, Germany, Hungary, Italy, Netherlands, Norway, Poland, Spain, Sweden, United Kingdom, United States Intervention: amphetamines (i.e. dexamphetamine, lisdexamphetamine, mixed amphetamine salts) Comparison: placebo | ||||||
| Outcomes | Illustrative comparative risks* (95% CI) | Relative effect | Number of participants | Quality of the evidence | Comments | |
| Assumed risk | Corresponding risk | |||||
| Placebo | Amphetamine | |||||
| Total ADHD symptom score ‐ parent ratings (ADHD Rating Scale, Fourth Version; Conners' Rating Scale; Conners' Global Index; Conners' Abbreviated Symptom Questionnaire) | ‐ | The mean total score in the intervention groups was 0.57 standard deviations lower (‐0.86 to ‐0.27) | SMD ‐0.57 (‐0.86 to ‐0.27) | 1247 | ⊕⊝⊝⊝ | Moderate effect** |
| Total ADHD symptom score ‐ teacher ratings (ADHD Rating Scale, Fourth Version; Conners' Rating Scale; Conners' Global Index; Conners' Abbreviated Symptom Questionnaire) Follow‐up: 7 to 35 days | ‐ | The mean total score in the intervention groups was 0.55 standard deviations lower (‐0.83 to ‐0.27) | SMD ‐0.55 (‐0.83 to ‐0.27) | 745 | ⊕⊕⊝⊝ | Moderate effect** |
| Total ADHD symptom score ‐ clinician ratings (ADHD Rating Scale, Fourth Version) | ‐ | The mean total score in the intervention groups was 0.84 standard deviations lower (‐1.32 to ‐0.36) | SMD ‐0.84 (‐1.32 to ‐0.36) | 813 | ⊕⊝⊝⊝ | Large effect** |
| Proportion of responders (Clinical Global Impressions ‐ Improvement (CGI‐I) scale) | 187 per 1000 | 605 per 1000 | RR 3.36 (2.48 to 4.55) | 2207 | ⊝⊝⊝⊝ | ‐ |
| Academic performance (Permanent Product Measure of Performance; Wechsler Intelligence Scale for Children ‐ Revised; Barnell Lot, Ltd Math Test; Wide Range Achievement Test) Follow‐up: 7 to 21 days | ‐ | The mean score in the intervention groups was 0.51 standard deviations higher (0.31 to 0.70) | SMD 0.56 (0.39 to 0.73) | 826 | ⊕⊕⊝⊝ | Moderate effect** |
| Retention: proportion of participants who completed the trial | 825 per 1000 | 864 per 1000 | RR 1.03 | 2381 | ⊕⊝⊝⊝ | ‐ |
| Proportion of participants who experienced at least 1 adverse event | 366 per 1000 | 582 per 1000 | RR 1.30 (1.18 to 1.44) | 1742 | ⊕⊕⊝⊝ | ‐ |
| *The basis for the assumed risk (e.g. the median control group risk across studies) is provided in the footnotes. The corresponding risk (and its 95% CI) is based on the assumed risk in the comparison group and the relative effect of the intervention (and its 95% CI). ADHD: Attention deficit hyperactivity disorder; CI: Confidence interval; GRADE: Grades of recommendation, assessment, development and evaluation; RR: Risk ratio; SMD: Standardized mean difference | ||||||
| GRADE Working Group grades of evidence | ||||||
| 1Downgraded one level due to the majority of studies included in this outcome having a high risk of bias. | ||||||
Antecedentes
Descripción de la afección
El trastorno de déficit de atención e hiperactividad (TDAH) es una de las afecciones psiquiátricas pediátricas más frecuentes y afecta a alrededor del 5% de los niños en todo el mundo (Polanczyk 2007). El TDAH se caracteriza por tres síntomas centrales: desatención, impulsividad e hiperactividad, que se muestran con mayor frecuencia que lo que sería característico en los niños de la misma edad(APA 2000). Los síntomas centrales a menudo se presentan en diversos grados en diferentes niños, lo que divide al TDAH en tres subtipos: el tipo predominantemente distraído, el tipo predominantemente hiperactivo impulsivo y el tipo combinado (es decir, niños que muestran desatención e hiperactividad) (APA 2000). La afección a menudo se diagnostica a una edad temprana, generalmente entre los tres y seis años de edad(NIMH 2009). La posibilidad de comorbilidad es muy alta en esta población y las comorbilidades están presentes en casi dos tercios de los casos pediátricos de TDAH; las más frecuentes son el trastorno de oposición desafiante (50%), el trastorno de conducta (35%), el trastorno por ansiedad (33%) y la depresión (33%) (AHRQ 1999; Mayes 2009).
Se ha mostrado que los síntomas de TDAH influyen sobre el rendimiento del niño en múltiples contextos y tienen efectos a largo plazo sobre el rendimiento académico y el desarrollo social. Los estudios también han mostrado que los niños con TDAH tienen mayores probabilidades de ser irritables, impacientes y agresivos (NIH 2000). Además, las familias que tienen niños con TDAH a menudo experimentan niveles más altos de estrés paterno y frustración, trastornos matrimoniales y aislamiento social (Edwards 1995). Se ha calculado que el 50% de los casos de TDAH en la niñez persistirá hasta la adolescencia y la adultez(Biederman 1993), lo que lo convierte en una enfermedad crónica para muchos.
Descripción de la intervención
Se ha utilizado una variedad amplia de tratamientos para el tratamiento del TDAH, que incluyen intervenciones psicosociales, control dietético, remedios a base de hierbas y homeopáticos y biorretroalimentación. Sin embargo, durante las últimas décadas el psicoestimulante metilfenidato ha sido el tratamiento de primera línea (APA 2000) y se ha encontrado que es eficaz en el 70% al 90% de los niños en edad escolar (NIH 2000; Wigal 1999). Las anfetaminas son el segundo psicoestimulante prescrito con mayor frecuencia para el TDAH pediátrico y se ha convertido en una opción cada vez más popular en los niños que no logran responder al metilfenidato(Buck 2002). Actualmente hay tres preparaciones diferentes de anfetaminas disponibles, que incluyen: dexamfetamina (dextroanfetamina o sulfato d‐anfetamina), que se produce en formulaciones de acción corta y de acción prolongada; lisdexamfetamina, que está disponible como una formulación de acción prolongada (Vyvanase); y sales mixtas de anfetamina, que también se producen en formulaciones de acción corta y de acción prolongada (Buck 2002; The Medical Letter 2007).
De qué manera podría funcionar la intervención
Aunque la fisiopatología del TDAH se comprende poco, las pruebas han indicado que el TDAH se puede deber a la producción insuficiente de norepinefrina y dopamina en la corteza prefrontal (Arnsten 2006). Como tal, las funciones ejecutivas realizadas por la corteza prefrontal están deterioradas, lo que provoca mala memoria, distractibilidad, impulsividad y comportamientos sociales inapropiados (Anderson 1999). Otros consideran que el sistema límbico desempeña una función importante en la fisiopatología del TDAH, y se piensa que la hiperactividad y la impulsividad se deben a la actividad tónica anormalmente baja de la dopamina dentro de esta región del cerebro (Moore 2011). En cualquiera de los casos se piensa que las anfetaminas, como psicoestimulantes, promueven la liberación marcada de neurotransmisores en la hendidura sináptica, así como que interrumpen la recaptación normal de los neurotransmisores, lo que aumenta los niveles de norepinefrina y dopamina en estas regiones del cerebro y afecta el funcionamiento ejecutivo (Arnsten 2006; Swanson 2007). Una revisión Cochrane de las anfetaminas para el TDAH en adultos encontró que mejoraron la gravedad del síntoma a corto plazo(Castells 2011).
Por qué es importante realizar esta revisión
A pesar de ser uno de los trastornos investigados con mayor cuidado en la medicina, una de las controversias principales con respecto al TDAH es la administración de psicoestimulantes como una opción de tratamiento. Aunque las pruebas actuales indican que las anfetaminas pueden ser beneficiosas para mejorar los síntomas centrales del TDAH, sus efectos sobre los dominios académicos y sociales todavía son inconsistentes y no están claros (NIH 2000). Las variaciones amplias en la administración y la prescripción de las anfetaminas entre las comunidades indican que hay falta de consenso entre los médicos con respecto a qué pacientes con TDAH deben ser tratados con anfetaminas. Charach 2011y Miller 1999 realizaron revisiones que evaluaron las anfetaminas para el TDAH pediátrico; sin embargo, la primera se centró solamente en la efectividad a largo plazo de las anfetaminas (es decir, > 12 meses), mientras que la última no sólo es antigua, sino que también se centró exclusivamente en la preparación de dexamfetamina. Es imprescindible que los profesionales sanitarios, los padres y los pacientes con diagnóstico de TDAH estén conscientes de las opciones de tratamiento más apropiadas disponibles, y de cómo difieren en cuanto a la eficacia y los perfiles de seguridad. Esta síntesis de todos los ensayos controlados aleatorios disponibles que evalúan la eficacia y la seguridad de las anfetaminas para el TDAH pediátrico aportarán pruebas para informar mejor la práctica clínica y los estudios de investigación adicionales con respecto al tratamiento del TDAH. Aunque evaluar las anfetaminas contra otros tratamientos para el TDAH como el metilfenidato, la psicoterapia y los antidepresivos es importante, establecer si las anfetaminas son superiores a placebo es un primer paso necesario. Por lo tanto, esta revisión se centrará solamente en la comparación de anfetaminas versus placebo.
Objetivos
Evaluar la eficacia y la seguridad de las anfetaminas como tratamiento del TDAH en niños y adolescentes.
Métodos
Criterios de inclusión de estudios para esta revisión
Tipos de estudios
Ensayos controlados aleatorios (ECA) de grupos paralelos y cruzados.
Tipos de participantes
Niños y adolescentes menores de 18 años de edad y diagnosticados con TDAH mediante criterios diagnósticos específicos como el Diagnostic and Statistical Manual of Mental Disorders Third Edition (DSM‐III) (APA 1987), Fourth Edition (DSM‐IV)(APA 2000), o equivalentes (nota: debido a que la quinta edición [DSM‐5] se dio a conocer durante la realización de esta revisión, los estudios que utilizan esto criterios no se incluyeron). Se incluyeron los ensayos en los participaron niños / adolescentes con algunas afecciones concomitantes (trastorno de oposición desafiante, trastorno de conducta y ansiedad). Se excluyeron los ensayos con criterios de inclusión que permitieron la participación de niños / adolescentes con comorbilidades psiquiátricas que requieren programas de tratamiento muy especializados (p.ej. autismo, trastorno bipolar y psicosis).
Tipos de intervenciones
Intervención
Cualquier forma oral de anfetamina (es decir anfetamina, dexamfetamina, lisdexamfetamina y sales mixtas de anfetamina), a cualquier dosis.
Control
Placebo.
Tipos de medida de resultado
Resultados primarios
-
Cambio en los síntomas centrales del TDAH (desatención, hiperactividad, impulsividad), medido con una escala validada calificada por los niños, los padres, los maestros, los médicos o los investigadores, como la Conners’ Parent Rating Scale ‐ Revised (CPRS‐R) (Conners 1998a),la Conners’ Teacher Rating Scale ‐ Revised (CTRS‐R)(Conners 1998b), o la ADHD Rating Scale, Fourth Version (ADHD‐RS‐IV) (DuPaul 1998).
Resultados secundarios
-
Mejoría clínica*, medida con, por ejemplo, la escala Clinical Global Impression ‐ Improvement (CGI‐I) (Guy 1976).
-
Gravedad clínica, medida con, por ejemplo, la escala Clinical Global Impression ‐ Severity (CGI‐S) (Guy 1976).
-
Rendimiento académico*, medido con cualquier herramienta validada que intente evaluar el rendimiento académico, como la Wechsler Intelligence Scale for Children (WISC) (Wechsler 1991).
-
Calidad de vida, medida con una escala validada como el Pediatric Quality of Life Inventory ‐ 32 (PedsQL‐32) (Varni 1998).
-
Retención: proporción de participantes asignados al azar que completaron el ensayo*.
-
Eventos adversos (como náuseas, insomnio / problemas del sueño y reducción del apetito).
-
Proporción de eventos adversos.
-
Proporción de participantes que experimentaron al menos un evento adverso*, como se informó en los ensayos.
-
Proporción de participantes que se retiraron debido a eventos adversos.
-
Los resultados marcados con un asterisco (*) se utilizaron para completar el Resumen de los hallazgos para la comparación principal.
Los plazos se denotaron como a corto plazo (hasta seis meses), a plazo medio (entre seis y 12 meses) y a largo plazo (más de 12 meses).
Ver Tabla 1 para más información.
Results
Description of studies
See: Characteristics of included studies; Characteristics of excluded studies; Characteristics of studies awaiting classification; Characteristics of ongoing studies.
Results of the search
Figure 1 summarizes the flow of studies through the screening process. The electronic databases retrieved 7011 records while other sources yielded 198 records. After removing duplicates, we identified 5210 records for further consideration. After screening titles and available abstracts, we examined the full texts of 324 records, 34 met our inclusion criteria. From these, we identified 23 studies, four of which had multiple reports. These were: Borcherding 1990 (four reports), Coghill 2013 (three reports), Donnelly 1989 (two reports; one of which was the pilot, and the other was the full study), and Ramtvedt 2013 (two reports). In addition, we identified two ongoing clinical trials (Fanton 2009; NCT01711021); although recruitment has ended for both of these trials, none of the results have been published. We contacted the authors of both studies three times yielding no response. One non‐English language study is awaiting classification until we can ascertain if it was randomized and whether participants had a formal diagnosis of ADHD (Glos 1973). This information is unobtainable given our inability to contact the author. Another study also awaits classification as only the abstract has been published (Itil 1974). Information on whether treatments were randomized and whether participants had a formal diagnosis is needed. We contacted the authors three times yielding no response.

Study flow diagram
Included studies
Twenty‐three studies met the inclusion criteria: 15 studies were cross‐over trials (Barkley 2000; Biederman 2007a; Borcherding 1990; Childress 2015; Donnelly 1989; James 2001; Manos 1999; McCracken 2003; Nemzer 1986; Ramtvedt 2013; Sharp 1999; Shekim 1986; Short 2004; Swanson 1998a; Wigal 2009a), while eight studies were parallel‐group trials (Biederman 2002; Biederman 2007b; Coghill 2013; Findling 2011; Giblin 2011; Gillberg 1997; Pliszka 2000; Spencer 2006a).
Ten studies included a single comparison of an amphetamine derivative versus placebo (Borcherding 1990; Childress 2015; Coghill 2013; Donnelly 1989; Gillberg 1997; Nemzer 1986; Pliszka 2000; Ramtvedt 2013; Sharp 1999; Shekim 1986), and 11 studies compared more than one dose of an amphetamine derivative with placebo (Barkley 2000; Biederman 2002; Biederman 2007b; Findling 2011; Giblin 2011; Manos 1999; McCracken 2003; Short 2004; Spencer 2006a; Swanson 1998a; Wigal 2009a); two studies compared more than one amphetamine derivative, each at various doses, versus placebo (Biederman 2007a; James 2001).
Participants
In total, the 23 included studies recruited 2675 children and adolescents aged between three years and 17 years, 72% (n = 1925) of whom were boys; one study did not report the number of included boys and girls (Pliszka 2000).
Twenty‐two studies used various versions of the DSM criteria to confirm ADHD diagnosis in their participants, including criteria from the Third Edition (DSM‐III; four trials; n = 102; Borcherding 1990; Donnelly 1989; Nemzer 1986; Shekim 1986); Third Edition Revised (DSM‐III‐R; one trial; n = 62; Gillberg 1997); Fourth Edition (DSM‐IV; eight trials; n = 899; Barkley 2000; Biederman 2002; James 2001; Manos 1999; McCracken 2003; Sharp 1999; Short 2004; Swanson 1998a), and Fourth Edition, Text Revision (DSM‐IV‐TR; nine trials; n = 1553; Biederman 2007a; Biederman 2007b; Childress 2015; Coghill 2013; Findling 2011; Giblin 2011; Ramtvedt 2013; Spencer 2006a; Wigal 2009a). Pliszka 2000 (n = 59) diagnosed ADHD using the Diagnostic Interview Schedule for Children (Costello 1985).
Interventions
Twelve studies assessed mixed amphetamine salts (Barkley 2000; Biederman 2002; Biederman 2007a; Childress 2015; Gillberg 1997; James 2001; Manos 1999; McCracken 2003; Pliszka 2000; Short 2004; Spencer 2006a; Swanson 1998a); seven studies used dextroamphetamine (Borcherding 1990; Donnelly 1989; James 2001; Nemzer 1986; Ramtvedt 2013; Sharp 1999; Shekim 1986); and six studies looked at lisdexamphetamine (Biederman 2007a; Biederman 2007b; Coghill 2013; Findling 2011; Giblin 2011; Wigal 2009a). Two studies assessed two amphetamine derivatives (Biederman 2007a; James 2001).
Twelve studies randomized children and adolescents to set doses or dosing schedules (Barkley 2000; Biederman 2002; Biederman 2007b; Coghill 2013; Findling 2011; Giblin 2011; Manos 1999; McCracken 2003; Ramtvedt 2013; Short 2004; Spencer 2006a; Swanson 1998a). Seven studies used weight‐based dosing (Borcherding 1990; Donnelly 1989; James 2001; Nemzer 1986; Pliszka 2000; Sharp 1999; Shekim 1986), while six studies titrated children and adolescents to their optimal dose (Biederman 2007a; Childress 2015; Gillberg 1997; Pliszka 2000; Shekim 1986; Wigal 2009a). Two studies used both weight‐based dosing and titration (Pliszka 2000; Shekim 1986). The mean (range) doses investigated in the included studies were 34.22 mg/day (7.8 mg/day to 90 mg/day) for dextroamphetamine, 50.24 mg/day (30 mg/day to 70 mg/day) for lisdexamphetamine, and 19.86 mg/day (5 mg/day to 120 mg/day) for mixed amphetamine salts.
Duration
Study intervention length ranged from 14 days to 365 days, with a median of 28 days. Only one study was longer than 63 days (Gillberg 1997).
Location
Twenty studies were conducted in the United States (Barkley 2000; Biederman 2002; Biederman 2007a; Biederman 2007b; Borcherding 1990; Childress 2015; Donnelly 1989; Findling 2011; Giblin 2011; James 2001; Manos 1999; McCracken 2003; Nemzer 1986; Pliszka 2000; Sharp 1999; Shekim 1986; Short 2004; Spencer 2006a; Swanson 1998a; Wigal 2009a). One multicenter trial was conducted in 48 centers across 10 countries: Belgium, France, Germany, Hungary, Italy, Netherlands, Poland, Spain, Sweden, and the United Kingdom (Coghill 2013). The two remaining studies were conducted in Sweden (Gillberg 1997) and Norway (Ramtvedt 2013).
Outcomes
Details of all ADHD core symptom outcome measures used by study can be found in the Characteristics of included studies and Table 2. The most commonly used outcome tool for the primary outcome included the Conners' Rating Scales (Conners 1998a; Conners 1998b) and the ADHD‐RS‐IV (DuPaul 1998).
For secondary outcomes, the most commonly utilized outcome tool for academic performance was the Permanent Product Measure of Performance (PERMP; Swanson 1998b). Only one study assessed quality of life (Findling 2011), and used the Youth Quality of Life ‐ Research Version questionnaire (YQOL‐R; Salum 2012)
| Outcome | Outcome measure (respondent) | Studies | Measure used in meta‐analysis |
| Inattention | ADHD Rating Scale, Fourth Version (parent ratings) | No (data presented in an unusable format) | |
| ADHD Rating Scale, Fourth Version (clinician ratings) | Yes | ||
| Yes | |||
| Yes | |||
| ADHD Rating Scale, Fourth Version (investigator/research personnel ratings) | Yes | ||
| Conners’ Rating Scale (parent ratings) | Yes | ||
| No (only study that included long‐term data) | |||
| Conners’ Rating Scale (teacher ratings) | No (only study that included long‐term data) | ||
| IOWA Conners’ Rating Scale | Yes | ||
| SKAMP scale (teacher ratings) | No (data not available) | ||
| SKAMP scale (investigator/research personnel ratings) | Yes | ||
| Yes | |||
| Hyperactivity/impulsivity | ADHD Rating Scale, Fourth Version (parent ratings) | No (data presented in an unusable format) | |
| ADHD Rating Scale, Fourth Version (clinician ratings) | Yes | ||
| Yes | |||
| Yes | |||
| ADHD Rating Scale, Fourth Version (investigator/research personnel ratings) | Yes | ||
| Conners’ Rating Scale (parent ratings) | No (only study that included long‐term data) | ||
| Yes | |||
| Conners’ Rating Scale (teacher ratings) | No (only study that included long‐term data) | ||
| Yes | |||
| Total core symptom score | ADHD Rating Scale, Fourth Version (parent ratings) | Yes | |
| Yes | |||
| ADHD Rating Scale, Fourth Version (teacher ratings) | Yes | ||
| ADHD Rating Scale, Fourth Version (clinician ratings) | Yes | ||
| Yes | |||
| Yes | |||
| ADHD Rating Scale, Fourth Version (investigator/research personnel ratings) | Yes | ||
| No (no data available) | |||
| Conners’ Rating Scale (parent ratings) | No (data presented in an unusable format) | ||
| Yes | |||
| No (data not available) | |||
| No (only study that included long‐term data) | |||
| Yes | |||
| No (data not available) | |||
| No (data presented in an unusable format) | |||
| Conners’ Rating Scale (teacher ratings) | No (no data available) | ||
| Yes | |||
| No (only study that included long‐term data) | |||
| Yes | |||
| No (data not available) | |||
| No (data presented in an unusable format) | |||
| Conners’ Global Index (parent ratings) | Yes | ||
| Yes | |||
| Conners’ Global Index (teacher ratings) | Yes | ||
| Conners’ Abbreviated Symptom Questionnaire (parent ratings) | Yes | ||
| Conners’ Abbreviated Symptom Questionnaire (teacher ratings) | Yes | ||
| ADHD Questionnaire (developed within study) (parent ratings) | No (data presented in an unusable format) | ||
| ADHD Questionnaire (developed within study) (teacher ratings) | No (data presented in an unusable format) | ||
| SKAMP scale (investigator/research personnel ratings) | Yes |
ADHD: attention deficit hyperactivity disorder.
IOWA: inattention/overactivity with aggression.
SKAMP: Swanson, Kotkin, Agler, M‐Flynn and Pelham scale.
Excluded studies
We excluded a total of 290 studies. We excluded 264 clearly irrelevant reports and formally excluded 26 studies for the following reasons: 17 studies because they were not RCTs or used multiple cross‐over designs (this review only included single cross‐over RCTs); three studies because there was no placebo comparison, three studies because they did not use formal ADHD diagnostic criteria; one study because it had no direct amphetamine ‐ placebo comparison; one study because participants had ineligible comorbid conditions; and one study because it included adults.
See also Characteristics of excluded studies tables.
Risk of bias in included studies
A more in depth risk of bias assessment for each study can be found in Characteristics of included studies. In addition, Figure 2 provides a summary of this assessment.

Risk of bias graph: review authors' judgements about each risk of bias item presented as percentages across all included studies.
Allocation
Random sequence generation
Only three studies reported on how the random sequence was generated and were assessed as being at 'low' risk of bias on this domain (Biederman 2007b; Childress 2015; Findling 2011). We rated the other 20 studies as 'unclear' risk of bias as they did not adequately describe their methods of randomization.
Allocation concealment
Four studies described the methods used to conceal the allocation sequence and were rated as being at 'low' risk of bias on this domain (Biederman 2007a; Coghill 2013; Findling 2011; Manos 1999). The rest of the studies we assessed as 'unclear' risk of bias, as they did not sufficiently describe their methods of allocation concealment.
Blinding
Performance bias
Although blinding was intended in all of the studies, we assessed risk of bias by how authors described their amphetamine and placebo capsules and rated 10 studies as being at 'low' risk of bias on this domain (Biederman 2007b; Coghill 2013; James 2001; Manos 1999; Nemzer 1986; Pliszka 2000; Sharp 1999; Short 2004; Swanson 1998a; Wigal 2009a). We rated one study as being at 'high' risk of bias on this domain since they described their intervention and placebo as not being identical (Ramtvedt 2013). The other 12 studies we marked as being at 'unclear' risk of bias since they were not explicit about the similarities between the two interventions.
Detection bias
Only two studies explicitly stated that outcome assessors were blinded to interventions and therefore we judged them to be at 'low' risk of bias (Manos 1999; Short 2004). The other 21 studies we rated as 'unclear' risk of bias since they were not explicit about which parties were blinded to the intervention assignment.
Incomplete outcome data
We rated thirteen studies that adequately addressed dropouts and used appropriate statistical methods to compensate for dropouts as having a 'low' risk of bias on this domain (Biederman 2002; Biederman 2007a; Biederman 2007b; Childress 2015; Donnelly 1989; Findling 2011; Gillberg 1997; James 2001; McCracken 2003; Pliszka 2000; Sharp 1999; Spencer 2006a; Wigal 2009a). Seven studies failed to provide reasons for dropouts and failed to address any exclusions from their analyses, and therefore we rated them as having a 'high' risk of bias (Barkley 2000; Borcherding 1990; Coghill 2013; Ramtvedt 2013; Shekim 1986; Short 2004; Swanson 1998a). The three remaining studies did not discuss dropouts in their reports and we rated them as being at 'unclear' risk of bias (Giblin 2011; Manos 1999; Nemzer 1986).
Selective reporting
We assessed 17 studies as having 'unclear' risk of bias on this domain as the study protocols for most of them were not available, so we could not assess reporting bias (Barkley 2000; Biederman 2002; Biederman 2007b; Borcherding 1990; Donnelly 1989; Giblin 2011; Gillberg 1997; James 2001; Manos 1999; McCracken 2003; Nemzer 1986; Pliszka 2000; Sharp 1999; Shekim 1986; Short 2004; Swanson 1998a; Wigal 2009a). We rated four studies as having a 'low' risk of bias, as they appropriately reported on all outcomes defined in their protocols (Biederman 2007a; Childress 2015; Findling 2011; Spencer 2006a). Two studies we assessed as having a 'high' risk of bias since they failed to report on all outcomes mentioned in their registered protocols (Coghill 2013; Ramtvedt 2013).
Other potential sources of bias
We rated three studies as being at 'unclear' risk of bias on this domain since the validity of their primary outcome tools were not described (Borcherding 1990; Donnelly 1989; Ramtvedt 2013). The other 20 studies appeared to be free of other potential sources of bias and therefore we rated them as being at 'low' risk of bias on this domain.
Effects of interventions
See: Summary of findings for the main comparison
We included 19 studies in meta‐analyses, however, two of those studies had measured other outcomes that were relevant to this review, but were not reported in their results (Borcherding 1990; Swanson 1998a). Biederman 2007b had reported some of their results as bar graphs, which, when extracted using graphic digitizer software, gave implausible results and therefore was excluded from the meta‐analysis on those outcomes. Four studies were excluded from all meta‐analyses: Giblin 2011 had not reported data on any of the relevant outcomes in this review; Gillberg 1997 was the only medium‐term study and therefore could not be combined with the other short‐term studies; Ramtvedt 2013 had aggregated their parent‐ and teacher‐rated ADHD scores; and Short 2004 assessed amphetamines versus methylphenidate versus placebo and pooled the amphetamine and methylphenidate data in their results; we were unable to isolate the amphetamine versus placebo comparison.
Primary outcome
Change in core ADHD symptoms
We conducted a series of meta‐analyses for the primary outcome, change in core ADHD symptoms (inattention, hyperactivity, impulsivity), as measured by a validated scale rated by children, parents, teachers, clinicians, or investigators (Analysis 1.1 to Analysis 1.11).
For all 11 outcomes, amphetamines were superior to placebo for reducing the core symptoms of ADHD.
-
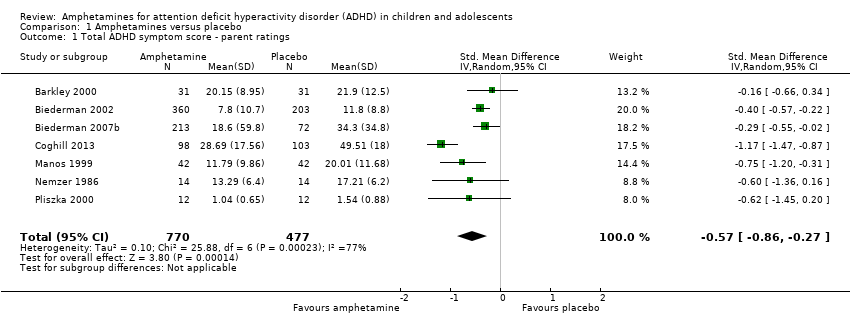
Total ADHD symptom score ‐ parent ratings (SMD ‐0.57; 95% CI ‐0.86 to ‐0.27; Tau² = 0.10; I² = 77%; 7 studies; 1247 children/adolescents; Analysis 1.1).
-
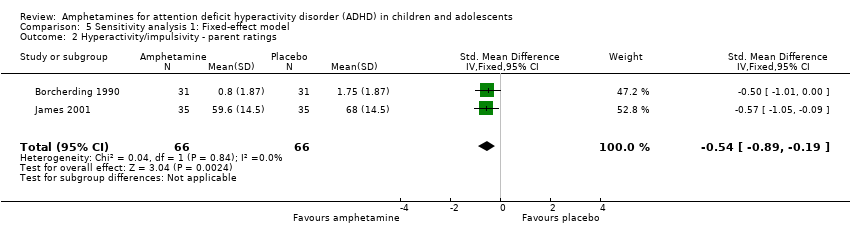
Hyperactivity/impulsivity ‐ parent ratings (SMD ‐0.54; 95% CI ‐0.89 to ‐0.19; Tau² = 0.00; I² = 0%; 2 studies; 132 children/adolescents; Analysis 1.2).
-
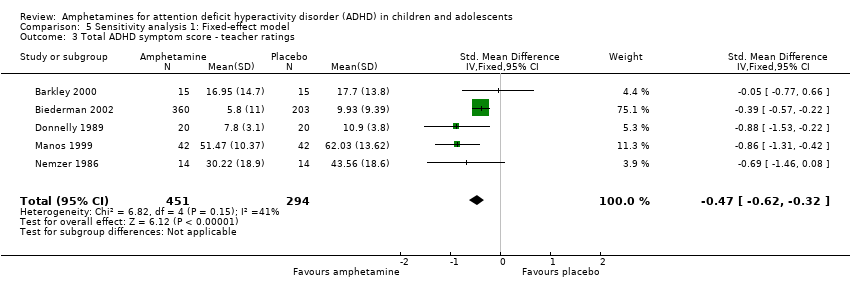
Total ADHD symptom score ‐ teacher ratings (SMD ‐0.55; 95% CI ‐0.83 to ‐0.27; Tau² = 0.04; I² = 41%; 5 studies; 745 children/adolescents; Analysis 1.3).
-
Hyperactivity/impulsivity ‐ teacher ratings (SMD ‐1.13; 95% CI ‐1.63 to ‐0.62; 1 study; 70 children/adolescents; Analysis 1.4).
-
Inattention ‐ teacher ratings (SMD ‐1.43; 95% CI ‐2.35 to ‐0.52; 1 study; 24 children/adolescents; Analysis 1.5).
-
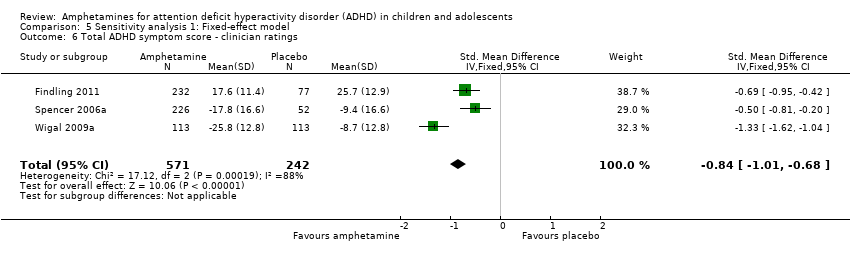
Total ADHD symptom score ‐ clinician ratings (SMD ‐0.84; 95% CI ‐1.32 to ‐0.36; Tau² = 0.16; I² = 88%; 3 studies; 813 children/adolescents; Analysis 1.6).
-
Hyperactivity/impulsivity ‐ clinician ratings (SMD ‐0.75; 95% CI ‐1.28 to ‐0.23; Tau² = 0.20; I² = 90%; 3 studies; 813 children/adolescents; Analysis 1.7).
-
Inattention ‐ clinician ratings (SMD ‐0.78; 95% CI ‐1.26 to ‐0.30; Tau² = 0.16; I² = 88%; 3 studies; 813 children/adolescents; Analysis 1.8).
-
Total ADHD symptom score ‐ investigator/research personnel ratings (SMD ‐1.15; 95% CI ‐1.87 to ‐0.44; Tau² = 0.37; I² = 94%; 3 studies; 630 children/adolescents; Analysis 1.9).
-
Hyperactivity/impulsivity ‐ investigator/research personnel ratings (SMD ‐1.46; 95% CI ‐ 1.83 to ‐1.08; Tau² = 0.03; I² = 41%; 2 studies; 280 children/adolescents; Analysis 1.10).
-
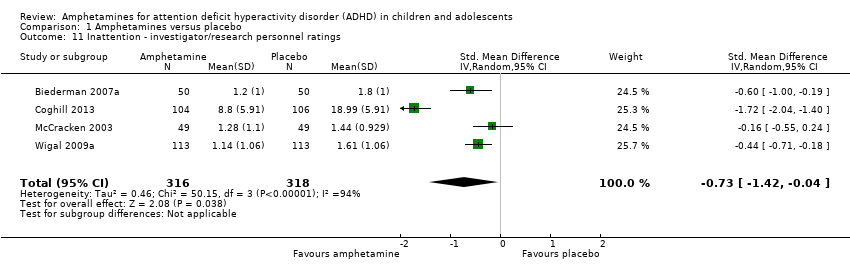
Inattention ‐ investigator/research personnel ratings (SMD ‐0.73; 95% CI ‐1.42 to ‐0.04; Tau² = 0.46; I² = 94%; 4 studies; 634 children/adolescents; Analysis 1.11).
It is important to note, however, that the majority of these meta‐analyses included between one and three studies, and that Analysis 1.1, Analysis 1.6, Analysis 1.7, Analysis 1.8, Analysis 1.9, and Analysis 1.11 had considerable heterogeneity present with I² ranging from 77% to 94%. Only three outcomes included more than three studies: total ADHD symptom score ‐ parent ratings (seven studies; Analysis 1.1; Figure 3), total ADHD symptom score ‐ teacher ratings (five studies; Analysis 1.3; Figure 4), and total ADHD symptom score ‐ investigator/research personnel ratings (four studies; Analysis 1.11).
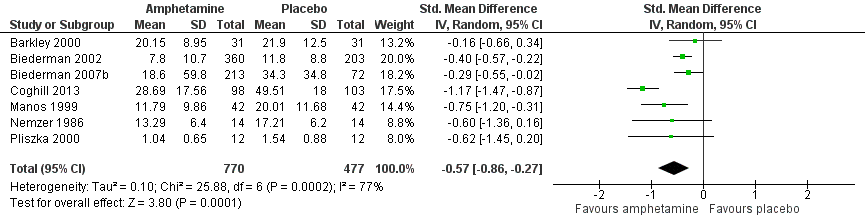
Forest plot of comparison: 1 Amphetamines versus placebo, outcome: 1.1 Total ADHD symptom score ‐ parent ratings.

Forest plot of comparison: 1 Amphetamines versus placebo, outcome: 1.3 Total ADHD symptom score ‐ teacher ratings.
Secondary outcomes
We conducted meta‐analyses that compared amphetamines versus placebo on five of our six secondary outcomes (see Analysis 1.12; Analysis 1.13; Analysis 1.14; Analysis 1.15; Analysis 1.16).
Clinical improvement
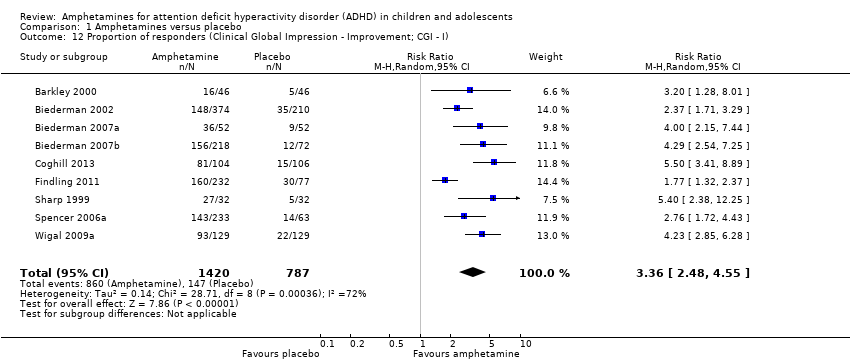
The proportion of responders was higher in the amphetamine group (RR 3.36; 95% CI 2.48 to 4.55; Tau² = 0.14; I² = 72%; 9 studies; 2207 children/adolescents; Analysis 1.12)
Clinical severity
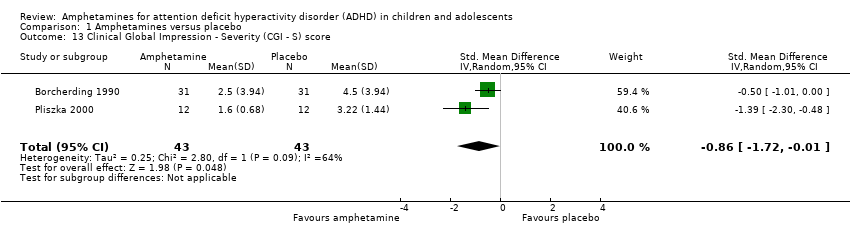
We found evidence of a significant difference between the two groups on the CGI‐S (Guy 1976), in favour of amphetamine (SMD ‐0.86; 95% CI ‐1.72 to ‐0.01; Tau² = 0.25; I² = 64%; 2 studies; 86 children/adolescents; Analysis 1.13).
Academic performance
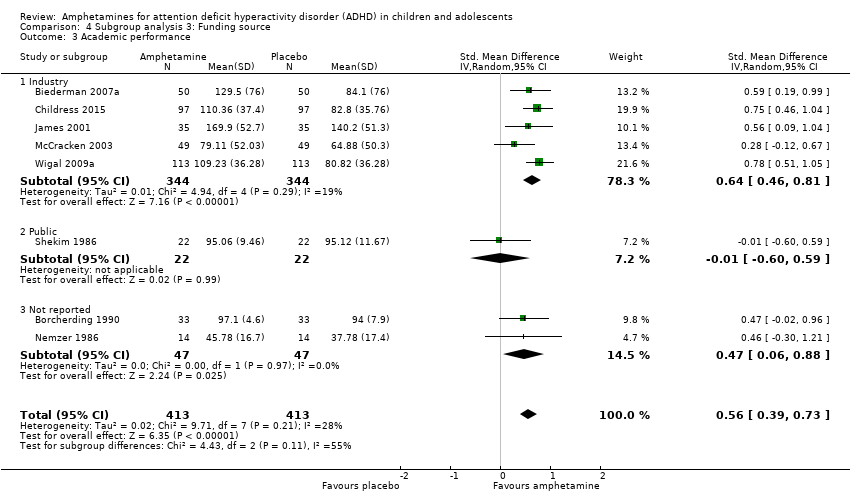
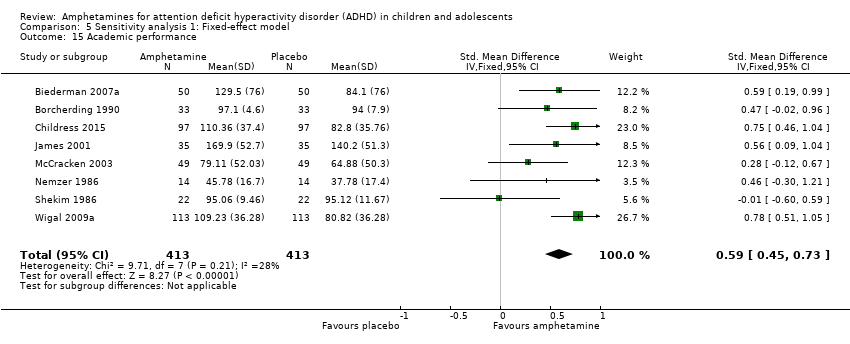
We found evidence that amphetamines may improve academic performance as compared to placebo (SMD 0.56; 95% CI 0.39 to 0.73; Tau² = 0.02; I² = 28%; 8 studies; 826 children/adolescents; Analysis 1.14).
Quality of life
As shown in the illustrative forest plot, the one study that provided data on quality of life (Findling 2011), found no difference between the two groups (SMD ‐0.01; 95% CI ‐0.27 to 0.25; 309 children/adolescents; see Analysis 1.15).
Retention
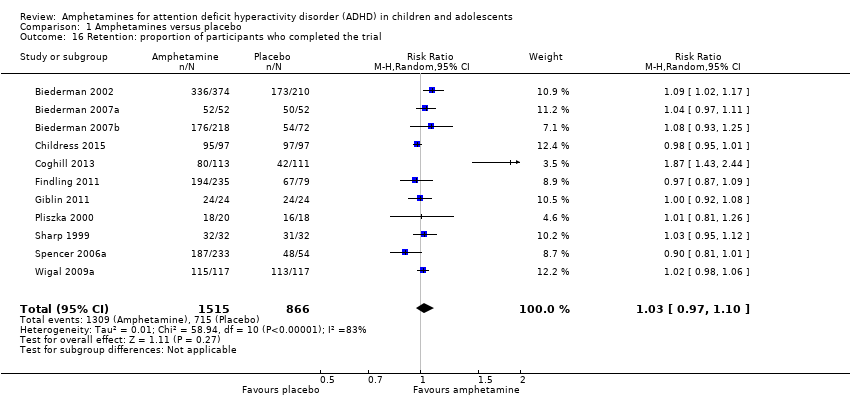
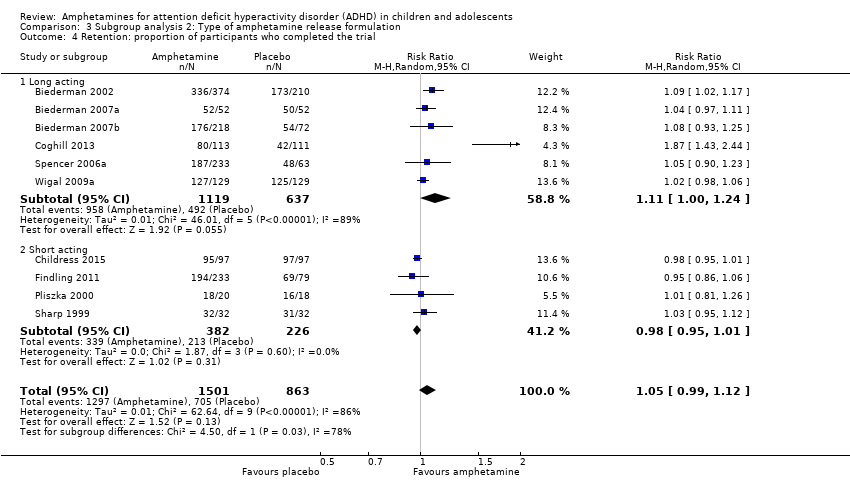
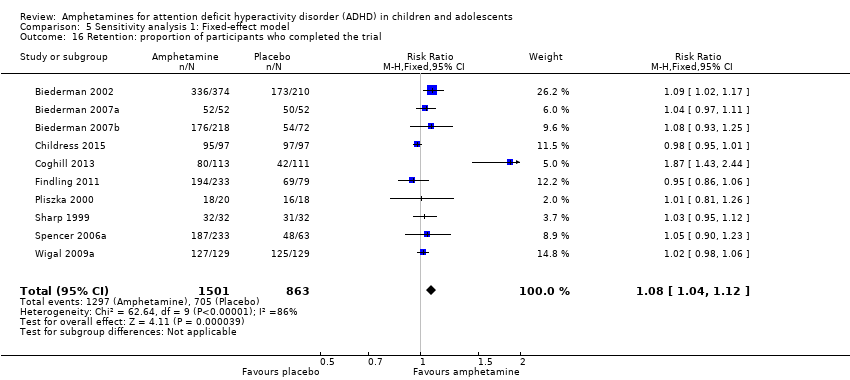
There was no difference between those given amphetamine and those given placebo for retention (RR 1.03; 95% CI 0.97 to 1.10; Tau² = 0.01; I² = 83%; 11 studies; 2381 children/adolescents; Analysis 1.16).
Adverse events
Proportion of adverse events
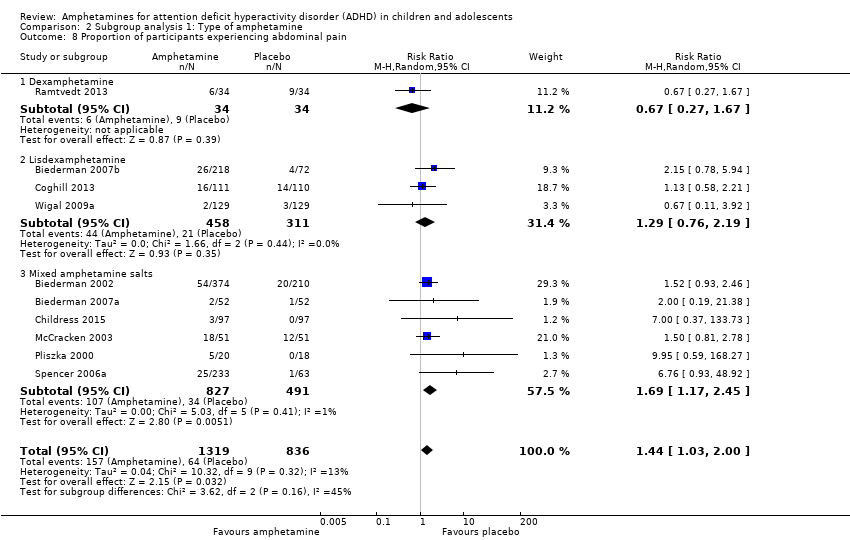
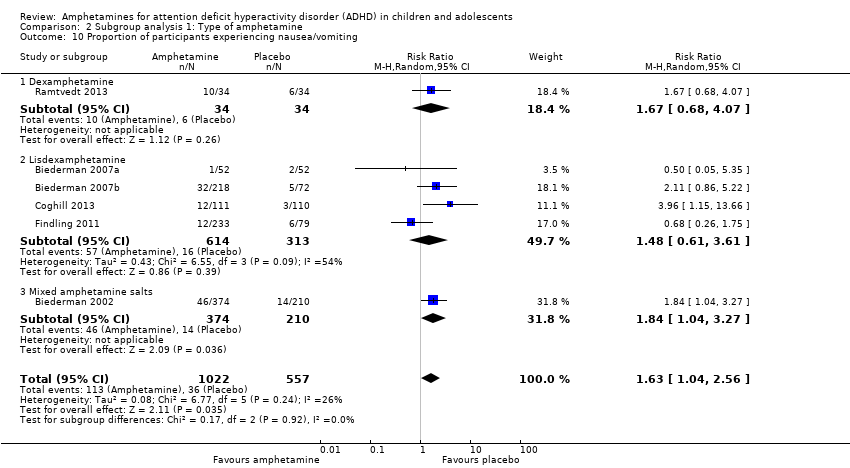
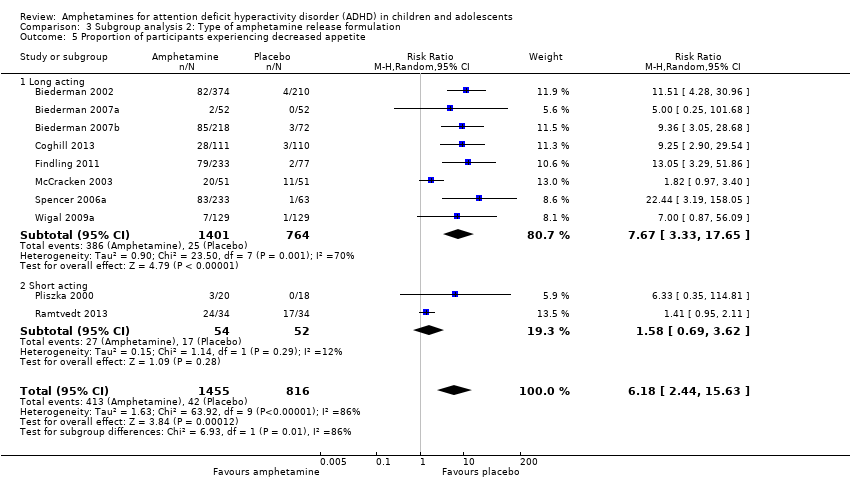
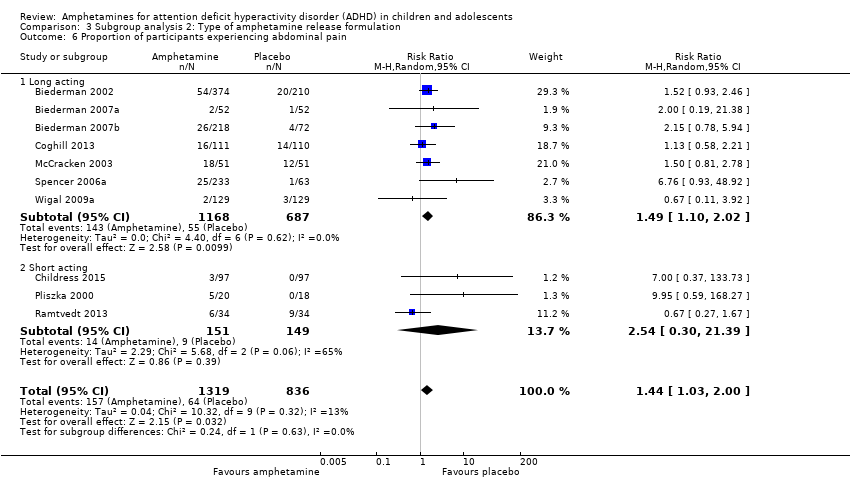
We performed a series of meta‐analyses of the most commonly reported adverse events. A higher proportion of children and adolescents in the amphetamine group as compared to placebo group experienced decreased appetite (RR 6.31; 95% CI 2.58 to 15.46; Tau² = 1.59; I² = 85%; 11 studies; 2467 children/adolescents; Analysis 1.17); insomnia/trouble sleeping (RR 3.80; 95% CI 2.12 to 6.83; Tau² = 0.42; I² = 59%; 10 studies; 2429 children/adolescents; Analysis 1.18); abdominal pain (RR 1.44; 95% CI 1.03 to 2.00; Tau² = 0.04; I² = 13%; 10 studies; 2155 children/adolescents; Analysis 1.19); and nausea/vomiting (RR 1.63; 95% CI 1.04 to 2.56; Tau² = 0.08; I² = 26%; 6 studies; 1579 children/adolescents; Analysis 1.20). There were no differences between the amphetamine and placebo groups in the proportion of children and adolescents who experienced headaches (RR 0.93; 95% CI 0.75 to 1.16; Tau² = 0.00; I² = 0%; 9 studies; 2091 children/adolescents; Analysis 1.21) and anxiety/nervousness (RR 1.22; 95% CI 0.78 to 1.93; Tau² = 0.09; I² = 32%; 5 studies; 1088 children/adolescents; Analysis 1.22).
Proportion of participants who experienced at least one adverse event
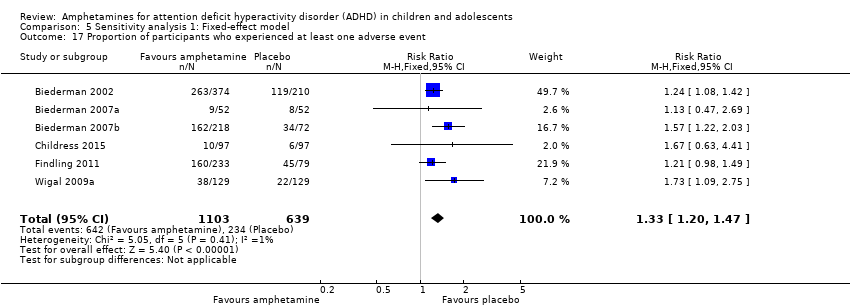
The proportion of children and adolescents who experienced at least one adverse event was higher in the amphetamine group as compared to the placebo group (RR 1.30; 95% CI 1.18 to 1.44; Tau² = 0.00; I² = 1%; 6 studies; 1742 children/adolescents; see Analysis 1.23; Figure 5).

Forest plot of comparison: 1 Amphetamines versus placebo, outcome: 1.23 Proportion of participants who experienced at least one adverse event.
Proportion of participants who withdrew due to any adverse event
There was no difference between the amphetamine and placebo groups in the proportion of children and adolescents who withdrew due to an adverse event (RR 1.60; 95% CI 0.86 to 2.98; Tau² = 0.00; I² = 0%; 9 studies; 2160 children/adolescents; Analysis 1.24).
Subgroup analyses
Type of amphetamine
We conducted a series of subgroup analyses according to type of amphetamine (dexamphetamine, lisdexamphetamine, and mixed amphetamine salts). Mixed amphetamine salts were associated with improved parent ratings of total ADHD symptoms as compared to dexamphetamine and lisdexamphetamine, however, there appeared to be no between‐group differences (Chi² = 0.55, P value = 0.76; Analysis 2.1). Only one subgroup yielded between‐group differences (Chi² = 26.06, P < 0.00001; Analysis 2.6; Figure 6). There were no between‐group differences for any of the other outcomes.

Forest plot of comparison: 2 Subgroup analysis 1: Type of amphetamine, outcome: 2.6 Proportion of participants experiencing decreased appetite.
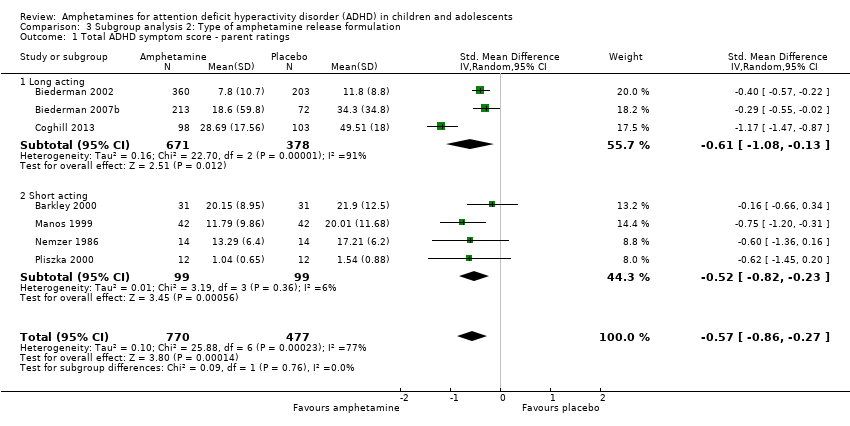
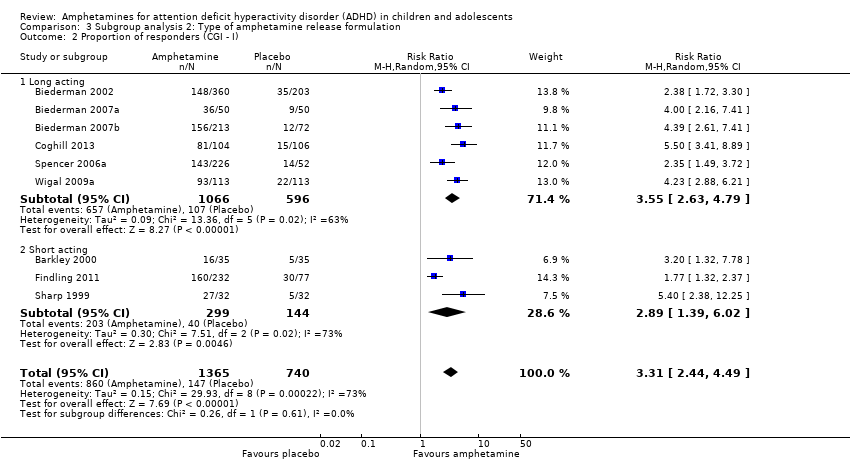
Type of amphetamine release formulation
We conducted a subgroup analysis to explore the influence of long‐acting versus short‐acting amphetamine release formulations (Analysis 3.1 to Analysis 3.6). Both rentention: proportion of participants who completed the trial (Chi² = 4.50, P value = 0.03; Analysis 3.4) and proportion of participants experiencing decreased appetite (Chi² = 6.93, P value = 0.008; Analysis 3.5) yielded between‐group differences.
Funding source
We wanted to explore the influence of industry‐funded versus publicly‐funded sources (Analysis 4.1 to Analysis 4.3). Since five studies did not report their source of funding, we introduced another subgroup, 'not reported'. No between‐group differences were found.
Sensitivity analysis
We repeated the analyses by changing the statistical model from a random‐effects model to a fixed‐effect model. The results were similar (see Analysis 5.1 to Analysis 5.24).
Discusión
Resumen de los resultados principales
Se incluyeron 23 estudios en esta revisión, 19 de las cuales se incluyeron en metanálisis. En general, esta revisión encontró que las anfetaminas fueron más eficaces que placebo para reducir la gravedad de los síntomas centrales del TDAH a corto plazo; sin embargo, no influyeron en la retención en el ensayo y se asociaron con algunos eventos adversos. Según puntos de corte convencionales (Cohen 1988), los tamaños más grandes del efecto observados (es decir, una DME > 0,8) fueron las calificaciones de los maestros de hiperactividad / impulsividad, las calificaciones de los maestros de la desatención y las calificaciones de los médicos de los síntomas totales del TDAH. Los metanálisis con más datos disponibles incluyeron las calificaciones de padres y maestros de los síntomas totales del TDAH, y ambas produjeron tamaños del efecto de bajo a moderado.
La duración mediana de los estudios fue solamente 28 días, por lo que no fue posible evaluar la eficacia y la seguridad a largo plazo de las anfetaminas para el TDAH pediátrico. Lo anterior es particularmente problemático en una afección como el TDAH que puede requerir tratamiento por años.
Hubo mucha variación en los derivados de la anfetamina y las formulaciones de liberación utilizadas en los estudios incluidos. Por lo tanto, se realizaron análisis de subgrupos para explorar las diferencias. Se encontraron diferencias mínimas entre los grupos; sin embargo, las conclusiones no se deben basar en estos análisis ya que provienen de comparaciones observacionales y no aleatorias. Además, debido a que la mayoría de los estudios evaluó las sales mixtas de anfetamina y las formulaciones de liberación de acción prolongada, los subgrupos que evaluaron otros derivados de la anfetamina (es decir, lisdexamfetamina, dexamfetamina) y formulaciones de liberación de acción corta, pueden no haber tenido un poder estadístico suficiente para detectar una diferencia verdadera.
Se realizó un metanálisis de los eventos adversos informados con más frecuencia en los estudios primarios. Estos incluyeron reducción del apetito, insomnio / dificultad para dormir, dolor abdominal, náuseas / vómitos, cefaleas y ansiedad. El metanálisis mostró que la mayoría de los eventos adversos ocurrió más a menudo en los grupos de anfetamina que en los grupos placebo.
Compleción y aplicabilidad general de las pruebas
Esta revisión se centró solamente en la comparación de anfetamina versus placebo. Aunque es importante evaluar las anfetaminas versus otros tratamientos activos como otros estimulantes, psicoterapia o antidepresivos, se considera que es importante establecer primero si las anfetaminas son superiores a placebo. No fue posible evaluar la eficacia a largo plazo de las anfetaminas (es decir, más allá de los 12 meses de administración). La duración promedio de los estudios incluidos fue cinco semanas, con la exclusión de un estudio a largo plazo que fue de 12 meses(Gillberg 1997). Los ensayos a corto plazo son particularmente problemáticos para las afecciones crónicas como el TDAH, ya que es probable que los niños reciban fármacos estimulantes durante períodos mucho más prolongados que los estudiados. Como se menciona antes, los eventos adversos ocurrieron con mayor frecuencia cuando los niños y adolescentes fueron tratados con anfetaminas que cuando fueron tratados con placebo; sin embargo, es importante señalar el informe deficiente alrededor de los eventos adversos en los estudios incluidos. Algunos estudios solamente informaron los eventos adversos que experimentó cierto porcentaje de niños y adolescentes, lo que posiblemente pasa por alto eventos adversos adicionales experimentados por menos que esa fracción. Además, en muchos estudios no estuvieron claros los métodos para obtener los eventos adversos ni si se evaluó la causalidad de estos eventos adversos como relacionada con las intervenciones. La heterogeneidad de los términos utilizados para describir los eventos adversos también fue un obstáculo importante cuando se realizó esta revisión, y limitó la capacidad de sintetizar apropiadamente los datos. Finalmente, del mismo modo que con los datos de eficacia, no fue posible evaluar el perfil de seguridad a largo plazo de las anfetaminas debido a la falta de ensayos a largo plazo.
Solamente un estudio exploró la repercusión de las anfetaminas sobre la calidad de vida de los niños y adolescentes (Findling 2011). No encontró efectos, aunque se puede deber a que el estudio tuvo escaso poder estadístico. Esta es una brecha significativa en las pruebas disponibles sobre los efectos de las anfetaminas y los estudios deben poner énfasis en factores psicosociales como el estrés paterno o la calidad de vida.
La validez externa de los resultados se ve limitada por los criterios de inclusión / exclusión de los estudios incluidos. Debido a que se excluyeron los estudios con niños y adolescentes con comorbilidades diferentes del trastorno de conducta, el trastorno de oposición desafiante y la ansiedad, no es posible extrapolar los resultados de esta revisión a los pacientes con otras comorbilidades que ocurren habitualmente como la depresión y el trastorno de tic.
Pocos ensayos informaron sobre el subtipo de TDAH de los niños y adolescentes incluidos. Por lo tanto, no es posible establecer ninguna conclusión con respecto a la posible heterogeneidad del efecto de diferentes formulaciones de anfetaminas entre diferentes subtipos de TDAH. Además, como los estudios primarios no subagruparon sus resultados según factores pronósticos importantes como la edad y el sexo, no fue posible subagrupar los metanálisis, lo que habría sido particularmente relevante para los médicos.
Aunque esta revisión evaluó la proporción de niños y adolescentes que abandonó debido a un evento adverso y no encontró diferencias entre los grupos de anfetamina y placebo (Análisis 1.24), vale la pena observar que muchos estudios en el metanálisis tuvieron eventos cero en el grupo placebo, lo que provoca resultados potencialmente no válidos que sobrestiman la varianza. El número alto de eventos cero se puede atribuir a una falta de poder estadístico para detectar estos eventos debido a los tamaños de la muestra mucho más pequeños de los de los grupos placebo (n = 900) en comparación con los grupos de anfetamina (n = 1532).
Finalmente, fue difícil evaluar con exactitud los resultados de una manera clínicamente significativa ya que la interpretación de las puntuaciones depende del sexo y de la edad.
Calidad de la evidencia
La calidad general de las pruebas varió de baja a muy baja cuando se evaluó según el enfoque GRADE, lo que indica que hay lugar para la mejoría entre las pruebas actuales acerca de la eficacia de las anfetaminas en el tratamiento del TDAH en los niños y adolescentes. Los estudios parecen tener muchos problemas metodológicos que dificultan establecer conclusiones clínicas sólidas. Además, la mayoría de los estudios no logró informar sobre cómo se generó la secuencia aleatoria (90%), cómo se ocultó la asignación (85%), los métodos utilizados para cegar a los participantes y al personal (55%) y los métodos utilizados para cegar a los evaluadores de resultado (90%). Por lo tanto, no fue posible determinar si fue un problema de informe o un problema metodológico.
Sesgos potenciales en el proceso de revisión
Las limitaciones de esta revisión incluyen que no se consideró la correlación en los estudios cruzados debido a la fórmula para calcular la DME, lo que produce tamaños del efecto menos precisos y puede provocar que se pase por alto cualquier posible heterogeneidad estadística entre los estudios. Además, se justifica la cautela al interpretar los metanálisis de los eventos adversos que contienen eventos poco frecuentes. La mayoría de los métodos de metanálisis, incluido el enfoque elegido de Mantel‐Haenszel, funcionan deficientemente con los eventos poco frecuentes; pueden producir resultados erróneos, tener IC muy amplios o el poder estadístico puede ser demasiado escaso para detectar una diferencia.
Debido al número pequeño de estudios incluidos en los metanálisis primarios (máximo siete estudios), se considera que un gráfico en embudo (funnel plot) no proporcionaría información significativa acerca del posible sesgo de publicación, lo que puede haber provocado una sobrestimación de los efectos del tratamiento. Además, la exclusión de un estudio potencialmente elegible en un idioma diferente del inglés también puede haber sesgado los resultados. Egger 1997 encontró que los estudios en un idioma diferente del inglés tienden a ser negativos, por lo que excluirlo puede haber producido una sobrestimación de los efectos del tratamiento. Por otro lado, otros investigadores han encontrado que la exclusión de los ensayos informados en idiomas diferentes del inglés no afectan significativamente los resultados de un metanálisis (Moher 2003).
Otra limitación surge de las comparaciones de subgrupos. Se debe observar que estos análisis se basan en comparaciones observacionales y no aleatorias, por lo que no se deben interpretar como pruebas definitivas.
Otro posible sesgo de esta revisión es que uno de los autores, la Dra. Catherine J Nikles, ha publicado un estudio sobre las anfetaminas para el TDAH; sin embargo, dos autores independientes evaluaron la elegibilidad de este estudio, que posteriormente se excluyó debido a la naturaleza del diseño(Nikles 2006).
Acuerdos y desacuerdos con otros estudios o revisiones
Se identificaron dos revisiones sistemáticas realizadas previamente a esta revisión (Charach 2011; Miller 1999). Charach 2011 solamente evaluó la eficacia y la seguridad a largo plazo (es decir, más de 12 meses) de las anfetaminas para el TDAH pediátrico e incluyó solamente un ECA que evaluó anfetaminas versus placebo, que también se incluyó en la presente revisión sistemática (Gillberg 1997). Miller 1999 también evaluó sistemáticamente las anfetaminas para el TDAH pediátrico; sin embargo, los revisores solamente incluyeron estudios que evaluaron el derivado de las anfetaminas dexamfetamina. Además, esta revisión se publicó en 1999, por lo que tiene más de 14 años de antigüedad. Como tal, Miller 1999 incluyó solamente tres ECA relevantes en su revisión, que también se incluyeron en esta revisión(Borcherding 1990; Donnelly 1989; Gillberg 1997). En su mayoría los metanálisis realizados en la revisiónMiller 1999 incluyeron ECA que evaluaron cualquier medicación estimulante (metilfenidato o anfetamina) versus placebo. El único metanálisis que se limitó a la comparación anfetamina versus placebo mostró que las anfetaminas mejoran los síntomas totales del TDAH evaluados con la Abbreviated Conners Teacher Rating Scale (ATRS; Conners 1990): DM ‐4,77; IC del 95%: ‐6,43 a ‐2,99. Lo anterior es consistente con los resultados de esta revisión para este resultado, que también mostró mejoría a favor de la anfetamina (DME ‐0,55; IC del 95%: ‐0,83 a ‐0,27).

Study flow diagram
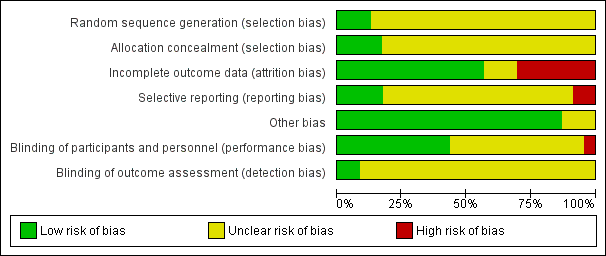
Risk of bias graph: review authors' judgements about each risk of bias item presented as percentages across all included studies.

Forest plot of comparison: 1 Amphetamines versus placebo, outcome: 1.1 Total ADHD symptom score ‐ parent ratings.

Forest plot of comparison: 1 Amphetamines versus placebo, outcome: 1.3 Total ADHD symptom score ‐ teacher ratings.

Forest plot of comparison: 1 Amphetamines versus placebo, outcome: 1.23 Proportion of participants who experienced at least one adverse event.
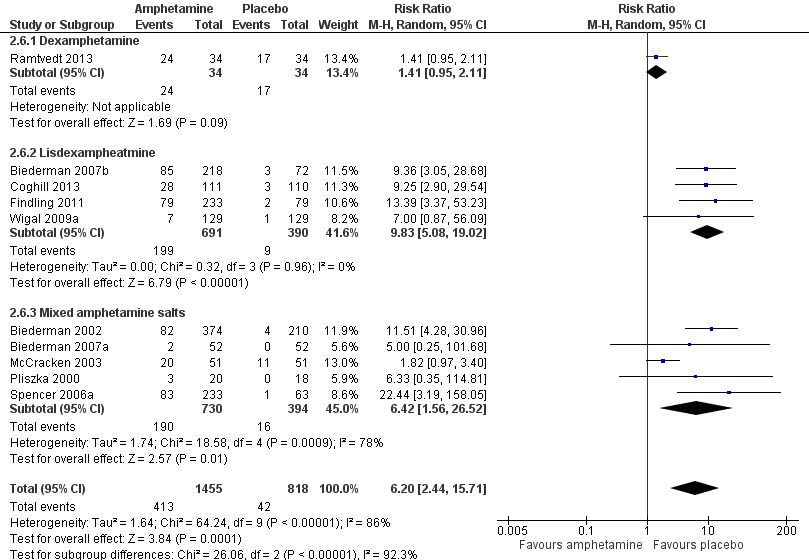
Forest plot of comparison: 2 Subgroup analysis 1: Type of amphetamine, outcome: 2.6 Proportion of participants experiencing decreased appetite.
Comparison 1 Amphetamines versus placebo, Outcome 1 Total ADHD symptom score ‐ parent ratings.

Comparison 1 Amphetamines versus placebo, Outcome 2 Hyperactivity/impulsivity ‐ parent ratings.

Comparison 1 Amphetamines versus placebo, Outcome 3 Total ADHD symptom score ‐ teacher ratings.

Comparison 1 Amphetamines versus placebo, Outcome 4 Hyperactivity/impulsivity ‐ teacher ratings.

Comparison 1 Amphetamines versus placebo, Outcome 5 Inattention ‐ teacher ratings.

Comparison 1 Amphetamines versus placebo, Outcome 6 Total ADHD symptom score ‐ clinician ratings.

Comparison 1 Amphetamines versus placebo, Outcome 7 Hyperactivity/impulsivity ‐ clinician ratings.

Comparison 1 Amphetamines versus placebo, Outcome 8 Inattention ‐ clinician ratings.

Comparison 1 Amphetamines versus placebo, Outcome 9 Total ADHD symptom score ‐ investigator/research personnel ratings.

Comparison 1 Amphetamines versus placebo, Outcome 10 Hyperactivity/impulsivity ‐ investigator/research personnel ratings.
Comparison 1 Amphetamines versus placebo, Outcome 11 Inattention ‐ investigator/research personnel ratings.
Comparison 1 Amphetamines versus placebo, Outcome 12 Proportion of responders (Clinical Global Impression ‐ Improvement; CGI ‐ I).
Comparison 1 Amphetamines versus placebo, Outcome 13 Clinical Global Impression ‐ Severity (CGI ‐ S) score.

Comparison 1 Amphetamines versus placebo, Outcome 14 Academic performance.

Comparison 1 Amphetamines versus placebo, Outcome 15 Quality of life.
Comparison 1 Amphetamines versus placebo, Outcome 16 Retention: proportion of participants who completed the trial.
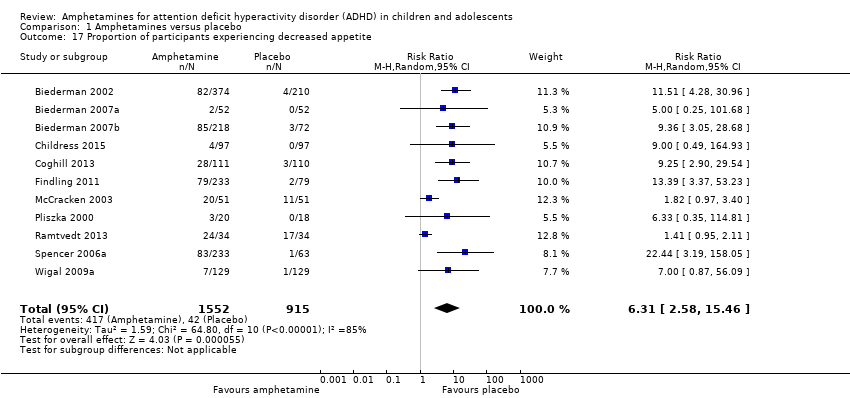
Comparison 1 Amphetamines versus placebo, Outcome 17 Proportion of participants experiencing decreased appetite.

Comparison 1 Amphetamines versus placebo, Outcome 18 Proportion of participants experiencing insomnia/trouble sleeping.
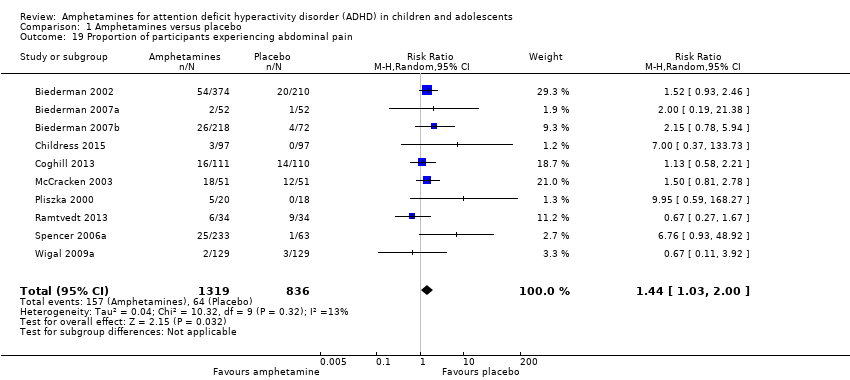
Comparison 1 Amphetamines versus placebo, Outcome 19 Proportion of participants experiencing abdominal pain.

Comparison 1 Amphetamines versus placebo, Outcome 20 Proportion of participants experiencing nausea/vomiting.

Comparison 1 Amphetamines versus placebo, Outcome 21 Proportion of participants experiencing headaches.

Comparison 1 Amphetamines versus placebo, Outcome 22 Proportion of participants experiencing anxiety/nervousness.

Comparison 1 Amphetamines versus placebo, Outcome 23 Proportion of participants who experienced at least one adverse event.

Comparison 1 Amphetamines versus placebo, Outcome 24 Proportion of participants who dropped out/withdrew due to an adverse event.

Comparison 2 Subgroup analysis 1: Type of amphetamine, Outcome 1 Total ADHD symptom score ‐ parent ratings.

Comparison 2 Subgroup analysis 1: Type of amphetamine, Outcome 2 Proportion of responders (CGI ‐ I).

Comparison 2 Subgroup analysis 1: Type of amphetamine, Outcome 3 Academic performance.
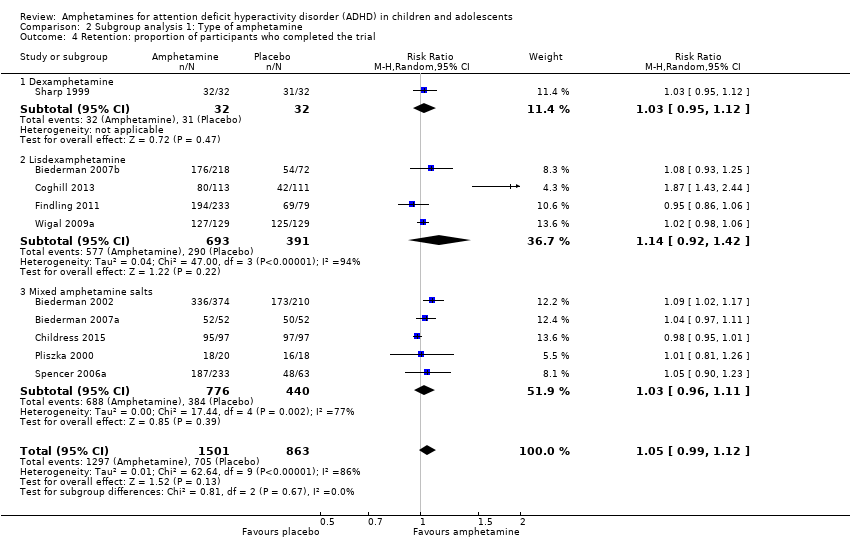
Comparison 2 Subgroup analysis 1: Type of amphetamine, Outcome 4 Retention: proportion of participants who completed the trial.
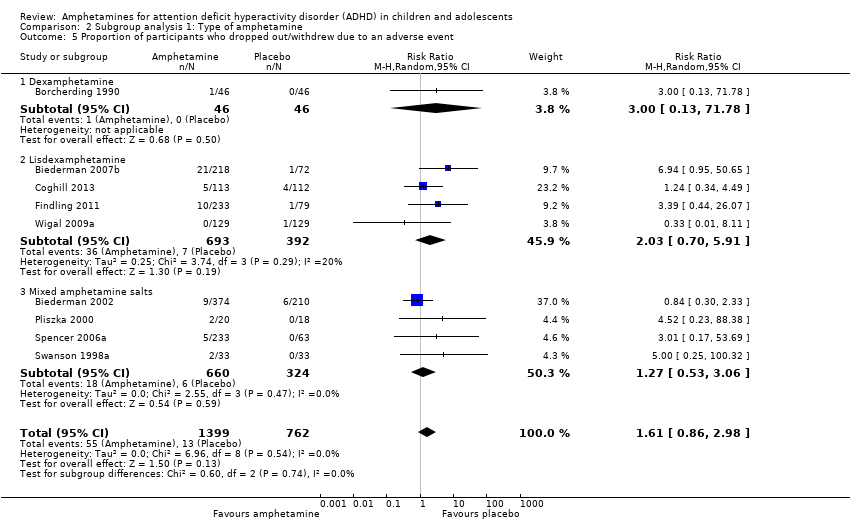
Comparison 2 Subgroup analysis 1: Type of amphetamine, Outcome 5 Proportion of participants who dropped out/withdrew due to an adverse event.

Comparison 2 Subgroup analysis 1: Type of amphetamine, Outcome 6 Proportion of participants experiencing decreased appetite.

Comparison 2 Subgroup analysis 1: Type of amphetamine, Outcome 7 Proportion of participants experiencing insomnia/trouble sleeping.
Comparison 2 Subgroup analysis 1: Type of amphetamine, Outcome 8 Proportion of participants experiencing abdominal pain.

Comparison 2 Subgroup analysis 1: Type of amphetamine, Outcome 9 Proportion of participants experiencing headaches.
Comparison 2 Subgroup analysis 1: Type of amphetamine, Outcome 10 Proportion of participants experiencing nausea/vomiting.
Comparison 3 Subgroup analysis 2: Type of amphetamine release formulation, Outcome 1 Total ADHD symptom score ‐ parent ratings.
Comparison 3 Subgroup analysis 2: Type of amphetamine release formulation, Outcome 2 Proportion of responders (CGI ‐ I).

Comparison 3 Subgroup analysis 2: Type of amphetamine release formulation, Outcome 3 Academic performance.
Comparison 3 Subgroup analysis 2: Type of amphetamine release formulation, Outcome 4 Retention: proportion of participants who completed the trial.
Comparison 3 Subgroup analysis 2: Type of amphetamine release formulation, Outcome 5 Proportion of participants experiencing decreased appetite.
Comparison 3 Subgroup analysis 2: Type of amphetamine release formulation, Outcome 6 Proportion of participants experiencing abdominal pain.
Comparison 4 Subgroup analysis 3: Funding source, Outcome 1 Total ADHD symptom score ‐ parent ratings.

Comparison 4 Subgroup analysis 3: Funding source, Outcome 2 Proportion of responders (CGI ‐ I).
Comparison 4 Subgroup analysis 3: Funding source, Outcome 3 Academic performance.

Comparison 5 Sensitivity analysis 1: Fixed‐effect model, Outcome 1 Total ADHD symptom score ‐ parent ratings.
Comparison 5 Sensitivity analysis 1: Fixed‐effect model, Outcome 2 Hyperactivity/impulsivity ‐ parent ratings.
Comparison 5 Sensitivity analysis 1: Fixed‐effect model, Outcome 3 Total ADHD symptom score ‐ teacher ratings.

Comparison 5 Sensitivity analysis 1: Fixed‐effect model, Outcome 4 Hyperactivity/impulsivity ‐ teacher ratings.

Comparison 5 Sensitivity analysis 1: Fixed‐effect model, Outcome 5 Inattention ‐ teacher ratings.
Comparison 5 Sensitivity analysis 1: Fixed‐effect model, Outcome 6 Total ADHD symptom score ‐ clinician ratings.
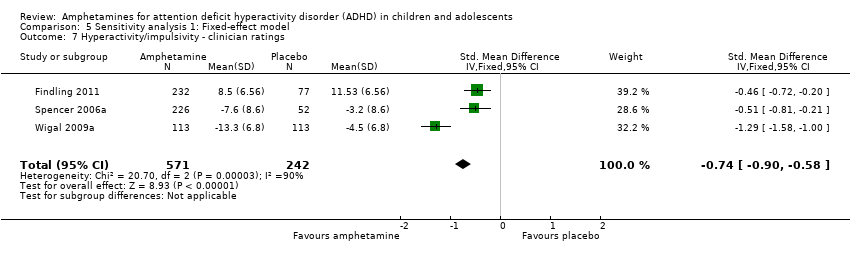
Comparison 5 Sensitivity analysis 1: Fixed‐effect model, Outcome 7 Hyperactivity/impulsivity ‐ clinician ratings.

Comparison 5 Sensitivity analysis 1: Fixed‐effect model, Outcome 8 Inattention ‐ clinician ratings.

Comparison 5 Sensitivity analysis 1: Fixed‐effect model, Outcome 9 Total ADHD symptom score ‐ investigator/research personnel ratings.

Comparison 5 Sensitivity analysis 1: Fixed‐effect model, Outcome 10 Hyperactivity/impulsivity ‐ Investigator/research personnel ratings.
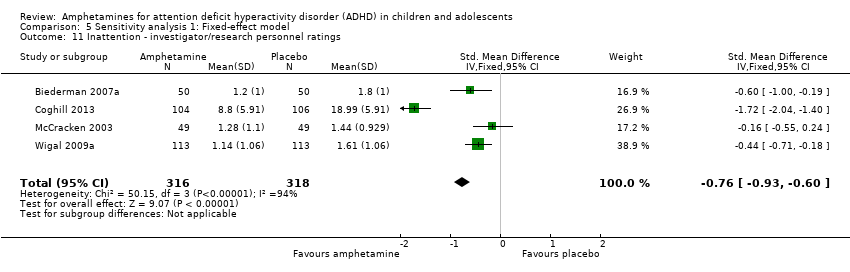
Comparison 5 Sensitivity analysis 1: Fixed‐effect model, Outcome 11 Inattention ‐ investigator/research personnel ratings.
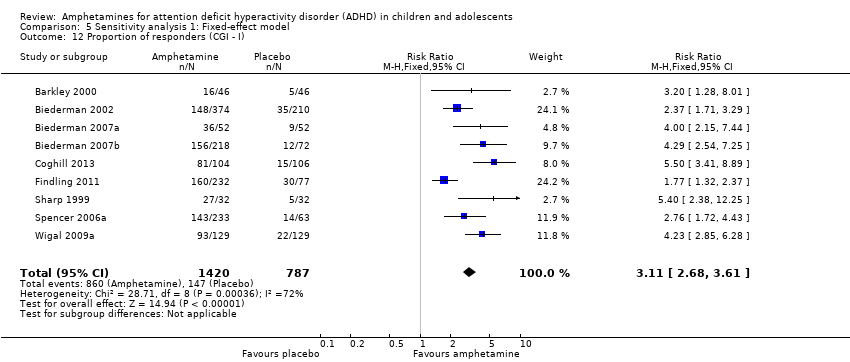
Comparison 5 Sensitivity analysis 1: Fixed‐effect model, Outcome 12 Proportion of responders (CGI ‐ I).
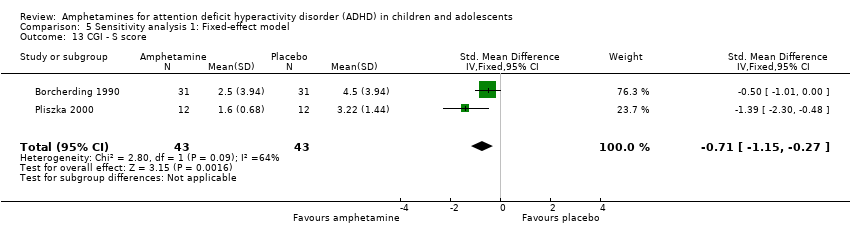
Comparison 5 Sensitivity analysis 1: Fixed‐effect model, Outcome 13 CGI ‐ S score.

Comparison 5 Sensitivity analysis 1: Fixed‐effect model, Outcome 14 Quality of life.
Comparison 5 Sensitivity analysis 1: Fixed‐effect model, Outcome 15 Academic performance.
Comparison 5 Sensitivity analysis 1: Fixed‐effect model, Outcome 16 Retention: proportion of participants who completed the trial.
Comparison 5 Sensitivity analysis 1: Fixed‐effect model, Outcome 17 Proportion of participants who experienced at least one adverse event.

Comparison 5 Sensitivity analysis 1: Fixed‐effect model, Outcome 18 Proportion of participants who dropped out/withdrew due to an adverse event.

Comparison 5 Sensitivity analysis 1: Fixed‐effect model, Outcome 19 Proportion of participants experiencing decreased appetite.

Comparison 5 Sensitivity analysis 1: Fixed‐effect model, Outcome 20 Proportion of participants experiencing insomnia/trouble sleeping.

Comparison 5 Sensitivity analysis 1: Fixed‐effect model, Outcome 21 Proportion of participants experiencing abdominal pain.

Comparison 5 Sensitivity analysis 1: Fixed‐effect model, Outcome 22 Proportion of participants experiencing headaches.

Comparison 5 Sensitivity analysis 1: Fixed‐effect model, Outcome 23 Proportion of participants experiencing anxiety/nervousness.

Comparison 5 Sensitivity analysis 1: Fixed‐effect model, Outcome 24 Proportion of participants experiencing nausea/vomiting.
| Amphetamines compared with placebo for attention deficit hyperactivity disorder in children and adolescents | ||||||
| Patient or population: children or adolescents with ADHD Settings: Beligum, France, Germany, Hungary, Italy, Netherlands, Norway, Poland, Spain, Sweden, United Kingdom, United States Intervention: amphetamines (i.e. dexamphetamine, lisdexamphetamine, mixed amphetamine salts) Comparison: placebo | ||||||
| Outcomes | Illustrative comparative risks* (95% CI) | Relative effect | Number of participants | Quality of the evidence | Comments | |
| Assumed risk | Corresponding risk | |||||
| Placebo | Amphetamine | |||||
| Total ADHD symptom score ‐ parent ratings (ADHD Rating Scale, Fourth Version; Conners' Rating Scale; Conners' Global Index; Conners' Abbreviated Symptom Questionnaire) | ‐ | The mean total score in the intervention groups was 0.57 standard deviations lower (‐0.86 to ‐0.27) | SMD ‐0.57 (‐0.86 to ‐0.27) | 1247 | ⊕⊝⊝⊝ | Moderate effect** |
| Total ADHD symptom score ‐ teacher ratings (ADHD Rating Scale, Fourth Version; Conners' Rating Scale; Conners' Global Index; Conners' Abbreviated Symptom Questionnaire) Follow‐up: 7 to 35 days | ‐ | The mean total score in the intervention groups was 0.55 standard deviations lower (‐0.83 to ‐0.27) | SMD ‐0.55 (‐0.83 to ‐0.27) | 745 | ⊕⊕⊝⊝ | Moderate effect** |
| Total ADHD symptom score ‐ clinician ratings (ADHD Rating Scale, Fourth Version) | ‐ | The mean total score in the intervention groups was 0.84 standard deviations lower (‐1.32 to ‐0.36) | SMD ‐0.84 (‐1.32 to ‐0.36) | 813 | ⊕⊝⊝⊝ | Large effect** |
| Proportion of responders (Clinical Global Impressions ‐ Improvement (CGI‐I) scale) | 187 per 1000 | 605 per 1000 | RR 3.36 (2.48 to 4.55) | 2207 | ⊝⊝⊝⊝ | ‐ |
| Academic performance (Permanent Product Measure of Performance; Wechsler Intelligence Scale for Children ‐ Revised; Barnell Lot, Ltd Math Test; Wide Range Achievement Test) Follow‐up: 7 to 21 days | ‐ | The mean score in the intervention groups was 0.51 standard deviations higher (0.31 to 0.70) | SMD 0.56 (0.39 to 0.73) | 826 | ⊕⊕⊝⊝ | Moderate effect** |
| Retention: proportion of participants who completed the trial | 825 per 1000 | 864 per 1000 | RR 1.03 | 2381 | ⊕⊝⊝⊝ | ‐ |
| Proportion of participants who experienced at least 1 adverse event | 366 per 1000 | 582 per 1000 | RR 1.30 (1.18 to 1.44) | 1742 | ⊕⊕⊝⊝ | ‐ |
| *The basis for the assumed risk (e.g. the median control group risk across studies) is provided in the footnotes. The corresponding risk (and its 95% CI) is based on the assumed risk in the comparison group and the relative effect of the intervention (and its 95% CI). ADHD: Attention deficit hyperactivity disorder; CI: Confidence interval; GRADE: Grades of recommendation, assessment, development and evaluation; RR: Risk ratio; SMD: Standardized mean difference | ||||||
| GRADE Working Group grades of evidence | ||||||
| 1Downgraded one level due to the majority of studies included in this outcome having a high risk of bias. | ||||||
| Types of outcome measures | Primary outcomes Multiple perspectives (i.e. teacher, parent, clinician) are considered the gold standard when assessing the core symptoms of ADHD. As such, we will not favor one perspective over another. In the event that reports do not agree with one another, for example, teacher reports disagree with parent reports on the improvement of core symptoms, this may be quite telling about how a child’s environment impacts their ADHD given the varying demands between a school environment and home environment. This will be interpreted accordingly in the discussion. Secondary outcomes We will assess 'parental stress' as a secondary outcome. |
| Measures of treatment effect | Dichotomous outcome data When a single study has utilized more than one measure to assess the same construct (e.g. ADHD core symptoms as assessed by teacher‐rated ADHD‐RS‐IV and teacher ratings of the Conners’ ADHD Rating Scale), treatment effects will be averaged across outcome measures in order to arrive at a single treatment effect for use in the meta‐analysis. Continuous outcome data For continuous outcomes, where the same rating scale has been used for all studies, we will calculate mean differences. |
| Unit of analysis issues | Cross‐over trials For meta‐analyses that use that use a mean difference, we will compute standard deviations for the cross‐over trials taking into account correlation. If correlation coefficients are not available, we will impute them from other studies or use 0.5 as a conservative estimate (Follman 1992). For cross‐over trials where carry‐over is thought to be a problem, where no washout period is present, or when only data from the first period are available, we will analyze data from the first period only. Studies with multiple time points In studies where results are presented for several periods of follow‐up, we will analyze each outcome at each point in a separate meta‐analysis with other comparable studies taking measures at a similar time frame post‐randomization. Time frames will reflect short‐term (up to six months), medium‐term (between 6 months and 12 |
| Assessment of reporting biases | For each primary meta‐analysis in which we have identified a sufficient number of studies (n ≥ 10) for inclusion, we will draw funnel plots in order to assess the possibility of publication bias. |
| Subgroup analysis and investigation of heterogeneity | We will conduct the following subgroup analyses.
|
| Sensitivity analysis | We will conduct the following sensitivity analyses.
|
| ADHD: attention deficit hyperactivity disorder. | |
| Outcome | Outcome measure (respondent) | Studies | Measure used in meta‐analysis |
| Inattention | ADHD Rating Scale, Fourth Version (parent ratings) | No (data presented in an unusable format) | |
| ADHD Rating Scale, Fourth Version (clinician ratings) | Yes | ||
| Yes | |||
| Yes | |||
| ADHD Rating Scale, Fourth Version (investigator/research personnel ratings) | Yes | ||
| Conners’ Rating Scale (parent ratings) | Yes | ||
| No (only study that included long‐term data) | |||
| Conners’ Rating Scale (teacher ratings) | No (only study that included long‐term data) | ||
| IOWA Conners’ Rating Scale | Yes | ||
| SKAMP scale (teacher ratings) | No (data not available) | ||
| SKAMP scale (investigator/research personnel ratings) | Yes | ||
| Yes | |||
| Hyperactivity/impulsivity | ADHD Rating Scale, Fourth Version (parent ratings) | No (data presented in an unusable format) | |
| ADHD Rating Scale, Fourth Version (clinician ratings) | Yes | ||
| Yes | |||
| Yes | |||
| ADHD Rating Scale, Fourth Version (investigator/research personnel ratings) | Yes | ||
| Conners’ Rating Scale (parent ratings) | No (only study that included long‐term data) | ||
| Yes | |||
| Conners’ Rating Scale (teacher ratings) | No (only study that included long‐term data) | ||
| Yes | |||
| Total core symptom score | ADHD Rating Scale, Fourth Version (parent ratings) | Yes | |
| Yes | |||
| ADHD Rating Scale, Fourth Version (teacher ratings) | Yes | ||
| ADHD Rating Scale, Fourth Version (clinician ratings) | Yes | ||
| Yes | |||
| Yes | |||
| ADHD Rating Scale, Fourth Version (investigator/research personnel ratings) | Yes | ||
| No (no data available) | |||
| Conners’ Rating Scale (parent ratings) | No (data presented in an unusable format) | ||
| Yes | |||
| No (data not available) | |||
| No (only study that included long‐term data) | |||
| Yes | |||
| No (data not available) | |||
| No (data presented in an unusable format) | |||
| Conners’ Rating Scale (teacher ratings) | No (no data available) | ||
| Yes | |||
| No (only study that included long‐term data) | |||
| Yes | |||
| No (data not available) | |||
| No (data presented in an unusable format) | |||
| Conners’ Global Index (parent ratings) | Yes | ||
| Yes | |||
| Conners’ Global Index (teacher ratings) | Yes | ||
| Conners’ Abbreviated Symptom Questionnaire (parent ratings) | Yes | ||
| Conners’ Abbreviated Symptom Questionnaire (teacher ratings) | Yes | ||
| ADHD Questionnaire (developed within study) (parent ratings) | No (data presented in an unusable format) | ||
| ADHD Questionnaire (developed within study) (teacher ratings) | No (data presented in an unusable format) | ||
| SKAMP scale (investigator/research personnel ratings) | Yes | ||
| ADHD: attention deficit hyperactivity disorder. | |||
| Outcome or subgroup title | No. of studies | No. of participants | Statistical method | Effect size |
| 1 Total ADHD symptom score ‐ parent ratings Show forest plot | 7 | 1247 | Std. Mean Difference (IV, Random, 95% CI) | ‐0.57 [‐0.86, ‐0.27] |
| 2 Hyperactivity/impulsivity ‐ parent ratings Show forest plot | 2 | 132 | Std. Mean Difference (IV, Random, 95% CI) | ‐0.54 [‐0.89, ‐0.19] |
| 3 Total ADHD symptom score ‐ teacher ratings Show forest plot | 5 | 745 | Std. Mean Difference (IV, Random, 95% CI) | ‐0.55 [‐0.83, ‐0.27] |
| 4 Hyperactivity/impulsivity ‐ teacher ratings Show forest plot | 1 | Std. Mean Difference (IV, Random, 95% CI) | Subtotals only | |
| 5 Inattention ‐ teacher ratings Show forest plot | 1 | Std. Mean Difference (IV, Random, 95% CI) | Subtotals only | |
| 6 Total ADHD symptom score ‐ clinician ratings Show forest plot | 3 | 813 | Std. Mean Difference (IV, Random, 95% CI) | ‐0.84 [‐1.32, ‐0.36] |
| 7 Hyperactivity/impulsivity ‐ clinician ratings Show forest plot | 3 | 813 | Std. Mean Difference (IV, Random, 95% CI) | ‐0.75 [‐1.28, ‐0.23] |
| 8 Inattention ‐ clinician ratings Show forest plot | 3 | 813 | Std. Mean Difference (IV, Random, 95% CI) | ‐0.78 [‐1.26, ‐0.30] |
| 9 Total ADHD symptom score ‐ investigator/research personnel ratings Show forest plot | 3 | 630 | Std. Mean Difference (IV, Random, 95% CI) | ‐1.15 [‐1.87, ‐0.44] |
| 10 Hyperactivity/impulsivity ‐ investigator/research personnel ratings Show forest plot | 2 | 280 | Std. Mean Difference (IV, Random, 95% CI) | ‐1.46 [‐1.83, ‐1.08] |
| 11 Inattention ‐ investigator/research personnel ratings Show forest plot | 4 | 634 | Std. Mean Difference (IV, Random, 95% CI) | ‐0.73 [‐1.42, ‐0.04] |
| 12 Proportion of responders (Clinical Global Impression ‐ Improvement; CGI ‐ I) Show forest plot | 9 | 2207 | Risk Ratio (M‐H, Random, 95% CI) | 3.36 [2.48, 4.55] |
| 13 Clinical Global Impression ‐ Severity (CGI ‐ S) score Show forest plot | 2 | 86 | Std. Mean Difference (IV, Random, 95% CI) | ‐0.86 [‐1.72, ‐0.01] |
| 14 Academic performance Show forest plot | 8 | 826 | Std. Mean Difference (IV, Random, 95% CI) | 0.56 [0.39, 0.73] |
| 15 Quality of life Show forest plot | 1 | Std. Mean Difference (IV, Random, 95% CI) | Subtotals only | |
| 16 Retention: proportion of participants who completed the trial Show forest plot | 11 | 2381 | Risk Ratio (M‐H, Random, 95% CI) | 1.03 [0.97, 1.10] |
| 17 Proportion of participants experiencing decreased appetite Show forest plot | 11 | 2467 | Risk Ratio (M‐H, Random, 95% CI) | 6.31 [2.58, 15.46] |
| 18 Proportion of participants experiencing insomnia/trouble sleeping Show forest plot | 10 | 2429 | Risk Ratio (M‐H, Random, 95% CI) | 3.80 [2.12, 6.83] |
| 19 Proportion of participants experiencing abdominal pain Show forest plot | 10 | 2155 | Risk Ratio (M‐H, Random, 95% CI) | 1.44 [1.03, 2.00] |
| 20 Proportion of participants experiencing nausea/vomiting Show forest plot | 6 | 1579 | Risk Ratio (M‐H, Random, 95% CI) | 1.63 [1.04, 2.56] |
| 21 Proportion of participants experiencing headaches Show forest plot | 9 | 2091 | Risk Ratio (M‐H, Random, 95% CI) | 0.93 [0.75, 1.16] |
| 22 Proportion of participants experiencing anxiety/nervousness Show forest plot | 5 | 1088 | Risk Ratio (M‐H, Random, 95% CI) | 1.22 [0.78, 1.93] |
| 23 Proportion of participants who experienced at least one adverse event Show forest plot | 6 | 1742 | Risk Ratio (M‐H, Random, 95% CI) | 1.30 [1.18, 1.44] |
| 24 Proportion of participants who dropped out/withdrew due to an adverse event Show forest plot | 9 | 2160 | Risk Ratio (M‐H, Random, 95% CI) | 1.60 [0.86, 2.98] |
| Outcome or subgroup title | No. of studies | No. of participants | Statistical method | Effect size |
| 1 Total ADHD symptom score ‐ parent ratings Show forest plot | 7 | 1247 | Std. Mean Difference (IV, Random, 95% CI) | ‐0.57 [‐0.86, ‐0.27] |
| 1.1 Dexamphetamine | 1 | 28 | Std. Mean Difference (IV, Random, 95% CI) | ‐0.60 [‐1.36, 0.16] |
| 1.2 Lisdexamphetamine | 2 | 486 | Std. Mean Difference (IV, Random, 95% CI) | ‐0.72 [‐1.59, 0.14] |
| 1.3 Mixed amphetamine salts | 4 | 733 | Std. Mean Difference (IV, Random, 95% CI) | ‐0.44 [‐0.63, ‐0.24] |
| 2 Proportion of responders (CGI ‐ I) Show forest plot | 9 | 2205 | Risk Ratio (M‐H, Random, 95% CI) | 3.38 [2.51, 4.55] |
| 2.1 Dexamphetamine | 1 | 64 | Risk Ratio (M‐H, Random, 95% CI) | 5.4 [2.38, 12.25] |
| 2.2 Lisdexamphetamine | 4 | 1065 | Risk Ratio (M‐H, Random, 95% CI) | 3.62 [2.04, 6.41] |
| 2.3 Mixed amphetamine salts | 4 | 1076 | Risk Ratio (M‐H, Random, 95% CI) | 2.72 [2.14, 3.45] |
| 3 Academic performance Show forest plot | 8 | 826 | Std. Mean Difference (IV, Random, 95% CI) | 0.56 [0.39, 0.73] |
| 3.1 Dexamphetamine | 4 | 208 | Std. Mean Difference (IV, Random, 95% CI) | 0.40 [0.12, 0.67] |
| 3.2 Lisdexamphetamine | 1 | 226 | Std. Mean Difference (IV, Random, 95% CI) | 0.78 [0.51, 1.05] |
| 3.3 Mixed amphetamine salts | 3 | 392 | Std. Mean Difference (IV, Random, 95% CI) | 0.56 [0.29, 0.84] |
| 4 Retention: proportion of participants who completed the trial Show forest plot | 10 | 2364 | Risk Ratio (M‐H, Random, 95% CI) | 1.05 [0.99, 1.12] |
| 4.1 Dexamphetamine | 1 | 64 | Risk Ratio (M‐H, Random, 95% CI) | 1.03 [0.95, 1.12] |
| 4.2 Lisdexamphetamine | 4 | 1084 | Risk Ratio (M‐H, Random, 95% CI) | 1.14 [0.92, 1.42] |
| 4.3 Mixed amphetamine salts | 5 | 1216 | Risk Ratio (M‐H, Random, 95% CI) | 1.03 [0.96, 1.11] |
| 5 Proportion of participants who dropped out/withdrew due to an adverse event Show forest plot | 9 | 2161 | Risk Ratio (M‐H, Random, 95% CI) | 1.61 [0.86, 2.98] |
| 5.1 Dexamphetamine | 1 | 92 | Risk Ratio (M‐H, Random, 95% CI) | 3.0 [0.13, 71.78] |
| 5.2 Lisdexamphetamine | 4 | 1085 | Risk Ratio (M‐H, Random, 95% CI) | 2.03 [0.70, 5.91] |
| 5.3 Mixed amphetamine salts | 4 | 984 | Risk Ratio (M‐H, Random, 95% CI) | 1.27 [0.53, 3.06] |
| 6 Proportion of participants experiencing decreased appetite Show forest plot | 10 | 2273 | Risk Ratio (M‐H, Random, 95% CI) | 6.20 [2.44, 15.71] |
| 6.1 Dexamphetamine | 1 | 68 | Risk Ratio (M‐H, Random, 95% CI) | 1.41 [0.95, 2.11] |
| 6.2 Lisdexampheatmine | 4 | 1081 | Risk Ratio (M‐H, Random, 95% CI) | 9.83 [5.08, 19.02] |
| 6.3 Mixed amphetamine salts | 5 | 1124 | Risk Ratio (M‐H, Random, 95% CI) | 6.42 [1.56, 26.52] |
| 7 Proportion of participants experiencing insomnia/trouble sleeping Show forest plot | 10 | 2429 | Risk Ratio (M‐H, Random, 95% CI) | 3.80 [2.12, 6.83] |
| 7.1 Dexamphetamine | 1 | 68 | Risk Ratio (M‐H, Random, 95% CI) | 2.14 [1.41, 3.26] |
| 7.2 Lisdexamphetamine | 4 | 1081 | Risk Ratio (M‐H, Random, 95% CI) | 5.91 [2.84, 12.29] |
| 7.3 Mixed amphetamine salts | 5 | 1280 | Risk Ratio (M‐H, Random, 95% CI) | 3.34 [1.25, 8.96] |
| 8 Proportion of participants experiencing abdominal pain Show forest plot | 10 | 2155 | Risk Ratio (M‐H, Random, 95% CI) | 1.44 [1.03, 2.00] |
| 8.1 Dexamphetamine | 1 | 68 | Risk Ratio (M‐H, Random, 95% CI) | 0.67 [0.27, 1.67] |
| 8.2 Lisdexamphetamine | 3 | 769 | Risk Ratio (M‐H, Random, 95% CI) | 1.29 [0.76, 2.19] |
| 8.3 Mixed amphetamine salts | 6 | 1318 | Risk Ratio (M‐H, Random, 95% CI) | 1.69 [1.17, 2.45] |
| 9 Proportion of participants experiencing headaches Show forest plot | 9 | 2063 | Risk Ratio (M‐H, Random, 95% CI) | 0.93 [0.75, 1.16] |
| 9.1 Dexamphetamine | 1 | 68 | Risk Ratio (M‐H, Random, 95% CI) | 1.0 [0.42, 2.36] |
| 9.2 Lisdexamphetamine | 5 | 1077 | Risk Ratio (M‐H, Random, 95% CI) | 1.07 [0.73, 1.57] |
| 9.3 Mixed amphetamine salts | 3 | 918 | Risk Ratio (M‐H, Random, 95% CI) | 0.85 [0.64, 1.14] |
| 10 Proportion of participants experiencing nausea/vomiting Show forest plot | 6 | 1579 | Risk Ratio (M‐H, Random, 95% CI) | 1.63 [1.04, 2.56] |
| 10.1 Dexamphetamine | 1 | 68 | Risk Ratio (M‐H, Random, 95% CI) | 1.67 [0.68, 4.07] |
| 10.2 Lisdexamphetamine | 4 | 927 | Risk Ratio (M‐H, Random, 95% CI) | 1.48 [0.61, 3.61] |
| 10.3 Mixed amphetamine salts | 1 | 584 | Risk Ratio (M‐H, Random, 95% CI) | 1.84 [1.04, 3.27] |
| Outcome or subgroup title | No. of studies | No. of participants | Statistical method | Effect size |
| 1 Total ADHD symptom score ‐ parent ratings Show forest plot | 7 | 1247 | Std. Mean Difference (IV, Random, 95% CI) | ‐0.57 [‐0.86, ‐0.27] |
| 1.1 Long acting | 3 | 1049 | Std. Mean Difference (IV, Random, 95% CI) | ‐0.61 [‐1.08, ‐0.13] |
| 1.2 Short acting | 4 | 198 | Std. Mean Difference (IV, Random, 95% CI) | ‐0.52 [‐0.82, ‐0.23] |
| 2 Proportion of responders (CGI ‐ I) Show forest plot | 9 | 2105 | Risk Ratio (M‐H, Random, 95% CI) | 3.31 [2.44, 4.49] |
| 2.1 Long acting | 6 | 1662 | Risk Ratio (M‐H, Random, 95% CI) | 3.55 [2.63, 4.79] |
| 2.2 Short acting | 3 | 443 | Risk Ratio (M‐H, Random, 95% CI) | 2.89 [1.39, 6.02] |
| 3 Academic performance Show forest plot | 8 | 826 | Std. Mean Difference (IV, Random, 95% CI) | 0.56 [0.39, 0.73] |
| 3.1 Long acting | 4 | 494 | Std. Mean Difference (IV, Random, 95% CI) | 0.59 [0.36, 0.81] |
| 3.2 Short acting | 4 | 332 | Std. Mean Difference (IV, Random, 95% CI) | 0.48 [0.15, 0.81] |
| 4 Retention: proportion of participants who completed the trial Show forest plot | 10 | 2364 | Risk Ratio (M‐H, Random, 95% CI) | 1.05 [0.99, 1.12] |
| 4.1 Long acting | 6 | 1756 | Risk Ratio (M‐H, Random, 95% CI) | 1.11 [1.00, 1.24] |
| 4.2 Short acting | 4 | 608 | Risk Ratio (M‐H, Random, 95% CI) | 0.98 [0.95, 1.01] |
| 5 Proportion of participants experiencing decreased appetite Show forest plot | 10 | 2271 | Risk Ratio (M‐H, Random, 95% CI) | 6.18 [2.44, 15.63] |
| 5.1 Long acting | 8 | 2165 | Risk Ratio (M‐H, Random, 95% CI) | 7.67 [3.33, 17.65] |
| 5.2 Short acting | 2 | 106 | Risk Ratio (M‐H, Random, 95% CI) | 1.58 [0.69, 3.62] |
| 6 Proportion of participants experiencing abdominal pain Show forest plot | 10 | 2155 | Risk Ratio (M‐H, Random, 95% CI) | 1.44 [1.03, 2.00] |
| 6.1 Long acting | 7 | 1855 | Risk Ratio (M‐H, Random, 95% CI) | 1.49 [1.10, 2.02] |
| 6.2 Short acting | 3 | 300 | Risk Ratio (M‐H, Random, 95% CI) | 2.54 [0.30, 21.39] |
| Outcome or subgroup title | No. of studies | No. of participants | Statistical method | Effect size |
| 1 Total ADHD symptom score ‐ parent ratings Show forest plot | 7 | 1247 | Std. Mean Difference (IV, Random, 95% CI) | ‐0.57 [‐0.86, ‐0.27] |
| 1.1 Industry | 5 | 1135 | Std. Mean Difference (IV, Random, 95% CI) | ‐0.53 [‐0.89, ‐0.16] |
| 1.2 Public | 1 | 84 | Std. Mean Difference (IV, Random, 95% CI) | ‐0.75 [‐1.20, ‐0.31] |
| 1.3 Not reported | 1 | 28 | Std. Mean Difference (IV, Random, 95% CI) | ‐0.60 [‐1.36, 0.16] |
| 2 Proportion of responders (CGI ‐ I) Show forest plot | 9 | 2210 | Risk Ratio (M‐H, Random, 95% CI) | 3.37 [2.50, 4.53] |
| 2.1 Industry | 8 | 2146 | Risk Ratio (M‐H, Random, 95% CI) | 3.24 [2.39, 4.40] |
| 2.2 Not reported | 1 | 64 | Risk Ratio (M‐H, Random, 95% CI) | 5.4 [2.38, 12.25] |
| 3 Academic performance Show forest plot | 8 | 826 | Std. Mean Difference (IV, Random, 95% CI) | 0.56 [0.39, 0.73] |
| 3.1 Industry | 5 | 688 | Std. Mean Difference (IV, Random, 95% CI) | 0.64 [0.46, 0.81] |
| 3.2 Public | 1 | 44 | Std. Mean Difference (IV, Random, 95% CI) | ‐0.01 [‐0.60, 0.59] |
| 3.3 Not reported | 2 | 94 | Std. Mean Difference (IV, Random, 95% CI) | 0.47 [0.06, 0.88] |
| Outcome or subgroup title | No. of studies | No. of participants | Statistical method | Effect size |
| 1 Total ADHD symptom score ‐ parent ratings Show forest plot | 7 | 1247 | Std. Mean Difference (IV, Fixed, 95% CI) | ‐0.52 [‐0.64, ‐0.40] |
| 2 Hyperactivity/impulsivity ‐ parent ratings Show forest plot | 2 | 132 | Std. Mean Difference (IV, Fixed, 95% CI) | ‐0.54 [‐0.89, ‐0.19] |
| 3 Total ADHD symptom score ‐ teacher ratings Show forest plot | 5 | 745 | Std. Mean Difference (IV, Fixed, 95% CI) | ‐0.47 [‐0.62, ‐0.32] |
| 4 Hyperactivity/impulsivity ‐ teacher ratings Show forest plot | 1 | Std. Mean Difference (IV, Fixed, 95% CI) | Subtotals only | |
| 5 Inattention ‐ teacher ratings Show forest plot | 1 | Std. Mean Difference (IV, Fixed, 95% CI) | Subtotals only | |
| 6 Total ADHD symptom score ‐ clinician ratings Show forest plot | 3 | 813 | Std. Mean Difference (IV, Fixed, 95% CI) | ‐0.84 [‐1.01, ‐0.68] |
| 7 Hyperactivity/impulsivity ‐ clinician ratings Show forest plot | 3 | 813 | Std. Mean Difference (IV, Fixed, 95% CI) | ‐0.74 [‐0.90, ‐0.58] |
| 8 Inattention ‐ clinician ratings Show forest plot | 3 | 813 | Std. Mean Difference (IV, Fixed, 95% CI) | ‐0.77 [‐0.94, ‐0.61] |
| 9 Total ADHD symptom score ‐ investigator/research personnel ratings Show forest plot | 3 | 630 | Std. Mean Difference (IV, Fixed, 95% CI) | ‐1.08 [‐1.25, ‐0.91] |
| 10 Hyperactivity/impulsivity ‐ Investigator/research personnel ratings Show forest plot | 2 | 280 | Std. Mean Difference (IV, Fixed, 95% CI) | ‐1.50 [‐1.76, ‐1.23] |
| 11 Inattention ‐ investigator/research personnel ratings Show forest plot | 4 | 634 | Std. Mean Difference (IV, Fixed, 95% CI) | ‐0.76 [‐0.93, ‐0.60] |
| 12 Proportion of responders (CGI ‐ I) Show forest plot | 9 | 2207 | Risk Ratio (M‐H, Fixed, 95% CI) | 3.11 [2.68, 3.61] |
| 13 CGI ‐ S score Show forest plot | 2 | 86 | Std. Mean Difference (IV, Fixed, 95% CI) | ‐0.71 [‐1.15, ‐0.27] |
| 14 Quality of life Show forest plot | 1 | Std. Mean Difference (IV, Fixed, 95% CI) | Subtotals only | |
| 15 Academic performance Show forest plot | 8 | 826 | Std. Mean Difference (IV, Fixed, 95% CI) | 0.59 [0.45, 0.73] |
| 16 Retention: proportion of participants who completed the trial Show forest plot | 10 | 2364 | Risk Ratio (M‐H, Fixed, 95% CI) | 1.08 [1.04, 1.12] |
| 17 Proportion of participants who experienced at least one adverse event Show forest plot | 6 | 1742 | Risk Ratio (M‐H, Fixed, 95% CI) | 1.33 [1.20, 1.47] |
| 18 Proportion of participants who dropped out/withdrew due to an adverse event Show forest plot | 9 | 2160 | Risk Ratio (M‐H, Fixed, 95% CI) | 1.95 [1.08, 3.51] |
| 19 Proportion of participants experiencing decreased appetite Show forest plot | 11 | 2467 | Risk Ratio (M‐H, Fixed, 95% CI) | 5.57 [4.03, 7.68] |
| 20 Proportion of participants experiencing insomnia/trouble sleeping Show forest plot | 10 | 2429 | Risk Ratio (M‐H, Fixed, 95% CI) | 3.91 [2.82, 5.41] |
| 21 Proportion of participants experiencing abdominal pain Show forest plot | 10 | 2155 | Risk Ratio (M‐H, Fixed, 95% CI) | 1.57 [1.18, 2.08] |
| 22 Proportion of participants experiencing headaches Show forest plot | 9 | 2091 | Risk Ratio (M‐H, Fixed, 95% CI) | 0.95 [0.76, 1.18] |
| 23 Proportion of participants experiencing anxiety/nervousness Show forest plot | 5 | 1088 | Risk Ratio (M‐H, Fixed, 95% CI) | 1.21 [0.94, 1.56] |
| 24 Proportion of participants experiencing nausea/vomiting Show forest plot | 6 | 1579 | Risk Ratio (M‐H, Fixed, 95% CI) | 1.72 [1.20, 2.46] |