Anfetaminas para el trastorno de déficit de atención e hiperactividad (TDAH) en niños y adolescentes
Información
- DOI:
- https://doi.org/10.1002/14651858.CD009996.pub2Copiar DOI

- Base de datos:
-
- Cochrane Database of Systematic Reviews
- Versión publicada:
-
- 04 febrero 2016see what's new
- Tipo:
-
- Intervention
- Etapa:
-
- Review
- Grupo Editorial Cochrane:
-
Grupo Cochrane de Problemas de desarrollo, psicosociales y de aprendizaje
- Copyright:
-
- Copyright © 2016 The Cochrane Collaboration. Published by John Wiley & Sons, Ltd.
Cifras del artículo
Altmetric:
Citado por:
Autores
Contributions of authors
SP and SV conceived this review and share overall responsibility for this review.
SP led the design and ongoing co‐ordination of this review with oversight from LS, LH, LU, BV, CJN, and SV.
SP developed the additional search strategies and carried out the searches for this review.
SP and BV developed the analysis plan.
SP retrieved the papers for this review.
SP and LS independently assessed the retrieved papers against the eligibility criteria for this review.
SP and LS independently appraised the risk of bias in the papers for this review.
SP and LS independently extracted the data from the papers for this review.
SP wrote to authors of included studies for additional information for this review.
SP managed the data for this review, including entering data into RevMan and analysing the data under the guidance of BV.
SP interpreted the data for this review with input from all authors.
SP wrote the review.
All authors critically read and edited the review.
Sources of support
Internal sources
-
None, Other.
External sources
-
Alberta Innovates ‐ Health Solutions, Canada.
Salary support for Dr. Sunita Vohra
Declarations of interest
Salima Punja ‐ none known.
Larissa Shamseer ‐ none known.
Lisa Hartling ‐ none known.
Liana Urichuk ‐ received salary support from the Addiction & Mental Health Program of Alberta Health Services ‐ Edmonton Zone during the course of this review. Dr Urichuk also received a grant for a research project entitled "Neurofeedback for children with Attention Deficit Hyperactivity Disorder" from the Sick Kids Hospital Foundation and John and Lotte Hecht Memorial Foundation.
Ben Vandermeer ‐ none known.
Catherine Jane Nikles ‐ published a paper in the area of amphetamines for ADHD (Nikles 2006). The study was excluded due to the nature of the design. Dr Nikles was not involved in assessing the eligibility of this study, which was performed by two independent authors.
Sunita Vohra ‐ is the recipient of an Alberta Innovates ‐ Health Scholar salary award. Dr Vohra's institution receives funds from Alberta Innovates ‐ Health Solutions and protects 75% of her time for research. Other funders include Health Canada, Canadian Institutes of Health Research, Women & Children’s Health Research Institute and National Health, Medical Research Council (Australia) and SERIN‐ETD Acupuncture Research Fund. SERIN is a commercial entity who provided acupuncture needles for a trial. The population is not pediatric ADHD. None of these companies pose a conflict of interest as regards this review.
Acknowledgements
The authors wish to thank Soleil Surrette for her assistance in developing and reviewing the search strategy. We also want to thank Dr. Marek Varga for his help with translation.
We also wish to thank Geraldine McDonald (Co‐ordinating Editor), Joanne Wilson (Managing Editor), and Margaret Anderson (Trials Search Co‐ordinator) of the Cochrane Developmental, Psychosocial and Learning Problems Group for providing help and support.
We wish to thank those who peer reviewed this manuscript and providing their thoughtful feedback.
Version history
| Published | Title | Stage | Authors | Version |
| 2016 Feb 04 | Amphetamines for attention deficit hyperactivity disorder (ADHD) in children and adolescents | Review | Salima Punja, Larissa Shamseer, Lisa Hartling, Liana Urichuk, Ben Vandermeer, Jane Nikles, Sunita Vohra | |
| 2012 Jul 11 | Amphetamines for attention deficit hyperactivity disorder (ADHD) in children and adolescents | Protocol | Salima Punja, Larissa Shamseer, Lisa Hartling, Liana Urichuk, Ben Vandermeer, Catherine J Nikles, Sunita Vohra | |
Differences between protocol and review
Please refer to Table 1 for a summary of protocol decisions not used in this review.
Methods. Data collection and analysis. Assessment of risk of bias in included studies.
In our protocol, we had included funding source in the risk of bias assessment. However, given the ongoing debate of the influence of funding source on treatment effect estimates, we removed this from the assessment. Instead, we explored the influence of industry on treatment effects by performing a subgroup analysis on funding source (industry versus publicly funded versus not reported).
Methods. Data collection and analysis. Unit of analysis issues.
Studies with multiple comparisons
For dichotomous outcomes of cross‐over studies, we randomly dropped one arm and used the other in the meta‐analysis.
Methods. Data collection and analysis. Assessment of heterogeneity
We added that we assessed statistical heterogeneity by examining "Chi² (P value less than 0.10 as evidence of heterogeneity)", and "Tau² estimates for each random‐effects meta‐analysis".
Methods. Data collection and analysis. 'Summary of findings'.
We added a description of what was included in the 'Summary of findings' table beneath the subsection on 'Data synthesis'.
Methods. Data collection and analysis. Subgroup analysis and investigation of heterogeneity.
We had planned to perform a subgroup analysis based on type of questionnaire used (teacher, parent, clinician, investigator). However, given the importance of each of these informants individually in the overall assessment of ADHD, these were separated in our primary analysis.
Methods. Data collection and analysis. Sensitivity analysis.
We did not conduct a sensitivity analysis according to study design (parallel‐group versus cross‐over trial) as planned, since all included cross‐over studies were treated as if they were parallel‐group studies.
Keywords
MeSH
Medical Subject Headings (MeSH) Keywords
Medical Subject Headings Check Words
Adolescent; Child; Child, Preschool; Humans;
PICO

Study flow diagram
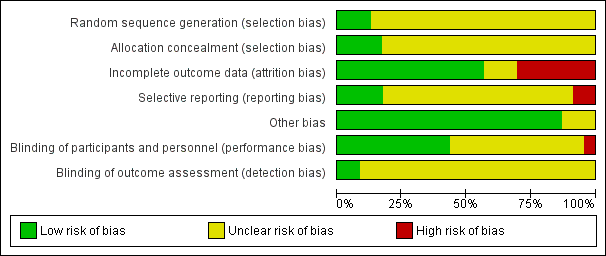
Risk of bias graph: review authors' judgements about each risk of bias item presented as percentages across all included studies.

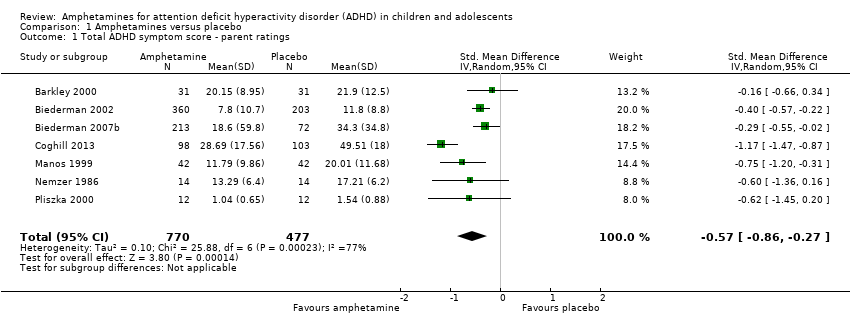
Forest plot of comparison: 1 Amphetamines versus placebo, outcome: 1.1 Total ADHD symptom score ‐ parent ratings.

Forest plot of comparison: 1 Amphetamines versus placebo, outcome: 1.3 Total ADHD symptom score ‐ teacher ratings.

Forest plot of comparison: 1 Amphetamines versus placebo, outcome: 1.23 Proportion of participants who experienced at least one adverse event.
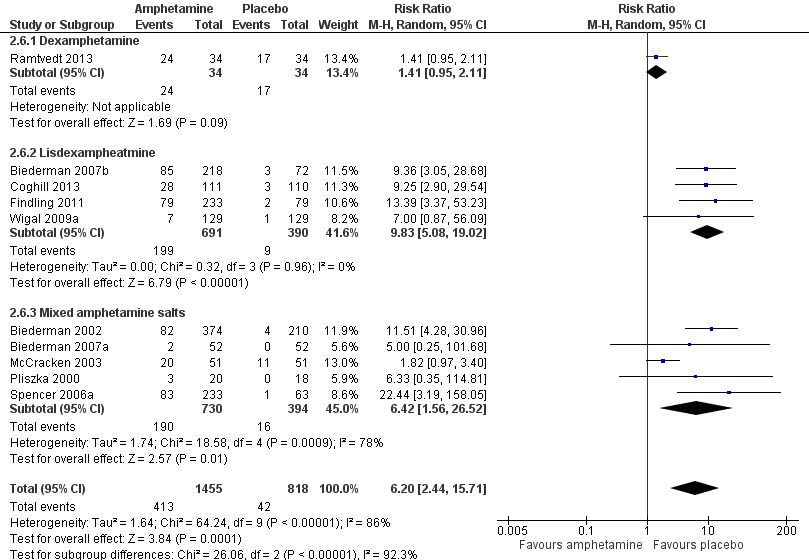
Forest plot of comparison: 2 Subgroup analysis 1: Type of amphetamine, outcome: 2.6 Proportion of participants experiencing decreased appetite.
Comparison 1 Amphetamines versus placebo, Outcome 1 Total ADHD symptom score ‐ parent ratings.

Comparison 1 Amphetamines versus placebo, Outcome 2 Hyperactivity/impulsivity ‐ parent ratings.

Comparison 1 Amphetamines versus placebo, Outcome 3 Total ADHD symptom score ‐ teacher ratings.

Comparison 1 Amphetamines versus placebo, Outcome 4 Hyperactivity/impulsivity ‐ teacher ratings.

Comparison 1 Amphetamines versus placebo, Outcome 5 Inattention ‐ teacher ratings.

Comparison 1 Amphetamines versus placebo, Outcome 6 Total ADHD symptom score ‐ clinician ratings.

Comparison 1 Amphetamines versus placebo, Outcome 7 Hyperactivity/impulsivity ‐ clinician ratings.

Comparison 1 Amphetamines versus placebo, Outcome 8 Inattention ‐ clinician ratings.

Comparison 1 Amphetamines versus placebo, Outcome 9 Total ADHD symptom score ‐ investigator/research personnel ratings.

Comparison 1 Amphetamines versus placebo, Outcome 10 Hyperactivity/impulsivity ‐ investigator/research personnel ratings.
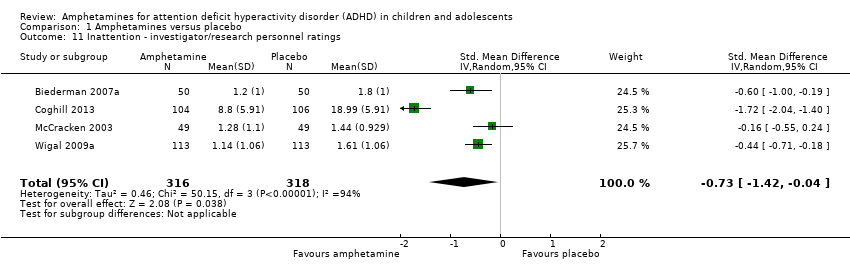
Comparison 1 Amphetamines versus placebo, Outcome 11 Inattention ‐ investigator/research personnel ratings.
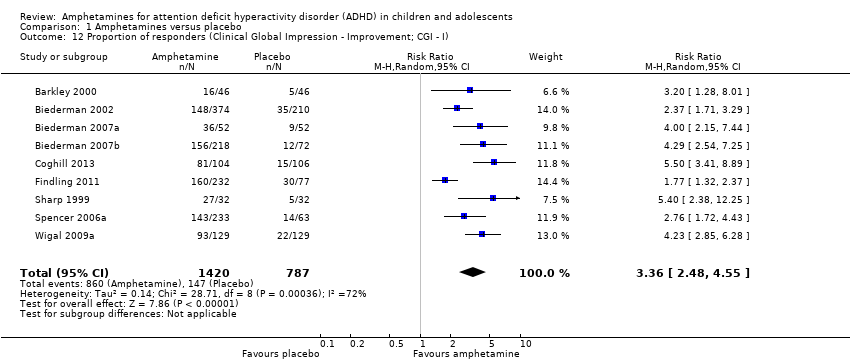
Comparison 1 Amphetamines versus placebo, Outcome 12 Proportion of responders (Clinical Global Impression ‐ Improvement; CGI ‐ I).
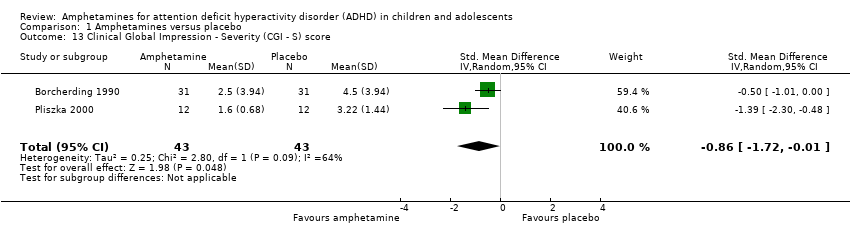
Comparison 1 Amphetamines versus placebo, Outcome 13 Clinical Global Impression ‐ Severity (CGI ‐ S) score.

Comparison 1 Amphetamines versus placebo, Outcome 14 Academic performance.

Comparison 1 Amphetamines versus placebo, Outcome 15 Quality of life.
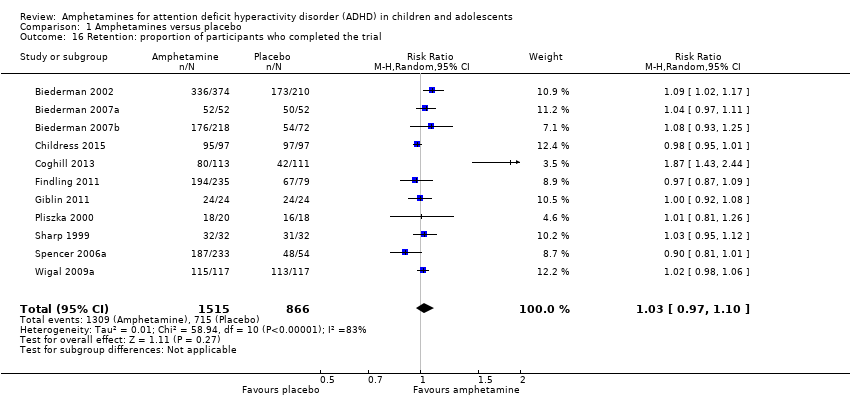
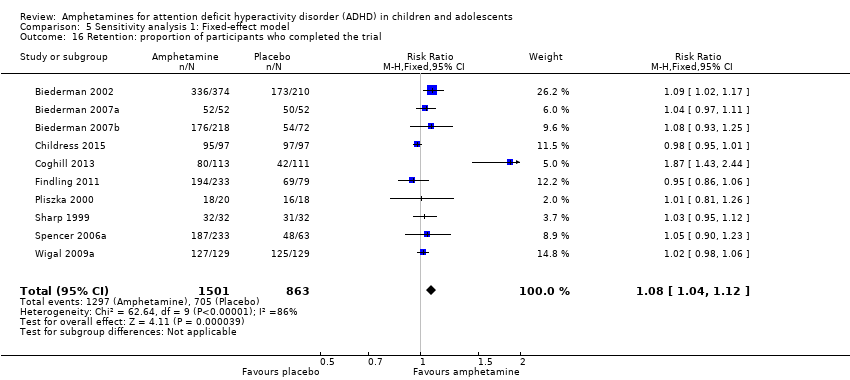
Comparison 1 Amphetamines versus placebo, Outcome 16 Retention: proportion of participants who completed the trial.
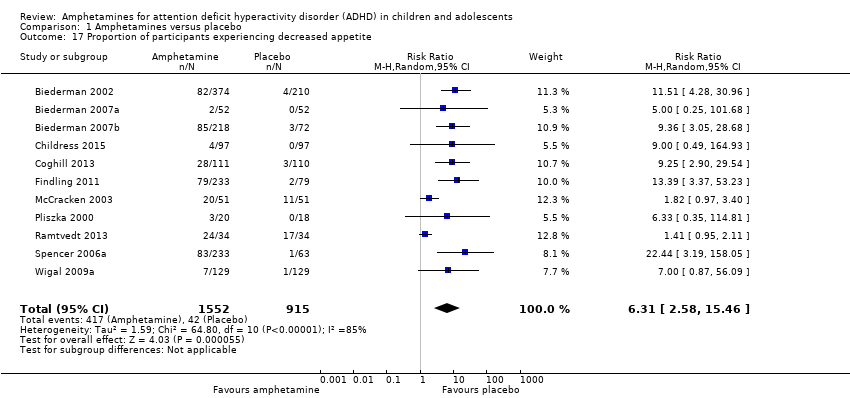
Comparison 1 Amphetamines versus placebo, Outcome 17 Proportion of participants experiencing decreased appetite.

Comparison 1 Amphetamines versus placebo, Outcome 18 Proportion of participants experiencing insomnia/trouble sleeping.
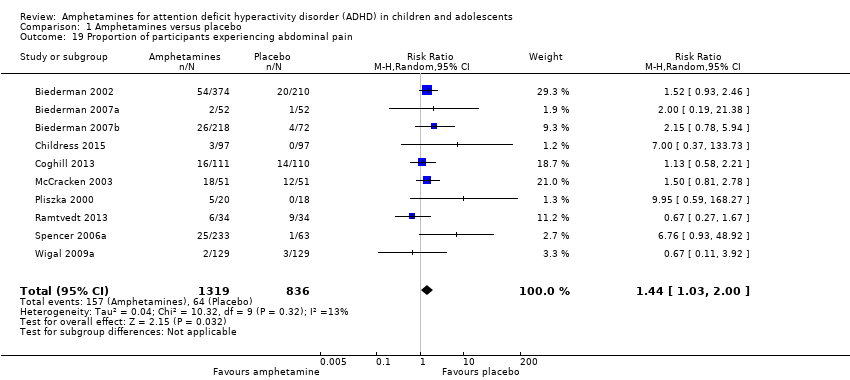
Comparison 1 Amphetamines versus placebo, Outcome 19 Proportion of participants experiencing abdominal pain.

Comparison 1 Amphetamines versus placebo, Outcome 20 Proportion of participants experiencing nausea/vomiting.

Comparison 1 Amphetamines versus placebo, Outcome 21 Proportion of participants experiencing headaches.

Comparison 1 Amphetamines versus placebo, Outcome 22 Proportion of participants experiencing anxiety/nervousness.

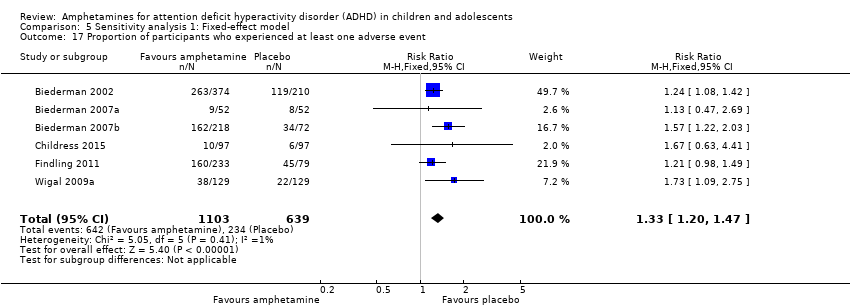
Comparison 1 Amphetamines versus placebo, Outcome 23 Proportion of participants who experienced at least one adverse event.

Comparison 1 Amphetamines versus placebo, Outcome 24 Proportion of participants who dropped out/withdrew due to an adverse event.

Comparison 2 Subgroup analysis 1: Type of amphetamine, Outcome 1 Total ADHD symptom score ‐ parent ratings.

Comparison 2 Subgroup analysis 1: Type of amphetamine, Outcome 2 Proportion of responders (CGI ‐ I).

Comparison 2 Subgroup analysis 1: Type of amphetamine, Outcome 3 Academic performance.
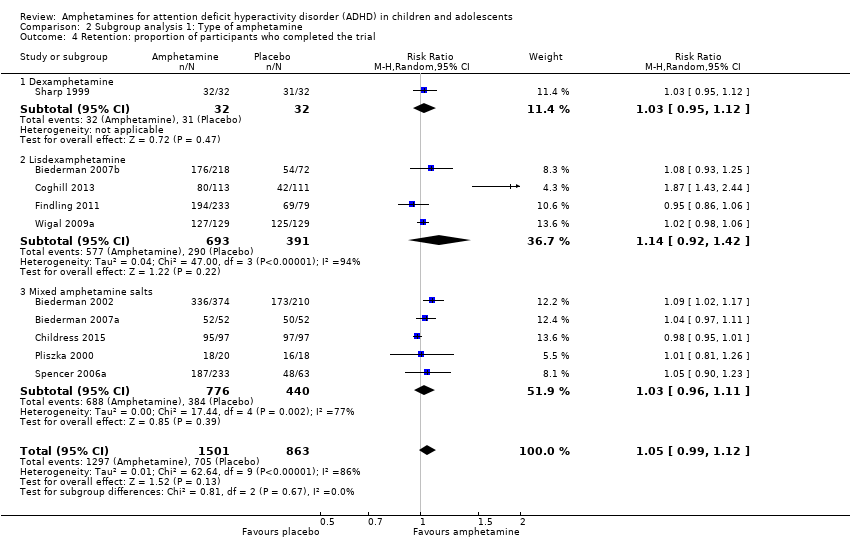
Comparison 2 Subgroup analysis 1: Type of amphetamine, Outcome 4 Retention: proportion of participants who completed the trial.
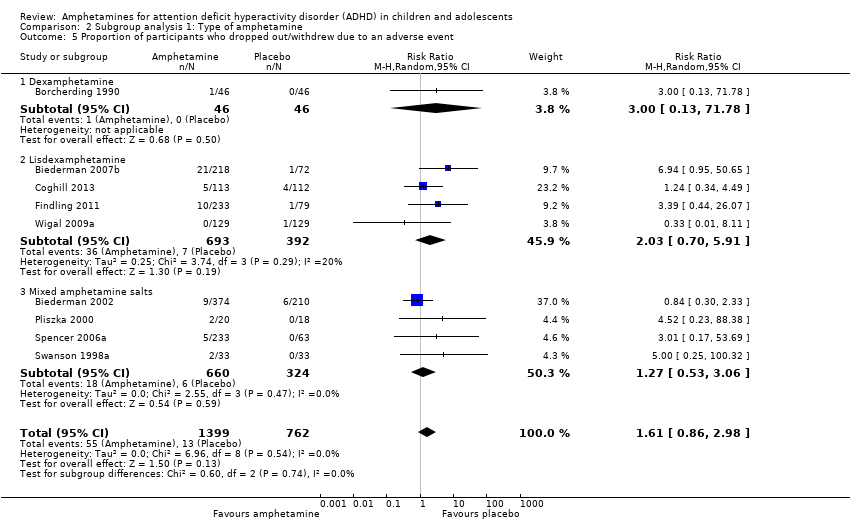
Comparison 2 Subgroup analysis 1: Type of amphetamine, Outcome 5 Proportion of participants who dropped out/withdrew due to an adverse event.

Comparison 2 Subgroup analysis 1: Type of amphetamine, Outcome 6 Proportion of participants experiencing decreased appetite.

Comparison 2 Subgroup analysis 1: Type of amphetamine, Outcome 7 Proportion of participants experiencing insomnia/trouble sleeping.
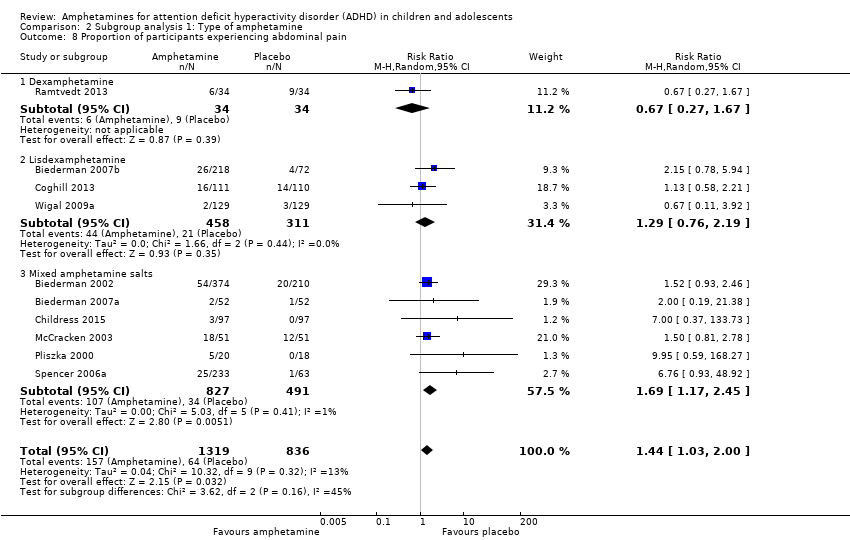
Comparison 2 Subgroup analysis 1: Type of amphetamine, Outcome 8 Proportion of participants experiencing abdominal pain.

Comparison 2 Subgroup analysis 1: Type of amphetamine, Outcome 9 Proportion of participants experiencing headaches.
Comparison 2 Subgroup analysis 1: Type of amphetamine, Outcome 10 Proportion of participants experiencing nausea/vomiting.
Comparison 3 Subgroup analysis 2: Type of amphetamine release formulation, Outcome 1 Total ADHD symptom score ‐ parent ratings.
Comparison 3 Subgroup analysis 2: Type of amphetamine release formulation, Outcome 2 Proportion of responders (CGI ‐ I).

Comparison 3 Subgroup analysis 2: Type of amphetamine release formulation, Outcome 3 Academic performance.
Comparison 3 Subgroup analysis 2: Type of amphetamine release formulation, Outcome 4 Retention: proportion of participants who completed the trial.
Comparison 3 Subgroup analysis 2: Type of amphetamine release formulation, Outcome 5 Proportion of participants experiencing decreased appetite.
Comparison 3 Subgroup analysis 2: Type of amphetamine release formulation, Outcome 6 Proportion of participants experiencing abdominal pain.
Comparison 4 Subgroup analysis 3: Funding source, Outcome 1 Total ADHD symptom score ‐ parent ratings.

Comparison 4 Subgroup analysis 3: Funding source, Outcome 2 Proportion of responders (CGI ‐ I).
Comparison 4 Subgroup analysis 3: Funding source, Outcome 3 Academic performance.

Comparison 5 Sensitivity analysis 1: Fixed‐effect model, Outcome 1 Total ADHD symptom score ‐ parent ratings.
Comparison 5 Sensitivity analysis 1: Fixed‐effect model, Outcome 2 Hyperactivity/impulsivity ‐ parent ratings.
Comparison 5 Sensitivity analysis 1: Fixed‐effect model, Outcome 3 Total ADHD symptom score ‐ teacher ratings.

Comparison 5 Sensitivity analysis 1: Fixed‐effect model, Outcome 4 Hyperactivity/impulsivity ‐ teacher ratings.

Comparison 5 Sensitivity analysis 1: Fixed‐effect model, Outcome 5 Inattention ‐ teacher ratings.
Comparison 5 Sensitivity analysis 1: Fixed‐effect model, Outcome 6 Total ADHD symptom score ‐ clinician ratings.
Comparison 5 Sensitivity analysis 1: Fixed‐effect model, Outcome 7 Hyperactivity/impulsivity ‐ clinician ratings.

Comparison 5 Sensitivity analysis 1: Fixed‐effect model, Outcome 8 Inattention ‐ clinician ratings.

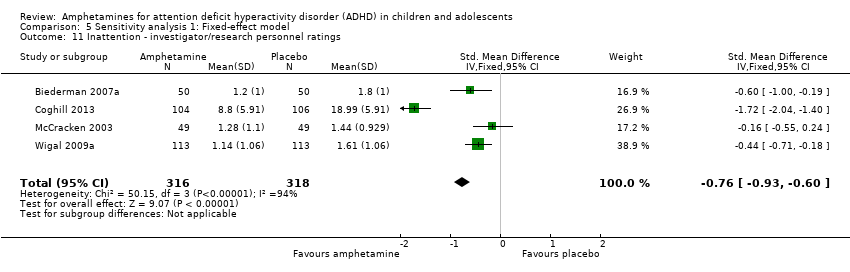
Comparison 5 Sensitivity analysis 1: Fixed‐effect model, Outcome 9 Total ADHD symptom score ‐ investigator/research personnel ratings.

Comparison 5 Sensitivity analysis 1: Fixed‐effect model, Outcome 10 Hyperactivity/impulsivity ‐ Investigator/research personnel ratings.
Comparison 5 Sensitivity analysis 1: Fixed‐effect model, Outcome 11 Inattention ‐ investigator/research personnel ratings.
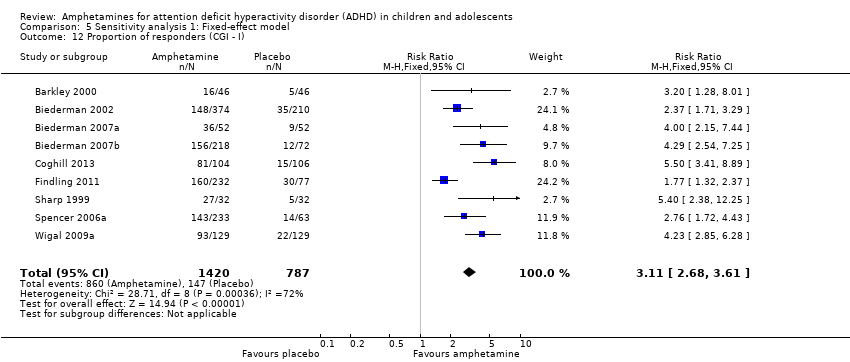
Comparison 5 Sensitivity analysis 1: Fixed‐effect model, Outcome 12 Proportion of responders (CGI ‐ I).
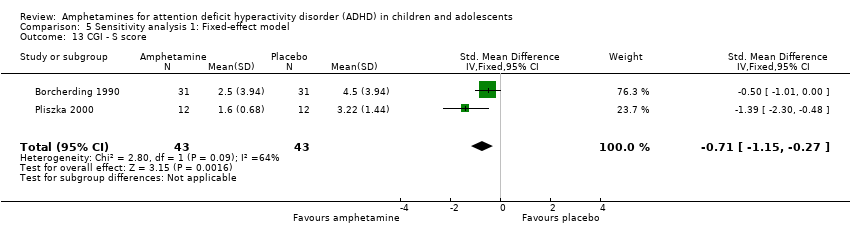
Comparison 5 Sensitivity analysis 1: Fixed‐effect model, Outcome 13 CGI ‐ S score.

Comparison 5 Sensitivity analysis 1: Fixed‐effect model, Outcome 14 Quality of life.
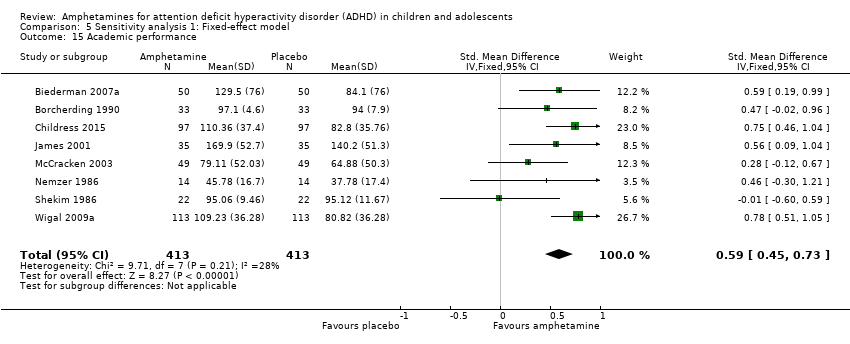
Comparison 5 Sensitivity analysis 1: Fixed‐effect model, Outcome 15 Academic performance.
Comparison 5 Sensitivity analysis 1: Fixed‐effect model, Outcome 16 Retention: proportion of participants who completed the trial.
Comparison 5 Sensitivity analysis 1: Fixed‐effect model, Outcome 17 Proportion of participants who experienced at least one adverse event.

Comparison 5 Sensitivity analysis 1: Fixed‐effect model, Outcome 18 Proportion of participants who dropped out/withdrew due to an adverse event.

Comparison 5 Sensitivity analysis 1: Fixed‐effect model, Outcome 19 Proportion of participants experiencing decreased appetite.

Comparison 5 Sensitivity analysis 1: Fixed‐effect model, Outcome 20 Proportion of participants experiencing insomnia/trouble sleeping.

Comparison 5 Sensitivity analysis 1: Fixed‐effect model, Outcome 21 Proportion of participants experiencing abdominal pain.

Comparison 5 Sensitivity analysis 1: Fixed‐effect model, Outcome 22 Proportion of participants experiencing headaches.

Comparison 5 Sensitivity analysis 1: Fixed‐effect model, Outcome 23 Proportion of participants experiencing anxiety/nervousness.

Comparison 5 Sensitivity analysis 1: Fixed‐effect model, Outcome 24 Proportion of participants experiencing nausea/vomiting.
| Amphetamines compared with placebo for attention deficit hyperactivity disorder in children and adolescents | ||||||
| Patient or population: children or adolescents with ADHD Settings: Beligum, France, Germany, Hungary, Italy, Netherlands, Norway, Poland, Spain, Sweden, United Kingdom, United States Intervention: amphetamines (i.e. dexamphetamine, lisdexamphetamine, mixed amphetamine salts) Comparison: placebo | ||||||
| Outcomes | Illustrative comparative risks* (95% CI) | Relative effect | Number of participants | Quality of the evidence | Comments | |
| Assumed risk | Corresponding risk | |||||
| Placebo | Amphetamine | |||||
| Total ADHD symptom score ‐ parent ratings (ADHD Rating Scale, Fourth Version; Conners' Rating Scale; Conners' Global Index; Conners' Abbreviated Symptom Questionnaire) | ‐ | The mean total score in the intervention groups was 0.57 standard deviations lower (‐0.86 to ‐0.27) | SMD ‐0.57 (‐0.86 to ‐0.27) | 1247 | ⊕⊝⊝⊝ | Moderate effect** |
| Total ADHD symptom score ‐ teacher ratings (ADHD Rating Scale, Fourth Version; Conners' Rating Scale; Conners' Global Index; Conners' Abbreviated Symptom Questionnaire) Follow‐up: 7 to 35 days | ‐ | The mean total score in the intervention groups was 0.55 standard deviations lower (‐0.83 to ‐0.27) | SMD ‐0.55 (‐0.83 to ‐0.27) | 745 | ⊕⊕⊝⊝ | Moderate effect** |
| Total ADHD symptom score ‐ clinician ratings (ADHD Rating Scale, Fourth Version) | ‐ | The mean total score in the intervention groups was 0.84 standard deviations lower (‐1.32 to ‐0.36) | SMD ‐0.84 (‐1.32 to ‐0.36) | 813 | ⊕⊝⊝⊝ | Large effect** |
| Proportion of responders (Clinical Global Impressions ‐ Improvement (CGI‐I) scale) | 187 per 1000 | 605 per 1000 | RR 3.36 (2.48 to 4.55) | 2207 | ⊝⊝⊝⊝ | ‐ |
| Academic performance (Permanent Product Measure of Performance; Wechsler Intelligence Scale for Children ‐ Revised; Barnell Lot, Ltd Math Test; Wide Range Achievement Test) Follow‐up: 7 to 21 days | ‐ | The mean score in the intervention groups was 0.51 standard deviations higher (0.31 to 0.70) | SMD 0.56 (0.39 to 0.73) | 826 | ⊕⊕⊝⊝ | Moderate effect** |
| Retention: proportion of participants who completed the trial | 825 per 1000 | 864 per 1000 | RR 1.03 | 2381 | ⊕⊝⊝⊝ | ‐ |
| Proportion of participants who experienced at least 1 adverse event | 366 per 1000 | 582 per 1000 | RR 1.30 (1.18 to 1.44) | 1742 | ⊕⊕⊝⊝ | ‐ |
| *The basis for the assumed risk (e.g. the median control group risk across studies) is provided in the footnotes. The corresponding risk (and its 95% CI) is based on the assumed risk in the comparison group and the relative effect of the intervention (and its 95% CI). ADHD: Attention deficit hyperactivity disorder; CI: Confidence interval; GRADE: Grades of recommendation, assessment, development and evaluation; RR: Risk ratio; SMD: Standardized mean difference | ||||||
| GRADE Working Group grades of evidence | ||||||
| 1Downgraded one level due to the majority of studies included in this outcome having a high risk of bias. | ||||||
| Types of outcome measures | Primary outcomes Multiple perspectives (i.e. teacher, parent, clinician) are considered the gold standard when assessing the core symptoms of ADHD. As such, we will not favor one perspective over another. In the event that reports do not agree with one another, for example, teacher reports disagree with parent reports on the improvement of core symptoms, this may be quite telling about how a child’s environment impacts their ADHD given the varying demands between a school environment and home environment. This will be interpreted accordingly in the discussion. Secondary outcomes We will assess 'parental stress' as a secondary outcome. |
| Measures of treatment effect | Dichotomous outcome data When a single study has utilized more than one measure to assess the same construct (e.g. ADHD core symptoms as assessed by teacher‐rated ADHD‐RS‐IV and teacher ratings of the Conners’ ADHD Rating Scale), treatment effects will be averaged across outcome measures in order to arrive at a single treatment effect for use in the meta‐analysis. Continuous outcome data For continuous outcomes, where the same rating scale has been used for all studies, we will calculate mean differences. |
| Unit of analysis issues | Cross‐over trials For meta‐analyses that use that use a mean difference, we will compute standard deviations for the cross‐over trials taking into account correlation. If correlation coefficients are not available, we will impute them from other studies or use 0.5 as a conservative estimate (Follman 1992). For cross‐over trials where carry‐over is thought to be a problem, where no washout period is present, or when only data from the first period are available, we will analyze data from the first period only. Studies with multiple time points In studies where results are presented for several periods of follow‐up, we will analyze each outcome at each point in a separate meta‐analysis with other comparable studies taking measures at a similar time frame post‐randomization. Time frames will reflect short‐term (up to six months), medium‐term (between 6 months and 12 |
| Assessment of reporting biases | For each primary meta‐analysis in which we have identified a sufficient number of studies (n ≥ 10) for inclusion, we will draw funnel plots in order to assess the possibility of publication bias. |
| Subgroup analysis and investigation of heterogeneity | We will conduct the following subgroup analyses.
|
| Sensitivity analysis | We will conduct the following sensitivity analyses.
|
| ADHD: attention deficit hyperactivity disorder. | |
| Outcome | Outcome measure (respondent) | Studies | Measure used in meta‐analysis |
| Inattention | ADHD Rating Scale, Fourth Version (parent ratings) | No (data presented in an unusable format) | |
| ADHD Rating Scale, Fourth Version (clinician ratings) | Yes | ||
| Yes | |||
| Yes | |||
| ADHD Rating Scale, Fourth Version (investigator/research personnel ratings) | Yes | ||
| Conners’ Rating Scale (parent ratings) | Yes | ||
| No (only study that included long‐term data) | |||
| Conners’ Rating Scale (teacher ratings) | No (only study that included long‐term data) | ||
| IOWA Conners’ Rating Scale | Yes | ||
| SKAMP scale (teacher ratings) | No (data not available) | ||
| SKAMP scale (investigator/research personnel ratings) | Yes | ||
| Yes | |||
| Hyperactivity/impulsivity | ADHD Rating Scale, Fourth Version (parent ratings) | No (data presented in an unusable format) | |
| ADHD Rating Scale, Fourth Version (clinician ratings) | Yes | ||
| Yes | |||
| Yes | |||
| ADHD Rating Scale, Fourth Version (investigator/research personnel ratings) | Yes | ||
| Conners’ Rating Scale (parent ratings) | No (only study that included long‐term data) | ||
| Yes | |||
| Conners’ Rating Scale (teacher ratings) | No (only study that included long‐term data) | ||
| Yes | |||
| Total core symptom score | ADHD Rating Scale, Fourth Version (parent ratings) | Yes | |
| Yes | |||
| ADHD Rating Scale, Fourth Version (teacher ratings) | Yes | ||
| ADHD Rating Scale, Fourth Version (clinician ratings) | Yes | ||
| Yes | |||
| Yes | |||
| ADHD Rating Scale, Fourth Version (investigator/research personnel ratings) | Yes | ||
| No (no data available) | |||
| Conners’ Rating Scale (parent ratings) | No (data presented in an unusable format) | ||
| Yes | |||
| No (data not available) | |||
| No (only study that included long‐term data) | |||
| Yes | |||
| No (data not available) | |||
| No (data presented in an unusable format) | |||
| Conners’ Rating Scale (teacher ratings) | No (no data available) | ||
| Yes | |||
| No (only study that included long‐term data) | |||
| Yes | |||
| No (data not available) | |||
| No (data presented in an unusable format) | |||
| Conners’ Global Index (parent ratings) | Yes | ||
| Yes | |||
| Conners’ Global Index (teacher ratings) | Yes | ||
| Conners’ Abbreviated Symptom Questionnaire (parent ratings) | Yes | ||
| Conners’ Abbreviated Symptom Questionnaire (teacher ratings) | Yes | ||
| ADHD Questionnaire (developed within study) (parent ratings) | No (data presented in an unusable format) | ||
| ADHD Questionnaire (developed within study) (teacher ratings) | No (data presented in an unusable format) | ||
| SKAMP scale (investigator/research personnel ratings) | Yes | ||
| ADHD: attention deficit hyperactivity disorder. | |||
| Outcome or subgroup title | No. of studies | No. of participants | Statistical method | Effect size |
| 1 Total ADHD symptom score ‐ parent ratings Show forest plot | 7 | 1247 | Std. Mean Difference (IV, Random, 95% CI) | ‐0.57 [‐0.86, ‐0.27] |
| 2 Hyperactivity/impulsivity ‐ parent ratings Show forest plot | 2 | 132 | Std. Mean Difference (IV, Random, 95% CI) | ‐0.54 [‐0.89, ‐0.19] |
| 3 Total ADHD symptom score ‐ teacher ratings Show forest plot | 5 | 745 | Std. Mean Difference (IV, Random, 95% CI) | ‐0.55 [‐0.83, ‐0.27] |
| 4 Hyperactivity/impulsivity ‐ teacher ratings Show forest plot | 1 | Std. Mean Difference (IV, Random, 95% CI) | Subtotals only | |
| 5 Inattention ‐ teacher ratings Show forest plot | 1 | Std. Mean Difference (IV, Random, 95% CI) | Subtotals only | |
| 6 Total ADHD symptom score ‐ clinician ratings Show forest plot | 3 | 813 | Std. Mean Difference (IV, Random, 95% CI) | ‐0.84 [‐1.32, ‐0.36] |
| 7 Hyperactivity/impulsivity ‐ clinician ratings Show forest plot | 3 | 813 | Std. Mean Difference (IV, Random, 95% CI) | ‐0.75 [‐1.28, ‐0.23] |
| 8 Inattention ‐ clinician ratings Show forest plot | 3 | 813 | Std. Mean Difference (IV, Random, 95% CI) | ‐0.78 [‐1.26, ‐0.30] |
| 9 Total ADHD symptom score ‐ investigator/research personnel ratings Show forest plot | 3 | 630 | Std. Mean Difference (IV, Random, 95% CI) | ‐1.15 [‐1.87, ‐0.44] |
| 10 Hyperactivity/impulsivity ‐ investigator/research personnel ratings Show forest plot | 2 | 280 | Std. Mean Difference (IV, Random, 95% CI) | ‐1.46 [‐1.83, ‐1.08] |
| 11 Inattention ‐ investigator/research personnel ratings Show forest plot | 4 | 634 | Std. Mean Difference (IV, Random, 95% CI) | ‐0.73 [‐1.42, ‐0.04] |
| 12 Proportion of responders (Clinical Global Impression ‐ Improvement; CGI ‐ I) Show forest plot | 9 | 2207 | Risk Ratio (M‐H, Random, 95% CI) | 3.36 [2.48, 4.55] |
| 13 Clinical Global Impression ‐ Severity (CGI ‐ S) score Show forest plot | 2 | 86 | Std. Mean Difference (IV, Random, 95% CI) | ‐0.86 [‐1.72, ‐0.01] |
| 14 Academic performance Show forest plot | 8 | 826 | Std. Mean Difference (IV, Random, 95% CI) | 0.56 [0.39, 0.73] |
| 15 Quality of life Show forest plot | 1 | Std. Mean Difference (IV, Random, 95% CI) | Subtotals only | |
| 16 Retention: proportion of participants who completed the trial Show forest plot | 11 | 2381 | Risk Ratio (M‐H, Random, 95% CI) | 1.03 [0.97, 1.10] |
| 17 Proportion of participants experiencing decreased appetite Show forest plot | 11 | 2467 | Risk Ratio (M‐H, Random, 95% CI) | 6.31 [2.58, 15.46] |
| 18 Proportion of participants experiencing insomnia/trouble sleeping Show forest plot | 10 | 2429 | Risk Ratio (M‐H, Random, 95% CI) | 3.80 [2.12, 6.83] |
| 19 Proportion of participants experiencing abdominal pain Show forest plot | 10 | 2155 | Risk Ratio (M‐H, Random, 95% CI) | 1.44 [1.03, 2.00] |
| 20 Proportion of participants experiencing nausea/vomiting Show forest plot | 6 | 1579 | Risk Ratio (M‐H, Random, 95% CI) | 1.63 [1.04, 2.56] |
| 21 Proportion of participants experiencing headaches Show forest plot | 9 | 2091 | Risk Ratio (M‐H, Random, 95% CI) | 0.93 [0.75, 1.16] |
| 22 Proportion of participants experiencing anxiety/nervousness Show forest plot | 5 | 1088 | Risk Ratio (M‐H, Random, 95% CI) | 1.22 [0.78, 1.93] |
| 23 Proportion of participants who experienced at least one adverse event Show forest plot | 6 | 1742 | Risk Ratio (M‐H, Random, 95% CI) | 1.30 [1.18, 1.44] |
| 24 Proportion of participants who dropped out/withdrew due to an adverse event Show forest plot | 9 | 2160 | Risk Ratio (M‐H, Random, 95% CI) | 1.60 [0.86, 2.98] |
| Outcome or subgroup title | No. of studies | No. of participants | Statistical method | Effect size |
| 1 Total ADHD symptom score ‐ parent ratings Show forest plot | 7 | 1247 | Std. Mean Difference (IV, Random, 95% CI) | ‐0.57 [‐0.86, ‐0.27] |
| 1.1 Dexamphetamine | 1 | 28 | Std. Mean Difference (IV, Random, 95% CI) | ‐0.60 [‐1.36, 0.16] |
| 1.2 Lisdexamphetamine | 2 | 486 | Std. Mean Difference (IV, Random, 95% CI) | ‐0.72 [‐1.59, 0.14] |
| 1.3 Mixed amphetamine salts | 4 | 733 | Std. Mean Difference (IV, Random, 95% CI) | ‐0.44 [‐0.63, ‐0.24] |
| 2 Proportion of responders (CGI ‐ I) Show forest plot | 9 | 2205 | Risk Ratio (M‐H, Random, 95% CI) | 3.38 [2.51, 4.55] |
| 2.1 Dexamphetamine | 1 | 64 | Risk Ratio (M‐H, Random, 95% CI) | 5.4 [2.38, 12.25] |
| 2.2 Lisdexamphetamine | 4 | 1065 | Risk Ratio (M‐H, Random, 95% CI) | 3.62 [2.04, 6.41] |
| 2.3 Mixed amphetamine salts | 4 | 1076 | Risk Ratio (M‐H, Random, 95% CI) | 2.72 [2.14, 3.45] |
| 3 Academic performance Show forest plot | 8 | 826 | Std. Mean Difference (IV, Random, 95% CI) | 0.56 [0.39, 0.73] |
| 3.1 Dexamphetamine | 4 | 208 | Std. Mean Difference (IV, Random, 95% CI) | 0.40 [0.12, 0.67] |
| 3.2 Lisdexamphetamine | 1 | 226 | Std. Mean Difference (IV, Random, 95% CI) | 0.78 [0.51, 1.05] |
| 3.3 Mixed amphetamine salts | 3 | 392 | Std. Mean Difference (IV, Random, 95% CI) | 0.56 [0.29, 0.84] |
| 4 Retention: proportion of participants who completed the trial Show forest plot | 10 | 2364 | Risk Ratio (M‐H, Random, 95% CI) | 1.05 [0.99, 1.12] |
| 4.1 Dexamphetamine | 1 | 64 | Risk Ratio (M‐H, Random, 95% CI) | 1.03 [0.95, 1.12] |
| 4.2 Lisdexamphetamine | 4 | 1084 | Risk Ratio (M‐H, Random, 95% CI) | 1.14 [0.92, 1.42] |
| 4.3 Mixed amphetamine salts | 5 | 1216 | Risk Ratio (M‐H, Random, 95% CI) | 1.03 [0.96, 1.11] |
| 5 Proportion of participants who dropped out/withdrew due to an adverse event Show forest plot | 9 | 2161 | Risk Ratio (M‐H, Random, 95% CI) | 1.61 [0.86, 2.98] |
| 5.1 Dexamphetamine | 1 | 92 | Risk Ratio (M‐H, Random, 95% CI) | 3.0 [0.13, 71.78] |
| 5.2 Lisdexamphetamine | 4 | 1085 | Risk Ratio (M‐H, Random, 95% CI) | 2.03 [0.70, 5.91] |
| 5.3 Mixed amphetamine salts | 4 | 984 | Risk Ratio (M‐H, Random, 95% CI) | 1.27 [0.53, 3.06] |
| 6 Proportion of participants experiencing decreased appetite Show forest plot | 10 | 2273 | Risk Ratio (M‐H, Random, 95% CI) | 6.20 [2.44, 15.71] |
| 6.1 Dexamphetamine | 1 | 68 | Risk Ratio (M‐H, Random, 95% CI) | 1.41 [0.95, 2.11] |
| 6.2 Lisdexampheatmine | 4 | 1081 | Risk Ratio (M‐H, Random, 95% CI) | 9.83 [5.08, 19.02] |
| 6.3 Mixed amphetamine salts | 5 | 1124 | Risk Ratio (M‐H, Random, 95% CI) | 6.42 [1.56, 26.52] |
| 7 Proportion of participants experiencing insomnia/trouble sleeping Show forest plot | 10 | 2429 | Risk Ratio (M‐H, Random, 95% CI) | 3.80 [2.12, 6.83] |
| 7.1 Dexamphetamine | 1 | 68 | Risk Ratio (M‐H, Random, 95% CI) | 2.14 [1.41, 3.26] |
| 7.2 Lisdexamphetamine | 4 | 1081 | Risk Ratio (M‐H, Random, 95% CI) | 5.91 [2.84, 12.29] |
| 7.3 Mixed amphetamine salts | 5 | 1280 | Risk Ratio (M‐H, Random, 95% CI) | 3.34 [1.25, 8.96] |
| 8 Proportion of participants experiencing abdominal pain Show forest plot | 10 | 2155 | Risk Ratio (M‐H, Random, 95% CI) | 1.44 [1.03, 2.00] |
| 8.1 Dexamphetamine | 1 | 68 | Risk Ratio (M‐H, Random, 95% CI) | 0.67 [0.27, 1.67] |
| 8.2 Lisdexamphetamine | 3 | 769 | Risk Ratio (M‐H, Random, 95% CI) | 1.29 [0.76, 2.19] |
| 8.3 Mixed amphetamine salts | 6 | 1318 | Risk Ratio (M‐H, Random, 95% CI) | 1.69 [1.17, 2.45] |
| 9 Proportion of participants experiencing headaches Show forest plot | 9 | 2063 | Risk Ratio (M‐H, Random, 95% CI) | 0.93 [0.75, 1.16] |
| 9.1 Dexamphetamine | 1 | 68 | Risk Ratio (M‐H, Random, 95% CI) | 1.0 [0.42, 2.36] |
| 9.2 Lisdexamphetamine | 5 | 1077 | Risk Ratio (M‐H, Random, 95% CI) | 1.07 [0.73, 1.57] |
| 9.3 Mixed amphetamine salts | 3 | 918 | Risk Ratio (M‐H, Random, 95% CI) | 0.85 [0.64, 1.14] |
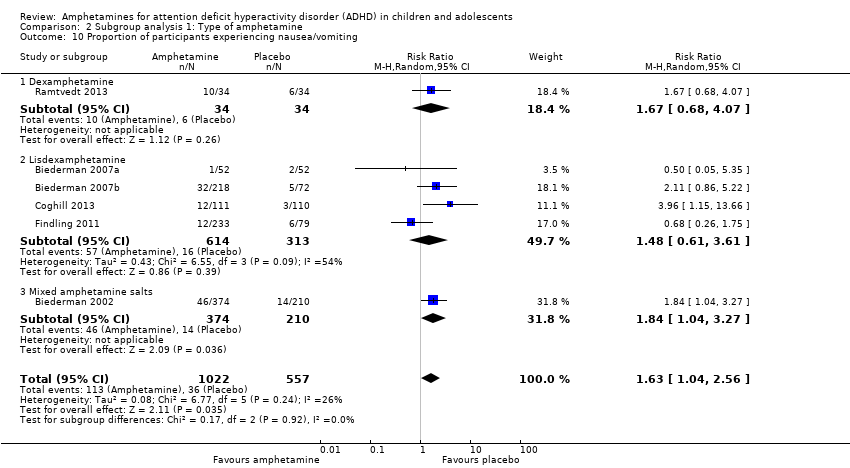
| 10 Proportion of participants experiencing nausea/vomiting Show forest plot | 6 | 1579 | Risk Ratio (M‐H, Random, 95% CI) | 1.63 [1.04, 2.56] |
| 10.1 Dexamphetamine | 1 | 68 | Risk Ratio (M‐H, Random, 95% CI) | 1.67 [0.68, 4.07] |
| 10.2 Lisdexamphetamine | 4 | 927 | Risk Ratio (M‐H, Random, 95% CI) | 1.48 [0.61, 3.61] |
| 10.3 Mixed amphetamine salts | 1 | 584 | Risk Ratio (M‐H, Random, 95% CI) | 1.84 [1.04, 3.27] |
| Outcome or subgroup title | No. of studies | No. of participants | Statistical method | Effect size |
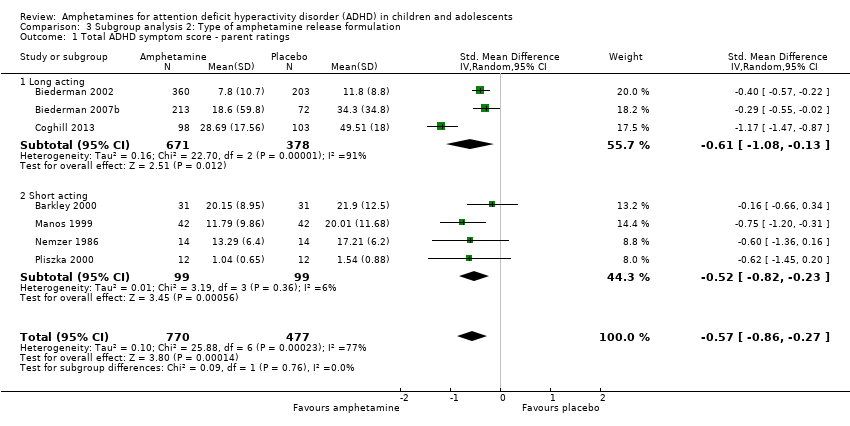
| 1 Total ADHD symptom score ‐ parent ratings Show forest plot | 7 | 1247 | Std. Mean Difference (IV, Random, 95% CI) | ‐0.57 [‐0.86, ‐0.27] |
| 1.1 Long acting | 3 | 1049 | Std. Mean Difference (IV, Random, 95% CI) | ‐0.61 [‐1.08, ‐0.13] |
| 1.2 Short acting | 4 | 198 | Std. Mean Difference (IV, Random, 95% CI) | ‐0.52 [‐0.82, ‐0.23] |
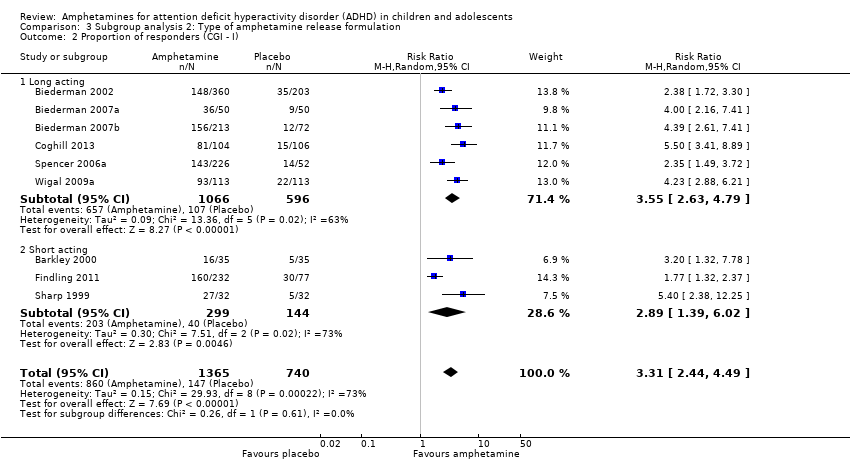
| 2 Proportion of responders (CGI ‐ I) Show forest plot | 9 | 2105 | Risk Ratio (M‐H, Random, 95% CI) | 3.31 [2.44, 4.49] |
| 2.1 Long acting | 6 | 1662 | Risk Ratio (M‐H, Random, 95% CI) | 3.55 [2.63, 4.79] |
| 2.2 Short acting | 3 | 443 | Risk Ratio (M‐H, Random, 95% CI) | 2.89 [1.39, 6.02] |
| 3 Academic performance Show forest plot | 8 | 826 | Std. Mean Difference (IV, Random, 95% CI) | 0.56 [0.39, 0.73] |
| 3.1 Long acting | 4 | 494 | Std. Mean Difference (IV, Random, 95% CI) | 0.59 [0.36, 0.81] |
| 3.2 Short acting | 4 | 332 | Std. Mean Difference (IV, Random, 95% CI) | 0.48 [0.15, 0.81] |
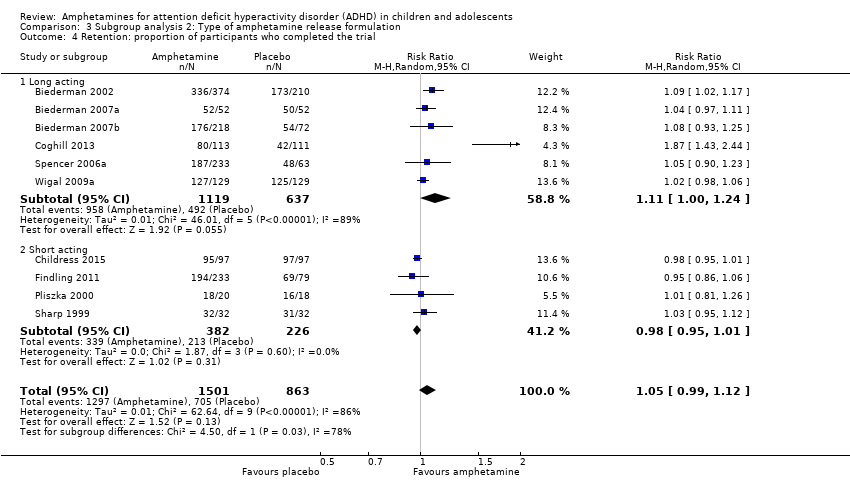
| 4 Retention: proportion of participants who completed the trial Show forest plot | 10 | 2364 | Risk Ratio (M‐H, Random, 95% CI) | 1.05 [0.99, 1.12] |
| 4.1 Long acting | 6 | 1756 | Risk Ratio (M‐H, Random, 95% CI) | 1.11 [1.00, 1.24] |
| 4.2 Short acting | 4 | 608 | Risk Ratio (M‐H, Random, 95% CI) | 0.98 [0.95, 1.01] |
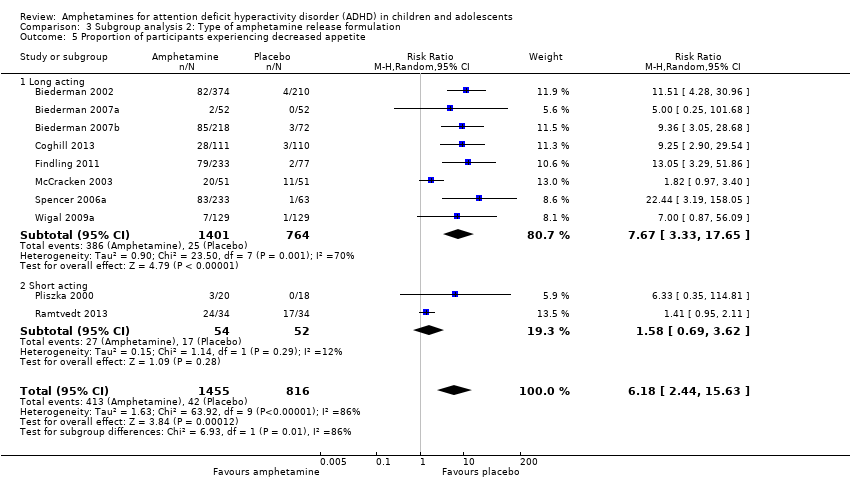
| 5 Proportion of participants experiencing decreased appetite Show forest plot | 10 | 2271 | Risk Ratio (M‐H, Random, 95% CI) | 6.18 [2.44, 15.63] |
| 5.1 Long acting | 8 | 2165 | Risk Ratio (M‐H, Random, 95% CI) | 7.67 [3.33, 17.65] |
| 5.2 Short acting | 2 | 106 | Risk Ratio (M‐H, Random, 95% CI) | 1.58 [0.69, 3.62] |
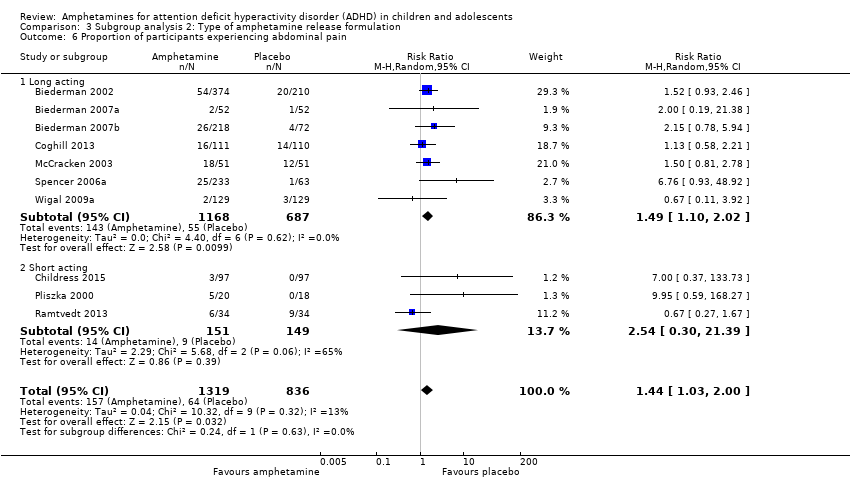
| 6 Proportion of participants experiencing abdominal pain Show forest plot | 10 | 2155 | Risk Ratio (M‐H, Random, 95% CI) | 1.44 [1.03, 2.00] |
| 6.1 Long acting | 7 | 1855 | Risk Ratio (M‐H, Random, 95% CI) | 1.49 [1.10, 2.02] |
| 6.2 Short acting | 3 | 300 | Risk Ratio (M‐H, Random, 95% CI) | 2.54 [0.30, 21.39] |
| Outcome or subgroup title | No. of studies | No. of participants | Statistical method | Effect size |
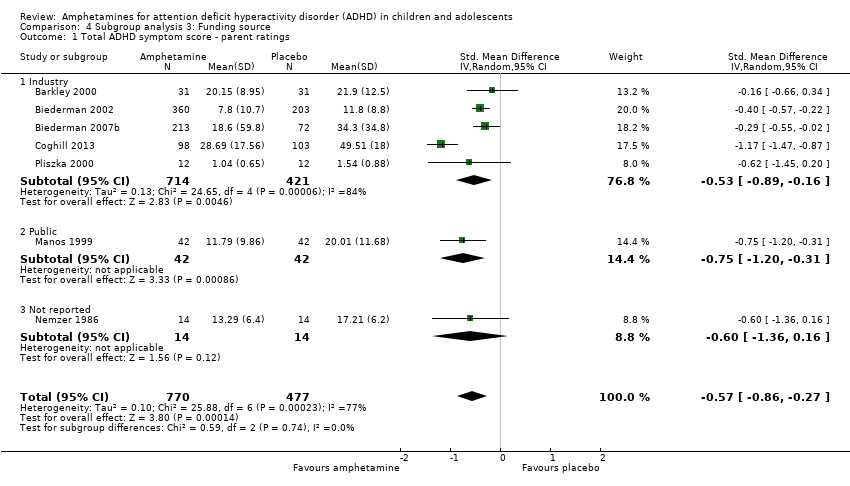
| 1 Total ADHD symptom score ‐ parent ratings Show forest plot | 7 | 1247 | Std. Mean Difference (IV, Random, 95% CI) | ‐0.57 [‐0.86, ‐0.27] |
| 1.1 Industry | 5 | 1135 | Std. Mean Difference (IV, Random, 95% CI) | ‐0.53 [‐0.89, ‐0.16] |
| 1.2 Public | 1 | 84 | Std. Mean Difference (IV, Random, 95% CI) | ‐0.75 [‐1.20, ‐0.31] |
| 1.3 Not reported | 1 | 28 | Std. Mean Difference (IV, Random, 95% CI) | ‐0.60 [‐1.36, 0.16] |
| 2 Proportion of responders (CGI ‐ I) Show forest plot | 9 | 2210 | Risk Ratio (M‐H, Random, 95% CI) | 3.37 [2.50, 4.53] |
| 2.1 Industry | 8 | 2146 | Risk Ratio (M‐H, Random, 95% CI) | 3.24 [2.39, 4.40] |
| 2.2 Not reported | 1 | 64 | Risk Ratio (M‐H, Random, 95% CI) | 5.4 [2.38, 12.25] |
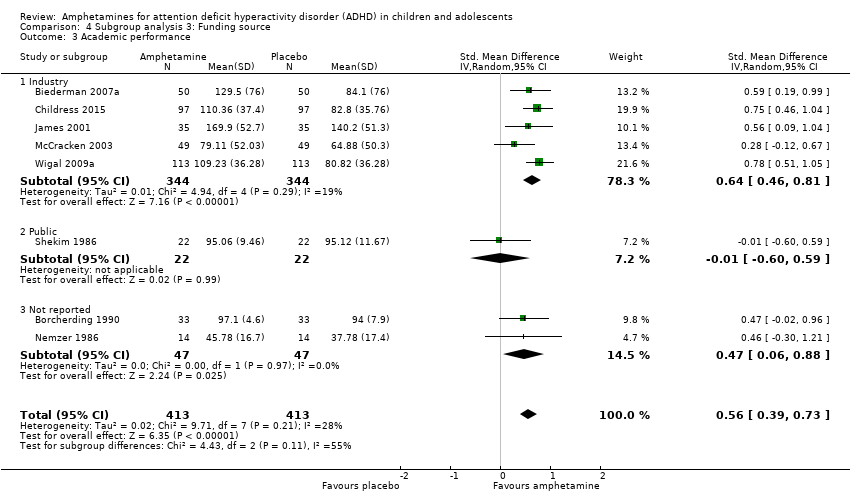
| 3 Academic performance Show forest plot | 8 | 826 | Std. Mean Difference (IV, Random, 95% CI) | 0.56 [0.39, 0.73] |
| 3.1 Industry | 5 | 688 | Std. Mean Difference (IV, Random, 95% CI) | 0.64 [0.46, 0.81] |
| 3.2 Public | 1 | 44 | Std. Mean Difference (IV, Random, 95% CI) | ‐0.01 [‐0.60, 0.59] |
| 3.3 Not reported | 2 | 94 | Std. Mean Difference (IV, Random, 95% CI) | 0.47 [0.06, 0.88] |
| Outcome or subgroup title | No. of studies | No. of participants | Statistical method | Effect size |
| 1 Total ADHD symptom score ‐ parent ratings Show forest plot | 7 | 1247 | Std. Mean Difference (IV, Fixed, 95% CI) | ‐0.52 [‐0.64, ‐0.40] |
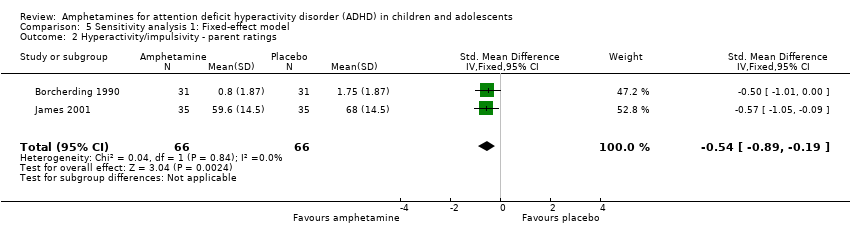
| 2 Hyperactivity/impulsivity ‐ parent ratings Show forest plot | 2 | 132 | Std. Mean Difference (IV, Fixed, 95% CI) | ‐0.54 [‐0.89, ‐0.19] |
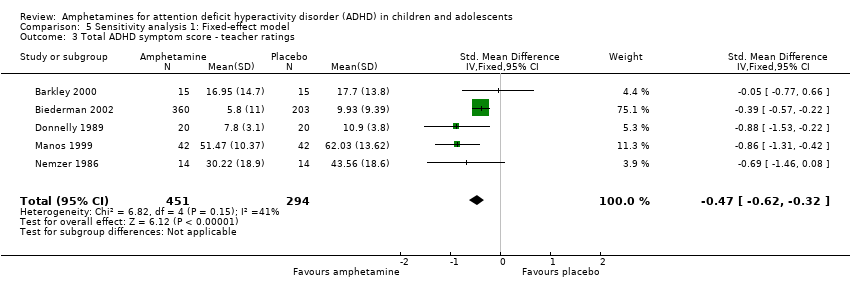
| 3 Total ADHD symptom score ‐ teacher ratings Show forest plot | 5 | 745 | Std. Mean Difference (IV, Fixed, 95% CI) | ‐0.47 [‐0.62, ‐0.32] |
| 4 Hyperactivity/impulsivity ‐ teacher ratings Show forest plot | 1 | Std. Mean Difference (IV, Fixed, 95% CI) | Subtotals only | |
| 5 Inattention ‐ teacher ratings Show forest plot | 1 | Std. Mean Difference (IV, Fixed, 95% CI) | Subtotals only | |
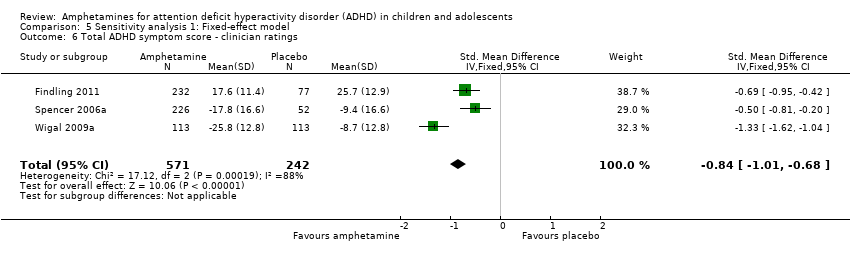
| 6 Total ADHD symptom score ‐ clinician ratings Show forest plot | 3 | 813 | Std. Mean Difference (IV, Fixed, 95% CI) | ‐0.84 [‐1.01, ‐0.68] |
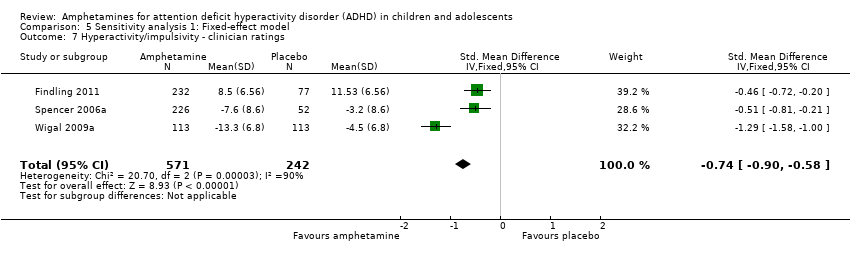
| 7 Hyperactivity/impulsivity ‐ clinician ratings Show forest plot | 3 | 813 | Std. Mean Difference (IV, Fixed, 95% CI) | ‐0.74 [‐0.90, ‐0.58] |
| 8 Inattention ‐ clinician ratings Show forest plot | 3 | 813 | Std. Mean Difference (IV, Fixed, 95% CI) | ‐0.77 [‐0.94, ‐0.61] |
| 9 Total ADHD symptom score ‐ investigator/research personnel ratings Show forest plot | 3 | 630 | Std. Mean Difference (IV, Fixed, 95% CI) | ‐1.08 [‐1.25, ‐0.91] |
| 10 Hyperactivity/impulsivity ‐ Investigator/research personnel ratings Show forest plot | 2 | 280 | Std. Mean Difference (IV, Fixed, 95% CI) | ‐1.50 [‐1.76, ‐1.23] |
| 11 Inattention ‐ investigator/research personnel ratings Show forest plot | 4 | 634 | Std. Mean Difference (IV, Fixed, 95% CI) | ‐0.76 [‐0.93, ‐0.60] |
| 12 Proportion of responders (CGI ‐ I) Show forest plot | 9 | 2207 | Risk Ratio (M‐H, Fixed, 95% CI) | 3.11 [2.68, 3.61] |
| 13 CGI ‐ S score Show forest plot | 2 | 86 | Std. Mean Difference (IV, Fixed, 95% CI) | ‐0.71 [‐1.15, ‐0.27] |
| 14 Quality of life Show forest plot | 1 | Std. Mean Difference (IV, Fixed, 95% CI) | Subtotals only | |
| 15 Academic performance Show forest plot | 8 | 826 | Std. Mean Difference (IV, Fixed, 95% CI) | 0.59 [0.45, 0.73] |
| 16 Retention: proportion of participants who completed the trial Show forest plot | 10 | 2364 | Risk Ratio (M‐H, Fixed, 95% CI) | 1.08 [1.04, 1.12] |
| 17 Proportion of participants who experienced at least one adverse event Show forest plot | 6 | 1742 | Risk Ratio (M‐H, Fixed, 95% CI) | 1.33 [1.20, 1.47] |
| 18 Proportion of participants who dropped out/withdrew due to an adverse event Show forest plot | 9 | 2160 | Risk Ratio (M‐H, Fixed, 95% CI) | 1.95 [1.08, 3.51] |
| 19 Proportion of participants experiencing decreased appetite Show forest plot | 11 | 2467 | Risk Ratio (M‐H, Fixed, 95% CI) | 5.57 [4.03, 7.68] |
| 20 Proportion of participants experiencing insomnia/trouble sleeping Show forest plot | 10 | 2429 | Risk Ratio (M‐H, Fixed, 95% CI) | 3.91 [2.82, 5.41] |
| 21 Proportion of participants experiencing abdominal pain Show forest plot | 10 | 2155 | Risk Ratio (M‐H, Fixed, 95% CI) | 1.57 [1.18, 2.08] |
| 22 Proportion of participants experiencing headaches Show forest plot | 9 | 2091 | Risk Ratio (M‐H, Fixed, 95% CI) | 0.95 [0.76, 1.18] |
| 23 Proportion of participants experiencing anxiety/nervousness Show forest plot | 5 | 1088 | Risk Ratio (M‐H, Fixed, 95% CI) | 1.21 [0.94, 1.56] |
| 24 Proportion of participants experiencing nausea/vomiting Show forest plot | 6 | 1579 | Risk Ratio (M‐H, Fixed, 95% CI) | 1.72 [1.20, 2.46] |