Tratamiento con ejercicios para la fatiga en la esclerosis múltiple
Información
- DOI:
- https://doi.org/10.1002/14651858.CD009956.pub2Copiar DOI

- Base de datos:
-
- Cochrane Database of Systematic Reviews
- Versión publicada:
-
- 11 septiembre 2015see what's new
- Tipo:
-
- Intervention
- Etapa:
-
- Review
- Grupo Editorial Cochrane:
-
Grupo Cochrane de Esclerosis múltiple y enfermedades raras del sistema nervioso central
- Copyright:
-
- Copyright © 2015 The Cochrane Collaboration. Published by John Wiley & Sons, Ltd.
Cifras del artículo
Altmetric:
Citado por:
Autores
Contributions of authors
| Roles and responsibilities | |
| Drafted the protocol | All review authors |
| Developed and ran the search strategy | MH with the assistance of Trials Search Co‐ordinator for the Cochrane Multiple Sclerosis Review Group |
| Obtained copies of trials | MH with the assistance of Trials Search Co‐ordinator for the Cochrane Multiple Sclerosis Review Group, where necessary |
| Selected which trials to include (2 people) | MH, IP |
| Extracted data from trials (2 people) | MH, research assistant (ME) |
| Entered data into Review Manager 5 | MH |
| Carried out the analysis | MH |
| Interpreted the analysis | All review authors |
| Drafted the final review | All review authors |
| Will update the review | MR |
Sources of support
Internal sources
-
Brain Center Rudolf Magnus and Center of Excellence for Rehabilitation Medicine, University Medical Center Utrecht and Rehabilitation Center De Hoogstraat, Utrecht, covered expenses and provided access to electronic databases and Internet for identification of studies, Netherlands.
-
The VU Medical Center, Amsterdam covered expenses for the independent librarian to enable the additional search in PyscINFO and SPORTDiscus, Netherlands.
External sources
-
No sources of support supplied
Declarations of interest
MH reported no competing interest.
IP reported no competing interest.
MB reported no competing interest.
EW reported no competing interest.
GK reported no competing interest.
No commercial party having a direct financial interest in the results of the research supporting this article has, or will, confer a benefit on the authors, or on any organization with which the authors are associated. None of the authors were involved in trials included in the present review.
Acknowledgements
The authors would like to thank Mariëlle Ellens (ME), MSc for her assistance in the data extraction and quality assessment of the included trials. In addition, we would like to thank the Cochrane Multiple Sclerosis and Rare Diseases of the Central Nervous System Review Group for their assistance during the search process.
Version history
| Published | Title | Stage | Authors | Version |
| 2015 Sep 11 | Exercise therapy for fatigue in multiple sclerosis | Review | Martin Heine, Ingrid van de Port, Marc B Rietberg, Erwin EH van Wegen, Gert Kwakkel | |
| 2012 Jul 11 | Exercise therapy for fatigue in multiple sclerosis | Protocol | Martin Heine, Marc B Rietberg, Erwin EH van Wegen, Ingrid van de Port, Gert Kwakkel | |
Differences between protocol and review
There are several differences between the original protocol and the present review.
-
The search strategy as described in the protocol included a fatigue section. However, during the search process we found that using this strategy we were likely to overlook some important articles. Hence, we combined two searches, one with fatigue and one without fatigue.
-
We added the PEDro scale to complement the Cochrane 'risk of bias' tool.
-
The quality assessment process was done by three independent researchers instead of two. MH performed all data acquisition roles (from search to data extraction). IP independently screened titles and abstracts and included full‐text articles. A research assistant independently extracted trial characteristics, trial data, and assessed the risk of bias.
-
We expanded the definition of multiple sclerosis, which allowed the criteria by Polman et al. to be used (Polman 2005; Polman 2011).
-
We limited the assessment of safety to MS relapses/exacerbations and falls rather than also including spasticity. Reporting of spasticity was very limited and heterogeneous in the outcomes used. Spasticity may be reconsidered as a secondary outcome in a future update of this review.
-
A cumulative meta‐analysis, as described in the protocol, was not possible given the lack of common underlying constructs with respect to number of studies with the same intervention type and outcome type.
Keywords
MeSH
Medical Subject Headings (MeSH) Keywords
Medical Subject Headings Check Words
Adult; Humans;
PICO

Study flow diagram.

Risk of bias graph: review authors' judgements about each risk of bias item presented as percentages across all included trials.

Funnel plot of trials comparing exercise versus a non‐exercise control condition.
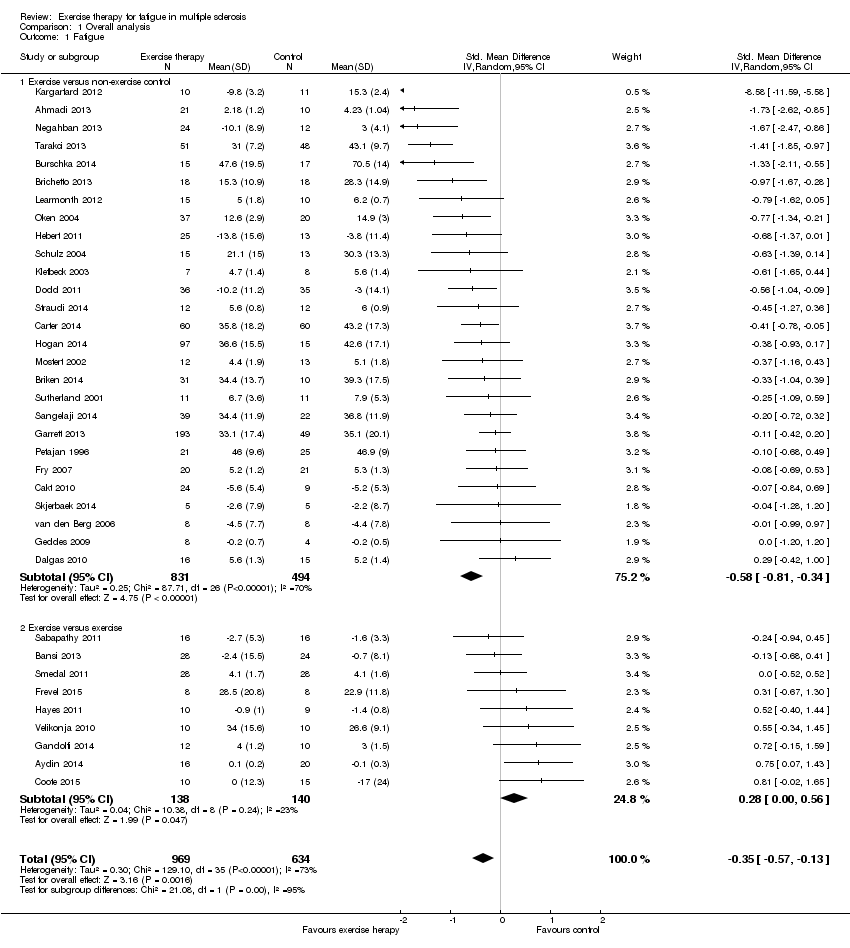
Comparison 1 Overall analysis, Outcome 1 Fatigue.

Comparison 2 Sensitivity analysis (Intervention contrast), Outcome 1 Fatigue.

Comparison 3 Per fatigue measure, Outcome 1 Fatigue.
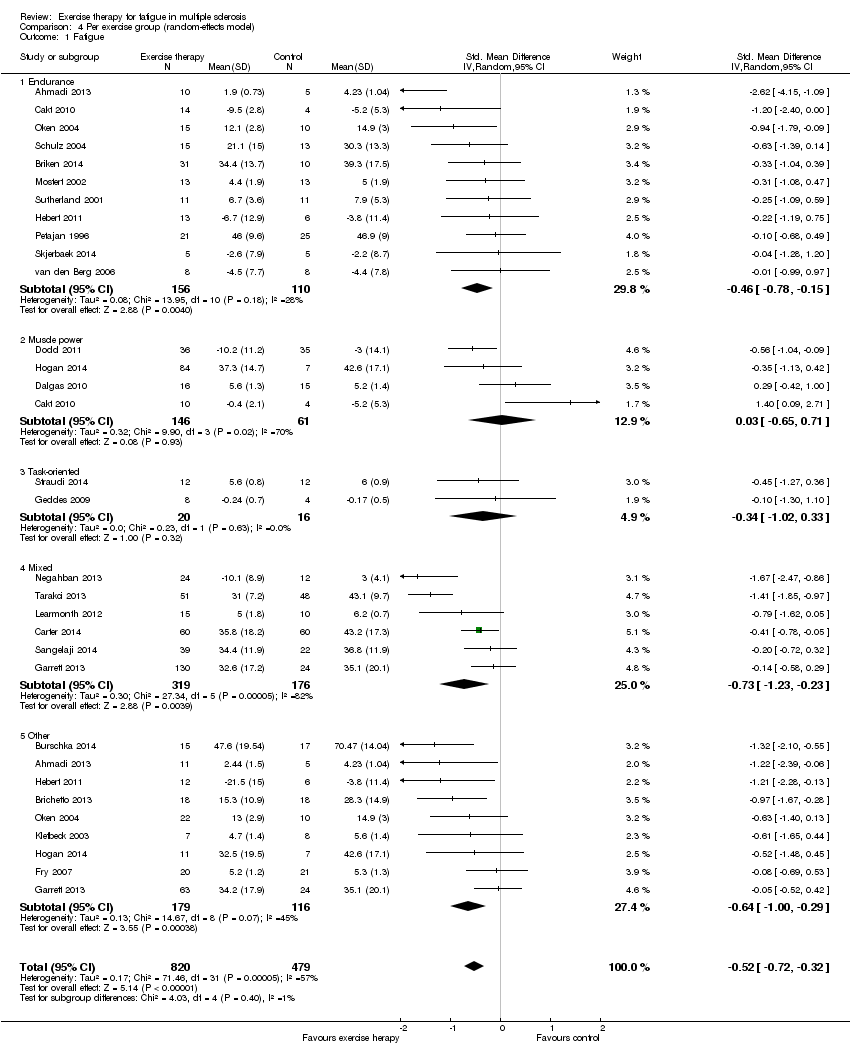
Comparison 4 Per exercise group (random‐effects model), Outcome 1 Fatigue.

Comparison 5 Per exercise group (fixed‐effect model), Outcome 1 Fatigue.

Comparison 6 Sensitivity analysis (methodological quality), Outcome 1 Fatigue.
| Effect of exercise therapy for fatigue in multiple sclerosis ‐ overall analysis | |||||
| Patient or population: people with multiple sclerosis | |||||
| Outcomes | Illustrative comparative risks* (95% CI) | No of participants | Quality of the evidence | Comments | |
| Assumed risk | Corresponding risk | ||||
| Control | Overall analysis | ||||
| Fatigue | No risk assumed | The mean fatigue outcome in the intervention groups was | 1603 | ⊕⊕⊕⊝ | Indirectness (‐1) |
| Exercise versus no‐exercise control | No risk assumed | The mean fatigue outcome in the intervention groups was 0.58 standard deviations lower (0.81 to 0.34 lower) compared to a no‐exercise control group | 1325 | ⊕⊕⊕⊝ | Indirectness (‐1) |
| Exercise versus exercise | No risk assumed | The mean fatigue outcome in the intervention groups was 0.28 standard deviations higher (0 to 0.56 higher) compared to an exercise control group | 278 | ⊕⊕⊝⊝ | Indirectness (‐1) Imprecision (‐1) |
| *The argumentation for downgrading the grades of evidence is provided in the footnotes. CI: confidence interval. | |||||
| GRADE Working Group grades of evidence | |||||
| 1 The presence of fatigue, beyond a pre‐defined level, was most often not an inclusion criterion. In addition, fatigue was not a primary outcome. | |||||
| Effect of exercise therapy for fatigue in multiple sclerosis ‐ analysis per fatigue measure | |||||
| Patient or population: people with multiple sclerosis | |||||
| Outcomes | Illustrative comparative risks* (95% CI) | No of participants | Quality of the evidence | Comments | |
| Assumed risk | Corresponding risk | ||||
| Control | Per fatigue measure | ||||
| Modified Fatigue Impact Scale | No risk assumed | The mean fatigue, on the Modified Fatigue Impact Scale, in the intervention groups was 0.40 standard deviations lower (0.58 to 0.22 lower) | 688 | ⊕⊕⊕⊝ | Indirectness (‐1) |
| Fatigue Severity Scale | No risk assumed | The mean fatigue, on the Fatigue Severity Scale, in the intervention groups was 0.56 standard deviations lower (0.95 to 17 lower) | 449 | ⊕⊕⊕⊝ | Indirectness (‐1) |
| Other | No risk assumed | The mean fatigue, on the 'other' included fatigue measures, in the intervention groups was 0.54 standard deviations lower (1.01 to 0.07 lower) | 167 | ⊕⊕⊝⊝ | Indirectness (‐1) Imprecision (‐1) |
| *The argumentation for downgrading the grades of evidence is provided in the footnotes. CI: confidence interval. | |||||
| GRADE Working Group grades of evidence | |||||
| 1 The presence of fatigue, beyond a pre‐defined level, was most often not an inclusion criterion. In addition, fatigue was not a primary outcome. | |||||
| Effect of exercise therapy for fatigue in multiple sclerosis ‐ analysis per exercise modality | |||||
| Patient or population: people with multiple sclerosis | |||||
| Outcomes | Illustrative comparative risks* (95% CI) | No of participants | Quality of the evidence | Comments | |
| Assumed risk | Corresponding risk | ||||
| Control | Per exercise group | ||||
| Endurance training | No risk assumed | The mean fatigue outcome in the intervention groups applying endurance training was 0.43 standard deviations lower (0.69 to 0.17 lower) | 266 | ⊕⊕⊕⊝ | Indirectness (‐1) |
| Muscle power training | No risk assumed | The mean fatigue outcome in the intervention groups applying muscle power training was 0.03 standard deviations higher (0.65 lower to 0.71 higher) | 207 | ⊕⊕⊝⊝ | Indirectness (‐1) Imprecision (‐1) |
| Task‐oriented training | No risk assumed | The mean fatigue outcome in the intervention groups applying task‐oriented training was 0.34 standard deviations lower (1.02 lower to 0.33 higher) | 36 | ⊕⊝⊝⊝ | Indirectness (‐1) Imprecision (‐2) |
| Mixed training | No risk assumed | The mean fatigue outcome in the intervention groups applying mixed training was 0.73 standard deviations lower (1.23 to 0.23 lower) | 495 | ⊕⊕⊕⊝ | Indirectness (‐1) |
| 'Other' training | No risk assumed | The mean fatigue outcome in the intervention groups applying 'Other' types of training was 0.54 standard deviations lower (0.79 to 0.29 lower) | 295 | ⊕⊕⊝⊝ | Indirectness (‐1) Imprecision (‐1) |
| *The argumentation for downgrading the grades of evidence is provided in the footnotes. The data is some sub‐groups was heterogeneous, and in some homogeneous. Hence, data for this 'Summary of findings' table is extracted from Analysis 4.1 and 5.1. CI: confidence interval. | |||||
| GRADE Working Group grades of evidence | |||||
| 1 The presence of fatigue, beyond a pre‐defined level, was most often not an inclusion criterion. In addition, fatigue was not a primary outcome. | |||||
| Study ID | Fatigue scale | ITT | 1 | 2 | 3 | 4 | 5 | 6 | 7 | 8 | 9 | 10 | Total score |
| Ahmadi 2013 | FSS | no | 1 | 0 | 1 | 0 | 0 | 0 | 1 | 1 | 1 | 1 | 6 |
| Aydin 2014 | FSS | no | 1 | 0 | 1 | 0 | 0 | 0 | 1 | 0 | 1 | 1 | 5 |
| Bansi 2013 | FSMC | no | 1 | 1 | 1 | 0 | 0 | 0 | 1 | 1 | 1 | 1 | 7 |
| Brichetto 2013 | MFIS | no | 1 | 0 | 1 | 0 | 0 | 0 | 1 | 1 | 1 | 1 | 6 |
| Briken 2014 | MFIS | no | 1 | 1 | 0 | 0 | 0 | 0 | 1 | 0 | 1 | 1 | 5 |
| Burschka 2014 | FSMC | no | 0 | 0 | 0 | 0 | 0 | 0 | 0 | 0 | 1 | 1 | 2 |
| Cakt 2010 | FSS | no | 1 | 1 | 1 | 0 | 0 | 0 | 0 | 0 | 1 | 1 | 5 |
| Carter 2014 | MFIS | yes | 1 | 1 | 1 | 0 | 0 | 0 | 1 | 1 | 1 | 1 | 7 |
| Castro‐Sanchez 2012 | MFIS, FSS | no | 1 | 1 | 1 | 0 | 0 | 0 | 1 | 0 | 1 | 1 | 6 |
| Collett 2011 | FSS | yes | 1 | 1 | 1 | 0 | 0 | 0 | 1 | 1 | 1 | 1 | 7 |
| Coote 2014 | MFIS | no | 1 | 1 | 1 | 0 | 0 | 0 | 0 | 1 | 1 | 1 | 6 |
| Dalgas 2010 | FSS | no | 1 | 1 | 1 | 0 | 0 | 0 | 0 | 1 | 1 | 1 | 6 |
| Dettmers 2009 | MFIS | no | 1 | 1 | 1 | 0 | 0 | 0 | 0 | 1 | 0 | 0 | 4 |
| Dodd 2011 | MFIS | yes | 1 | 1 | 1 | 0 | 0 | 0 | 1 | 1 | 1 | 1 | 7 |
| Frevel 2014 | MFIS, FSS | no | 1 | 0 | 1 | 0 | 0 | 0 | 1 | 0 | 1 | 1 | 5 |
| Fry 2007 | FSS | no | 1 | 0 | 1 | 0 | 0 | 0 | 1 | 1 | 0 | 1 | 5 |
| Gandolfi 2014 | FSS | no | 1 | 1 | 1 | 0 | 0 | 0 | 0 | 1 | 1 | 1 | 6 |
| Garrett 2013 | MFIS | no | 1 | 1 | 1 | 0 | 0 | 0 | 0 | 1 | 1 | 1 | 6 |
| Geddes 2009 | FSS | no | 1 | 0 | 1 | 0 | 0 | 0 | 0 | 1 | 1 | 1 | 5 |
| Hayes 2011 | FSS | no | 1 | 0 | 1 | 0 | 0 | 0 | 1 | 1 | 1 | 1 | 6 |
| Hebert 2011 | MFIS | yes | 1 | 1 | 1 | 0 | 0 | 0 | 1 | 1 | 1 | 1 | 7 |
| Hogan 2014 | MFIS | no | 1 | 1 | 0 | 0 | 0 | 0 | 0 | 1 | 1 | 1 | 5 |
| Kargarfard 2012 | MFIS | yes | 1 | 1 | 1 | 0 | 0 | 0 | 0 | 1 | 1 | 1 | 6 |
| Klefbeck 2003 | FSS | no | 1 | 0 | 1 | 0 | 0 | 0 | 1 | 0 | 1 | 1 | 5 |
| Learmonth 2011 | FSS | yes | 1 | 1 | 1 | 0 | 0 | 0 | 0 | 1 | 1 | 1 | 6 |
| McCullagh 2008 | MFIS | no | 0 | 0 | 1 | 0 | 0 | 0 | 0 | 1 | 1 | 1 | 4 |
| Mori 2011 | FSS | no | 1 | 0 | 1 | 0 | 0 | 0 | 1 | 1 | 0 | 0 | 4 |
| Mostert 2002 | FSS | no | 1 | 0 | 1 | 0 | 0 | 0 | 0 | 0 | 0 | 1 | 3 |
| Negahban 2013 | FSS | no | 1 | 0 | 1 | 0 | 0 | 0 | 1 | 1 | 1 | 1 | 6 |
| Oken 2004 | MFI (general) | no | 1 | 0 | 1 | 0 | 0 | 0 | 0 | 1 | 0 | 1 | 4 |
| Petajan 1996 | POMS fatigue, FSS | no | 1 | 0 | 1 | 0 | 0 | 0 | 0 | 1 | 0 | 1 | 4 |
| Plow 2009 | MFIS | no | 1 | 0 | 0 | 0 | 0 | 0 | 0 | 1 | 0 | 0 | 2 |
| Rampello 2007 | MFIS | no | 1 | 0 | 1 | 0 | 0 | 0 | 0 | 1 | 1 | 1 | 5 |
| Sabapathy 2010 | MFIS | no | 1 | 0 | 1 | 0 | 0 | 0 | 0 | 1 | 1 | 1 | 5 |
| Sangelaji 2014 | FSS | no | 1 | 0 | 1 | 0 | 0 | 0 | 0 | 1 | 0 | 0 | 3 |
| Schulz 2004 | MFIS | no | 1 | 0 | 0 | 0 | 0 | 0 | 1 | 1 | 1 | 1 | 5 |
| Smedal 2011 | FSS | yes | 1 | 0 | 1 | 0 | 0 | 0 | 1 | 1 | 1 | 1 | 6 |
| Skjerbaek 2014 | FSMC | no | 1 | 1 | 1 | 0 | 0 | 0 | 1 | 1 | 1 | 1 | 7 |
| Straudi 2014 | FSS | yes | 1 | 0 | 1 | 0 | 0 | 0 | 1 | 1 | 1 | 1 | 6 |
| Surakka 2004 | FSS | no | 1 | 0 | 1 | 0 | 0 | 0 | 0 | 1 | 1 | 1 | 5 |
| Sutherland 2001 | POMS fatigue | no | 1 | 0 | 1 | 0 | 0 | 0 | 1 | 1 | 1 | 1 | 6 |
| Tarakci 2013 | FSS | no | 1 | 1 | 1 | 0 | 0 | 0 | 1 | 1 | 1 | 1 | 7 |
| van den Berg 2006 | FSS | no | 1 | 1 | 1 | 0 | 0 | 0 | 0 | 1 | 1 | 1 | 7 |
| Velikonja 2010 | MFIS | no | 1 | 0 | 0 | 0 | 0 | 0 | 1 | 0 | 0 | 1 | 4 |
| Wier 2011 | FSS | no | 1 | 0 | 1 | 0 | 0 | 0 | 1 | 1 | 1 | 0 | 5 |
| % of trials | 96% | 42% | 87% | 0% | 0% | 0% | 53% | 80% | 80% | 89% | |||
| Risk of bias assessment based on the PEDro scale; see Appendix 5 for abbreviations. 1: Random allocation. 2: Concealed allocation. 3: Groups similar at baseline on disease severity, fatigue, and depression (if reported). 4: Blinding of all participants (zero per definition). 5: Blinding of all therapists. 6: Blinding of assessors. 7: Measures of key outcome (fatigue) > 85% of participants initially allocated to group (rated for fatigue outcome). 8: All participants of whom outcome is available received treatment or control; if not, intention‐to‐treat (ITT) analysis was performed. 9: Between‐group statistics of fatigue outcome reported. 10: Point measures and measures of variability for fatigue provided. | |||||||||||||
| Study | Time (i.e. duration of intervention) | Fatigue scale | Effect | Other outcomes | Effect |
| Ahmadi 2013 Compared aerobic training vs. control | 8 weeks | FSS | ‐ | BBS Walk time Walk distance BDI BAI | + ‐ + ns ns |
| Ahmadi 2013 Compared yoga vs. control | 8 weeks | FSS | ‐ | BBS Walk time Walk distance BDI BAI | + ns + ‐ ‐ |
| Brichetto 2013 Compared Nintendo® Wii® balance training vs. control | 4 weeks | MFIS | ns | BBS Open‐eye stabilometry Closed‐eye stabilometry | + ‐ ‐ |
| Briken 2014 Compared arm‐ergometry vs. control | 10 weeks | MFIS | ‐ | VO2peak 6MWT SDMT VLMT TAP (alertness) TAP (shift of attention) LPS RWT IDS ‐ SR30 | ns + ns + ns ‐ ns ns ‐ |
| Briken 2014 Compared rowing vs. control | 10 weeks | MFIS | ns | VO2peak 6MWT SDMT VLMT TAP (alertness) TAP (shift of attention) LPS RWT IDS ‐ SR30 | ns ns ns + ns ns ns ns ns |
| Briken 2014 Compared bicycling vs. control | 10 weeks | MFIS | ns | VO2peak 6MWT SDMT VLMT TAP (alertness) TAP (shift of attention) LPS RWT IDS ‐ SR30 | + + ns + ‐ ‐ ns ns ‐ |
| Burschka 2014 Compared Tai‐Chi yoga vs. control * no change of fatigue in experimental group, increase in fatigue in control group | 24 weeks | FSMC* | ‐ | Balance Co‐ordination CES‐D QLS | + + ‐ + |
| Cakt 2010 Compared progressive resistance training vs. control | 8 weeks | FSS | ‐ | Duration of exercise Wmax TUG DGI FR FES 10MWT BDI SF‐36 | + + ‐ + + ‐ ‐ ‐ unk |
| Cakt 2010 Compared home‐based exercise vs. control | 8 weeks | FSS | ns | Duration of exercise Wmax TUG DGI FR FES 10MWT BDI SF‐36 | ns ns ns ns ns ns ns ns unk |
| Carter 2014 Compared a pragmatic exercise intervention vs. control | 12 weeks | MFIS | ‐ | GLTEQ Accelerometer MSQoL‐54 MSFC 6MWT EDSS | + + + ns ns ns |
| Castro‐Sanchez 2012 Compared Ai‐Chi aquatic programme vs. control | 20 weeks | FSS MFIS ‐ physical ‐ cognitive ‐ psychosocial | ns ‐ ns ns | Pain MPQ‐PRI MPQ‐PPI RMDQ Spasm ‐ physical ‐ psychological BDI BI | ‐ ‐ ns ‐ ‐ ‐ ‐ ‐ ns |
| Dalgas 2010 Compared progressive resistance training vs. control | 12 weeks | FSS MFI‐20 ‐ General fatigue ‐ Physical fatigue ‐ Reduced activity ‐ Reduced motivation ‐ Mental fatigue | ‐ ‐ ns ns ns ns | MDI SF‐36 ‐ PCS ‐ MCS MVC (knee extensor) FS (%) | ‐ ‐ ns + + |
| Dodd 2011 Compared progressive resistance training vs. control | 10 weeks | MFIS ‐ physical ‐ cognitive ‐ psychosocial | ‐ ‐ ns ns | MSIS‐88 muscle stiffness MSIS‐88 muscle spasms 2MWT Walking speed Leg press endurance (repetitions) Reversed leg press endurance (repetitions) 1RM leg press (kg) 1RM reversed leg press (kg) WHOQoL‐BREF overall quality of life WHOQoL‐BREF overall health WHOQoL‐BREF physical health | ns ns ns ns ns + ns ns ns ns + |
| Fry 2007 Compared inspiratory muscle training vs. control | 10 weeks | No interaction effects reported | |||
| Garrett 2013 Compared physiotherapist‐led exercise vs. control | 10 weeks | MFIS ‐ physical ‐ cognitive | ‐ ‐ ns | MSIS‐29 physical component MSIS‐29 cognitive component 6MWT | ‐ ‐ + |
| Garrett 2013 Compared fitness instructor‐led exercise vs. control | 10 weeks | MFIS ‐ physical ‐ cognitive | ‐ ‐ ns | MSIS‐29 physical component MSIS‐29 cognitive component 6MWT | ‐ ‐ + |
| Garrett 2013 Compared yoga vs. control | 10 weeks | MFIS ‐ physical ‐ cognitive | ‐ ‐ ns | MSIS‐29 physical component MSIS‐29 cognitive component 6MWT | ns ‐ ns |
| Geddes 2009 Compared home walking vs. control | 12 weeks | FSS | ns | 6MWT PCI RPE | ns ns ns |
| Hebert 2011 Compared vestibular rehabilitation vs. no exercise control | 6 weeks | MFIS | ‐ | SOT DHI 6MWT | + ‐ ns |
| Hebert 2011 Compared exercise control vs. no exercise control | 6 weeks | MFIS | ns | SOT DHI 6MWT | ns ns ns |
| Hogan 2014 Compared group physiotherapy vs. control | 10 weeks | MFIS | ns | BBS 6MWT MSIS29v2 | + ns ns |
| Hogan 2014 Compared individual physiotherapy vs. control | 10 weeks | MFIS | ns | BBS 6MWT MSIS29v2 | + ns ns |
| Hogan 2014 Compared yoga vs. control | 10 weeks | MFIS | ns | BBS 6MWT MSIS29v2 | + ns ns |
| Kargarfard 2012 Compared aquatic training vs. control | 8 weeks | MFIS ‐ physical ‐ psychosocial ‐ cognitive | ‐ ‐ ‐ ‐ | MSQoL‐54 ‐ Physical ‐ Mental | + + |
| Klefbeck 2003 Compared inspiratory muscle training vs. control | 10 weeks | No interaction effects reported | |||
| Learmonth 2011 Compared leisure centre‐based exercise group vs. control | 12 weeks | FSS | ns | T25FW 6MWT BBS TUG QPW BMI PF ABC HADS LMSQoL | ns ns ns ns ns ns + ns ns ns |
| McCullagh 2008 Compared group circuit training vs. control | 12 weeks | No interaction effects reported | |||
| Mori 2011 Compared transcranial magnetic stimulation (TMS) vs. control | 2 weeks | No interaction effects reported | |||
| Mori 2011 Compared exercise control vs. control | 2 weeks | No interaction effects reported | |||
| Mostert 2002 Compared short‐term exercise vs. control | 4 weeks | No interaction effects reported | |||
| Negahban 2013 Compared exercise therapy vs. control | 5 weeks | FSS | ‐ | VAS scale for pain MAS BBS TUG 10MWT 2MWT MSQoL‐54 | ns ‐ + ‐ ‐ + ns |
| Negahban 2013 Compared massage + exercise therapy vs. control | 5 weeks | FSS | ‐ | VAS scale for pain MAS BBS TUG 10MWT 2MWT MSQoL‐54 | ‐ ns + ‐ ‐ + ns |
| Oken 2004 Compared Iyengar yoga classes plus home programme vs. control | 24 weeks | No interaction effects reported | |||
| Oken 2004 Compared weekly bicycle exercise classes along with home exercise vs. control | 24 weeks | No interaction effects reported | |||
| Petajan 1996 Compared aerobic training vs. control | 15 weeks | FSS POMS ‐ fatigue | ns ns | EDSS ISS VO2max PWC HRmax Upper extremity strength Lower extremity strength POMS SIP | ns ns + + ns + + ns ns |
| Sangelaji 2014 Compared combination exercise therapy vs. control | 10 weeks | FSS | ‐ | EDSS BBS 6MWT MSQoL | ns + + + |
| Schulz 2004 Compared aerobic interval training vs. control | 8 weeks | MFIS ‐ physical ‐ cognitive ‐ social | ns ns ns ns | Wmax VO2max HRmax W endurance Lactate change Immune and neurotrophic factors IL‐6 (rest) IL‐6 (AUC) sIL‐6R (rest) sIL‐6R (AUC) BDNF (rest) BDNF (AUC) NGF (rest) NGF (AUC) HAQUAMS ‐ fatigue/thinking ‐ mobility lower ‐ mobility upper ‐ social function ‐ mood | ns ns ns ns ‐ ns ns ns ‐ ns ns ns ns ‐ ns ns ns ‐ ‐ |
| Skjerbaek 2014 Compared endurance training vs. control | 4 weeks | FSMC | ns | VO2peak HRpeak 9HPT Hand grip power Box and blocks 6‐minute wheelchair MDI MSIS‐29 | ns ns ns ns ns ns ns ns |
| Straudi 2014 Compared task‐oriented circuit training vs. control | 2 weeks | FSS | ns | 10MWT 6MWT TUG DGI MSWS‐12 MSIS‐29 ‐ physical ‐ psychosocial ‐ psychological | ns + ns ns + + + ‐ |
| Surakka 2004 Compared inpatient rehabilitation plus home‐based exercise vs. control | 26 weeks | FSS | ns | Leg flexor/extensor torque Motor fatigue Ambulatory fatigue index | ns ns ns |
| Sutherland 2001 Compared aerobic aquatic training vs. control | 10 weeks | No interaction effects reported | |||
| Tarakci 2013 Compared group exercise programme vs. control | 12 weeks | FSS | ‐ | BBS 10MWT R Hip flexors MAS R Hamstring MAS R Achilles MAS MusiQoL | + ‐ ‐ ‐ ‐ ‐ ‐ ‐ ‐ + |
| van den Berg 2006 Compared treadmill exercise vs. control (cross‐over) | 4 weeks | No interaction effects reported | |||
| ns, non‐significant; '+', a significant group‐by‐time effect in favour of the exercise group versus the non‐exercise control group; '‐' , a significant negative group‐by‐time effect in the exercise group versus the non‐exercise control group. For an overview of abbreviations, see Appendix 5. | |||||
| Study | Time (i.e. duration of intervention) | Fatigue scale | Effect | Other outcomes | Effect |
| Ahmadi 2013 Compared aerobic training vs. yoga | 8 weeks | FSS | ns | BBS Walk time Walk distance BDI BAI | ns ns ns ns ‐ |
| Aydin 2014 Compared hospital‐based callisthenic exercise vs. home‐based callisthenic exercise | 12 weeks | FSS | ns | 10MWT BBS MusiQoL HADS depression HADS anxiety | ns + ns + ns |
| Bansi 2013 Compared overland endurance training vs. aquatic endurance training | 3 weeks | FSMC ‐ motor ‐ cognitive | ns ns ns | Loadmax VO2peak HRpeak BORG | ns ns ns ns |
| Briken 2014 Compared arm‐ergometry vs. rowing | 10 weeks | No interaction effects reported | |||
| Briken 2014 Compared rowing vs. bicycling ergometry | 10 weeks | No interaction effects reported | |||
| Briken 2014 Compare arm‐ergometry vs. bicycling ergometry | 10 weeks | No interaction effects reported | |||
| Cakt 2010 Compared progressive resistance training vs. home‐based exercise | 8 weeks | FSS | ‐ | Duration of exercise Wmax TUG DGI FR FES 10MWT BDI SF‐36 | + + ‐ + + ‐ ns ‐ unk |
| Collett 2011 Compared endurance training vs. intermittent endurance training | 12 weeks | No interaction effects reported | |||
| Collett 2011 Compared intermittent training vs. mixed endurance training | 12 weeks | No interaction effects reported | |||
| Collett 2011 Compared endurance training vs. mixed endurance training | 12 weeks | No interaction effects reported | |||
| Coote 2014 Compared progressive resistance training vs. progressive resistance training augmented by neuromuscular electrical stimulation | 12 weeks | MFIS | ‐ | Quadriceps strength Hip strength Quadriceps endurance VAS lower limb spasticity TUG MSWS‐12 BBS MSIS29v2 | ns ns ns ns ns ns ns ns |
| Dettmers 2009 Compared endurance training vs. control treatment | 3 weeks | MFIS | ns | FSMC Maximal walking distance rWa BDI HAQUAMS | ns + + ns ns |
| Frevel 2014 Compare Internet home‐based training vs. hippotherapy | 12 weeks | MFIS FSS | ns ns | BBS DGI Isometric muscle strength TUG 2MWT HAQUAMS | ns ns ns ns ns ns |
| Gandolfi 2014 Compared robot‐assisted gait training vs. sensory integration balance training | 6 weeks | FSS | ns | Gait analysis BBS SOT Stabilometric assessment MSQoL‐54 | ns ns ns ns ns |
| Garrett 2013 Compared physiotherapist‐led exercise vs. fitness instructor‐led exercise | 10 weeks | No interaction effects reported | |||
| Garrett 2013 Compared fitness instructor‐led exercise vs. yoga | 10 weeks | No interaction effects reported | |||
| Garrett 2013 Compared physiotherapist‐led exercise vs. yoga | 10 weeks | No interaction effects reported | |||
| Hayes 2011 Compared a resistance training programme supplementary to a standard exercise programme vs. standard exercise programme | 12 weeks | FSS | ns | Isometric strength 6MWT TUG Stair ascent Stair descent 10MWT self paced 10MWT max paced BBS | ns ns ns + + ns ns ‐ |
| Hebert 2011 Compared vestibular rehabilitation vs. exercise control | 6 weeks | MFIS | ‐ | SOT DHI 6MWT | + ‐ ns |
| Hogan 2014 Compared group physiotherapy vs. individual physiotherapy | 10 weeks | MFIS | unk | BBS 6MWT MSIS29v2 | ns unk unk |
| Hogan 2014 Compared individual physiotherapy vs. yoga | 10 weeks | No interaction effects reported | |||
| Hogan 2014 Compared group physiotherapy vs. yoga | 10 weeks | No interaction effects reported | |||
| Mori 2011 Compared transcranial magnetic stimulation (TMS) vs. exercise control | 2 weeks | No interaction effects reported | |||
| Negahban 2013 Compared exercise therapy vs. exercise therapy + massage | 5 weeks | FSS | ns | VAS scale for pain MAS BBS TUG 10MWT 2MWT MSQoL‐54 | ‐ ns ns ns ns ns ns |
| Oken 2004 Compared Iyengar yoga classes vs. weekly bicycle exercise classes | 24 weeks | No interaction effects reported | |||
| Plow 2009 Compared individualized physical rehabilitation vs. group wellness intervention | 8 weeks | No interaction effects reported | |||
| Rampello 2007 Compared aerobic training vs. neurorehabilitation programme (cross‐over) | 8 weeks | No interaction effects reported | |||
| Sabapathy 2011 Compared resistance training vs. endurance training (cross‐over) | 8 weeks | No interaction effects reported | |||
| Smedal 2011 Compared warm vs. cold climate physiotherapy | 4 weeks | FSS | ns | 6MWT RPE TUG 10MWT BBS TIS MSIS‐29 physical MSIS‐29 psychosocial MHAQ Pain Balance Gait | + ‐ ns ns ns ns ‐ ‐ ‐ ‐ ‐ ‐ |
| Velikonja 2010 Compared sports climbing vs. yoga | 10 weeks | No interaction effects reported | |||
| Wier 2011 Compared robot‐assisted treadmill training vs. body‐weight supported treadmill training | 3 weeks | No interaction effects reported | |||
| ns, non‐significant; '+', a significant group‐by‐time effect in favour of the experimental exercise condition versus the exercise control condition; '‐' , a significant negative group‐by‐time effect in the experimental exercise condition versus the exercise control condition; unk, unknown. For an overview of abbreviations, see Appendix 5. | |||||
| Outcome or subgroup title | No. of studies | No. of participants | Statistical method | Effect size |
| 1 Fatigue Show forest plot | 36 | 1603 | Std. Mean Difference (IV, Random, 95% CI) | ‐0.35 [‐0.57, ‐0.13] |
| 1.1 Exercise versus non‐exercise control | 27 | 1325 | Std. Mean Difference (IV, Random, 95% CI) | ‐0.58 [‐0.81, ‐0.34] |
| 1.2 Exercise versus exercise | 9 | 278 | Std. Mean Difference (IV, Random, 95% CI) | 0.28 [0.00, 0.56] |
| Outcome or subgroup title | No. of studies | No. of participants | Statistical method | Effect size |
| 1 Fatigue Show forest plot | 26 | 1304 | Std. Mean Difference (IV, Random, 95% CI) | ‐0.53 [‐0.73, ‐0.33] |
| Outcome or subgroup title | No. of studies | No. of participants | Statistical method | Effect size |
| 1 Fatigue Show forest plot | 26 | 1304 | Std. Mean Difference (IV, Random, 95% CI) | ‐0.53 [‐0.73, ‐0.33] |
| 1.1 Modified Fatigue Impact Scale (MFIS) | 8 | 688 | Std. Mean Difference (IV, Random, 95% CI) | ‐0.40 [‐0.58, ‐0.22] |
| 1.2 Fatigue Severity Scale (FSS) | 13 | 449 | Std. Mean Difference (IV, Random, 95% CI) | ‐0.56 [‐0.95, ‐0.17] |
| 1.3 Other | 5 | 167 | Std. Mean Difference (IV, Random, 95% CI) | ‐0.54 [‐1.01, ‐0.07] |
| Outcome or subgroup title | No. of studies | No. of participants | Statistical method | Effect size |
| 1 Fatigue Show forest plot | 26 | 1299 | Std. Mean Difference (IV, Random, 95% CI) | ‐0.52 [‐0.72, ‐0.32] |
| 1.1 Endurance | 11 | 266 | Std. Mean Difference (IV, Random, 95% CI) | ‐0.46 [‐0.78, ‐0.15] |
| 1.2 Muscle power | 4 | 207 | Std. Mean Difference (IV, Random, 95% CI) | 0.03 [‐0.65, 0.71] |
| 1.3 Task‐oriented | 2 | 36 | Std. Mean Difference (IV, Random, 95% CI) | ‐0.34 [‐1.02, 0.33] |
| 1.4 Mixed | 6 | 495 | Std. Mean Difference (IV, Random, 95% CI) | ‐0.73 [‐1.23, ‐0.23] |
| 1.5 Other | 9 | 295 | Std. Mean Difference (IV, Random, 95% CI) | ‐0.64 [1.00, ‐0.29] |
| Outcome or subgroup title | No. of studies | No. of participants | Statistical method | Effect size |
| 1 Fatigue Show forest plot | 26 | 1299 | Std. Mean Difference (IV, Fixed, 95% CI) | ‐0.50 [‐0.62, ‐0.37] |
| 1.1 Endurance | 11 | 266 | Std. Mean Difference (IV, Fixed, 95% CI) | ‐0.43 [‐0.69, ‐0.17] |
| 1.2 Muscle power | 4 | 207 | Std. Mean Difference (IV, Fixed, 95% CI) | ‐0.19 [‐0.53, 0.15] |
| 1.3 Task‐oriented | 2 | 36 | Std. Mean Difference (IV, Fixed, 95% CI) | ‐0.34 [‐1.02, 0.33] |
| 1.4 Mixed | 6 | 495 | Std. Mean Difference (IV, Fixed, 95% CI) | ‐0.63 [‐0.83, ‐0.43] |
| 1.5 Other | 9 | 295 | Std. Mean Difference (IV, Fixed, 95% CI) | ‐0.54 [‐0.79, ‐0.29] |
| Outcome or subgroup title | No. of studies | No. of participants | Statistical method | Effect size |
| 1 Fatigue Show forest plot | 14 | 801 | Std. Mean Difference (IV, Random, 95% CI) | ‐0.64 [‐0.95, ‐0.32] |