Tratamiento con ejercicios para la fatiga en la esclerosis múltiple
Resumen
Antecedentes
La esclerosis múltiple (EM) es una enfermedad de mediación inmune del sistema nervioso central que afecta a 1 300 000 personas en todo el mundo. Se caracteriza por diversos síntomas invalidantes de los cuales la fatiga excesiva es el más frecuente. La fatiga a menudo se informa como el síntoma más invalidante en los pacientes con EM. Se han propuesto diversos mecanismos que se relacionan directa e indirectamente con la enfermedad y la inactividad física y contribuyen al grado de fatiga. El tratamiento con ejercicios puede inducir cambios fisiológicos y psicológicos que pueden contrarrestar estos mecanismos y reducir la fatiga en la EM.
Objetivos
Determinar la efectividad y la seguridad del tratamiento con ejercicios en comparación con una condición control ningún ejercicio u otra intervención sobre la fatiga, medidas con cuestionarios autoinformados, de los pacientes con EM.
Métodos de búsqueda
Se hicieron búsquedas en el registro especializado del Grupo Cochrane de Esclerosis Múltiple y Enfermedades Raras del Sistema Nervioso Central (Cochrane Multiple Sclerosis and Rare Diseases of the Central Nervous System Group), el cual, entre otras fuentes contiene ensayos de: Registro Cochrane Central de Ensayos Controlados (Cochrane Central Register of Controlled Trials) (CENTRAL) (2014, número 10), MEDLINE (desde 1966 hasta octubre 2014), EMBASE (desde 1974 hasta octubre 2014), CINAHL (desde 1981 hasta octubre 2014), LILACS (desde 1982 hasta octubre 2014), PEDro (desde 1999 hasta octubre 2014), y en registros de ensayos clínicos(octubre 2014). Dos autores de la revisión de forma independiente examinaron las listas de referencias de los ensayos identificados y las revisiones relacionadas.
Criterios de selección
Se incluyeron los ensayos controlados aleatorios (ECA) que evaluaron la eficacia del tratamiento con ejercicios en comparación con ningún tratamiento con ejercicios u otras intervenciones en adultos con EM que incluyeron la fatiga subjetiva como un resultado. En estos ensayos la fatiga debe haberse medido mediante cuestionarios que evaluaran principalmente la fatiga, o subescalas de cuestionarios que midieran la fatiga, o subescalas de cuestionarios no diseñadas principalmente para la evaluación de la fatiga pero explícitamente utilizadas para hacerlo.
Obtención y análisis de los datos
Dos autores de la revisión seleccionaron de forma independiente los artículos, extrajeron los datos y determinan la calidad metodológica de los ensayos incluidos. La calidad metodológica se determinó mediante la herramienta Cochrane "riesgo de sesgo" y la escala PEDro. El grupo de pruebas combinadas se resumió mediante el enfoque GRADE. Los resultados se agruparon mediante el metanálisis de los ensayos que proporcionaron datos suficientes para hacerlo.
Resultados principales
Fueron elegibles para esta revisión 45 ensayos que estudiaron 69 intervenciones con ejercicios e incluyeron 2250 pacientes con EM. Las intervenciones prescritas con ejercicios se categorizaron como entrenamiento de resistencia (23 intervenciones), entrenamiento de fuerza muscular (nueve intervenciones), entrenamiento orientado a una tarea (cinco intervenciones), entrenamiento mixto (15 intervenciones), o "otro" (p.ej. yoga; 17 Intervenciones). Treinta y seis ensayos incluidos (1603 participantes) proporcionaron datos suficientes sobre el resultado de fatiga para el metanálisis. En general, las intervenciones con ejercicios se estudiaron principalmente en participantes con el fenotipo recurrente‐remitente de la EM y con una Expanded Disability Status Scale menor de 6,0. Según 26 ensayos que utilizaron un control ningún ejercicio se encontró un efecto significativo sobre la fatiga a favor del tratamiento con ejercicios (diferencia de medias estandarizada [DME] ‐0,53; intervalo de confianza [IC] del 95%: ‐0,73 a ‐0,33; valor de P < 0,01). Sin embargo, hubo heterogeneidad significativa entre los ensayos (I2 > 58%). La calidad metodológica media, así como del grupo de pruebas combinadas, fue moderada. Cuando se consideraron los diferentes tipos de tratamiento con ejercicios, se encontró un efecto significativo sobre la fatiga a favor del tratamiento con ejercicios en comparación con ningún ejercicio para el entrenamiento de resistencia (DMEefectos fijos ‐0,43; IC del 95%: ‐0,69 a ‐0,17; valor de p < 0,01), entrenamiento mixto (DMEefectos aleatorios ‐0,73; IC del 95%: ‐1.23 a ‐0,23; valor de p < 0,01), y "otro" entrenamiento (DMEefectos fijos ‐0,54; IC del 95%: ‐0,79 a ‐0,29; valor de P < 0,01). Entre todos los estudios se informó una caída. Debido al número de recurrencias de la EM informadas para la condición de ejercicios (n = 25) y la condición control ningún ejercicio (n = 26), el ejercicio no parece asociarse con un riesgo significativo de recurrencia de la EM. Sin embargo, en general, las recurrencias de la EM se definieron y se informaron de forma deficiente.
Conclusiones de los autores
El tratamiento con ejercicios se puede prescribir en los pacientes con EM sin efectos perjudiciales. El tratamiento con ejercicios, y en particular el entrenamiento de resistencia, mixto u "otro", puede reducir la fatiga autoinformada. Sin embargo, todavía existen algunos problemas metodológicos importantes a superar. Desafortunadamente, la mayoría de los ensayos no incluyó explícitamente a pacientes que presentaron fatiga, no dirigieron el tratamiento específicamente hacia la fatiga y no utilizaron una medida validada de fatiga como la medición primaria del resultado.
PICO
Resumen en términos sencillos
Tratamiento con ejercicios para la fatiga en la esclerosis múltiple
Antecedentes
La esclerosis múltiple (EM) es una enfermedad crónica que afecta a más de 1 300 000 personas a nivel global. La EM se caracteriza por el daño difuso al sistema nervioso central, lo que provoca una variedad amplia de diferentes síntomas físicos y cognitivos (procesos mentales). La fatiga es uno de los síntomas más frecuentes e invalidantes de la EM. Actualmente, no hay un fármaco eficaz para reducir la fatiga en los pacientes con EM. El tratamiento con ejercicios puede ser una forma de reducir la fatiga directamente al cambiar cómo funciona el cuerpo, por ejemplo, la función hormonal, o indirectamente al mejorar la actividad física y la salud general.
Características de los estudios
Se efectuaron búsquedas en las bases de datos científicas de los ensayos clínicos que compararon el ejercicio con ningún ejercicio u otros tratamientos en adultos con EM. Las pruebas están actualizadas hasta octubre de 2014.
Resultados clave
Se encontraron 45 ensayos que incluyeron 2250 pacientes con EM y evaluaron el efecto del tratamiento con ejercicios a través de la fatiga autoinformada. Se utilizaron 36 estudios que incluyeron 1603 pacientes con EM en un análisis. Combinados, estos 36 ensayos apoyaron la idea de que el tratamiento con ejercicios puede ser un tratamiento prometedor para reducir la fatiga sin eventos secundarios. Este resultado parece especialmente válido para el entrenamiento de resistencia, el entrenamiento mixto (es decir, entrenamiento de fuerza muscular combinado con entrenamiento de resistencia) u "otro" entrenamiento (p.ej. yoga, tai‐chi). Para evaluar la seguridad del tratamiento con ejercicios se consideró el número de recurrencias de EM informadas en los pacientes que recibieron tratamiento con ejercicios y en los pacientes de un grupo ningún ejercicio y no se encontraron diferencias significativas.
Calidad de la evidencia
Aunque estos resultados fueron prometedores, se debe señalar que algunos métodos utilizados en los ensayos pueden haber afectado la confiabilidad de los resultados. Por ejemplo, en su mayoría los ensayos incluyeron un escaso número de participantes y no intentaron principalmente reducir la fatiga (sino que, por ejemplo, estaban dirigidos a mejorar la capacidad de caminar), y la evaluación de la fatiga fue una medida secundaria. Sin embargo, por el contrario, el tratamiento con ejercicios también puede ser menos factible en los pacientes con EM que se fatigan intensamente. Además, el informe y la definición de las recurrencias de la EM fueron en general deficientes y carecieron de consistencia. Se justifica la realización de estudios de investigación futuros de alta calidad para dilucidar la factibilidad, los efectos y los mecanismos de funcionamiento del tratamiento con ejercicios. Los estudios futuros se pueden beneficiar de una definición uniforme de fatiga, y posteriormente diseñarse para medir específicamente la fatiga.
Conclusiones de los autores
Summary of findings
| Effect of exercise therapy for fatigue in multiple sclerosis ‐ overall analysis | |||||
| Patient or population: people with multiple sclerosis | |||||
| Outcomes | Illustrative comparative risks* (95% CI) | No of participants | Quality of the evidence | Comments | |
| Assumed risk | Corresponding risk | ||||
| Control | Overall analysis | ||||
| Fatigue | No risk assumed | The mean fatigue outcome in the intervention groups was | 1603 | ⊕⊕⊕⊝ | Indirectness (‐1) |
| Exercise versus no‐exercise control | No risk assumed | The mean fatigue outcome in the intervention groups was 0.58 standard deviations lower (0.81 to 0.34 lower) compared to a no‐exercise control group | 1325 | ⊕⊕⊕⊝ | Indirectness (‐1) |
| Exercise versus exercise | No risk assumed | The mean fatigue outcome in the intervention groups was 0.28 standard deviations higher (0 to 0.56 higher) compared to an exercise control group | 278 | ⊕⊕⊝⊝ | Indirectness (‐1) Imprecision (‐1) |
| *The argumentation for downgrading the grades of evidence is provided in the footnotes. CI: confidence interval. | |||||
| GRADE Working Group grades of evidence | |||||
| 1 The presence of fatigue, beyond a pre‐defined level, was most often not an inclusion criterion. In addition, fatigue was not a primary outcome. | |||||
| Effect of exercise therapy for fatigue in multiple sclerosis ‐ analysis per fatigue measure | |||||
| Patient or population: people with multiple sclerosis | |||||
| Outcomes | Illustrative comparative risks* (95% CI) | No of participants | Quality of the evidence | Comments | |
| Assumed risk | Corresponding risk | ||||
| Control | Per fatigue measure | ||||
| Modified Fatigue Impact Scale | No risk assumed | The mean fatigue, on the Modified Fatigue Impact Scale, in the intervention groups was 0.40 standard deviations lower (0.58 to 0.22 lower) | 688 | ⊕⊕⊕⊝ | Indirectness (‐1) |
| Fatigue Severity Scale | No risk assumed | The mean fatigue, on the Fatigue Severity Scale, in the intervention groups was 0.56 standard deviations lower (0.95 to 17 lower) | 449 | ⊕⊕⊕⊝ | Indirectness (‐1) |
| Other | No risk assumed | The mean fatigue, on the 'other' included fatigue measures, in the intervention groups was 0.54 standard deviations lower (1.01 to 0.07 lower) | 167 | ⊕⊕⊝⊝ | Indirectness (‐1) Imprecision (‐1) |
| *The argumentation for downgrading the grades of evidence is provided in the footnotes. CI: confidence interval. | |||||
| GRADE Working Group grades of evidence | |||||
| 1 The presence of fatigue, beyond a pre‐defined level, was most often not an inclusion criterion. In addition, fatigue was not a primary outcome. | |||||
| Effect of exercise therapy for fatigue in multiple sclerosis ‐ analysis per exercise modality | |||||
| Patient or population: people with multiple sclerosis | |||||
| Outcomes | Illustrative comparative risks* (95% CI) | No of participants | Quality of the evidence | Comments | |
| Assumed risk | Corresponding risk | ||||
| Control | Per exercise group | ||||
| Endurance training | No risk assumed | The mean fatigue outcome in the intervention groups applying endurance training was 0.43 standard deviations lower (0.69 to 0.17 lower) | 266 | ⊕⊕⊕⊝ | Indirectness (‐1) |
| Muscle power training | No risk assumed | The mean fatigue outcome in the intervention groups applying muscle power training was 0.03 standard deviations higher (0.65 lower to 0.71 higher) | 207 | ⊕⊕⊝⊝ | Indirectness (‐1) Imprecision (‐1) |
| Task‐oriented training | No risk assumed | The mean fatigue outcome in the intervention groups applying task‐oriented training was 0.34 standard deviations lower (1.02 lower to 0.33 higher) | 36 | ⊕⊝⊝⊝ | Indirectness (‐1) Imprecision (‐2) |
| Mixed training | No risk assumed | The mean fatigue outcome in the intervention groups applying mixed training was 0.73 standard deviations lower (1.23 to 0.23 lower) | 495 | ⊕⊕⊕⊝ | Indirectness (‐1) |
| 'Other' training | No risk assumed | The mean fatigue outcome in the intervention groups applying 'Other' types of training was 0.54 standard deviations lower (0.79 to 0.29 lower) | 295 | ⊕⊕⊝⊝ | Indirectness (‐1) Imprecision (‐1) |
| *The argumentation for downgrading the grades of evidence is provided in the footnotes. The data is some sub‐groups was heterogeneous, and in some homogeneous. Hence, data for this 'Summary of findings' table is extracted from Analysis 4.1 and 5.1. CI: confidence interval. | |||||
| GRADE Working Group grades of evidence | |||||
| 1 The presence of fatigue, beyond a pre‐defined level, was most often not an inclusion criterion. In addition, fatigue was not a primary outcome. | |||||
Antecedentes
El consenso general es que la esclerosis múltiple (EM) es inducida por una respuesta inmunitaria anómala que provoca una distribución diseminada de la desmielinización a través del sistema nervioso central (SNC). A nivel global (112 países incluidos), se ha calculado que 1 300 000 personas presentan EM (WHO 2008). La prevalencia de la EM ha aumentado durante los últimos años, predominantemente debido a mayores tasas de supervivencia (Koch‐Henriksen 2010).
La EM se caracteriza por un espectro amplio de síntomas que incluyen declinar cognitivo, debilidad muscular, espasticidad y fatiga excesiva. El desacondicionamiento físico y mental debido a la EM o las comorbilidades, o ambas, puede desempeñar una función principal en el desarrollo o la persistencia de la fatiga. Por lo tanto, mejorar la salud física y mental mediante el tratamiento con ejercicios puede proporcionar una intervención valiosa en el tratamiento de la fatiga en los pacientes con EM. Se ha indicado que el tratamiento con ejercicios es beneficioso para reducir la fatiga en, por ejemplo, el síndrome de fatiga crónica (White 2011), el accidente cerebrovascular(Zedlitz 2012), y después del cáncer(Ahlberg 2003).
Descripción de la afección
Más del 80% de la población con EM informa fatiga (Zajicek 2010), y a menudo se percibe como uno de los síntomas más debilitantes (Wynia 2008). Las Multiple Sclerosis Council for Clinical Practice Guidelines definen la fatiga como "una falta subjetiva de energía física o mental que es percibida por el individuo o el cuidador como que interfiere con las actividades habituales y deseadas"(MS Council 1998). Esta definición implica que la fatiga puede tener origen mental o físico y es de naturaleza subjetiva. Debido a la naturaleza subjetiva, la fatiga solamente puede medirse mediante cuestionarios autoinformados (o informados por el cuidador). Sin interferencia, la fatiga se mantiene con el transcurso del tiempo y tiene una repercusión considerable sobre la calidad de vida relacionada con la salud (CdVRS) (Olascoaga 2010). Los mecanismos subyacentes de la fatiga no se conocen; sin embargo, estos mecanismos pueden estar primaria o secundariamente relacionados con la EM. En resumen, la fatiga en los pacientes con EM es un síntoma incapacitante, subjetivo y multidimensional con secuencias de eventos múltiples y que se perpetúan (Olascoaga 2010).
Descripción de la intervención
De conformidad con Rietberg 2005, el tratamiento con ejercicios se definió como "una serie de movimientos con el objetivo de entrenar o desarrollar el cuerpo mediante la práctica regular o como un entrenamiento físico para promover la buena salud física" (Webster's New World Dictionary 1982). Sin embargo, actualmente es creencia común que el tratamiento con ejercicios también puede beneficiar la salud mental en las personas sanas y enfermas (Cooney 2013). Con respecto a esta definición, se consideraron las intervenciones supervisadas o no supervisadas de cualquier duración, frecuencia e intensidad. El grupo control incluyó ningún entrenamiento con ejercicios (p.ej. lista de espera) u otra intervención.
De qué manera podría funcionar la intervención
Los mecanismos subyacentes con respecto a los efectos del tratamiento con ejercicios sobre la fatiga en la EM todavía se comprenden poco. El tratamiento con ejercicios puede aumentar las reservas de energía disponibles para el trabajo físico y aliviar los efectos perjudiciales de la inactividad física(Andreasen 2011). Además, el tratamiento con ejercicios o la actividad física en sí pueden mejorar los procesos neurobiológicos que podrían estimular la neuroprotección y neuroplasticidad y reducirían la discapacidad a largo plazo (White 2008a; White 2008b). Los efectos de la desregulación del eje hipotálamo‐hipófisis‐suprarrenal (HHS) (Gottschalk 2005), la potenciación a largo plazo y la depresión a largo plazo como mecanismos adaptativos (Cooke 2006) llaman cada vez más la atención. El tratamiento con ejercicios tiene la capacidad de inducir cambios en estos procesos neurobiológicos; procesos también relacionados estrechamente con la fatiga crónica (Chaudhuri 2004). En comparación con las intervenciones farmacológicas y no farmacológicas como el tratamiento de conservación de la energía y la terapia cognitivo‐conductual, el ejercicio puede afectar a ambos mecanismos primarios (p.ej. la neuroprotección o la función hormonal), así como a los factores secundarios relacionados con la fatiga (p.ej. inactividad o comorbilidad). Además, el tratamiento con ejercicios puede ser una intervención no invasiva relativamente sencilla y fácilmente accesible para reducir la fatiga. Petajan y colegas fueron de los primeros en indicar que el tratamiento con ejercicios puede ser beneficioso en los pacientes con EM y se podría realizar con seguridad (Petajan 1996).
Por qué es importante realizar esta revisión
Una revisión Cochrane anterior titulada "Tratamiento con ejercicios para la esclerosis múltiple" investigó de forma sistemática la bibliografía de las pruebas de la efectividad del tratamiento con ejercicios en los pacientes con EM, en cuanto a las actividades cotidianas y la CdVRS (Rietberg 2005). Esta revisión sistemática y la síntesis de las mejores pruebas encontraron pruebas a favor del tratamiento con ejercicios en comparación con ningún tratamiento con ejercicios, en cuanto a la función de la fuerza muscular, las funciones de tolerancia al ejercicio y las actividades relacionadas con la movilidad. Sin embargo, no encontró pruebas de un efecto del tratamiento con ejercicios sobre la fatiga en comparación con ningún tratamiento con ejercicios. Debido a la prevalencia, el carácter incapacitante y la etiología no explicada de la fatiga en la EM, el número de ensayos que investiga el tratamiento con ejercicios e incluye la fatiga como un resultado ha crecido exponencialmente en los años 2000. Además, varios estudios han indicado que las intervenciones no farmacológicas como el tratamiento con ejercicios pueden tener efectos beneficiosos en el tratamiento de la fatiga en otras enfermedades como el síndrome de fatiga crónica (White 2011), y el cáncer (Ahlberg 2003). Por lo tanto, los revisores encontraron factible estudiar los efectos del tratamiento con ejercicios sobre la fatiga específicamente, en una versión actualizada aunque diferenciada de la revisión original (Rietberg 2005).
Objetivos
Determinar la efectividad y la seguridad del tratamiento con ejercicios en comparación con una condición control ningún ejercicio u otra intervención sobre la fatiga, medidas con cuestionarios autoinformados, de los pacientes con EM.
Métodos
Criterios de inclusión de estudios para esta revisión
Tipos de estudios
Ensayos clínicos controlados aleatorios (ECA) incluidos los ensayos simple ciego, no cegados y alternos, que compararon el tratamiento con ejercicios con una condición control ningún ejercicio u otra intervención.
Tipos de participantes
Participantes de 18 años de edad o más con diagnóstico clínico confirmado de EM según los criterios diagnósticos aplicables (McDonald 2001; Polman 2005; Polman 2011; Poser 1983; Schumacher 1965).
Tipos de intervenciones
Se consideraron para inclusión todos los ensayos que se ajustaron a la definición de los autores de tratamiento con ejercicios, excepto los ensayos en los que el tratamiento con ejercicios se asoció con aprender a manipular productos y tecnología de la vida cotidiana (modelo International Classification of Functioning, Disability and Health [ICF]; e115). Además, según el modelo ICF, el tratamiento con ejercicios se clasificó como relacionado con la resistencia (b455), la fuerza muscular (b730), orientado a una tarea (es decir d450; caminar), y mixto u otro (WHO 2012). El entrenamiento orientado a una tarea se considera diferente de las otras categorías debido al objetivo de la intervención, o sea, para mejorar la realización de una cierta tarea como caminar, y no para mejorar, por ejemplo, la resistencia.
No hubo restricciones en cuanto a la duración, la frecuencia o la intensidad del tratamiento con ejercicios. Tampoco hubo restricciones en cuanto al contenido del tratamiento control, que podría haber sido un tratamiento con ejercicios de tipo o de intensidad diferentes así como un control ningún ejercicio (p.ej. lista de espera) u otro tratamiento.
Tipos de medida de resultado
Resultados primarios
La fatiga se evaluó como el resultado primario al final del período de intervención y durante el seguimiento, medida según:
-
cuestionarios que evaluaron principalmente la fatiga, como: Fatigue Severity Scale (FSS; Krupp 1989), Modified Fatigue Impact Scale (MFIS; Fisk 1994), Multidimensional Fatigue Index (MFI; Smets 1995), Escala analógica visual para la fatiga;
-
subescalas de cuestionarios que midieron la fatiga o subescalas no diseñadas principalmente para la evaluación de la fatiga pero utilizadas para hacerlo, por ejemplo: la Short Form‐36 sub‐scale (SF‐36; p.ej. la subescala de vitalidad; Ware 1992), y la Multiple Sclerosis Quality of Life (MSQoL‐54; p.ej. la subescala de funcionamiento físico ; Vickrey 1995). Estas subescalas solo se utilizaron si se señaló específicamente que se incluyeron para evaluar la fatiga.
Resultados secundarios
-
Seguridad del tratamiento con ejercicios en los pacientes con EM, en cuanto a número de recurrencias de la EM y número de caídas informadas, durante la intervención y el período de seguimiento. Una recurrencia de la EM se definió como síntomas recientemente desarrollados o recientemente empeorados de disfunción neurológica, con confirmación objetiva, que duraron más de 24 horas. Sin embargo, también se consideraron criterios menos estrictos para identificar una recurrencia de la EM (es decir, sin confirmación objetiva).
Results
Description of studies
See Characteristics of included studies; Characteristics of excluded studies.
Results of the search
See Figure 1.
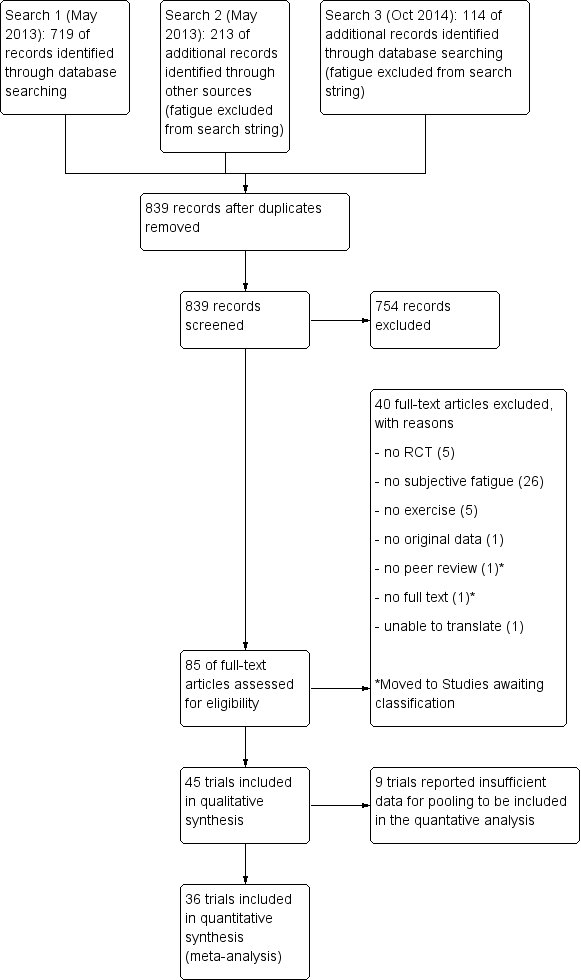
Study flow diagram.
The initial search, which included fatigue as a search component, yielded 213 citations (i.e. multiple sclerosis AND exercise therapy AND fatigue; Appendix 1). However, using the 'AND fatigue' section, independent of the keywords chosen, resulted in unacceptable insensitivity. That is, key trials that should have been part of the search results were not. Hence, we performed a second search without the fatigue section (i.e. multiple sclerosis AND exercise therapy; Appendix 4). The latter search was then updated in October 2014. After removal of duplicates, two review authors (MH and IP) independently screened 839 abstracts and titles for inclusion and exclusion criteria. The main reasons for exclusion were the trial design, no exercise therapy, or no fatigue outcome. We retrieved 85 full‐text articles of which we excluded an additional 40 (see Characteristics of excluded studies table) or moved to studies awaiting classification (see Characteristics of studies awaiting classification table). The final number of trials included in this review was 45, all written in English and published after 1995. We found no additional references based on reference screening of related reviews and included trials.
Included studies
The 45 trials that we included studied 69 different exercise therapy interventions. We categorized each exercise therapy intervention into the earlier described, ICF based (WHO 2012) modalities: endurance (23 interventions, b455), muscle power (nine interventions, b730), task‐oriented (five interventions, i.e. d450; walking), mixed (15 interventions), or other (17 interventions). See Characteristics of included studies table.
The mean (± SD) number of participants across all included 45 trials was 34 ± 38 for the intervention group and 16 ± 17 for the control group. In total, 1531 participants were involved in some type of exercise intervention while 719 participants served as non‐exercise controls. Furthermore, two trials included only people with a pre‐defined level of fatigue (Dettmers 2009; Hebert 2011). Three trials used fatigue as their primary measurement of outcome (Hebert 2011; Kargarfard 2012; Plow 2009). Out of the 45 included trials, 36 trials provided sufficient information on the outcome of fatigue to be included in a meta‐analysis. We contacted the corresponding authors of 11 trials to obtain missing information, which led to two additional trials included for the meta‐analysis. Based on the number and characteristics of the included trials, it was feasible to conduct a sub‐group analysis for the different fatigue outcomes used and the different types of exercise.
Excluded studies
See Characteristics of excluded studies; Figure 1.
We excluded 38 trials. The primary reason for excluding 26 trials was the lack of fatigue outcome measures included in the study design (Barrett 2009; Bjarnadottir 2007; Broekmans 2010; Broekmans 2011; Carter 2013a; Carter 2013b; Cattaneo 2007; Claerbout 2012; Dalgas 2009; DeBolt 2004; Fimland 2010; Gosselink 2000; Hilgers 2013; Hojjatollah 2012; Keser 2013; Marandi 2013a; Marandi 2013b; McAuley 2007; Miller 2011; Mutluay 2007; Nilsagard 2013; Patti 2003; Paul 2014; Rodrigues 2008; Romberg 2005; Solari 1999). Five trials did not apply a randomized controlled design (Bayraktar 2013; Castellano 2008; Heesen 2003; Keser 2011; Rasova 2006). The interventions in four trials could not be considered exercise therapy (Grossman 2010; Guerra 2014; Jackson 2008; Stephens 2001). Other reasons included: no original data (Sherman 2004, data from Oken 2004), and unable to translate (Shanazari 2013).
Risk of bias in included studies
Two review authors or research assistants (MH and ME or IVP) independently assessed the risk of bias for the included trials using the PEDro scale (see Table 1) and provided a domain‐based clinical judgement using the Cochrane 'Risk of bias' tool (see Characteristics of included studies table; Figure 2). The initial agreement was 84% (Cohen's Kappa = 0.674) of the 450 scored items on the PEDro scale. Following a consensus meeting, no disagreements persisted. The asymmetrical shape (lack of narrowing at the top of the plot) of the funnel plot does suggest presence of publication bias or small‐study effects (Figure 3).

Risk of bias graph: review authors' judgements about each risk of bias item presented as percentages across all included trials.

Funnel plot of trials comparing exercise versus a non‐exercise control condition.
| Study ID | Fatigue scale | ITT | 1 | 2 | 3 | 4 | 5 | 6 | 7 | 8 | 9 | 10 | Total score |
| Ahmadi 2013 | FSS | no | 1 | 0 | 1 | 0 | 0 | 0 | 1 | 1 | 1 | 1 | 6 |
| Aydin 2014 | FSS | no | 1 | 0 | 1 | 0 | 0 | 0 | 1 | 0 | 1 | 1 | 5 |
| Bansi 2013 | FSMC | no | 1 | 1 | 1 | 0 | 0 | 0 | 1 | 1 | 1 | 1 | 7 |
| Brichetto 2013 | MFIS | no | 1 | 0 | 1 | 0 | 0 | 0 | 1 | 1 | 1 | 1 | 6 |
| Briken 2014 | MFIS | no | 1 | 1 | 0 | 0 | 0 | 0 | 1 | 0 | 1 | 1 | 5 |
| Burschka 2014 | FSMC | no | 0 | 0 | 0 | 0 | 0 | 0 | 0 | 0 | 1 | 1 | 2 |
| Cakt 2010 | FSS | no | 1 | 1 | 1 | 0 | 0 | 0 | 0 | 0 | 1 | 1 | 5 |
| Carter 2014 | MFIS | yes | 1 | 1 | 1 | 0 | 0 | 0 | 1 | 1 | 1 | 1 | 7 |
| Castro‐Sanchez 2012 | MFIS, FSS | no | 1 | 1 | 1 | 0 | 0 | 0 | 1 | 0 | 1 | 1 | 6 |
| Collett 2011 | FSS | yes | 1 | 1 | 1 | 0 | 0 | 0 | 1 | 1 | 1 | 1 | 7 |
| Coote 2014 | MFIS | no | 1 | 1 | 1 | 0 | 0 | 0 | 0 | 1 | 1 | 1 | 6 |
| Dalgas 2010 | FSS | no | 1 | 1 | 1 | 0 | 0 | 0 | 0 | 1 | 1 | 1 | 6 |
| Dettmers 2009 | MFIS | no | 1 | 1 | 1 | 0 | 0 | 0 | 0 | 1 | 0 | 0 | 4 |
| Dodd 2011 | MFIS | yes | 1 | 1 | 1 | 0 | 0 | 0 | 1 | 1 | 1 | 1 | 7 |
| Frevel 2014 | MFIS, FSS | no | 1 | 0 | 1 | 0 | 0 | 0 | 1 | 0 | 1 | 1 | 5 |
| Fry 2007 | FSS | no | 1 | 0 | 1 | 0 | 0 | 0 | 1 | 1 | 0 | 1 | 5 |
| Gandolfi 2014 | FSS | no | 1 | 1 | 1 | 0 | 0 | 0 | 0 | 1 | 1 | 1 | 6 |
| Garrett 2013 | MFIS | no | 1 | 1 | 1 | 0 | 0 | 0 | 0 | 1 | 1 | 1 | 6 |
| Geddes 2009 | FSS | no | 1 | 0 | 1 | 0 | 0 | 0 | 0 | 1 | 1 | 1 | 5 |
| Hayes 2011 | FSS | no | 1 | 0 | 1 | 0 | 0 | 0 | 1 | 1 | 1 | 1 | 6 |
| Hebert 2011 | MFIS | yes | 1 | 1 | 1 | 0 | 0 | 0 | 1 | 1 | 1 | 1 | 7 |
| Hogan 2014 | MFIS | no | 1 | 1 | 0 | 0 | 0 | 0 | 0 | 1 | 1 | 1 | 5 |
| Kargarfard 2012 | MFIS | yes | 1 | 1 | 1 | 0 | 0 | 0 | 0 | 1 | 1 | 1 | 6 |
| Klefbeck 2003 | FSS | no | 1 | 0 | 1 | 0 | 0 | 0 | 1 | 0 | 1 | 1 | 5 |
| Learmonth 2011 | FSS | yes | 1 | 1 | 1 | 0 | 0 | 0 | 0 | 1 | 1 | 1 | 6 |
| McCullagh 2008 | MFIS | no | 0 | 0 | 1 | 0 | 0 | 0 | 0 | 1 | 1 | 1 | 4 |
| Mori 2011 | FSS | no | 1 | 0 | 1 | 0 | 0 | 0 | 1 | 1 | 0 | 0 | 4 |
| Mostert 2002 | FSS | no | 1 | 0 | 1 | 0 | 0 | 0 | 0 | 0 | 0 | 1 | 3 |
| Negahban 2013 | FSS | no | 1 | 0 | 1 | 0 | 0 | 0 | 1 | 1 | 1 | 1 | 6 |
| Oken 2004 | MFI (general) | no | 1 | 0 | 1 | 0 | 0 | 0 | 0 | 1 | 0 | 1 | 4 |
| Petajan 1996 | POMS fatigue, FSS | no | 1 | 0 | 1 | 0 | 0 | 0 | 0 | 1 | 0 | 1 | 4 |
| Plow 2009 | MFIS | no | 1 | 0 | 0 | 0 | 0 | 0 | 0 | 1 | 0 | 0 | 2 |
| Rampello 2007 | MFIS | no | 1 | 0 | 1 | 0 | 0 | 0 | 0 | 1 | 1 | 1 | 5 |
| Sabapathy 2010 | MFIS | no | 1 | 0 | 1 | 0 | 0 | 0 | 0 | 1 | 1 | 1 | 5 |
| Sangelaji 2014 | FSS | no | 1 | 0 | 1 | 0 | 0 | 0 | 0 | 1 | 0 | 0 | 3 |
| Schulz 2004 | MFIS | no | 1 | 0 | 0 | 0 | 0 | 0 | 1 | 1 | 1 | 1 | 5 |
| Smedal 2011 | FSS | yes | 1 | 0 | 1 | 0 | 0 | 0 | 1 | 1 | 1 | 1 | 6 |
| Skjerbaek 2014 | FSMC | no | 1 | 1 | 1 | 0 | 0 | 0 | 1 | 1 | 1 | 1 | 7 |
| Straudi 2014 | FSS | yes | 1 | 0 | 1 | 0 | 0 | 0 | 1 | 1 | 1 | 1 | 6 |
| Surakka 2004 | FSS | no | 1 | 0 | 1 | 0 | 0 | 0 | 0 | 1 | 1 | 1 | 5 |
| Sutherland 2001 | POMS fatigue | no | 1 | 0 | 1 | 0 | 0 | 0 | 1 | 1 | 1 | 1 | 6 |
| Tarakci 2013 | FSS | no | 1 | 1 | 1 | 0 | 0 | 0 | 1 | 1 | 1 | 1 | 7 |
| van den Berg 2006 | FSS | no | 1 | 1 | 1 | 0 | 0 | 0 | 0 | 1 | 1 | 1 | 7 |
| Velikonja 2010 | MFIS | no | 1 | 0 | 0 | 0 | 0 | 0 | 1 | 0 | 0 | 1 | 4 |
| Wier 2011 | FSS | no | 1 | 0 | 1 | 0 | 0 | 0 | 1 | 1 | 1 | 0 | 5 |
| % of trials | 96% | 42% | 87% | 0% | 0% | 0% | 53% | 80% | 80% | 89% |
Risk of bias assessment based on the PEDro scale; see Appendix 5 for abbreviations.
1: Random allocation.
2: Concealed allocation.
3: Groups similar at baseline on disease severity, fatigue, and depression (if reported).
4: Blinding of all participants (zero per definition).
5: Blinding of all therapists.
6: Blinding of assessors.
7: Measures of key outcome (fatigue) > 85% of participants initially allocated to group (rated for fatigue outcome).
8: All participants of whom outcome is available received treatment or control; if not, intention‐to‐treat (ITT) analysis was performed.
9: Between‐group statistics of fatigue outcome reported.
10: Point measures and measures of variability for fatigue provided.
The mean PEDro score was 5.3 (range 2 to 7) from the possible 10. Forty‐nine per cent (22 trials) of the included trials were of high methodological quality based on the criterion of a PEDro score greater than 5.
Allocation
All trials used random allocation to a control or intervention group. However, one trial broke the randomization procedure to maintain equal group sizes (McCullagh 2008). In addition, one trial randomized based on the week‐day preference of the eligible participant (Burschka 2014). Hence, even though all trials used a randomization procedure, 96% of the trials fulfilled the PEDro criterion of random allocation. In 46% of the trials, there was sufficient information on the randomization procedure to determine that the allocation procedure was indeed concealed. In 87% of the trials, groups were similar on baseline, regarding the fatigue outcome used.
Blinding
Due to the nature of the intervention, as well as the self reported outcome of fatigue, none of the participants, personnel, or outcome assessors were blinded to treatment allocation.
Incomplete outcome data
The average drop‐out rate within the included studies was 13% in the exercise conditions and 13% in the control conditions. In some studies, the drop‐out rate was high, or imbalanced across group leading to a higher risk of attrition bias. In 80% of the trials, outcome assessment was available for those participants initially allocated to the intervention or control group. Eight trials reported intention‐to‐treat analysis (Carter 2014; Collett 2011; Dodd 2011; Hebert 2011; Kargarfard 2012; Learmonth 2012; Smedal 2011; Straudi 2014).
Selective reporting
Eighty per cent of the trials reported between‐group effects whereas 89% of the trials provided point estimates and measures of variability for the fatigue outcome.
Other potential sources of bias
We identified no other potential sources of bias.
Effects of interventions
See: Summary of findings for the main comparison Overall analysis for fatigue in multiple sclerosis; Summary of findings 2 Per fatigue measure for fatigue in multiple sclerosis; Summary of findings 3 Per exercise group for fatigue in multiple sclerosis
Effect of exercise therapy on fatigue
Table 2 and Table 3 show the group‐by‐time (i.e. interaction) effects reported for trials comparing exercise versus a non‐exercise control condition or exercise control condition respectively, primarily for fatigue, but also for all other outcomes included in the respective trials. A total of 36 trials provided sufficient data to be included in the meta‐analysis. Eight of these trials compared multiple exercise interventions versus a single control group (Ahmadi 2013; Briken 2014; Cakt 2010; Garrett 2013; Hebert 2011; Hogan 2014; Negahban 2013; Oken 2004). One trial reported only sub‐scales of fatigue on the MFIS (Sabapathy 2011). Three trials used more than one fatigue outcome (Castro‐Sanchez 2012; Frevel 2015; Petajan 1996). The scores on the individual fatigue outcomes or sub‐scales were merged into a single score applying the same methodology as for combining multiple exercise interventions (see Data extraction and management). One exception was the study by Petajan and colleagues (Petajan 1996), as only data on the Profile of Mood States (POMS) fatigue sub‐scale were available and not for the FSS.
| Study | Time (i.e. duration of intervention) | Fatigue scale | Effect | Other outcomes | Effect |
| Ahmadi 2013 Compared aerobic training vs. control | 8 weeks | FSS | ‐ | BBS Walk time Walk distance BDI BAI | + ‐ + ns ns |
| Ahmadi 2013 Compared yoga vs. control | 8 weeks | FSS | ‐ | BBS Walk time Walk distance BDI BAI | + ns + ‐ ‐ |
| Brichetto 2013 Compared Nintendo® Wii® balance training vs. control | 4 weeks | MFIS | ns | BBS Open‐eye stabilometry Closed‐eye stabilometry | + ‐ ‐ |
| Briken 2014 Compared arm‐ergometry vs. control | 10 weeks | MFIS | ‐ | VO2peak 6MWT SDMT VLMT TAP (alertness) TAP (shift of attention) LPS RWT IDS ‐ SR30 | ns + ns + ns ‐ ns ns ‐ |
| Briken 2014 Compared rowing vs. control | 10 weeks | MFIS | ns | VO2peak 6MWT SDMT VLMT TAP (alertness) TAP (shift of attention) LPS RWT IDS ‐ SR30 | ns ns ns + ns ns ns ns ns |
| Briken 2014 Compared bicycling vs. control | 10 weeks | MFIS | ns | VO2peak 6MWT SDMT VLMT TAP (alertness) TAP (shift of attention) LPS RWT IDS ‐ SR30 | + + ns + ‐ ‐ ns ns ‐ |
| Burschka 2014 Compared Tai‐Chi yoga vs. control * no change of fatigue in experimental group, increase in fatigue in control group | 24 weeks | FSMC* | ‐ | Balance Co‐ordination CES‐D QLS | + + ‐ + |
| Cakt 2010 Compared progressive resistance training vs. control | 8 weeks | FSS | ‐ | Duration of exercise Wmax TUG DGI FR FES 10MWT BDI SF‐36 | + + ‐ + + ‐ ‐ ‐ unk |
| Cakt 2010 Compared home‐based exercise vs. control | 8 weeks | FSS | ns | Duration of exercise Wmax TUG DGI FR FES 10MWT BDI SF‐36 | ns ns ns ns ns ns ns ns unk |
| Carter 2014 Compared a pragmatic exercise intervention vs. control | 12 weeks | MFIS | ‐ | GLTEQ Accelerometer MSQoL‐54 MSFC 6MWT EDSS | + + + ns ns ns |
| Castro‐Sanchez 2012 Compared Ai‐Chi aquatic programme vs. control | 20 weeks | FSS MFIS ‐ physical ‐ cognitive ‐ psychosocial | ns ‐ ns ns | Pain MPQ‐PRI MPQ‐PPI RMDQ Spasm ‐ physical ‐ psychological BDI BI | ‐ ‐ ns ‐ ‐ ‐ ‐ ‐ ns |
| Dalgas 2010 Compared progressive resistance training vs. control | 12 weeks | FSS MFI‐20 ‐ General fatigue ‐ Physical fatigue ‐ Reduced activity ‐ Reduced motivation ‐ Mental fatigue | ‐ ‐ ns ns ns ns | MDI SF‐36 ‐ PCS ‐ MCS MVC (knee extensor) FS (%) | ‐ ‐ ns + + |
| Dodd 2011 Compared progressive resistance training vs. control | 10 weeks | MFIS ‐ physical ‐ cognitive ‐ psychosocial | ‐ ‐ ns ns | MSIS‐88 muscle stiffness MSIS‐88 muscle spasms 2MWT Walking speed Leg press endurance (repetitions) Reversed leg press endurance (repetitions) 1RM leg press (kg) 1RM reversed leg press (kg) WHOQoL‐BREF overall quality of life WHOQoL‐BREF overall health WHOQoL‐BREF physical health | ns ns ns ns ns + ns ns ns ns + |
| Fry 2007 Compared inspiratory muscle training vs. control | 10 weeks | No interaction effects reported | |||
| Garrett 2013 Compared physiotherapist‐led exercise vs. control | 10 weeks | MFIS ‐ physical ‐ cognitive | ‐ ‐ ns | MSIS‐29 physical component MSIS‐29 cognitive component 6MWT | ‐ ‐ + |
| Garrett 2013 Compared fitness instructor‐led exercise vs. control | 10 weeks | MFIS ‐ physical ‐ cognitive | ‐ ‐ ns | MSIS‐29 physical component MSIS‐29 cognitive component 6MWT | ‐ ‐ + |
| Garrett 2013 Compared yoga vs. control | 10 weeks | MFIS ‐ physical ‐ cognitive | ‐ ‐ ns | MSIS‐29 physical component MSIS‐29 cognitive component 6MWT | ns ‐ ns |
| Geddes 2009 Compared home walking vs. control | 12 weeks | FSS | ns | 6MWT PCI RPE | ns ns ns |
| Hebert 2011 Compared vestibular rehabilitation vs. no exercise control | 6 weeks | MFIS | ‐ | SOT DHI 6MWT | + ‐ ns |
| Hebert 2011 Compared exercise control vs. no exercise control | 6 weeks | MFIS | ns | SOT DHI 6MWT | ns ns ns |
| Hogan 2014 Compared group physiotherapy vs. control | 10 weeks | MFIS | ns | BBS 6MWT MSIS29v2 | + ns ns |
| Hogan 2014 Compared individual physiotherapy vs. control | 10 weeks | MFIS | ns | BBS 6MWT MSIS29v2 | + ns ns |
| Hogan 2014 Compared yoga vs. control | 10 weeks | MFIS | ns | BBS 6MWT MSIS29v2 | + ns ns |
| Kargarfard 2012 Compared aquatic training vs. control | 8 weeks | MFIS ‐ physical ‐ psychosocial ‐ cognitive | ‐ ‐ ‐ ‐ | MSQoL‐54 ‐ Physical ‐ Mental | + + |
| Klefbeck 2003 Compared inspiratory muscle training vs. control | 10 weeks | No interaction effects reported | |||
| Learmonth 2011 Compared leisure centre‐based exercise group vs. control | 12 weeks | FSS | ns | T25FW 6MWT BBS TUG QPW BMI PF ABC HADS LMSQoL | ns ns ns ns ns ns + ns ns ns |
| McCullagh 2008 Compared group circuit training vs. control | 12 weeks | No interaction effects reported | |||
| Mori 2011 Compared transcranial magnetic stimulation (TMS) vs. control | 2 weeks | No interaction effects reported | |||
| Mori 2011 Compared exercise control vs. control | 2 weeks | No interaction effects reported | |||
| Mostert 2002 Compared short‐term exercise vs. control | 4 weeks | No interaction effects reported | |||
| Negahban 2013 Compared exercise therapy vs. control | 5 weeks | FSS | ‐ | VAS scale for pain MAS BBS TUG 10MWT 2MWT MSQoL‐54 | ns ‐ + ‐ ‐ + ns |
| Negahban 2013 Compared massage + exercise therapy vs. control | 5 weeks | FSS | ‐ | VAS scale for pain MAS BBS TUG 10MWT 2MWT MSQoL‐54 | ‐ ns + ‐ ‐ + ns |
| Oken 2004 Compared Iyengar yoga classes plus home programme vs. control | 24 weeks | No interaction effects reported | |||
| Oken 2004 Compared weekly bicycle exercise classes along with home exercise vs. control | 24 weeks | No interaction effects reported | |||
| Petajan 1996 Compared aerobic training vs. control | 15 weeks | FSS POMS ‐ fatigue | ns ns | EDSS ISS VO2max PWC HRmax Upper extremity strength Lower extremity strength POMS SIP | ns ns + + ns + + ns ns |
| Sangelaji 2014 Compared combination exercise therapy vs. control | 10 weeks | FSS | ‐ | EDSS BBS 6MWT MSQoL | ns + + + |
| Schulz 2004 Compared aerobic interval training vs. control | 8 weeks | MFIS ‐ physical ‐ cognitive ‐ social | ns ns ns ns | Wmax VO2max HRmax W endurance Lactate change Immune and neurotrophic factors IL‐6 (rest) IL‐6 (AUC) sIL‐6R (rest) sIL‐6R (AUC) BDNF (rest) BDNF (AUC) NGF (rest) NGF (AUC) HAQUAMS ‐ fatigue/thinking ‐ mobility lower ‐ mobility upper ‐ social function ‐ mood | ns ns ns ns ‐ ns ns ns ‐ ns ns ns ns ‐ ns ns ns ‐ ‐ |
| Skjerbaek 2014 Compared endurance training vs. control | 4 weeks | FSMC | ns | VO2peak HRpeak 9HPT Hand grip power Box and blocks 6‐minute wheelchair MDI MSIS‐29 | ns ns ns ns ns ns ns ns |
| Straudi 2014 Compared task‐oriented circuit training vs. control | 2 weeks | FSS | ns | 10MWT 6MWT TUG DGI MSWS‐12 MSIS‐29 ‐ physical ‐ psychosocial ‐ psychological | ns + ns ns + + + ‐ |
| Surakka 2004 Compared inpatient rehabilitation plus home‐based exercise vs. control | 26 weeks | FSS | ns | Leg flexor/extensor torque Motor fatigue Ambulatory fatigue index | ns ns ns |
| Sutherland 2001 Compared aerobic aquatic training vs. control | 10 weeks | No interaction effects reported | |||
| Tarakci 2013 Compared group exercise programme vs. control | 12 weeks | FSS | ‐ | BBS 10MWT R Hip flexors MAS R Hamstring MAS R Achilles MAS MusiQoL | + ‐ ‐ ‐ ‐ ‐ ‐ ‐ ‐ + |
| van den Berg 2006 Compared treadmill exercise vs. control (cross‐over) | 4 weeks | No interaction effects reported | |||
ns, non‐significant; '+', a significant group‐by‐time effect in favour of the exercise group versus the non‐exercise control group; '‐' , a significant negative group‐by‐time effect in the exercise group versus the non‐exercise control group. For an overview of abbreviations, see Appendix 5.
| Study | Time (i.e. duration of intervention) | Fatigue scale | Effect | Other outcomes | Effect |
| Ahmadi 2013 Compared aerobic training vs. yoga | 8 weeks | FSS | ns | BBS Walk time Walk distance BDI BAI | ns ns ns ns ‐ |
| Aydin 2014 Compared hospital‐based callisthenic exercise vs. home‐based callisthenic exercise | 12 weeks | FSS | ns | 10MWT BBS MusiQoL HADS depression HADS anxiety | ns + ns + ns |
| Bansi 2013 Compared overland endurance training vs. aquatic endurance training | 3 weeks | FSMC ‐ motor ‐ cognitive | ns ns ns | Loadmax VO2peak HRpeak BORG | ns ns ns ns |
| Briken 2014 Compared arm‐ergometry vs. rowing | 10 weeks | No interaction effects reported | |||
| Briken 2014 Compared rowing vs. bicycling ergometry | 10 weeks | No interaction effects reported | |||
| Briken 2014 Compare arm‐ergometry vs. bicycling ergometry | 10 weeks | No interaction effects reported | |||
| Cakt 2010 Compared progressive resistance training vs. home‐based exercise | 8 weeks | FSS | ‐ | Duration of exercise Wmax TUG DGI FR FES 10MWT BDI SF‐36 | + + ‐ + + ‐ ns ‐ unk |
| Collett 2011 Compared endurance training vs. intermittent endurance training | 12 weeks | No interaction effects reported | |||
| Collett 2011 Compared intermittent training vs. mixed endurance training | 12 weeks | No interaction effects reported | |||
| Collett 2011 Compared endurance training vs. mixed endurance training | 12 weeks | No interaction effects reported | |||
| Coote 2014 Compared progressive resistance training vs. progressive resistance training augmented by neuromuscular electrical stimulation | 12 weeks | MFIS | ‐ | Quadriceps strength Hip strength Quadriceps endurance VAS lower limb spasticity TUG MSWS‐12 BBS MSIS29v2 | ns ns ns ns ns ns ns ns |
| Dettmers 2009 Compared endurance training vs. control treatment | 3 weeks | MFIS | ns | FSMC Maximal walking distance rWa BDI HAQUAMS | ns + + ns ns |
| Frevel 2014 Compare Internet home‐based training vs. hippotherapy | 12 weeks | MFIS FSS | ns ns | BBS DGI Isometric muscle strength TUG 2MWT HAQUAMS | ns ns ns ns ns ns |
| Gandolfi 2014 Compared robot‐assisted gait training vs. sensory integration balance training | 6 weeks | FSS | ns | Gait analysis BBS SOT Stabilometric assessment MSQoL‐54 | ns ns ns ns ns |
| Garrett 2013 Compared physiotherapist‐led exercise vs. fitness instructor‐led exercise | 10 weeks | No interaction effects reported | |||
| Garrett 2013 Compared fitness instructor‐led exercise vs. yoga | 10 weeks | No interaction effects reported | |||
| Garrett 2013 Compared physiotherapist‐led exercise vs. yoga | 10 weeks | No interaction effects reported | |||
| Hayes 2011 Compared a resistance training programme supplementary to a standard exercise programme vs. standard exercise programme | 12 weeks | FSS | ns | Isometric strength 6MWT TUG Stair ascent Stair descent 10MWT self paced 10MWT max paced BBS | ns ns ns + + ns ns ‐ |
| Hebert 2011 Compared vestibular rehabilitation vs. exercise control | 6 weeks | MFIS | ‐ | SOT DHI 6MWT | + ‐ ns |
| Hogan 2014 Compared group physiotherapy vs. individual physiotherapy | 10 weeks | MFIS | unk | BBS 6MWT MSIS29v2 | ns unk unk |
| Hogan 2014 Compared individual physiotherapy vs. yoga | 10 weeks | No interaction effects reported | |||
| Hogan 2014 Compared group physiotherapy vs. yoga | 10 weeks | No interaction effects reported | |||
| Mori 2011 Compared transcranial magnetic stimulation (TMS) vs. exercise control | 2 weeks | No interaction effects reported | |||
| Negahban 2013 Compared exercise therapy vs. exercise therapy + massage | 5 weeks | FSS | ns | VAS scale for pain MAS BBS TUG 10MWT 2MWT MSQoL‐54 | ‐ ns ns ns ns ns ns |
| Oken 2004 Compared Iyengar yoga classes vs. weekly bicycle exercise classes | 24 weeks | No interaction effects reported | |||
| Plow 2009 Compared individualized physical rehabilitation vs. group wellness intervention | 8 weeks | No interaction effects reported | |||
| Rampello 2007 Compared aerobic training vs. neurorehabilitation programme (cross‐over) | 8 weeks | No interaction effects reported | |||
| Sabapathy 2011 Compared resistance training vs. endurance training (cross‐over) | 8 weeks | No interaction effects reported | |||
| Smedal 2011 Compared warm vs. cold climate physiotherapy | 4 weeks | FSS | ns | 6MWT RPE TUG 10MWT BBS TIS MSIS‐29 physical MSIS‐29 psychosocial MHAQ Pain Balance Gait | + ‐ ns ns ns ns ‐ ‐ ‐ ‐ ‐ ‐ |
| Velikonja 2010 Compared sports climbing vs. yoga | 10 weeks | No interaction effects reported | |||
| Wier 2011 Compared robot‐assisted treadmill training vs. body‐weight supported treadmill training | 3 weeks | No interaction effects reported | |||
ns, non‐significant; '+', a significant group‐by‐time effect in favour of the experimental exercise condition versus the exercise control condition; '‐' , a significant negative group‐by‐time effect in the experimental exercise condition versus the exercise control condition; unk, unknown. For an overview of abbreviations, see Appendix 5.
The meta‐analysis comprised 969 participants in the intervention group versus 634 in the control group (Analysis 1.1). A heterogeneous (I2 = 73%, P value < 0.01), significant effect was found in favour of exercise therapy (SMD ‐0.35, 95% CI ‐0.57 to ‐0.13; Z = 3.16, P value < 0.01). The trial by Kargarfard 2012 was considered an outlier based on the disproportional high effect size (ES) relative to the other trials (ES ‐8.58, 95% CI ‐11.59 to ‐5.58). Hence, in a subsequent sensitivity analysis we removed the trial by Kargarfard 2012 and found a heterogeneous (I2 = 66%, P value < 0.01), significant effect, in favour of exercise therapy (SMD ‐0.32, 95% CI ‐0.51 to ‐0.12; Z = 3.20, P value < 0.01). Finally, we removed the trials that compared exercise with another exercise condition or intervention from the meta‐analysis to obtain a 'clean' comparison of exercise therapy versus non‐exercise control. This resulted in a heterogeneous (I2 = 58%, P value < 0.01) significant effect in favour of exercise therapy (SMD ‐0.53, 95% CI ‐0.73 to ‐0.33; Z = 5.19, P value < 0.01; Analysis 2.1). We rated the overall quality of the body of evidence, by means of the GRADE approach, as moderate.
Safety
To assess the safety of exercise therapy, we summed the number of reported MS relapses for the trials that compared an exercise intervention versus a non‐exercise control intervention. However, we considered the statement that no drop‐outs occurred, not a confirmation that no actual MS relapses had occurred. Hence, in the safety analysis, we only included the trials that reported at least one MS relapse. In 12 trials that reported at least one MS relapse, there were 25 MS relapses in 743 participants that received exercise therapy and 26 MS relapses in 404 participants in a non‐exercise control condition. The RR was 0.523 (95% CI 0.296 to 0.924) in favour of exercise therapy. A more lenient approach, in which we assumed that in trials that reported no MS relapses indeed no MS relapses occurred, led to an RR of 0.572 (95% CI 0.334 to 0.978). Across all studies, two trials reported a total of one fall (Geddes 2009; Hogan 2014), which subsequently led to one drop‐out (Hogan 2014).
Sub‐group analysis per fatigue outcome
See Analysis 3.1; see summary of findings Table 2.
We hypothesized that different fatigue scales may be more or less sensitive to determine treatment effects. For example, questionnaires with a physical domain may be more sensitive to treatment effects of physical interventions such as exercise therapy. Therefore, we performed a sub‐group analysis in which we grouped trials that compared exercise versus non‐exercise control based on the questionnaire used. Again, we excluded the trials that compared exercise versus an exercise control and the trial by Kargarfard 2012 from this analysis. We found no sub‐group differences between trials using the MFIS, FSS, or 'Other' fatigue measures (Chi2 = 0.68, P value = 0.71).
Modified Fatigue Impact Scale
Eight trials used the MFIS as fatigue outcome measure, including 475 participants in the exercise group versus 213 in the control group (Brichetto 2013; Briken 2014; Carter 2014; Dodd 2011; Garrett 2013; Hebert 2011; Hogan 2014; Schulz 2004). These trials showed a homogeneous (I2 = 5%, P value = 0.39), significant effect in favour of exercise therapy (SMD ‐0.40, 95% CI ‐0.58 to ‐0.22; Z = 4.39, P value < 0.01). Based on the SMD, and the standard deviation in the control group of the best‐powered trial (Carter 2014), exercise therapy may reduce fatigue by ‐6.9 points (95% CI ‐10.0 to ‐3.8) on the MFIS.
Fatigue Severity Scale
Thirteen trials used the FSS as the fatigue outcome measure, including 257 participants in the exercise group versus 192 participants in the control group (Ahmadi 2013; Cakt 2010; Dalgas 2010; Fry 2007; Geddes 2009; Klefbeck 2003; Learmonth 2012; Mostert 2002; Negahban 2013; Sangelaji 2014; Straudi 2014; Tarakci 2013; van den Berg 2006). These trials showed a heterogeneous (I2 = 71%, P value < 0.01), significant effect in favour of exercise therapy (SMD ‐0.56, 95% CI ‐0.95 to ‐0.17; Z = 2.82, P value < 0.01). Based on the SMD, and the standard deviation in the control group of the best‐powered trial (Tarakci 2013), exercise therapy may reduce fatigue by ‐5.4 points (95% CI ‐9.2 to 1.7) on the FSS sum score.
Other
Of the remaining five trials, three used the POMS fatigue sub‐scale (Oken 2004; Petajan 1996; Sutherland 2001), and two used the Fatigue Scale of Motor and Cognitive functions (FSMC; Burschka 2014; Skjerbaek 2014). Combined, these five trials comprised 89 participants in the exercise group versus 78 participants in the control group. These trials showed a homogeneous (I2 = 50%, P value = 0.09), significant effect in favour of exercise therapy (SMD ‐0.54, 95% CI ‐1.01 to ‐0.07; Z = 2.24, P value < 0.05). Based on the SMD, and the standard deviation in the control group of the best‐powered trial (POMS fatigue sub‐scale: Petajan 1996; FSMC: Burschka 2014), exercise therapy may reduce fatigue by ‐4.9 points (95% CI ‐9.1 to ‐0.6) on the POMS fatigue sub‐scale, or ‐7.6 points (95% CI ‐14.1 to ‐1.0) on the FSMC.
Sub‐group analysis per exercise modality
The Chi2 test for sub‐group differences based on exercise modality was non‐significant (Analysis 4.1; Chi2 = 4.03, P value = 0.40).
See Analysis 4.1 (for heterogeneous results using a random‐effects model) or Analysis 5.1 (for homogeneous results using a fixed‐effect model); and summary of findings Table 3.
Endurance training
Description
Seventeen trials used endurance‐type exercise interventions (23 interventions; Ahmadi 2013; Bansi 2013 (2x); Briken 2014 (3x); Cakt 2010; Collett 2011 (3x); Hayes 2011; Hebert 2011; Mostert 2002; Oken 2004; Petajan 1996; Rampello 2007; Sabapathy 2011; Schulz 2004; Skjerbaek 2014; Sutherland 2001; van den Berg 2006; Wier 2011 (2x)). The duration of the exercise programme ranged from three weeks to six months. Therapy frequency ranged from once a week to five times a week where the longest exercise programme generally adapted the least intensive frequency. Cycling was the primary mode of exercise in nine trials (Bansi 2013; Cakt 2010; Collett 2011; Hebert 2011; Mostert 2002; Oken 2004; Petajan 1996; Rampello 2007; Schulz 2004). Three trials used treadmill walking (Ahmadi 2013; van den Berg 2006; Wier 2011), one a recumbent stepper (Hayes 2011), one an aquatic running programme (Sutherland 2001), and three trials used a variety of endurance‐type training devices (Briken 2014; Sabapathy 2011; Skjerbaek 2014). In general, endurance‐type interventions were studied in ambulant participants aged 18 to 65 years, with all types of mild to moderate MS (EDSS less than 6.5) for up to 20 years after diagnosis. However, one trial specifically included people with an EDSS of 6.5 to 8.0 (Skjerbaek 2014). Fatigue was measured using the FSS (Ahmadi 2013; Cakt 2010; Collett 2011; Hayes 2011; Mostert 2002; Petajan 1996; van den Berg 2006), MFIS (Briken 2014; Hebert 2011; Rampello 2007; Sabapathy 2011; Schulz 2004; Wier 2011), POMS fatigue sub‐scale (Petajan 1996; Sutherland 2001), MFI (Oken 2004), or FSMC (Bansi 2013; Skjerbaek 2014).
Meta‐analysis
Eleven trials conducted one or more endurance‐type interventions versus a non‐exercise control and provided sufficient data for meta‐analysis. There were 156 participants in the intervention group versus 110 participants in the control group. There was a homogeneous (I2 = 28%, P value > 0.18), significant effect in favour of endurance training (SMD ‐0.43, 95% CI ‐0.69 to ‐0.17; Z = 3.24, P value < 0.01). When we combined the SMD with the standard deviation of the best‐powered trial using the FSS (Tarakci 2013) or MFIS (Carter 2014), endurance training may benefit fatigue by ‐4.2 points (95% CI ‐6.7 to ‐1.7) on the FSS or ‐7.4 points (95% CI ‐11.9 to ‐2.9) on the MFIS.
Trials not included in meta‐analysis
An additional six trials used endurance‐type training but reported either insufficient data to consider for meta‐analysis or used an exercise versus exercise/intervention design (Bansi 2013; Collett 2011; Hayes 2011; Rampello 2007; Sabapathy 2011; Wier 2011). Bansi and colleagues studied the differential effect of aquatic versus overland endurance training (Bansi 2013). Both groups significantly improved measures of cardiorespiratory fitness (maximal workload (Wmax), peak exercise oxygen consumption (VO2peak)) yet there were no significant changes in fatigue severity (FSMC) within or between groups. Collett and colleagues compared three different endurance‐type training (continuous, intermittent, or a combination of both) (Collett 2011). There were no significant time‐effects for each endurance type training on fatigue (FSS). Hayes and colleagues studied the effect of eccentric muscle power exercises supplemental to standard endurance‐type exercise (Hayes 2011). The control condition (standard endurance exercise) showed a significant reduction of ‐1.38 points (95% CI ‐2.00 to ‐0.75) in FSS but no significant group‐time interaction (P value = 0.30). Rampello and colleagues studied the effect of aerobic training versus a neurological rehabilitation intervention (Rampello 2007). They found no significant pre‐post intervention effects or group‐time interaction on fatigue (MFIS). Sabapathy and colleagues compared an endurance‐type training versus a resistance‐exercise training (Sabapathy 2011). They found a significant reduction on the MFIS physical sub‐scale (mean ± SD; ‐2.7 ± 5.3, P value < 0.05) and the MFIS psychosocial sub‐scale (mean ± SD; ‐0.8 ± 0.4, P value < 0.01) but not on the MFIS cognitive sub‐scale. Wier and colleagues compared the effect of robot‐assisted training versus conventional body weight supported treadmill training using a cross‐over design (Wier 2011). Following the initial intervention phase, fatigue non‐significantly improved in both groups as measured by the FSS scale (‐4.14 with robot assisted versus ‐9.00 with conventional; P value = 0.43).
Muscle power training
Description
Eight trials used muscle power interventions (Aydin 2014 (2x); Cakt 2010; Coote 2015 (2x); Dalgas 2010; Dodd 2011; Hayes 2011; Hogan 2014; Sabapathy 2011). The duration of the exercise programme ranged from eight to 12 weeks. Frequency of therapy ranged from two to five times per week. Six trials primarily focused on the lower limb muscles to improve strength and balance (Cakt 2010; Coote 2015; Dalgas 2010; Dodd 2011; Hayes 2011; Hogan 2014), while Sabapathy 2011 also incorporated upper limb and core strength exercises. Of these trials, one trial specifically studied the added effect of neuromuscular electrical stimulation in combination with muscle power exercise (Coote 2015). In addition, one trial focused on large muscle groups and specifically compared the different effect of home‐based versus hospital‐based exercise therapy (Aydin 2014). In general, muscle power training was studied in ambulant participants aged 18 to 65 years, with all types of mild to moderate MS (EDSS less than 6.5) for up to 20 years after diagnosis. Fatigue outcome was measured using the FSS (Aydin 2014; Cakt 2010; Dalgas 2010; Hayes 2011), or MFIS (Coote 2015; Dodd 2011; Hogan 2014; Sabapathy 2011).
Meta‐analysis
We included four trials that conducted interventions related to muscle power for meta‐analysis (Cakt 2010; Dalgas 2010; Dodd 2011; Hogan 2014). A total of 146 participants were involved in muscle power training versus 61 participants in the non‐exercise control group. These trials showed a heterogeneous (I2 = 70%, P value = 0.02) non‐significant effect in favour of the non‐exercise control (SMD 0.03, 95% CI ‐0.65 to 0.71; Z = 0.08, P value > 0.05). If we combined the SMD with the standard deviation of the best‐powered trial using the FSS (Tarakci 2013) or MFIS (Carter 2014), muscle power training may affect fatigue by 0.3 points (95% CI ‐6.3 to 6.9) on the FSS or 0.5 points (95% CI ‐11.2 to 12.3) on the MFIS.
Trials not included in meta‐analysis
Three additional trials investigated interventions related to muscle power but used an exercise versus exercise set‐up (Aydin 2014; Coote 2015; Sabapathy 2011). Aydin and colleagues compared the effectiveness of home‐based versus hospital‐based callisthenic exercises. They found no significant effect on fatigue as measured by the FSS scale (Aydin 2014). Coote and colleagues compared progressive resistance training versus the same training but then augmented by neuromuscular stimulation (Coote 2015). Whereas the regular progressive resistance training group showed no time‐effect on fatigue, the group augmented by neuromuscular stimulation showed a significant group‐by‐time decrease in fatigue as measured by the MFIS. The trial by Sabapathy et al. compared the effects of endurance training versus resistance training in a randomized cross‐over trial (Sabapathy 2011). Following resistance training, fatigue significantly reduced within the resistance training group on two of the three MFIS sub‐scales namely, physical (mean ± SD; ‐1.6 ± 3.3, P value < 0.05) and psychosocial scale (mean ± SD; ‐1.6 ± 11.6, P value < 0.01). However, the trial did not report group‐by‐time effects.
Task‐oriented training
Description
Two interventions could be characterized as task‐oriented training (Geddes 2009; Straudi 2014). The first investigated the effect of a home‐walking programme (Geddes 2009). The second studied a task‐oriented circuit training using various task‐oriented workstations complemented with training of walking endurance (Straudi 2014). Both trials included ambulant people with MS and measured fatigue using the FSS.
Meta‐analysis
When pooled, these two trials showed a homogeneous (I2 = 0%, P value > 0.05), non‐significant effect in favour of task‐oriented training (SMD ‐0.34, 95% CI ‐1.02 to 0.33; Z = 1.00, P value > 0.05). If we combined the SMD with the standard deviation of the best‐powered trial using the FSS (Tarakci 2013) or MFIS (Carter 2014), task‐oriented training may affect fatigue by ‐3.3 points (95% CI ‐9.9 to 3.2) on the FSS or ‐5.9 points (95% CI ‐17.7 to 5.7) on the MFIS.
Mixed training
Description
Thirteen trials used exercise interventions that incorporated both endurance and muscle power components (15 interventions) (Carter 2014; Dettmers 2009; Garrett 2013 (2x); Hayes 2011; Kargarfard 2012; Learmonth 2012; McCullagh 2008; Mori 2011 (2x); Negahban 2013; Plow 2009; Sangelaji 2014; Surakka 2004; Tarakci 2013). Three of those were (in part) aquatic (Kargarfard 2012; Mori 2011; Surakka 2004). The duration of the exercise programme ranged from two to 26 weeks. Therapy frequency ranged from twice weekly up to five times a week. All trials included people with mild to moderate MS (EDSS less than 6.5). Similar to resistance or endurance training, mixed training did not primarily focus on a specific type of MS or disease duration. Seven trials measured fatigue using the FSS (Hayes 2011; Learmonth 2012; Mori 2011; Negahban 2013; Sangelaji 2014; Surakka 2004; Tarakci 2013), and six trials using the MFIS (Carter 2014; Dettmers 2009; Garrett 2013; Kargarfard 2012; McCullagh 2008; Plow 2009).
Meta‐analysis
Of the 13 trials that used a combination of endurance training and muscle power training, seven provided sufficient information for meta‐analysis. However, we considered the trial by Kargarfard and colleagues an outlier and disregarded it from the meta‐analysis (Kargarfard 2012). Hence, there were 319 participants in the mixed training group versus 176 participants in the control group. These remaining six trials showed a heterogeneous (I2 = 82%, P value < 0.01) significant effect in favour of mixed training (SMD ‐0.73, 95% CI ‐1.23 to ‐0.23; Z = 2.88, P value < 0.01). If we combine the SMD with the standard deviation of the best‐powered trial using the FSS (Tarakci 2013) or MFIS (Carter 2014), mixed training may benefit fatigue by ‐7.1 points (95% CI ‐11.9 to ‐2.2) on the FSS or ‐12.6 points (95% CI ‐21.3 to ‐4.0) on the MFIS.
Trials not included in meta‐analysis
In addition, Kargarfard and colleagues showed a significant reduction in fatigue on the MFIS scale following eight weeks' aquatic training (MD ± SD ‐9.8 ± 3.2, P value < 0.05) (Kargarfard 2012). Mori and colleagues showed that the effects of exercise may be primed by means of transcranial magnetic stimulation (TMS) (Mori 2011). They showed on the FSS scale that fatigue only reduced in the exercise plus TMS group and not in the exercise plus sham TMS and exercise‐only group (MD ‐7.9, P value < 0.05). Surakka and colleagues showed that, following three weeks of supervised training and 23 weeks of home exercise, no concurrent changes occurred in fatigue as measured by means of the FSS (Surakka 2004). Dettmers and colleagues combined mild strength training with repetitive endurance training and compared this with a low‐intensity control training (Dettmers 2009). Fatigue (MFIS) improved in six of nine participants following the intervention and in nine of 10 participants following control training. Hayes and colleagues studied the effect of supplemental resistance training on top of aerobic training (RENEW) versus aerobic training alone (STAND) (Hayes 2011). Both groups significantly reduced fatigue over time (RENEW ‐0.94, 95% CI ‐1.64 to ‐0.24; STAND ‐1.38, 95% CI ‐2.00 to ‐1.75). McCullagh and colleagues used a circuit‐type training in which participants completed four different stations of 10 minutes (McCullagh 2008). Following three months of exercise, the intervention group had significantly reduced fatigue (median ‐13, range ‐20.5 to ‐3) compared with the control group (median 1, range ‐4 to 4.5). Plow and colleagues compared individualized rehabilitation with a group wellness intervention (Plow 2009). They found no significant change in fatigue on the MFIS for each intervention.
'Other' training
Description
Seventeen interventions were studied that could be considered an 'other' type of exercise therapy intervention: hippotherapy (Frevel 2015), balance training (Brichetto 2013; Frevel 2015; Gandolfi 2014; Hebert 2011), yoga (Ahmadi 2013; Burschka 2014; Castro‐Sanchez 2012; Garrett 2013; Hogan 2014; Oken 2004; Velikonja 2010), inspiratory muscle training (Fry 2007; Klefbeck 2003), motor learning (Smedal 2011), sports climbing (Velikonja 2010), and robot‐assisted gait training (Gandolfi 2014). In comparison to the other exercise modalities, 'other' training types were also studied in more severely disabled people with MS (Castro‐Sanchez 2012, EDSS 7.5 or less; Hogan 2014, Guy's Neurological Disability Index (GNDS) 3‐4; Klefbeck 2003, EDSS 6.5 to 9.5). Fatigue was measured by means of the FSS (Ahmadi 2013; Brichetto 2013; Frevel 2015; Fry 2007; Gandolfi 2014; Klefbeck 2003; Smedal 2011), MFIS (Castro‐Sanchez 2012; Frevel 2015; Garrett 2013; Hebert 2011; Hogan 2014; Velikonja 2010), MFI (Oken 2004), or FSMC (Burschka 2014).
Meta‐analysis
Nine trials using 'other' types of training provided sufficient data for meta‐analysis (Ahmadi 2013; Brichetto 2013; Burschka 2014; Fry 2007; Garrett 2013; Hebert 2011; Hogan 2014; Klefbeck 2003; Oken 2004). There were 179 participants in the 'other' training group versus 116 participants in the control group. These nine trials showed a homogeneous (I2 = 45%, P value = 0.07) significant effect in favour of exercise therapy (SMD ‐0.54, 95% CI ‐0.79 to ‐0.29; Z = 4.27, P value < 0.01). If we combined the SMD with the standard deviation of the best‐powered trial using the FSS (Tarakci 2013) or MFIS (Carter 2014), 'other' training may benefit fatigue by ‐5.2 points (95% CI ‐7.7 to ‐2.8) on the FSS or ‐9.3 points (95% CI ‐13.7 to ‐5.0) on the MFIS.
Trials not included in meta‐analysis
In addition, Castro‐Sanchez and colleagues compared an aquatic Ai‐Chi exercise programme with a control, overland exercise group (Castro‐Sanchez 2012). The aquatic group had significantly improved fatigue (FSS, P value = 0.043) whereas the control group did not. Frevel and colleagues compared a home‐based balance training with hippotherapy (Frevel 2015). Even though, the participants in the hippotherapy intervention had significantly improved fatigue (MFIS, MFIS sub‐scales, and FSS) over time, there were no significant interaction effects reported on the FSS or MFIS. Gandolfi and colleagues compared robot‐assisted gait training with a sensory integration balance training (Gandolfi 2014). There was no significant interaction effect reported, but the participants in the sensory integration balance training had significantly improved fatigue (FSS) over time. Smedal and colleagues compared the effect of physiotherapy in a cold (Norway) and warm (Spain) environment via a cross‐over design (Smedal 2011). Fatigue (FSS) did not significantly change in either environmental condition. Velikonja and colleagues compared a sports climbing intervention versus a yoga intervention (Velikonja 2010). Fatigue (MFIS) was significantly reduced in both groups (climbing, MD ‐6.2; yoga, MD ‐9.8).
Sensitivity analyses
We assessed the effect of methodological quality, in terms of the PEDro rating, by means of a sensitivity analysis (Analysis 6.1). To do so, we included only exercise versus non‐exercise control trials with a PEDro rating greater than 5 in the meta‐analysis. The remaining 14 trials comprised 495 participants in the intervention group versus 306 participants in the control group. These trials showed a heterogeneous (I2 = 72%, P value < 0.01), significant effect in favour of exercise therapy (SMD ‐0.64, 95% CI ‐0.95 to ‐0.32; Z = 3.93, P value < 0.01), which is larger than the overall analysis (SMD ‐0.53).
Follow‐up effects of exercise therapy on fatigue
Fourteen trials included a follow‐up phase in their trial design (Castro‐Sanchez 2012; Collett 2011; Dalgas 2010; Dodd 2011; Garrett 2013; Hebert 2011; Klefbeck 2003; McCullagh 2008; Plow 2009; Rampello 2007; Sabapathy 2011; Smedal 2011; van den Berg 2006; Wier 2011). Follow‐up duration (mean ± SD) was 12 ± 6 weeks post intervention. The results for the follow‐up phase were heterogeneous. Three trials reported a significant lower fatigue rating following the intervention phase that was also significantly lower during follow‐up (Garrett 2013; Hebert 2011; McCullagh 2008). One trial reported a reduction in fatigue during the follow‐up phase with no changes in fatigue during the intervention phase (Plow 2009). Two trials reported a significant difference between the exercise versus non‐exercise control condition following the intervention phase that was no longer present at follow‐up (Castro‐Sanchez 2012; Dodd 2011). Four trials showed no change in fatigue during intervention phase or follow‐up phase (Collett 2011; Dalgas 2010; Smedal 2011; van den Berg 2006). The remaining four trials reported insufficient information on the follow‐up phase (Klefbeck 2003; Rampello 2007; Sabapathy 2011; Wier 2011).
Discusión
Resumen de los resultados principales
Cuando se consideraron solamente los ensayos que compararon una intervención con ejercicios con un grupo control ningún ejercicio, se encontró un efecto significativo, heterogéneo y moderado a favor del tratamiento con ejercicios (DME ‐0,53; IC del 95%: ‐0,73 a ‐0,33; Z = 5,19; valor de p < 0,01). Además, no se encontraron diferencias significativas en el número de recurrencias de la EM informadas entre el tratamiento con ejercicios y el control. Por lo tanto, esta revisión aporta pruebas de que el tratamiento con ejercicios es moderadamente efectivo, como muestra la DME, en el tratamiento de la fatiga en los pacientes con EM y es seguro, en cuanto a las recurrencias de la EM informadas. Sin embargo, estos resultados se deben interpretar con cuidado ya que la calidad general del grupo de pruebas fue moderada y el contenido del tratamiento con ejercicios y de las condiciones control fue heterogéneo. Por desgracia, la mayoría de los estudios incluyó muestras con poco poder estadístico, pequeñas y heterogéneas; seleccionaron pacientes que no presentaban específicamente fatiga; y no dirigieron específicamente el tratamiento a reducir la fatiga, si se considera que en un número de ensayos la fatiga no fue la medición primaria de resultado. El efecto heterogéneo encontrado, en combinación con la falta de diferencias significativas en el tipo de ejercicio, suscita preguntas con respecto a los efectos subyacentes supuestos del tratamiento con ejercicios sobre la fatiga.
Seguridad
La presente revisión identificó 25 recurrencias de la EM durante el tratamiento con ejercicios versus 26 en la condición control ningún ejercicio. Estos datos coinciden con una revisión sobre la seguridad del tratamiento con ejercicios en los pacientes con EM, que calculó una tasa de recurrencia en el grupo de entrenamiento con ejercicios del 4,6% y en el grupo control del 6,3% (Pilutti 2014). Sin embargo, hay que señalar que en general los ensayos incluidos no definieron claramente lo que se consideró una recurrencia de la EM, ni informaron si estos participantes reanudaron el ensayo. Los estudios de investigación futuros deben incorporar e informar los criterios de diagnóstico clínico para identificar las recurrencias y aumentar la transparencia (Motl 2012), antes de que se puedan establecer conclusiones sobre un efecto protector posible (como indicó el CR calculado) del ejercicio. Sin embargo, los resultados presentados confirman la seguridad del tratamiento con ejercicios en los pacientes con EM. Lo anterior se ejemplifica adicionalmente por la ausencia de caídas informadas (una; Hogan 2014), lo que indica que el ejercicio se puede realizar con seguridad en un ambiente controlado y supervisado.
Participantes
Las intervenciones con ejercicios se realizaron en el espectro completo de pacientes con EM. Sin embargo, la mayoría de los ensayos se centró en participantes ambulatorios con EM (EDSS 6,5 o menos), con edades entre 18 y 65 años y sin recurrencias durante al menos un mes antes de la inclusión. Solamente tres ensayos incluyeron a pacientes con un nivel de EDSS mayor de 6,5 (Castro‐Sanchez 2012, Ai‐Chi, EDSS 7,5 o menos; Klefbeck 2003, entrenamiento de los músculos inspiratorios, EDSS 9,5 o menos; Hogan 2014, GNDS 3 to 4). Ninguno de los ensayos estratificó a los pacientes según el tipo de EM o presentó los resultados como tal. Estos resultados implican que la generalización de los resultados está principalmente restringida a los pacientes ambulatorios con EM.
Efecto de la modalidad de ejercicio
Se realizaron análisis de subgrupos para determinar si el tipo de tratamiento con ejercicios (es decir, intervenciones de resistencia, fuerza muscular, orientado a una tarea, mixto, u "otro") puede ser más efectivo para el tratamiento de la fatiga que otros. La prueba general de las diferencias de subgrupos no fue significativa, lo que podría deberse a la falta de poder de algunos subtipos de ejercicios, junto con la gran heterogeneidad relativa dentro de cada subgrupo de ejercicios. Sin embargo, cuando los análisis se realizaron por subtipo de ejercicio, se encontró un efecto significativo para el entrenamiento de resistencia, el entrenamiento mixto y "otros" tipos de entrenamiento como yoga, robótico, y el entrenamiento de equilibrio. Por el contrario, no se encontraron efectos significativos en el entrenamiento de fuerza muscular o el entrenamiento orientado a una tarea (Resumen de los hallazgos 2). Cinco de los nueve ensayos en el grupo "otro" aplicó yoga o una intervención similar al yoga. El ES relativo grande encontrado en este grupo puede indicar un efecto beneficioso del yoga sobre la fatiga en los pacientes con EM, que coincide con una revisión sistemática específica del yoga en los pacientes con EM (Cramer 2014). Se debe señalar que no todos los tipos de tratamiento con ejercicios estuvieron igualmente representados en la revisión actual. En particular el entrenamiento de fuerza muscular (cuatro ensayos) y el entrenamiento orientado a una tarea (dos ensayos) con respecto a la fatiga no se han estudiado ampliamente. Los datos disponibles no permitieron un análisis minucioso de las relaciones dosis‐respuesta en cuanto a la duración, la frecuencia y la intensidad del tratamiento o una combinación de estos. En general, los estudios incluidos en esta revisión redujeron la intensidad / frecuencia cuando aumentó la duración de la intervención. Desde un punto de vista fisiológico, estos parámetros son importantes para el diseño de los ensayos futuros y para mejorar la comprensión de los factores responsables de los cambios inducidos por el ejercicio en la EM.
Mecanismos de los efectos inducidos por el ejercicio
La comprensión actual sobre los efectos beneficiosos del ejercicio para la fatiga en la EM impone tres hipótesis importantes. Primero, la mejoría del estado cardiorrespiratorio puede aumentar las reservas de energía disponibles, que a la vez pueden reducir la fatiga (Andreasen 2011). Segundo, el tratamiento con ejercicios puede inducir mecanismos neuroprotectores que reducen la discapacidad a largo plazo (White 2008a; White 2008b). Tercero, el tratamiento con ejercicios puede normalizar la desregulación del eje HHS (Gottschalk 2005). Estas hipótesis dependen en gran parte de la presuposición de que el tratamiento real con ejercicios es de duración, dosis e intensidad suficientes para inducir dichos cambios. El American College of Sports Medicine recomienda que la mayoría de los adultos participen en entrenamiento con ejercicios cardiorrespiratorios de intensidad moderada durante 30 minutos o más por cinco o más días por semana para un total de 150 minutos o más por semana, un entrenamiento con ejercicios cardiorrespiratorios de intensidad vigorosa durante 20 minutos o más por tres o más días por semana (75 minutos o más por semana), o una combinación de ejercicios de intensidad moderada y vigorosa para lograr un gasto total de energía de 500 a 1000 equivalente metabólico por minuto por semana (Garber 2011). Se puede cuestionar si los pacientes con EM pueden adherirse a tal régimen de entrenamiento, especialmente los pacientes con EM más grave. Motl y Gosney realizaron un metanálisis para estudiar el efecto del ejercicio sobre la calidad de vida (Motl 2008). El ejercicio lo definieron como: episodios acumulativos de actividad física planificada y estructurada que se realizan de forma repetida durante un período prolongado con un objetivo o meta específica externa de mejorar o mantener el estado físico (Motl 2008). De hecho, identificaron la duración de la intervención y la cantidad de ejercicio por semana como moderadores significativos del efecto del ejercicio en la calidad de vida de los pacientes con EM (Motl 2008). En los estudios de investigación futuros se justifica el informe detallado de la duración y la frecuencia de la intervención. Además, para una relación dosis‐respuesta verdadera, también necesitaría informarse la dosis prescrita versus la dosis real realizada de ejercicio.
Elección del resultado de fatiga
La mayoría de los ensayos utilizó la FSS o la MFIS como el resultado de fatiga. Sin embargo, no hay consenso sobre si estas escalas miden la misma construcción. Además, han aumentado las pruebas de que estos cuestionarios miden diferentes aspectos de la fatiga (Elbers 2012; Rietberg 2010). Después del análisis Rasch, se demostró que la FSS mide las consecuencias sociales de la fatiga en contraposición con la intensidad o la gravedad real de la fatiga (Mills 2009), mientras que se encontró que la MFIS es de valor para la evaluación de los aspectos cognitivos y físicos de la fatiga, pero no en la fatiga general (Mills 2010). Por el contrario, se han encontrado coeficientes de correlación moderados a altos entre la FSS y la MFIS, lo que indica que la FSS y la MFIS, al menos en algún grado, miden la misma construcción o están estrechamente relacionados (Learmonth 2013; Rietberg 2010). En la presente revisión se formuló la hipótesis de que las diferencias en la validez conceptual de las medidas de resultado de fatiga se pueden reflejar en los resultados diferenciales del tratamiento con ejercicios sobre la fatiga. Sin embargo, un análisis de subgrupos no mostró efectos diferentes significativos del tratamiento con ejercicios sobre la fatiga, en este caso, entre la FSS, la MFIS, la subescala de fatiga POMS, o el FSMC (Resumen de los hallazgos 3). No obstante, se han desarrollado medidas nuevas de fatiga como el FSMC que pueden proporcionar apreciaciones adicionales sobre la fatiga o pueden ser más sensibles y específicas en los pacientes con EM (Elbers 2012).
Efectos beneficiosos que duran más allá de la fase de intervención
Dieciséis de 45 ensayos incluyeron una fase de seguimiento en el diseño (Carter 2014; Castro‐Sanchez 2012; Collett 2011; Dalgas 2010; Dodd 2011; Gandolfi 2014; Garrett 2013; Hebert 2011; Klefbeck 2003; McCullagh 2008; Plow 2009; Rampello 2007; Sabapathy 2011; Smedal 2011; van den Berg 2006; Wier 2011). Estos ensayos mostraron resultados heterogéneos con respecto a los efectos a largo plazo potenciales del tratamiento con ejercicios más allá de la fase de intervención. Ninguno de los ensayos que incluyeron una fase de seguimiento mostró una reducción de la fatiga en el grupo de ejercicio en comparación con el grupo control (ningún ejercicio) al seguimiento. En el mejor de los casos, las diferencias encontradas en la fatiga se mantuvieron durante la fase de seguimiento. También en la EM, el paradigma actual en el tratamiento con ejercicios se desplaza hacia las intervenciones que cambian el estilo de vida que utilizan el agregado de componentes conductuales (p.ej. autoeficacia, expectativas de resultado, impedimentos, fijación de metas) para inducir cambios en el comportamiento de la actividad física en lugar de programas supervisados de ejercicios a corto plazo (Motl 2013). El agregado de estos componentes conductuales al tratamiento con ejercicios puede mejorar los efectos beneficiosos a largo plazo ya que los pacientes pueden adoptar un estilo de vida más activo físicamente.
Compleción y aplicabilidad general de las pruebas
Hay dos limitaciones importantes a destacar que comprometen la completitud y la aplicabilidad de las pruebas. Primero, solamente dos de 45 ensayos incluidos definieron específicamente la fatiga como un criterio de inclusión (Dettmers 2009, "quejarse de fatiga"; Hebert 2011, MFIS mayor de 45). Además, solamente tres ensayos identificaron específicamente la fatiga como un resultado primario(Hebert 2011; Kargarfard 2012; Sabapathy 2011). Por lo tanto, el ensayo realizado por Hebert y colegas fue el único ensayo que incluyó a pacientes con un nivel predefinido de fatiga y utilizó la fatiga como resultado primario (Hebert 2011). Esta falta de una probabilidad a priori de influir en la fatiga (es decir, direccionalidad) provocó que se disminuyera la calidad general de las pruebas. Para el entrenamiento orientado a una tarea y "otro" entrenamiento, se disminuyó la calidad de las pruebas debido a los tamaños de la muestra pequeños y la heterogeneidad grande entre las intervenciones con ejercicios. Es importante que los estudios de investigación futuros, de calidad metodológica alta, tengan poder estadístico y se diseñen para estudiar los efectos del tratamiento con ejercicios sobre la fatiga en la EM. Segundo, la presente revisión no solamente encontró una gran heterogeneidad entre los ensayos con respecto al contenido del tratamiento con ejercicios, sino también entre las diferentes condiciones control. Es necesario considerar que el efecto del tratamiento con ejercicios sobre la fatiga en los pacientes con EM, depende en parte del contraste entre las intervenciones experimentales y control. Por ejemplo, algunos ensayos utilizaron un diseño controlado con lista de espera, otros introdujeron un grupo control de ejercicios en el que se consideró que el ejercicio real no fue de intensidad suficiente para inducir cambios fisiológicos. Estos diferentes enfoques cambian el contraste entre la intervención real y los grupos control. Por lo tanto, se necesitan normas de informe meticulosas, no solamente para la intervención sino también para la condición control. Dichas normas de informe también pueden permitir el análisis de las relaciones de dosis‐respuesta entre la intensidad del tratamiento con ejercicios y el efecto sobre la fatiga.
Calidad de la evidencia
La calidad metodológica general de los ensayos incluidos fue moderada, según mostró una puntuación PEDro media de 5,3 (rango: 2 a 7). Debido a la naturaleza de la intervención (tratamiento con ejercicios) y la subjetividad del resultado (fatiga autoinformada), el cegamiento de los terapeutas, los participantes y la evaluación de los resultados se calificó estructuralmente 0 para todos los ensayos incluidos. En consecuencia, lo anterior limita la puntuación máxima de la calidad metodológica a 7 de 10. Al seleccionar solamente los 14 ensayos que calificaron de 6 ó 7 en la escala PEDro, la DME para el análisis general mejoró de manera significativa. Por lo tanto, lo anterior indica que los ensayos de calidad inferior repercuten negativamente en el ES general.
Sesgos potenciales en el proceso de revisión
Es poco probable que se hayan omitido ensayos relevantes. Se realizó una búsqueda exhaustiva y se seleccionaron de forma independiente los ensayos que evaluaron la fatiga subjetiva. El proceso de selección, la extracción de datos independiente y la evaluación del riesgo de sesgo realizados por los revisores redujeron al mínimo los errores y el sesgo en la extracción de los datos. La limitación principal en la presente revisión es la falta de ensayos con un informe adecuado y con poder estadístico suficiente que traten específicamente la fatiga. La forma asimétrica del gráfico en embudo (funnel plot) (Figura 3) también indica un efecto de estudio pequeño, que puede indicar que los ensayos negativos pequeños aún no se han publicado. Sin embargo, en su mayoría los ensayos incluidos en la presente revisión fueron pequeños y con poco poder estadístico para evaluar la fatiga relacionada con la EM (lo que se refleja en la mitad inferior del gráfico en embudo). Por lo tanto, hasta que no se realicen más ensayos grandes con poder estadístico suficiente no se podrá determinar el efecto de los ensayos pequeños no publicados sobre la calidad de las pruebas del tratamiento con ejercicios para la fatiga en los pacientes con EM. Como ilustración, si se considera la DME de 0,53 para el efecto del tratamiento con ejercicios sobre la fatiga en los pacientes con EM, se necesitarían al menos 57 participantes por brazo del ensayo para obtener un poder estadístico del 80%. De los estudios incluidos en la presente revisión, solamente el estudio realizado por Carter y colegas alcanzó dicho poder estadístico (Carter 2014).
Acuerdos y desacuerdos con otros estudios o revisiones
Entre 2005 y octubre de 2014 el conjunto del conocimiento con respecto a los efectos del tratamiento con ejercicios sobre la fatiga ha aumentado de dos ECA (Mostert 2002; Petajan 1996) a 45 ECA en la revisión actual. Entre tanto, se han publicado diversas revisiones sobre el tema (p.ej. Andreasen 2011; Asano 2009; Dalgas 2008; Kjølhede 2012; Latimer‐Cheung 2013; Motl 2008; Pilutti 2013). Una revisión reciente realizada por Latimer‐Cheung publicada en septiembre de 2013 que encontró 15 ECA (fecha de búsqueda diciembre de 2011) incluyó la fatiga como un resultado (Latimer‐Cheung 2013). Por lo tanto, entre diciembre de 2011 y octubre de 2014 (búsqueda actual) el número de ensayos publicados sobre el efecto del tratamiento con ejercicios sobre la fatiga ha aumentado de manera significativa. Lo anterior puede estar relacionado en parte con las diferencias en la definición del tratamiento con ejercicios, la fatiga y la estrategia de búsqueda posterior que se adoptó. Sin embargo, es muy probable que el interés en el tratamiento con ejercicios como una forma de mejorar los síntomas relacionados con la EM y la calidad de vida haya aumentado últimamente, lo que resulta en una mayor producción científica. En 2013, el primer metanálisis específicamente para la fatiga en la EM fue publicado por Pilutti y colegas (Pilutti 2013). Según 17 ECA identificados hasta octubre de 2012, los autores encontraron una diferencia de medias estandarizada ponderada de 0,45 a favor del tratamiento con ejercicios (DME 0,12; IC del 95%: 0,22 a 0,68; Z = 3,88; valor de p < 0,001). Esta diferencia es solamente algo más pequeña que la DME encontrada en la presente revisión (DME 0,53). Sin embargo, todavía existen limitaciones metodológicas importantes a superar en los estudios de investigación futuros. Ensayos de alta calidad con poder estadístico suficiente dirigidos específicamente a la fatiga deben mejorar la comprensión de los mecanismos subyacentes, la relación dosis‐respuesta y los pacientes que responden versus los que no responden. Además, estos ensayos pueden tener una repercusión significativa sobre el ES calculado.

Study flow diagram.

Risk of bias graph: review authors' judgements about each risk of bias item presented as percentages across all included trials.

Funnel plot of trials comparing exercise versus a non‐exercise control condition.
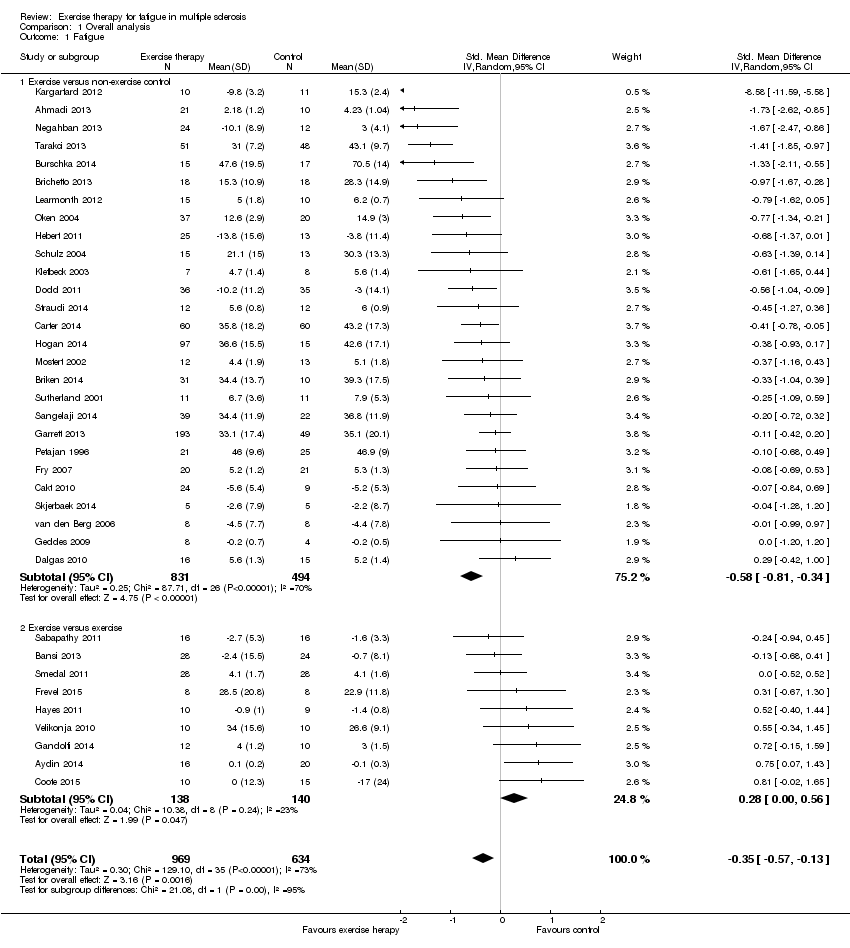
Comparison 1 Overall analysis, Outcome 1 Fatigue.

Comparison 2 Sensitivity analysis (Intervention contrast), Outcome 1 Fatigue.

Comparison 3 Per fatigue measure, Outcome 1 Fatigue.
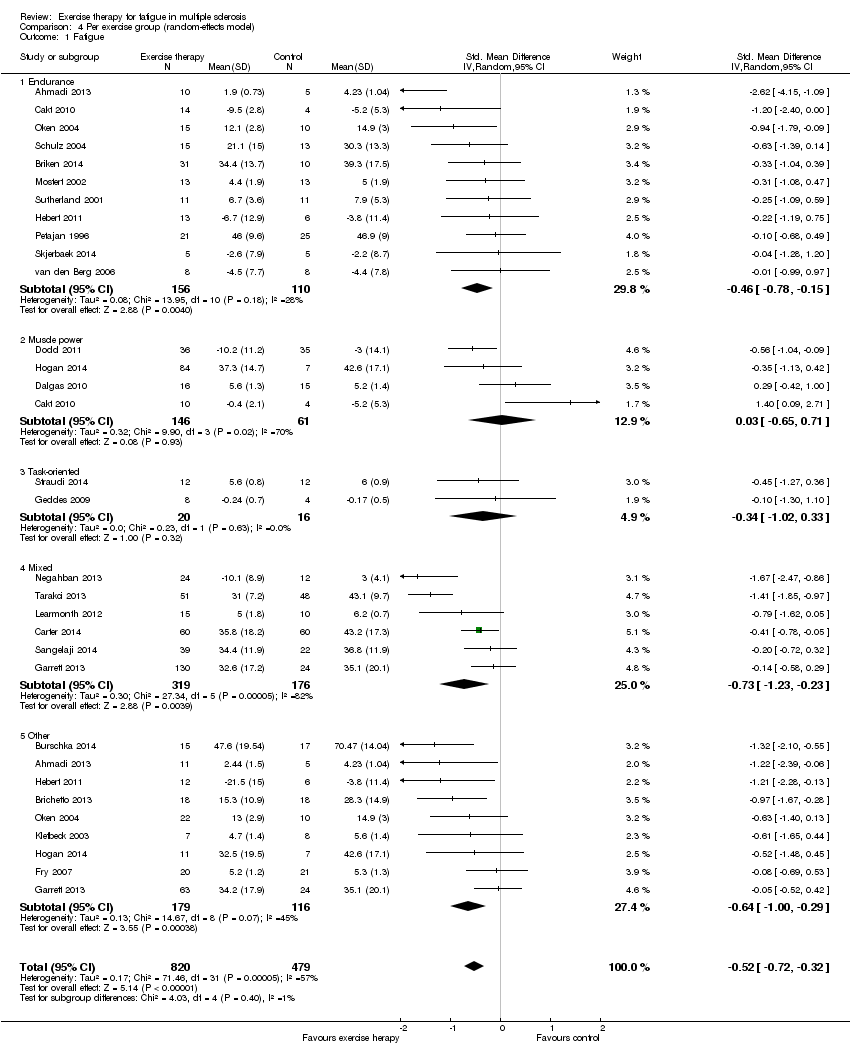
Comparison 4 Per exercise group (random‐effects model), Outcome 1 Fatigue.

Comparison 5 Per exercise group (fixed‐effect model), Outcome 1 Fatigue.

Comparison 6 Sensitivity analysis (methodological quality), Outcome 1 Fatigue.
| Effect of exercise therapy for fatigue in multiple sclerosis ‐ overall analysis | |||||
| Patient or population: people with multiple sclerosis | |||||
| Outcomes | Illustrative comparative risks* (95% CI) | No of participants | Quality of the evidence | Comments | |
| Assumed risk | Corresponding risk | ||||
| Control | Overall analysis | ||||
| Fatigue | No risk assumed | The mean fatigue outcome in the intervention groups was | 1603 | ⊕⊕⊕⊝ | Indirectness (‐1) |
| Exercise versus no‐exercise control | No risk assumed | The mean fatigue outcome in the intervention groups was 0.58 standard deviations lower (0.81 to 0.34 lower) compared to a no‐exercise control group | 1325 | ⊕⊕⊕⊝ | Indirectness (‐1) |
| Exercise versus exercise | No risk assumed | The mean fatigue outcome in the intervention groups was 0.28 standard deviations higher (0 to 0.56 higher) compared to an exercise control group | 278 | ⊕⊕⊝⊝ | Indirectness (‐1) Imprecision (‐1) |
| *The argumentation for downgrading the grades of evidence is provided in the footnotes. CI: confidence interval. | |||||
| GRADE Working Group grades of evidence | |||||
| 1 The presence of fatigue, beyond a pre‐defined level, was most often not an inclusion criterion. In addition, fatigue was not a primary outcome. | |||||
| Effect of exercise therapy for fatigue in multiple sclerosis ‐ analysis per fatigue measure | |||||
| Patient or population: people with multiple sclerosis | |||||
| Outcomes | Illustrative comparative risks* (95% CI) | No of participants | Quality of the evidence | Comments | |
| Assumed risk | Corresponding risk | ||||
| Control | Per fatigue measure | ||||
| Modified Fatigue Impact Scale | No risk assumed | The mean fatigue, on the Modified Fatigue Impact Scale, in the intervention groups was 0.40 standard deviations lower (0.58 to 0.22 lower) | 688 | ⊕⊕⊕⊝ | Indirectness (‐1) |
| Fatigue Severity Scale | No risk assumed | The mean fatigue, on the Fatigue Severity Scale, in the intervention groups was 0.56 standard deviations lower (0.95 to 17 lower) | 449 | ⊕⊕⊕⊝ | Indirectness (‐1) |
| Other | No risk assumed | The mean fatigue, on the 'other' included fatigue measures, in the intervention groups was 0.54 standard deviations lower (1.01 to 0.07 lower) | 167 | ⊕⊕⊝⊝ | Indirectness (‐1) Imprecision (‐1) |
| *The argumentation for downgrading the grades of evidence is provided in the footnotes. CI: confidence interval. | |||||
| GRADE Working Group grades of evidence | |||||
| 1 The presence of fatigue, beyond a pre‐defined level, was most often not an inclusion criterion. In addition, fatigue was not a primary outcome. | |||||
| Effect of exercise therapy for fatigue in multiple sclerosis ‐ analysis per exercise modality | |||||
| Patient or population: people with multiple sclerosis | |||||
| Outcomes | Illustrative comparative risks* (95% CI) | No of participants | Quality of the evidence | Comments | |
| Assumed risk | Corresponding risk | ||||
| Control | Per exercise group | ||||
| Endurance training | No risk assumed | The mean fatigue outcome in the intervention groups applying endurance training was 0.43 standard deviations lower (0.69 to 0.17 lower) | 266 | ⊕⊕⊕⊝ | Indirectness (‐1) |
| Muscle power training | No risk assumed | The mean fatigue outcome in the intervention groups applying muscle power training was 0.03 standard deviations higher (0.65 lower to 0.71 higher) | 207 | ⊕⊕⊝⊝ | Indirectness (‐1) Imprecision (‐1) |
| Task‐oriented training | No risk assumed | The mean fatigue outcome in the intervention groups applying task‐oriented training was 0.34 standard deviations lower (1.02 lower to 0.33 higher) | 36 | ⊕⊝⊝⊝ | Indirectness (‐1) Imprecision (‐2) |
| Mixed training | No risk assumed | The mean fatigue outcome in the intervention groups applying mixed training was 0.73 standard deviations lower (1.23 to 0.23 lower) | 495 | ⊕⊕⊕⊝ | Indirectness (‐1) |
| 'Other' training | No risk assumed | The mean fatigue outcome in the intervention groups applying 'Other' types of training was 0.54 standard deviations lower (0.79 to 0.29 lower) | 295 | ⊕⊕⊝⊝ | Indirectness (‐1) Imprecision (‐1) |
| *The argumentation for downgrading the grades of evidence is provided in the footnotes. The data is some sub‐groups was heterogeneous, and in some homogeneous. Hence, data for this 'Summary of findings' table is extracted from Analysis 4.1 and 5.1. CI: confidence interval. | |||||
| GRADE Working Group grades of evidence | |||||
| 1 The presence of fatigue, beyond a pre‐defined level, was most often not an inclusion criterion. In addition, fatigue was not a primary outcome. | |||||
| Study ID | Fatigue scale | ITT | 1 | 2 | 3 | 4 | 5 | 6 | 7 | 8 | 9 | 10 | Total score |
| Ahmadi 2013 | FSS | no | 1 | 0 | 1 | 0 | 0 | 0 | 1 | 1 | 1 | 1 | 6 |
| Aydin 2014 | FSS | no | 1 | 0 | 1 | 0 | 0 | 0 | 1 | 0 | 1 | 1 | 5 |
| Bansi 2013 | FSMC | no | 1 | 1 | 1 | 0 | 0 | 0 | 1 | 1 | 1 | 1 | 7 |
| Brichetto 2013 | MFIS | no | 1 | 0 | 1 | 0 | 0 | 0 | 1 | 1 | 1 | 1 | 6 |
| Briken 2014 | MFIS | no | 1 | 1 | 0 | 0 | 0 | 0 | 1 | 0 | 1 | 1 | 5 |
| Burschka 2014 | FSMC | no | 0 | 0 | 0 | 0 | 0 | 0 | 0 | 0 | 1 | 1 | 2 |
| Cakt 2010 | FSS | no | 1 | 1 | 1 | 0 | 0 | 0 | 0 | 0 | 1 | 1 | 5 |
| Carter 2014 | MFIS | yes | 1 | 1 | 1 | 0 | 0 | 0 | 1 | 1 | 1 | 1 | 7 |
| Castro‐Sanchez 2012 | MFIS, FSS | no | 1 | 1 | 1 | 0 | 0 | 0 | 1 | 0 | 1 | 1 | 6 |
| Collett 2011 | FSS | yes | 1 | 1 | 1 | 0 | 0 | 0 | 1 | 1 | 1 | 1 | 7 |
| Coote 2014 | MFIS | no | 1 | 1 | 1 | 0 | 0 | 0 | 0 | 1 | 1 | 1 | 6 |
| Dalgas 2010 | FSS | no | 1 | 1 | 1 | 0 | 0 | 0 | 0 | 1 | 1 | 1 | 6 |
| Dettmers 2009 | MFIS | no | 1 | 1 | 1 | 0 | 0 | 0 | 0 | 1 | 0 | 0 | 4 |
| Dodd 2011 | MFIS | yes | 1 | 1 | 1 | 0 | 0 | 0 | 1 | 1 | 1 | 1 | 7 |
| Frevel 2014 | MFIS, FSS | no | 1 | 0 | 1 | 0 | 0 | 0 | 1 | 0 | 1 | 1 | 5 |
| Fry 2007 | FSS | no | 1 | 0 | 1 | 0 | 0 | 0 | 1 | 1 | 0 | 1 | 5 |
| Gandolfi 2014 | FSS | no | 1 | 1 | 1 | 0 | 0 | 0 | 0 | 1 | 1 | 1 | 6 |
| Garrett 2013 | MFIS | no | 1 | 1 | 1 | 0 | 0 | 0 | 0 | 1 | 1 | 1 | 6 |
| Geddes 2009 | FSS | no | 1 | 0 | 1 | 0 | 0 | 0 | 0 | 1 | 1 | 1 | 5 |
| Hayes 2011 | FSS | no | 1 | 0 | 1 | 0 | 0 | 0 | 1 | 1 | 1 | 1 | 6 |
| Hebert 2011 | MFIS | yes | 1 | 1 | 1 | 0 | 0 | 0 | 1 | 1 | 1 | 1 | 7 |
| Hogan 2014 | MFIS | no | 1 | 1 | 0 | 0 | 0 | 0 | 0 | 1 | 1 | 1 | 5 |
| Kargarfard 2012 | MFIS | yes | 1 | 1 | 1 | 0 | 0 | 0 | 0 | 1 | 1 | 1 | 6 |
| Klefbeck 2003 | FSS | no | 1 | 0 | 1 | 0 | 0 | 0 | 1 | 0 | 1 | 1 | 5 |
| Learmonth 2011 | FSS | yes | 1 | 1 | 1 | 0 | 0 | 0 | 0 | 1 | 1 | 1 | 6 |
| McCullagh 2008 | MFIS | no | 0 | 0 | 1 | 0 | 0 | 0 | 0 | 1 | 1 | 1 | 4 |
| Mori 2011 | FSS | no | 1 | 0 | 1 | 0 | 0 | 0 | 1 | 1 | 0 | 0 | 4 |
| Mostert 2002 | FSS | no | 1 | 0 | 1 | 0 | 0 | 0 | 0 | 0 | 0 | 1 | 3 |
| Negahban 2013 | FSS | no | 1 | 0 | 1 | 0 | 0 | 0 | 1 | 1 | 1 | 1 | 6 |
| Oken 2004 | MFI (general) | no | 1 | 0 | 1 | 0 | 0 | 0 | 0 | 1 | 0 | 1 | 4 |
| Petajan 1996 | POMS fatigue, FSS | no | 1 | 0 | 1 | 0 | 0 | 0 | 0 | 1 | 0 | 1 | 4 |
| Plow 2009 | MFIS | no | 1 | 0 | 0 | 0 | 0 | 0 | 0 | 1 | 0 | 0 | 2 |
| Rampello 2007 | MFIS | no | 1 | 0 | 1 | 0 | 0 | 0 | 0 | 1 | 1 | 1 | 5 |
| Sabapathy 2010 | MFIS | no | 1 | 0 | 1 | 0 | 0 | 0 | 0 | 1 | 1 | 1 | 5 |
| Sangelaji 2014 | FSS | no | 1 | 0 | 1 | 0 | 0 | 0 | 0 | 1 | 0 | 0 | 3 |
| Schulz 2004 | MFIS | no | 1 | 0 | 0 | 0 | 0 | 0 | 1 | 1 | 1 | 1 | 5 |
| Smedal 2011 | FSS | yes | 1 | 0 | 1 | 0 | 0 | 0 | 1 | 1 | 1 | 1 | 6 |
| Skjerbaek 2014 | FSMC | no | 1 | 1 | 1 | 0 | 0 | 0 | 1 | 1 | 1 | 1 | 7 |
| Straudi 2014 | FSS | yes | 1 | 0 | 1 | 0 | 0 | 0 | 1 | 1 | 1 | 1 | 6 |
| Surakka 2004 | FSS | no | 1 | 0 | 1 | 0 | 0 | 0 | 0 | 1 | 1 | 1 | 5 |
| Sutherland 2001 | POMS fatigue | no | 1 | 0 | 1 | 0 | 0 | 0 | 1 | 1 | 1 | 1 | 6 |
| Tarakci 2013 | FSS | no | 1 | 1 | 1 | 0 | 0 | 0 | 1 | 1 | 1 | 1 | 7 |
| van den Berg 2006 | FSS | no | 1 | 1 | 1 | 0 | 0 | 0 | 0 | 1 | 1 | 1 | 7 |
| Velikonja 2010 | MFIS | no | 1 | 0 | 0 | 0 | 0 | 0 | 1 | 0 | 0 | 1 | 4 |
| Wier 2011 | FSS | no | 1 | 0 | 1 | 0 | 0 | 0 | 1 | 1 | 1 | 0 | 5 |
| % of trials | 96% | 42% | 87% | 0% | 0% | 0% | 53% | 80% | 80% | 89% | |||
| Risk of bias assessment based on the PEDro scale; see Appendix 5 for abbreviations. 1: Random allocation. 2: Concealed allocation. 3: Groups similar at baseline on disease severity, fatigue, and depression (if reported). 4: Blinding of all participants (zero per definition). 5: Blinding of all therapists. 6: Blinding of assessors. 7: Measures of key outcome (fatigue) > 85% of participants initially allocated to group (rated for fatigue outcome). 8: All participants of whom outcome is available received treatment or control; if not, intention‐to‐treat (ITT) analysis was performed. 9: Between‐group statistics of fatigue outcome reported. 10: Point measures and measures of variability for fatigue provided. | |||||||||||||
| Study | Time (i.e. duration of intervention) | Fatigue scale | Effect | Other outcomes | Effect |
| Ahmadi 2013 Compared aerobic training vs. control | 8 weeks | FSS | ‐ | BBS Walk time Walk distance BDI BAI | + ‐ + ns ns |
| Ahmadi 2013 Compared yoga vs. control | 8 weeks | FSS | ‐ | BBS Walk time Walk distance BDI BAI | + ns + ‐ ‐ |
| Brichetto 2013 Compared Nintendo® Wii® balance training vs. control | 4 weeks | MFIS | ns | BBS Open‐eye stabilometry Closed‐eye stabilometry | + ‐ ‐ |
| Briken 2014 Compared arm‐ergometry vs. control | 10 weeks | MFIS | ‐ | VO2peak 6MWT SDMT VLMT TAP (alertness) TAP (shift of attention) LPS RWT IDS ‐ SR30 | ns + ns + ns ‐ ns ns ‐ |
| Briken 2014 Compared rowing vs. control | 10 weeks | MFIS | ns | VO2peak 6MWT SDMT VLMT TAP (alertness) TAP (shift of attention) LPS RWT IDS ‐ SR30 | ns ns ns + ns ns ns ns ns |
| Briken 2014 Compared bicycling vs. control | 10 weeks | MFIS | ns | VO2peak 6MWT SDMT VLMT TAP (alertness) TAP (shift of attention) LPS RWT IDS ‐ SR30 | + + ns + ‐ ‐ ns ns ‐ |
| Burschka 2014 Compared Tai‐Chi yoga vs. control * no change of fatigue in experimental group, increase in fatigue in control group | 24 weeks | FSMC* | ‐ | Balance Co‐ordination CES‐D QLS | + + ‐ + |
| Cakt 2010 Compared progressive resistance training vs. control | 8 weeks | FSS | ‐ | Duration of exercise Wmax TUG DGI FR FES 10MWT BDI SF‐36 | + + ‐ + + ‐ ‐ ‐ unk |
| Cakt 2010 Compared home‐based exercise vs. control | 8 weeks | FSS | ns | Duration of exercise Wmax TUG DGI FR FES 10MWT BDI SF‐36 | ns ns ns ns ns ns ns ns unk |
| Carter 2014 Compared a pragmatic exercise intervention vs. control | 12 weeks | MFIS | ‐ | GLTEQ Accelerometer MSQoL‐54 MSFC 6MWT EDSS | + + + ns ns ns |
| Castro‐Sanchez 2012 Compared Ai‐Chi aquatic programme vs. control | 20 weeks | FSS MFIS ‐ physical ‐ cognitive ‐ psychosocial | ns ‐ ns ns | Pain MPQ‐PRI MPQ‐PPI RMDQ Spasm ‐ physical ‐ psychological BDI BI | ‐ ‐ ns ‐ ‐ ‐ ‐ ‐ ns |
| Dalgas 2010 Compared progressive resistance training vs. control | 12 weeks | FSS MFI‐20 ‐ General fatigue ‐ Physical fatigue ‐ Reduced activity ‐ Reduced motivation ‐ Mental fatigue | ‐ ‐ ns ns ns ns | MDI SF‐36 ‐ PCS ‐ MCS MVC (knee extensor) FS (%) | ‐ ‐ ns + + |
| Dodd 2011 Compared progressive resistance training vs. control | 10 weeks | MFIS ‐ physical ‐ cognitive ‐ psychosocial | ‐ ‐ ns ns | MSIS‐88 muscle stiffness MSIS‐88 muscle spasms 2MWT Walking speed Leg press endurance (repetitions) Reversed leg press endurance (repetitions) 1RM leg press (kg) 1RM reversed leg press (kg) WHOQoL‐BREF overall quality of life WHOQoL‐BREF overall health WHOQoL‐BREF physical health | ns ns ns ns ns + ns ns ns ns + |
| Fry 2007 Compared inspiratory muscle training vs. control | 10 weeks | No interaction effects reported | |||
| Garrett 2013 Compared physiotherapist‐led exercise vs. control | 10 weeks | MFIS ‐ physical ‐ cognitive | ‐ ‐ ns | MSIS‐29 physical component MSIS‐29 cognitive component 6MWT | ‐ ‐ + |
| Garrett 2013 Compared fitness instructor‐led exercise vs. control | 10 weeks | MFIS ‐ physical ‐ cognitive | ‐ ‐ ns | MSIS‐29 physical component MSIS‐29 cognitive component 6MWT | ‐ ‐ + |
| Garrett 2013 Compared yoga vs. control | 10 weeks | MFIS ‐ physical ‐ cognitive | ‐ ‐ ns | MSIS‐29 physical component MSIS‐29 cognitive component 6MWT | ns ‐ ns |
| Geddes 2009 Compared home walking vs. control | 12 weeks | FSS | ns | 6MWT PCI RPE | ns ns ns |
| Hebert 2011 Compared vestibular rehabilitation vs. no exercise control | 6 weeks | MFIS | ‐ | SOT DHI 6MWT | + ‐ ns |
| Hebert 2011 Compared exercise control vs. no exercise control | 6 weeks | MFIS | ns | SOT DHI 6MWT | ns ns ns |
| Hogan 2014 Compared group physiotherapy vs. control | 10 weeks | MFIS | ns | BBS 6MWT MSIS29v2 | + ns ns |
| Hogan 2014 Compared individual physiotherapy vs. control | 10 weeks | MFIS | ns | BBS 6MWT MSIS29v2 | + ns ns |
| Hogan 2014 Compared yoga vs. control | 10 weeks | MFIS | ns | BBS 6MWT MSIS29v2 | + ns ns |
| Kargarfard 2012 Compared aquatic training vs. control | 8 weeks | MFIS ‐ physical ‐ psychosocial ‐ cognitive | ‐ ‐ ‐ ‐ | MSQoL‐54 ‐ Physical ‐ Mental | + + |
| Klefbeck 2003 Compared inspiratory muscle training vs. control | 10 weeks | No interaction effects reported | |||
| Learmonth 2011 Compared leisure centre‐based exercise group vs. control | 12 weeks | FSS | ns | T25FW 6MWT BBS TUG QPW BMI PF ABC HADS LMSQoL | ns ns ns ns ns ns + ns ns ns |
| McCullagh 2008 Compared group circuit training vs. control | 12 weeks | No interaction effects reported | |||
| Mori 2011 Compared transcranial magnetic stimulation (TMS) vs. control | 2 weeks | No interaction effects reported | |||
| Mori 2011 Compared exercise control vs. control | 2 weeks | No interaction effects reported | |||
| Mostert 2002 Compared short‐term exercise vs. control | 4 weeks | No interaction effects reported | |||
| Negahban 2013 Compared exercise therapy vs. control | 5 weeks | FSS | ‐ | VAS scale for pain MAS BBS TUG 10MWT 2MWT MSQoL‐54 | ns ‐ + ‐ ‐ + ns |
| Negahban 2013 Compared massage + exercise therapy vs. control | 5 weeks | FSS | ‐ | VAS scale for pain MAS BBS TUG 10MWT 2MWT MSQoL‐54 | ‐ ns + ‐ ‐ + ns |
| Oken 2004 Compared Iyengar yoga classes plus home programme vs. control | 24 weeks | No interaction effects reported | |||
| Oken 2004 Compared weekly bicycle exercise classes along with home exercise vs. control | 24 weeks | No interaction effects reported | |||
| Petajan 1996 Compared aerobic training vs. control | 15 weeks | FSS POMS ‐ fatigue | ns ns | EDSS ISS VO2max PWC HRmax Upper extremity strength Lower extremity strength POMS SIP | ns ns + + ns + + ns ns |
| Sangelaji 2014 Compared combination exercise therapy vs. control | 10 weeks | FSS | ‐ | EDSS BBS 6MWT MSQoL | ns + + + |
| Schulz 2004 Compared aerobic interval training vs. control | 8 weeks | MFIS ‐ physical ‐ cognitive ‐ social | ns ns ns ns | Wmax VO2max HRmax W endurance Lactate change Immune and neurotrophic factors IL‐6 (rest) IL‐6 (AUC) sIL‐6R (rest) sIL‐6R (AUC) BDNF (rest) BDNF (AUC) NGF (rest) NGF (AUC) HAQUAMS ‐ fatigue/thinking ‐ mobility lower ‐ mobility upper ‐ social function ‐ mood | ns ns ns ns ‐ ns ns ns ‐ ns ns ns ns ‐ ns ns ns ‐ ‐ |
| Skjerbaek 2014 Compared endurance training vs. control | 4 weeks | FSMC | ns | VO2peak HRpeak 9HPT Hand grip power Box and blocks 6‐minute wheelchair MDI MSIS‐29 | ns ns ns ns ns ns ns ns |
| Straudi 2014 Compared task‐oriented circuit training vs. control | 2 weeks | FSS | ns | 10MWT 6MWT TUG DGI MSWS‐12 MSIS‐29 ‐ physical ‐ psychosocial ‐ psychological | ns + ns ns + + + ‐ |
| Surakka 2004 Compared inpatient rehabilitation plus home‐based exercise vs. control | 26 weeks | FSS | ns | Leg flexor/extensor torque Motor fatigue Ambulatory fatigue index | ns ns ns |
| Sutherland 2001 Compared aerobic aquatic training vs. control | 10 weeks | No interaction effects reported | |||
| Tarakci 2013 Compared group exercise programme vs. control | 12 weeks | FSS | ‐ | BBS 10MWT R Hip flexors MAS R Hamstring MAS R Achilles MAS MusiQoL | + ‐ ‐ ‐ ‐ ‐ ‐ ‐ ‐ + |
| van den Berg 2006 Compared treadmill exercise vs. control (cross‐over) | 4 weeks | No interaction effects reported | |||
| ns, non‐significant; '+', a significant group‐by‐time effect in favour of the exercise group versus the non‐exercise control group; '‐' , a significant negative group‐by‐time effect in the exercise group versus the non‐exercise control group. For an overview of abbreviations, see Appendix 5. | |||||
| Study | Time (i.e. duration of intervention) | Fatigue scale | Effect | Other outcomes | Effect |
| Ahmadi 2013 Compared aerobic training vs. yoga | 8 weeks | FSS | ns | BBS Walk time Walk distance BDI BAI | ns ns ns ns ‐ |
| Aydin 2014 Compared hospital‐based callisthenic exercise vs. home‐based callisthenic exercise | 12 weeks | FSS | ns | 10MWT BBS MusiQoL HADS depression HADS anxiety | ns + ns + ns |
| Bansi 2013 Compared overland endurance training vs. aquatic endurance training | 3 weeks | FSMC ‐ motor ‐ cognitive | ns ns ns | Loadmax VO2peak HRpeak BORG | ns ns ns ns |
| Briken 2014 Compared arm‐ergometry vs. rowing | 10 weeks | No interaction effects reported | |||
| Briken 2014 Compared rowing vs. bicycling ergometry | 10 weeks | No interaction effects reported | |||
| Briken 2014 Compare arm‐ergometry vs. bicycling ergometry | 10 weeks | No interaction effects reported | |||
| Cakt 2010 Compared progressive resistance training vs. home‐based exercise | 8 weeks | FSS | ‐ | Duration of exercise Wmax TUG DGI FR FES 10MWT BDI SF‐36 | + + ‐ + + ‐ ns ‐ unk |
| Collett 2011 Compared endurance training vs. intermittent endurance training | 12 weeks | No interaction effects reported | |||
| Collett 2011 Compared intermittent training vs. mixed endurance training | 12 weeks | No interaction effects reported | |||
| Collett 2011 Compared endurance training vs. mixed endurance training | 12 weeks | No interaction effects reported | |||
| Coote 2014 Compared progressive resistance training vs. progressive resistance training augmented by neuromuscular electrical stimulation | 12 weeks | MFIS | ‐ | Quadriceps strength Hip strength Quadriceps endurance VAS lower limb spasticity TUG MSWS‐12 BBS MSIS29v2 | ns ns ns ns ns ns ns ns |
| Dettmers 2009 Compared endurance training vs. control treatment | 3 weeks | MFIS | ns | FSMC Maximal walking distance rWa BDI HAQUAMS | ns + + ns ns |
| Frevel 2014 Compare Internet home‐based training vs. hippotherapy | 12 weeks | MFIS FSS | ns ns | BBS DGI Isometric muscle strength TUG 2MWT HAQUAMS | ns ns ns ns ns ns |
| Gandolfi 2014 Compared robot‐assisted gait training vs. sensory integration balance training | 6 weeks | FSS | ns | Gait analysis BBS SOT Stabilometric assessment MSQoL‐54 | ns ns ns ns ns |
| Garrett 2013 Compared physiotherapist‐led exercise vs. fitness instructor‐led exercise | 10 weeks | No interaction effects reported | |||
| Garrett 2013 Compared fitness instructor‐led exercise vs. yoga | 10 weeks | No interaction effects reported | |||
| Garrett 2013 Compared physiotherapist‐led exercise vs. yoga | 10 weeks | No interaction effects reported | |||
| Hayes 2011 Compared a resistance training programme supplementary to a standard exercise programme vs. standard exercise programme | 12 weeks | FSS | ns | Isometric strength 6MWT TUG Stair ascent Stair descent 10MWT self paced 10MWT max paced BBS | ns ns ns + + ns ns ‐ |
| Hebert 2011 Compared vestibular rehabilitation vs. exercise control | 6 weeks | MFIS | ‐ | SOT DHI 6MWT | + ‐ ns |
| Hogan 2014 Compared group physiotherapy vs. individual physiotherapy | 10 weeks | MFIS | unk | BBS 6MWT MSIS29v2 | ns unk unk |
| Hogan 2014 Compared individual physiotherapy vs. yoga | 10 weeks | No interaction effects reported | |||
| Hogan 2014 Compared group physiotherapy vs. yoga | 10 weeks | No interaction effects reported | |||
| Mori 2011 Compared transcranial magnetic stimulation (TMS) vs. exercise control | 2 weeks | No interaction effects reported | |||
| Negahban 2013 Compared exercise therapy vs. exercise therapy + massage | 5 weeks | FSS | ns | VAS scale for pain MAS BBS TUG 10MWT 2MWT MSQoL‐54 | ‐ ns ns ns ns ns ns |
| Oken 2004 Compared Iyengar yoga classes vs. weekly bicycle exercise classes | 24 weeks | No interaction effects reported | |||
| Plow 2009 Compared individualized physical rehabilitation vs. group wellness intervention | 8 weeks | No interaction effects reported | |||
| Rampello 2007 Compared aerobic training vs. neurorehabilitation programme (cross‐over) | 8 weeks | No interaction effects reported | |||
| Sabapathy 2011 Compared resistance training vs. endurance training (cross‐over) | 8 weeks | No interaction effects reported | |||
| Smedal 2011 Compared warm vs. cold climate physiotherapy | 4 weeks | FSS | ns | 6MWT RPE TUG 10MWT BBS TIS MSIS‐29 physical MSIS‐29 psychosocial MHAQ Pain Balance Gait | + ‐ ns ns ns ns ‐ ‐ ‐ ‐ ‐ ‐ |
| Velikonja 2010 Compared sports climbing vs. yoga | 10 weeks | No interaction effects reported | |||
| Wier 2011 Compared robot‐assisted treadmill training vs. body‐weight supported treadmill training | 3 weeks | No interaction effects reported | |||
| ns, non‐significant; '+', a significant group‐by‐time effect in favour of the experimental exercise condition versus the exercise control condition; '‐' , a significant negative group‐by‐time effect in the experimental exercise condition versus the exercise control condition; unk, unknown. For an overview of abbreviations, see Appendix 5. | |||||
| Outcome or subgroup title | No. of studies | No. of participants | Statistical method | Effect size |
| 1 Fatigue Show forest plot | 36 | 1603 | Std. Mean Difference (IV, Random, 95% CI) | ‐0.35 [‐0.57, ‐0.13] |
| 1.1 Exercise versus non‐exercise control | 27 | 1325 | Std. Mean Difference (IV, Random, 95% CI) | ‐0.58 [‐0.81, ‐0.34] |
| 1.2 Exercise versus exercise | 9 | 278 | Std. Mean Difference (IV, Random, 95% CI) | 0.28 [0.00, 0.56] |
| Outcome or subgroup title | No. of studies | No. of participants | Statistical method | Effect size |
| 1 Fatigue Show forest plot | 26 | 1304 | Std. Mean Difference (IV, Random, 95% CI) | ‐0.53 [‐0.73, ‐0.33] |
| Outcome or subgroup title | No. of studies | No. of participants | Statistical method | Effect size |
| 1 Fatigue Show forest plot | 26 | 1304 | Std. Mean Difference (IV, Random, 95% CI) | ‐0.53 [‐0.73, ‐0.33] |
| 1.1 Modified Fatigue Impact Scale (MFIS) | 8 | 688 | Std. Mean Difference (IV, Random, 95% CI) | ‐0.40 [‐0.58, ‐0.22] |
| 1.2 Fatigue Severity Scale (FSS) | 13 | 449 | Std. Mean Difference (IV, Random, 95% CI) | ‐0.56 [‐0.95, ‐0.17] |
| 1.3 Other | 5 | 167 | Std. Mean Difference (IV, Random, 95% CI) | ‐0.54 [‐1.01, ‐0.07] |
| Outcome or subgroup title | No. of studies | No. of participants | Statistical method | Effect size |
| 1 Fatigue Show forest plot | 26 | 1299 | Std. Mean Difference (IV, Random, 95% CI) | ‐0.52 [‐0.72, ‐0.32] |
| 1.1 Endurance | 11 | 266 | Std. Mean Difference (IV, Random, 95% CI) | ‐0.46 [‐0.78, ‐0.15] |
| 1.2 Muscle power | 4 | 207 | Std. Mean Difference (IV, Random, 95% CI) | 0.03 [‐0.65, 0.71] |
| 1.3 Task‐oriented | 2 | 36 | Std. Mean Difference (IV, Random, 95% CI) | ‐0.34 [‐1.02, 0.33] |
| 1.4 Mixed | 6 | 495 | Std. Mean Difference (IV, Random, 95% CI) | ‐0.73 [‐1.23, ‐0.23] |
| 1.5 Other | 9 | 295 | Std. Mean Difference (IV, Random, 95% CI) | ‐0.64 [1.00, ‐0.29] |
| Outcome or subgroup title | No. of studies | No. of participants | Statistical method | Effect size |
| 1 Fatigue Show forest plot | 26 | 1299 | Std. Mean Difference (IV, Fixed, 95% CI) | ‐0.50 [‐0.62, ‐0.37] |
| 1.1 Endurance | 11 | 266 | Std. Mean Difference (IV, Fixed, 95% CI) | ‐0.43 [‐0.69, ‐0.17] |
| 1.2 Muscle power | 4 | 207 | Std. Mean Difference (IV, Fixed, 95% CI) | ‐0.19 [‐0.53, 0.15] |
| 1.3 Task‐oriented | 2 | 36 | Std. Mean Difference (IV, Fixed, 95% CI) | ‐0.34 [‐1.02, 0.33] |
| 1.4 Mixed | 6 | 495 | Std. Mean Difference (IV, Fixed, 95% CI) | ‐0.63 [‐0.83, ‐0.43] |
| 1.5 Other | 9 | 295 | Std. Mean Difference (IV, Fixed, 95% CI) | ‐0.54 [‐0.79, ‐0.29] |
| Outcome or subgroup title | No. of studies | No. of participants | Statistical method | Effect size |
| 1 Fatigue Show forest plot | 14 | 801 | Std. Mean Difference (IV, Random, 95% CI) | ‐0.64 [‐0.95, ‐0.32] |