化疗与西妥昔单抗以及化疗单独用于化疗初治的晚期非小细胞肺癌
摘要
研究背景
在晚期非小细胞肺癌(NSCLC)中,标准细胞毒性化疗的有效性似乎已经达到了“稳定”,并且需要不断的新疗法来进一步改善预后。西妥昔单抗是一种单克隆抗体,靶向表皮生长因子受体(EGFR)信号通路。基本上,它旨在抑制癌症的其他生物过程的生长和转移。结合化疗,在一些随机对照试验(RCTs)中,它在晚期NSCLC的一线治疗中,评价结果不一致。
研究目的
评价与单独化疗相比,化疗联合西妥昔单抗用于以前未用化疗或表皮生长因子受体(EGFR)靶向药物治疗的晚期非小细胞肺癌(NSCLC)的疗效和毒性。
检索策略
我们系统地检索了Cochrane肺癌评价组的专业注册库( Cochrane Lung Cancer Review Group's Specialized Register)(从建库到2013年12月17日)、Cochrane对照试验中心注册库(Cochrane Central Register of Controlled Trials, CENTRAL)(Cochrane图书馆,2013年第12期)、MEDLINE(通过PubMed,1966年至2013年12月17日)、EMBASE(1980年至2013年12月17日)、ClinicalTrials.gov(从成立到2013年12月17日)和世界卫生组织(WHO)国际临床试验注册平台(从建库到2013年12月17日)。我们还从美国临床肿瘤学会和欧洲医学肿瘤学会(2000‐2013年12月17日)手工检索了与肺癌相关的在研试验。我们检查了所有合格原始研究和综述文章的参考文献列表,发现额外的潜在符合纳入标准的研究。
纳入排除标准
符合条件的研究是比较之前未接受化疗或EGFR靶向药物的晚期NSCLC患者,使用化疗联合西妥昔单抗或单独化疗的随机对照试验,并且至少测量了以下一项:总生存期,无进展生存期,一年生存率,客观缓解率,生活质量或严重不良事件。
资料收集与分析
我们使用Cochrane协作组的标准方法学流程。我们从每项研究中提取了以下资料:出版细节、受试者特征、干预和对照组的治疗方案、结局测量和效应大小,以及与研究方法学质量相关的信息。我们通过风险比(RR)和危险比(HR)分别以95%的置信区间(CIs)来衡量治疗对二分和事件发生时间的影响。我们使用Review Manager 5 随机效应模型进行meta分析。我们采用了Mantel‐Haenszel方法来合并RR,而使用逆方差方法来合并HR。
主要结果
我们纳入了4个临床试验,有2018位受试者。受试者大多是白人(女性:26%至56%),平均年龄为58至66岁。她们其中大约有一半是经组织学验证的腺癌。在 2018 名患者中,83% 到 99% 的患者使用东部合作肿瘤组(Eastern Cooperative Oncology Group)来测量其状态,得分为 0 到 1(通常被视为身体“健康”)。
所有四项研究都提供了关于总生存期、无进展生存期、一年生存率、客观缓解率和严重不良事件的数据,还有两项研究(1901例患者)也调查了西妥昔单抗对生活质量的影响。总生存期和一年生存率的数据存在偏倚风险较低,所有其他结局的偏倚风险较高,主要原因是缺乏盲法。与单独化疗相比,化疗加西妥昔单抗提高了总生存期(10.5个月对8.9个月;HR=0.87, 95% CI [0.79, 0.96]),一年生存率(45% 对 40%;RR=1.13, 95% CI [1.02, 1.25]),客观缓解率(30% 对 23%;RR=1.31, 95% CI [1.14, 1.51])。无进展生存期的差异处于统计显著性的界值(4.9个月对4.4个月;HR=0.91, 95% CI [0.83, 1.00])。两项相关研究未报告两个治疗组之间生活质量的显着差异。西妥昔单抗组的患者经历更多的痤疮皮疹(11.2%对0.3%;RR=37.36, 95% CI [10.66, 130.95]), 低镁血症 (5.3% vs 0.8%;RR=6.57, 95% CI [1.13, 38.12]), 输液反应 (3.9% 对 1.1%;RR=3.50, 95% CI [1.76, 6.94]), 腹泻 (4.8% vs 2.3%;RR=2.10, 95% CI [1.26, 3.48]), 低钾血症 (6.3% 对 3.6%;RR=1.74, 95% CI [1.02, 2.99]), 发热性中性粒细胞减少症 (10.6% 对 7.6%;RR =1.40, 95% CI [1.10, 1.77]) 和白细胞减少 (58.1% vs 42.7%;RR=1.36, 95% CI [1.17, 1.58])较对照组显著。其他不良事件的差异没有统计学意义。根据原始研究的报告,不良事件一般是可控的。没有发生与西妥昔单抗有关的死亡。
证据的质量在总生存期和一年生存率来说很高,但在大多数次要结局证据质量低。
作者结论
化疗联合西妥昔单抗作为晚期NSCLC的一线治疗,在提高总生存期方面优于单纯化疗,然而同时也导致一些可控制的不良事件发生率更高。
PICO
简语概要
西妥昔单抗:一种治疗晚期非小细胞肺癌的新方法
肺癌是全世界最常见的癌症。晚期非小细胞肺癌(NSCLC)约占所有肺癌病例的60%。由于目前晚期NSCLC(即化疗)的标准治疗的有效性已达到上限,因此不断需要新的、更有效的治疗方法,以进一步改善患者的疗效。这篇综述涵盖来源于4个临床试验的2018位参试者,发现将西妥昔单抗(一种新开发的药物)添加到标准治疗中,将晚期NSCLC患者的生存时间延长了约1.5个月,并将癌症进展推迟了约0.5个月。治疗一年后,45%接受标准治疗加上西妥昔单抗的患者和40%仅接受标准治疗的患者仍然存活。然而,西妥昔单抗对患者生活质量的影响是不确定的。七种类型的不良事件,主要涉及皮肤和血液,在接受西妥昔单抗的患者中发生更多,而其他不良事件似乎在两组中发生相同。不良事件被报告为一般可管理。没有西妥昔单抗相关的死亡报告。总之,高质量的证据表明,使用西妥昔单抗结合标准治疗,比单独采用标准治疗能提高存活率,提高晚期NSCLC患者的生存。
Authors' conclusions
Summary of findings
| Chemotherapy plus cetuximab compared with chemotherapy alone for chemotherapy‐naive advanced non‐small cell lung cancer | ||||||
| Patient or population: Patients with advanced non‐small cell lung cancer Settings: First‐line treatment Intervention: Chemotherapy plus cetuximab Comparison: Chemotherapy | ||||||
| Outcomes | Illustrative comparative risks* (95% CI) | Relative effect | No of Participants | Quality of the evidence | Comments | |
| Assumed risk | Corresponding risk | |||||
| Chemotherapy alone | Chemotherapy plus cetuximab | |||||
| Overall survival1 | 8.9 months | 10.5 months | HR 0.87 (0.79 to 0.96) | 2018 | ⊕⊕⊕⊕ | |
| Progression‐free survival1 | 4.4 months | 4.9 months | HR 0.91 (0.83 to 1.00) | 2018 | ⊕⊕⊝⊝ | |
| One‐year survival rate2 | 40 per 100 | 45 per 100 (41 to 50) | RR 1.13 (1.02 to 1.25) | 2018 | ⊕⊕⊕⊕ | |
| Objective response rate2 | 23 per 100 | 30 per 100 (26 to 35) | RR 1.31 (1.14 to 1.51) | 2018 | ⊕⊕⊕⊝ | |
| Quality of life3 | See comment | See comment | Not estimable | 1801 | ⊕⊕⊝⊝ | Both studies reported that there were no significant differences in the change of quality of life between the two treatment arms, but no detailed data were reported |
| Serious adverse events2,4 | 1. acneiform rash: 0.3 per 100 2. hypomagnesemia: 0.8 per 100 3. infusion reaction: 1.1 per 100 4. diarrhoea: 2.3 per 100 5. hypokalaemia: 3.6 per 100 6. febrile neutropenia: 7.6 per 100 7.leukopenia: 42.7 per 100 | 1. acneiform rash: 11.2 per 100 (3.2 to 39.3) 2. hypomagnesemia: 5.3 per 100 (0.9 to 30.5) 3. infusion reaction: 3.9 per 100 (1.9 to 7.6) 4. diarrhoea: 4.8 per 100 (2.9 to 8.0) 5. hypokalaemia: 6.3 per 100 (3.7 to 10.8) 6. febrile neutropenia: 10.6 per 100 (8.4 to 13.5) 7.leukopenia: 58.1 per 100 (50.0 to 67.5) | 1. acneiform rash: RR 37.36 (10.66 to 130.95) 2. hypomagnesemia: RR 6.57 (1.13 to 38.12) 3. infusion reaction: RR 3.50 (1.76 to 6.94) 4. diarrhoea: RR 2.10 (1.26 to 3.48) 5. hypokalaemia: RR 1.74 (1.02 to 2.99) 6. febrile neutropenia: RR 1.40 (1.10 to 1.77) 7.leukopenia: RR 1.36 (1.17 to 1.58) | 1. acneiform rash: 1970 2. hypomagnesemia: 775 3. infusion reaction: 1885 4. diarrhoea: 1885 5. hypokalaemia: 1110 6. febrile neutropenia: 1755 7.leukopenia: 1755 | ⊕⊕⊝⊝ | For other adverse events, there were no significant differences between the two treatment arms |
| *The basis for the assumed risk (e.g. the median control group risk across studies) is provided in footnotes. The corresponding risk (and its 95% confidence interval) is based on the assumed risk in the comparison group and the relative effect of the intervention (and its 95% CI). | ||||||
| GRADE Working Group grades of evidence | ||||||
| 1 For time‐to‐event outcomes, e.g. overall survival, the assumed risk was obtained by calculating the median value of the "median survival time of the control arm" reported by different studies. The corresponding risk was obtained in a similar way, i.e. by calculating the median value of the "median survival time of the intervention arm" reported by different studies. 2 For dichotomous outcomes, e.g. one‐year survival rate, the assumed risk was obtained by meta‐analysis of the one‐year survival rates of control arms from all relevant studies. 3 For the assessment of quality of life: In Lynch 2010, the FACT‐LCS5 questionnaire was used; in Pirker 2009, the European Organisation for Research and Treatment of Cancer quality of life questionnaire C30 (version 3.0), EORTC lung cancer specific QLQ‐LC13, and EuroQoL (EQ‐5D) questionnaires were used. 4 The overall risk of serious adverse events was not available. Thus, specific adverse events that occurred with significantly different frequencies in the two arms were summarised instead. 5 The quality of evidence is downgraded by two factors, i.e. study limitations and imprecision, according to the guidelines of the GRADE Working Group. 6 The quality of evidence is downgraded by one factor, i.e. study limitations, according to the guidelines of the GRADE Working Group. | ||||||
Background
Description of the condition
Lung cancer is one of the most common cancers in the world, in terms of both incidence and mortality. In 2008, there were over 1.6 million new cases worldwide; and there were about 1.4 million deaths due to lung cancer in the same year, accounting for 18% of all cancer deaths (IARC 2010). Approximately 85% of all lung cancers are diagnosed as non‐small cell lung cancer (NSCLC), which consists mainly of squamous cell carcinoma, adenocarcinoma, and large‐cell carcinoma (Govindan 2006). Nearly 70% of all NSCLCs have spread either locally or to distant regions of the body at the time of diagnosis, which is referred to as advanced NSCLC (stage IIIB‐IV).
The chemotherapy standard for advanced NSCLC is a platinum agent in combination with a second agent, generally paclitaxel, gemcitabine, vinorelbine, docetaxel, or pemetrexed (Stinchcombe 2009). However, the response rate is only about 20%, corresponding to an increase of three months in median survival, with no significant difference between different regimens (Marino 1994; Schiller 2002). It seems that a 'therapeutic plateau' has been reached using standard cytotoxic chemotherapy, and the prognosis of advanced NSCLC remains poor, with a five‐year survival rate of about 15% (Jemal 2010). Thus, there is a continuous need for new treatments to improve survival. Against this background, targeted therapies have attracted tremendous attention in the past few years. Some of them, such as gefitinib and erlotinib (FDA 2005; FDA 2010), two epidermal growth factor receptor (EGFR) tyrosine kinase inhibitors, and bevacizumab (FDA 2004), a humanised monoclonal antibody that inhibits vascular endothelial growth factor A, have been developed and approved for the treatment of advanced NSCLC.
Like many other anticancer medications, targeted therapies show efficacy in only a subset of recipients. Since these therapies are directed against specific signalling pathways, molecular events of the pathways have been heavily investigated to examine their capacity of predicting the efficacy of the treatment, so as to identify beforehand, those people who are most likely to benefit. As a result several important biomarkers have indeed been discovered, such as KRAS mutations as a predictor of resistance to monoclonal antibodies for metastatic colorectal cancer (Dahabreh 2011) and EGFR mutations (Eberhard 2005) for predicting response to gefitinib and erlotinib in NSCLC.
Description of the intervention
Cetuximab is an IgG1 chimeric mouse‐human monoclonal antibody targeted at the EGFR signalling cascade. Randomised controlled trials (RCTs) confirmed that it was effective in combination with chemotherapy or as a single agent for the treatment of metastatic colorectal cancer and squamous cell head and neck cancer in terms of both response and survival (Reeves 2011; Tol 2010). In 2011, cetuximab had been approved by the Food and Drug Administration (FDA) for treating the two diseases (FDA 2011; National Cancer Institute 2011).
How the intervention might work
Cetuximab can compete with epidermal growth factor in binding to EGFR protein on the cell surface, thus blocking the EGFR signalling pathway that is critical to the growth and spread of cancer cells.
Why it is important to do this review
In patients with advanced NSCLC, a number of RCTs have been conducted to assess the efficacy and toxicity of cetuximab plus chemotherapy, compared with chemotherapy alone, as the first‐line therapy. However, their results are inconsistent, and the role of cetuximab remains to be clarified. For example, the FLEX trial (Pirker 2009) showed that the addition of cetuximab significantly increased the overall survival of patients with advanced NSCLC. By contrast, the BMS099 trial (Lynch 2010) failed to demonstrate a discernible survival benefit from the same treatment. Did the conflicting results arise from clinical or methodological heterogeneity, or purely from chance? To understand the existing evidence, and to better facilitate the translation of knowledge to practice, we conducted the present Cochrane review.
Objectives
To evaluate the efficacy and toxicity of chemotherapy plus cetuximab, compared with chemotherapy alone, for advanced non‐small cell lung cancer (NSCLC) previously untreated with chemotherapy or epidermal growth factor receptor (EGFR)‐targeted drugs.
Methods
Criteria for considering studies for this review
Types of studies
We only included RCTs. We did not impose any restrictions on publication type (abstract or full article) or language.
Types of participants
Patients with histologically‐ or cytologically‐confirmed advanced NSCLC (previously untreated with chemotherapy or EGFR‐targeted drugs).
Types of interventions
Cetuximab plus chemotherapy (such as gemcitabine, cisplatin, carboplatin, vinorelbine, or taxane) compared with the same chemotherapy alone. The dose and duration of cetuximab and chemotherapy did not necessarily have to be the same in different studies. However, in an eligible study, the interventions should not be evaluated as maintenance therapy.
Types of outcome measures
Primary outcomes
The primary outcome measure was overall survival, defined as the time from randomisation to death from any cause.
Secondary outcomes
The secondary outcome measures included progression‐free survival (time to disease progression or death), one‐year survival rate, objective response rate (the proportion of patients whose target lesions decrease to a prespecified level or disappear, as assessed according to the WHO (Miller 1981), RECIST (Response Evaluation Criteria In Solid Tumours) (Therasse 2000), or individual study criteria), quality of life, and serious adverse events (grade 3 and 4, according to WHO toxicity guidelines or the National Cancer Institute's Common Toxicity Criteria).
If a study fulfilled all the inclusion criteria, except that no data on relevant outcomes were reported, we would firstly try to find the protocol of the study (e.g. by visiting clinicaltrials.gov or www.who.int/ictrp) to check if it intended to measure the outcomes. Only when the protocol clearly showed that the study did not intend to measure the outcomes of our interest, did we exclude the study; otherwise, we classified the study under "studies awaiting classification" or "ongoing studies" as appropriate, rather than excluding it.
Search methods for identification of studies
Electronic searches
We conducted a systematic literature search in the following electronic databases, with no restrictions on the language of publication.
-
The Cochrane Lung Cancer Review Group Specialized Register (from inception to 17 December 2013) (Appendix 1).
-
The Cochrane Central Register of Controlled Trials (CENTRAL, from inception to 17 December 2013) (Appendix 2).
-
MEDLINE (access through PubMed (1966 to 17 December 2013)) (Appendix 3).
-
EMBASE (1980 to 17 December 2013) (Appendix 4).
-
Clinical trial registries (from inception to 17 December 2013) (Appendix 5).
Searching other resources
We handsearched the proceedings related to lung cancer from the American Society of Clinical Oncology and European Society of Medical Oncology (2000 to 17 December 2013).
We checked the reference lists of all eligible primary studies and review articles for additional potentially eligible studies.
Data collection and analysis
Selection of studies
We used EndNote software to manage the bibliographic references identified by the above searches. Two review authors (ZYY, LL) independently screened the titles and abstracts to judge study relevance. We obtained the full texts of all studies seemingly eligible for this review for closer examination. For trials published as abstracts only, we contacted the study investigators if the information needed to determine eligibility was lacking. After that, if it was still unclear whether the trials fulfilled the inclusion criteria or not, which could be due to the authors' failure to reply, among other reasons, we had to exclude them (simply because the inclusion of them would be groundless). Any disagreements were resolved by discussion of the two review authors. Unresolved disagreements were subject to the judgement of a third review author (JLT), whose opinion was considered as final.
Data extraction and management
Data extraction was performed independently by two review authors (ZYY, LL) using a standard, pilot‐tested form. We collected the following data from each study: publication details, participant characteristics, regimens for intervention and control arms, outcome measures and effect size, information related to the methodological quality of the study, and if available, data useful for assessing the predictive value of KRAS and EGFR mutations.
Assessment of risk of bias in included studies
We assessed the risk of bias of each eligible study using the criteria outlined in Table 8.5.c of the Cochrane Handbook for Systematic Reviews of Interventions (Higgins 2011). Any disagreements were resolved by discussion or by involving a third review author.
We assessed risk of bias according to the:
-
random sequence generation (selection bias);
-
allocation concealment (selection bias);
-
blinding of participants and personnel (performance bias);
-
blinding of outcome assessment (detection bias);
-
incomplete outcome data (attrition bias);
-
selective outcome reporting (reporting bias); and
-
other bias.
Within each study, we assessed 'random sequence generation', 'allocation concealment', 'selective outcome reporting', and 'other bias' globally for all outcomes while we assessed 'blinding of participants and personnel' and 'blinding of outcome assessment' separately for 'objective' (i.e. overall survival and one‐year survival rate) and 'subjective' (all of the remaining) outcomes (Higgins 2011). We assessed 'incomplete outcome data' separately for different outcomes, but in this review the assessment results with regard to this item were the same for all outcomes across all studies. Thus, within each study, there is only one global assessment result for this item, similar to the situation of 'random sequence generation', 'allocation concealment', 'selective outcome reporting', and 'other bias'. We graded each potential source of bias as high, low, or unclear (for details, see Table 8.5.c of the Cochrane Handbook for Systematic Reviews of Interventions (Higgins 2011)).
Measures of treatment effect
We measured the treatment effect on dichotomous outcomes, such as objective response and adverse events by risk ratio (RR) with 95% confidence interval (CI). We measured the treatment effect on time‐to‐event outcomes, such as overall survival and progression‐free survival, by hazard ratio (HR) with 95% CI.
Unit of analysis issues
Our pilot search found that existing studies eligible for this review were usually individually randomised, non‐cross‐over trials, without multiple intervention groups. Therefore, the unit of analysis issues related to cluster‐randomised trials, cross‐over trials, and multiple intervention groups seemed unlikely to arise. Still, we tried to avoid any potential unit of analysis error by extracting and analysing the data carefully according to the methods recommended in the Cochrane Handbook for Systematic Reviews of Interventions (Higgins 2011).
Dealing with missing data
We contacted investigators or study sponsors as needed, in order to verify key study characteristics and obtain missing numerical outcome data. If no additional data necessary for meta‐analysis could be obtained in this way, we tried to impute values from reported data (e.g. estimating the HR from published survival curves) and conducted an intention‐to‐treat analysis where possible and appropriate.
Assessment of heterogeneity
We used the I2 statistic to measure heterogeneity among the trials in each meta‐analysis. We investigated substantial heterogeneity (I2 ≥ 50%) by prespecified subgroup analyses.
Assessment of reporting biases
If we suspected reporting bias (see Assessment of risk of bias in included studies), we attempted to contact study authors, asking them to provide missing outcome data. Where this was not possible, and the missing data were thought to be able to introduce serious bias, we evaluated the impact of including such studies in the overall analysis by conducting a sensitivity analysis. As appropriate, we visually inspected funnel plots to see if there was a possibility of publication bias.
Data synthesis
We performed meta‐analysis with Review Manager 5 (RevMan 2014) for each outcome using the random‐effects model. We employed the Mantel‐Haenszel method to combine RRs and the inverse‐variance method to combine HRs. For eligible studies that lacked numerical outcome data suitable for meta‐analysis, even after contacting authors, we had to present them descriptively (RevMan 2014).
We created a 'Summary of findings' table using the methods and recommendations described in Section 8.5 and Chapter 12 of the Cochrane Handbook for Systematic Reviews of Interventions (Higgins 2011) and using GRADEpro software (GRADEpro 2014). We included the following outcomes: overall survival, progression‐free survival, one‐year survival rate, objective response, and adverse events. The assumed risks, with control and experimental interventions, respectively, for each outcome were estimated based on the assessments by different studies. For example, for a given dichotomous or continuous outcome, we meta‐analysed the rates or means reported by different studies to obtain a weighted mean for the control and intervention groups, respectively. For a time‐to‐event outcome such as overall survival, we calculated the median value of the lengths reported by different studies to represent the assumed risk. For adverse events, if available, we used a summary end point (e.g. total risk for all serious adverse events) in the table. If no summary end point was available, we instead summarised specific adverse events that occurred with significantly different frequencies in the two arms.
Subgroup analysis and investigation of heterogeneity
If the data allowed us to do so, we performed subgroup analyses according to the following characteristics of patients: (1) histology of cancer (adenocarcinoma versus other histological types), (2) KRAS mutation status (mutant versus wild‐type), (3) EGFR mutation status (mutant versus wild‐type), and (4) Eastern Cooperative Oncology Group (ECOG) performance status (0 to 1 versus 2 or more).
Sensitivity analysis
Where appropriate, we conducted the following sensitivity analyses to check the robustness of the results of each meta‐analysis.
-
We excluded the studies with high or unclear risk of bias.
-
If there was no significant between‐study heterogeneity in a given meta‐analysis, then we estimated the pooled HR or RR with the fixed‐effects model and compared that with the random‐effects model to see if they differed significantly.
We considered both subgroup and sensitivity analyses only for the primary outcome, i.e. overall survival. For secondary outcomes, especially for various types of adverse events, subgroup and sensitivity analyses would probably produce false positive results due to multiple testing, and thus we did not consider conducting such analyses.
Results
Description of studies
Results of the search
In total, we identified 3547 references, 3445 of which were from three electronic databases, 80 from two clinical trial registries, and 22 from the conference abstracts of the American Society of Clinical Oncology and the European Society of Medical Oncology. The flow chart of study selection is shown in Figure 1. Of the 3547 references we identified, we excluded 549 duplicates, and further excluded 2970 after reviewing their titles and abstracts. Among the 28 studies we retrieved for further evaluation, we excluded 24, leaving four eligible studies for final analysis (Butts 2007; Lynch 2010; Pirker 2009; Rosell 2008).
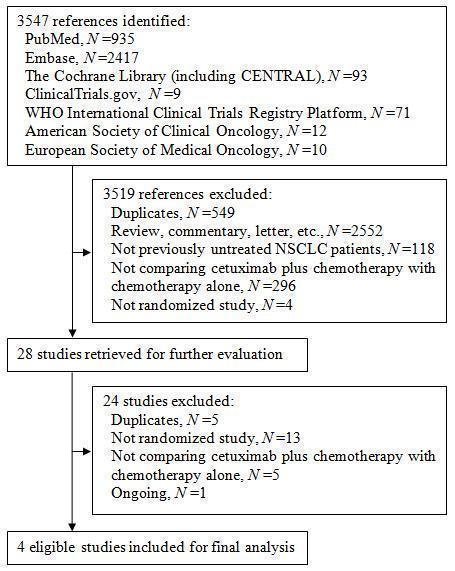
Figure 1. The flow chart of study selection
Included studies
The characteristics of the four eligible studies are shown in Characteristics of included studies. All four studies were parallel group RCTs. The studies were mainly conducted in the United States and Europe, and included 2018 subjects in total (1003 received chemotherapy plus cetuximab and 1015 received chemotherapy alone). The sample size of the studies ranged from 86 to 1125. The proportion of females ranged from 26% to 56%. The comparability of intervention and control arms within these studies were generally good, except that the proportion of female patients was seemingly higher (61.5% versus 50%) in the cetuximab arm in one study (Butts 2007). The median age of subjects ranged from 58 years to 66 years. The subjects were mostly white people (83% to 100% in different studies). The patients with ECOG performance status 0 to 1, which is considered as "fit" (Gridelli 2004), accounted for 83% to 99% of all patients. Most patients had stage IV lung cancer, and about half of them had histologically proven adenocarcinoma. Two studies (Pirker 2009; Rosell 2008) included patients with EGFR expression only, while the others did not select patients on the basis of EGFR expression status. Those who had never smoked accounted for 8% to 22% of patients. None of the studies provided information on the EGFR and KRAS mutation status of patients. The chemotherapies used in the four studies included gemcitabine plus cisplatin or plus carboplatin (Butts 2007), carboplatin plus paclitaxel or plus docetaxel (Lynch 2010), and cisplatin plus vinorelbine (Pirker 2009; Rosell 2008). Cetuximab was given at an initial dose of 400 mg/m2 and then 250 mg/m2 per week intravenously until disease progression or unacceptable toxicity occurred in all four studies.
Excluded studies
The excluded studies and reasons for exclusion are shown in Characteristics of excluded studies. Briefly, we excluded 13 studies for not being randomised studies, five for not comparing cetuximab plus chemotherapy with chemotherapy alone, and five for duplicating other studies. In addition, we did not include one potentially eligible study (NCT00946712) in the present review as it is an ongoing trial and will not be completed until December 2017.
Risk of bias in included studies
Detailed information on the risk of bias are shown in Characteristics of included studies. We presented separately the results of risk of bias assessment for objective outcomes (i.e. overall survival and one‐year survival rate) and subjective ones (all other outcomes). For the data on objective outcomes, we graded all studies at "low risk" or "unclear risk" (Figure 2). We judged the overall risk of bias as "low" (Figure 3). For the data on subjective outcomes, we graded all studies at "high risk", mainly due to lack of blinding. We judged the overall risk of bias as "high". Details about the assessment are described below.
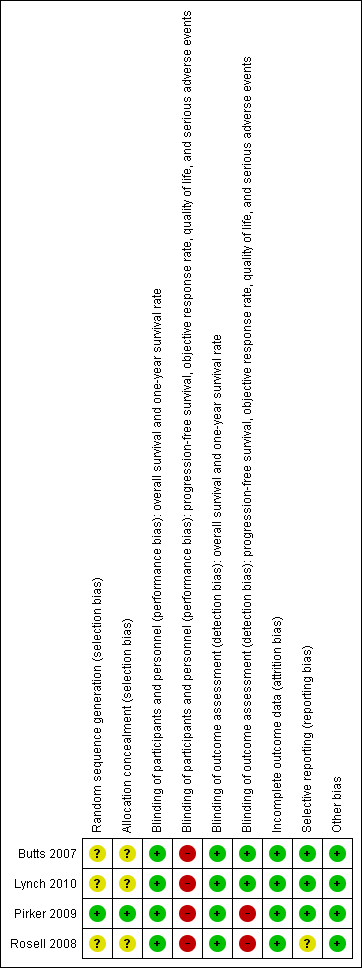
Risk of bias summary: review authors' judgements about each risk of bias item for each included study.

Risk of bias graph: review authors' judgements about each risk of bias item presented as percentages across all included studies.
Allocation
Although all four eligible trials reported that the participants were "randomised" into different treatment arms, only one of them provided details about the randomisation and concealment procedure. Specifically, in the study of Pirker 2009, patients were randomised centrally using a computer interactive voice response system, and "physicians and study monitors did not have access to the code". We considered Pirker 2009 to have a low risk of selection bias, while the other three studies (Butts 2007; Lynch 2010; Rosell 2008) had an unclear risk of selection bias due to lack of relevant information.
Blinding
All included trials were "open‐label", without masking either participants or personnel (those who gave treatment). However, the results on overall survival and one‐year survival rate were mainly determined by the biological, objective effect of treatments and were unlikely to be affected by the participants' and personnel knowledge of the assignment status. Thus, we considered the risk of performance bias as low for the data on the two outcomes. Nevertheless, progression‐free survival, objective response rate, quality of life, and serious adverse events are not objective outcomes and could be affected if the participants, or personnel, or both were aware of the assignment status. Thus, we considered the results on the four outcomes at high risk of performance bias.
The outcomes were assessed by blinded or independent reviewers in the studies of Butts 2007 and Lynch 2010. Thus, we considered the risk of detection bias in the two studies as low. However, in the studies of Pirker 2009 and Rosell 2008, there were no blinding of outcome assessors. Although the results on overall survival and one‐year survival rate were unlikely to be affected by this (as "death" is an objective, "hard" outcome), the assessments of other outcomes such as progression‐free survival, objective response rate, adverse events, and quality of life involved subjective judgements and were vulnerable to the performance of assessors who were aware of the assignment status. Thus, in the studies of Pirker 2009 and Rosell 2008, we considered the data on the four outcomes at high risk of detection bias.
Incomplete outcome data
All four eligible trials conducted efficacy analyses on an intention‐to‐treat basis and restricted safety analyses to treated patients only. The patients available for safety analyses accounted for 95.4% (Lynch 2010) to 99.2% (Butts 2007) of the randomised patients. Thus, we believe the comparability between the treatment arms is unlikely to have been affected, and the risk of attrition bias is low.
Selective reporting
Data on overall survival, progression‐free survival, one‐year survival rate, objective response rate, and serious adverse events were available from all four eligible studies. Thus, for the data on these outcomes, selective reporting bias is unlikely to exist.
Lynch 2010 and Pirker 2009 reported data on quality of life, while Butts 2007 and Rosell 2008) did not. Examination of the protocol of Butts 2007 showed that it had no plan to study quality of life (Butts 2005). Thus, we considered the risk of selective reporting bias as low in the study.
For the study of Rosell 2008, we could not find a protocol or registration, and it is difficult to say whether quality of life is one of the prespecified outcomes of the study. Thus, we considered it had an unclear risk for selective reporting bias.
Other potential sources of bias
We found no evidence of other bias. Although the unbalance in poststudy treatments could be a source of potential bias, we argue that it would not undermine our overall conclusion. Specifically, three studies (Butts 2007; Lynch 2010; Pirker 2009) reported the percentage of patients receiving poststudy cetuximab in the chemotherapy alone group and the percentage of patients receiving poststudy chemotherapy in the chemotherapy plus cetuximab group. In the three studies, the percentage using poststudy cetuximab was higher than that using poststudy chemotherapy alone, which could have "diluted" the effect of cetuximab on overall survival. Thus, the observed efficacy of cetuximab is actually a "conservative" estimate. This would not undermine, but strengthen, our conclusion.
Effects of interventions
See: Summary of findings for the main comparison
The data on overall survival, progression‐free survival, one‐year survival rate, objective response rate, and serious adverse events were available from all four eligible studies. Quality of life was investigated in two studies (1901 patients) (Lynch 2010; Pirker 2009).
Overall survival
The median overall survival with chemotherapy plus cetuximab ranged from 8.3 months (Rosell 2008) to 12.0 months (Butts 2007) (median: 10.5 months), while the median overall survival with chemotherapy alone ranged from 7.3 months (Rosell 2008) to 10.1 months (Pirker 2009) (median: 8.9 months). The median overall survival with chemotherapy plus cetuximab was longer than that with chemotherapy alone in all four studies. The HR for death (chemotherapy plus cetuximab versus chemotherapy alone) ranged from 0.71 (95% CI 0.48 to 1.05) (Rosell 2008) to 0.89 (95% CI 0.75 to 1.05) (Lynch 2010) in different studies. The pooled HR was 0.87 (95% CI 0.79 to 0.96; P = 0.004), indicating that the efficacy of chemotherapy plus cetuximab was better than that of chemotherapy alone in terms of overall survival (Analysis 1.1; Figure 4). We did not observe any statistical heterogeneity among the studies (P = 0.78, I2 = 0%).
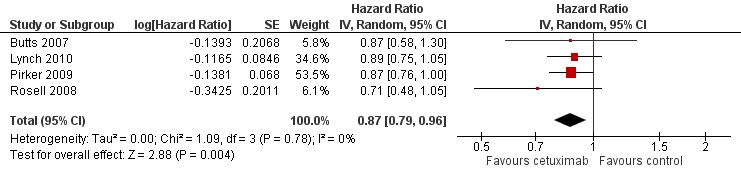
Forest plot of comparison: 1 chemotherapy plus cetuximab versus chemotherapy alone, outcome: 1.1 Overall survival.
Progression‐free survival
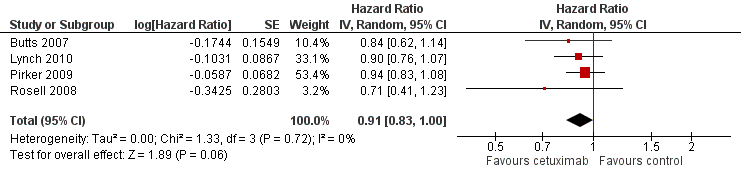
The median progression‐free survival with chemotherapy plus cetuximab ranged from 4.4 months (Lynch 2010) to 5.1 months (Butts 2007) (median: 4.9 months), while the median progression‐free survival with chemotherapy alone ranged from 4.2 months (Butts 2007) to 4.8 months (Pirker 2009) (median: 4.4 months). The median progression‐free survival with chemotherapy plus cetuximab was equal to or longer than that with chemotherapy alone in individual studies. The HR for progression (chemotherapy plus cetuximab versus chemotherapy alone) ranged from 0.71 (95% CI 0.41 to 1.23) (Rosell 2008) to 0.94 (95% CI 0.83 to 1.08) (Pirker 2009). The pooled HR was 0.91 (95% CI 0.83 to 1.00; P = 0.06), indicating that the superiority of chemotherapy plus cetuximab over chemotherapy alone in prolonging progression‐free survival did not reach statistical significance (Analysis 1.2; Figure 5). We did not observe any statistical heterogeneity among the studies (P = 0.72, I2 = 0%).

Forest plot of comparison: 1 chemotherapy plus cetuximab versus chemotherapy alone, outcome: 1.2 Progression‐free survival.
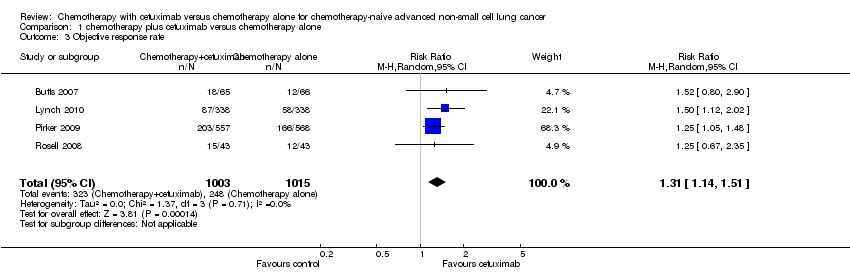
Objective response rate
The objective response rate with chemotherapy plus cetuximab ranged from 26% (Lynch 2010) to 36% (Pirker 2009) (weighted rate: 30%), while the objective response rate with chemotherapy alone ranged from 17% (Lynch 2010) to 29% (Pirker 2009) (weighted rate: 23%). The objective response rate with chemotherapy plus cetuximab was higher than that with chemotherapy alone in all studies. The RR for response (chemotherapy plus cetuximab versus chemotherapy alone) ranged from 1.25 (95% CI 0.67 to 2.35) (Rosell 2008) to 1.52 (95% CI 0.80 to 2.90) (Butts 2007). The pooled RR was 1.31 (95% CI 1.14 to 1.51; P = 0.0001), indicating that the efficacy of chemotherapy plus cetuximab was better than that of chemotherapy alone in terms of objective response rate (Analysis 1.3; Figure 6). We did not observe any statistical heterogeneity among the studies (P = 0.71, I2 = 0%).

Forest plot of comparison: 1 chemotherapy plus cetuximab versus chemotherapy alone, outcome: 1.3 Objective response rate.
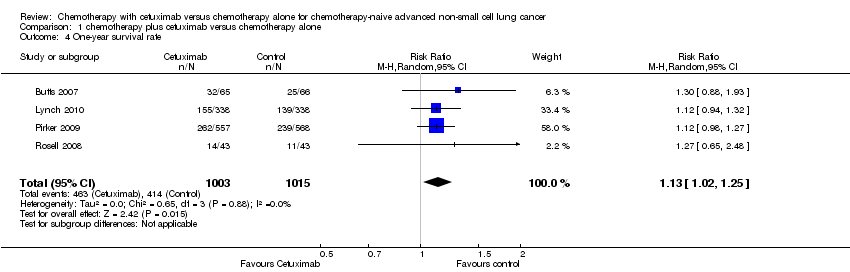
One‐year survival rate
The one‐year survival rate with chemotherapy plus cetuximab ranged from 33% (Rosell 2008) to 50% (Butts 2007) (weighted rate: 45%), while the one‐year survival rate with chemotherapy alone ranged from 26% (Rosell 2008) to 42% (Pirker 2009) (weighted rate: 40%). The one‐year survival rates with chemotherapy plus cetuximab were higher than those with chemotherapy alone in all studies. The RR for survival at one year (chemotherapy plus cetuximab versus chemotherapy alone) ranged from 1.12 (95% CI 0.94 to 1.32) (Lynch 2010) to 1.30 (95% CI 0.88 to 1.93) (Butts 2007). The pooled RR was 1.13 (95% CI 1.02 to 1.25; P = 0.02), indicating that the efficacy of chemotherapy plus cetuximab was better than that of chemotherapy alone in terms of one‐year survival rate (Analysis 1.4). We did not observe any statistical heterogeneity among the studies (P = 0.88, I2 = 0%).
Quality of life
Quality of life was assessed in two studies with different questionnaires. In Lynch 2010, the FACT‐LCS5 questionnaire was used. In Pirker 2009, the European Organisation for Research and Treatment of Cancer quality of life questionnaire C30 (version 3.0), EORTC lung cancer specific QLQ‐LC13, and EuroQoL (EQ‐5D) questionnaires were used. Although no detailed data were reported by the two studies, both of them found no significant differences in the change of quality of life between the two treatment arms.
Serious adverse events
Serious adverse events were reported in all four trials. In total, there were five types of haematological adverse events and 30 types of non‐haemotological adverse events. There were no cetuximab‐related deaths. Patients receiving chemotherapy plus cetuximab experienced more acneiform rash (weighted rate: 11.2% versus 0.3%; RR 37.36, 95% CI 10.66 to 130.95) (Analysis 1.6), diarrhoea (weighted rate: 4.8% versus 2.3%; RR 2.10, 95% CI 1.26 to 3.48) (Analysis 1.15), hypokalaemia (weighted rate: 6.3% versus 3.6%; RR 1.74, 95% CI 1.02 to 2.99) (Analysis 1.20), hypomagnesemia (weighted rate: 5.3% versus 0.8%; RR 6.57, 95% CI 1.13 to 38.12) (Analysis 1.21), infusion reaction (weighted rate: 3.9% versus 1.1%; RR 3.50, 95% CI 1.76 to 6.94) (Analysis 1.24), febrile neutropenia (weighted rate: 10.6% versus 7.6%; RR 1.40, 95% CI 1.10 to 1.77) (Analysis 1.36), and leukopenia (weighted rate: 58.1% versus 42.7%; RR 1.36, 95% CI 1.17 to 1.58) (Analysis 1.37) than did those who received chemotherapy alone. Despite some trends, the difference in the incidence of other serious adverse events between the two treatment arms did not reach statistical significance.
Subgroup and sensitivity analyses
As prespecified, we considered subgroup and sensitivity analyses for the primary outcome (overall survival) only.
Subgroup analysis
We planned to performed subgroup analyses according to histology of cancer (adenocarcinoma versus other histological types), KRAS mutation status (mutant versus wild‐type), EGFR mutation status (mutant versus wild‐type), and ECOG performance status (0 to 1 versus 2 or more). To this end, the included studies should preferably be differentiable according to these factors so that they could be divided into different categories or subgroups. For example, some studies were conducted solely with patients with adenocarcinoma and others solely with those with other histological types; or, some studies had a significantly larger proportion of patients with adenocarcinoma than did others.
However, the fact is that none of the included studies were conducted solely in patients with adenocarcinoma or in those with ECOG performance status 0 to 1. What is more, both the proportion of patients with adenocarcinoma and the proportion of patients with ECOG performance status 0 to 1 did not differ much across the included studies. In other words, the four studies were not differentiable according to the two factors. Thus, it was infeasible to divide them into different subgroups according to the two factors. In addition, none of the included studies provided information on EGFR and KRAS mutation status. Thus, we did not actually conduct any preplanned subgroup analysis.
Sensitivity analysis
As no statistical heterogeneity was observed among the studies (Figure 4), the results from the fixed‐effect model were the same as those from the random‐effects model.
After excluding the studies at high or unclear risk of bias (Butts 2007; Lynch 2010; Rosell 2008), the combined HR in Figure 4 remained unchanged, which was 0.87 (95% CI 0.76 to 1.00) (before excluding the study: 0.87, 95% CI 0.79 to 0.96).
Other analyses
Due to the limited number of eligible studies, we did not construct funnel plots to explore the possibility of publication bias (Higgins 2011).
Discussion
Summary of main results
The main findings of this systematic review are summarised in the summary of findings Table for the main comparison. Briefly, the overall survival, one‐year survival rate, and objective response rate with chemotherapy plus cetuximab were better than those with chemotherapy alone. The addition of cetuximab to chemotherapy reduced the hazard for death by 13% (HR 0.87, 95% CI 0.79 to 0.96), while improving the relative one‐year survival rate and relative objective response rate by 13% and 31%, respectively. These equate to absolute improvements in one‐year survival and objective response rate of 5% and 7%, respectively. There was also a consistent trend towards longer progression‐free survival with the combination treatment, although the results were not statistically significant. No evidence suggested that cetuximab combined with chemotherapy was associated with better quality of life. As expected, some specific adverse events occurred more frequently in the cetuximab group. The adverse events, according to the original reports, were generally manageable.
Overall completeness and applicability of evidence
The data on important patient characteristics, interventions, and almost all outcomes of interest were available in detail from all eligible studies. In addition, all patients were included for efficacy analysis, and 95.4% to 99.2% of randomised patients were available for safety analysis in eligible studies. Thus, the overall completeness of the evidence summarised by this review is good.
According to the inclusion criteria of the four eligible studies, the results of the present review are applicable to chemotherapy‐naive advanced NSCLC patients with ECOG performance status 0 to 1. The subgroup analyses of Pirker 2009 and Lynch 2010 showed that the benefit from cetuximab did not differ significantly across subgroups defined by age, sex, ECOG performance status, and tumour histology. However, it should be noted that about 90% of the patients included in the eligible studies were white people. Pirker 2009 found that cetuximab was better than control in white people, but seemed to do harm in patients of other origins, including Asian people, which warrants further investigation.
In two studies, only the patients with EGFR expression were included (Pirker 2009; Rosell 2008), which did not lead to significant heterogeneity in any of our meta‐analyses. This seems to suggest that cetuximab does not have differential effects in patients with different EGFR expression status. However, a more recent and detailed analysis of the data from Pirker 2012 showed that the survival benefit from cetuximab was greater in the patients with high EGFR expression (median survival 12.0 months versus 9.6 months; HR 0.73, 95% CI 0.58 to 0.93), with no meaningful increase in adverse events, whereas there was no corresponding survival benefit in the patients with low EGFR expression (median survival 9.8 months versus 10.3 months; HR 0.99, 95% CI 0.84 to 1.16). This indicates that the use of cetuximab may be limited to patients with high EGFR expression only. In view of the inconsistency of existing evidence, more studies on the role of EGFR expression are needed before this biomarker can be applied to clinical settings.
Quality of the evidence
The studies included in the present review are all RCTs with data analysed according to the intention‐to‐treat principle and outcomes reported in detail and properly. According to the Grading of Recommendations Assessment, Development and Evaluation (GRADE) Working Group (Guyatt 2008), there are five factors that can downgrade the quality of evidence from RCTs, i.e. study limitations, inconsistency of results, indirectness of evidence, imprecision, and publication bias.
Study limitations
In this review, study limitations are mainly reflected by risk of bias, which is low for the data on overall survival and one‐year survival rate, but high for the data on progression‐free survival, objective response rate, quality of life, and serious adverse events, mainly due to the lack of blinding. This issue could have led to potential bias in the results in multiple ways such as by affecting the performance of patients and clinicians (Figure 2; Figure 3). For example, in FLEX (Pirker 2009) and BMS099 (Lynch 2010), the two studies with dominant weights in the meta‐analysis, patients and clinicians were not blinded and 'for unknown reasons', the proportion of censored progression‐free survival data possibly due to patients switching to other treatments before radiologically‐confirmed disease progression (the major endpoint of progression‐free survival) was much higher in the chemotherapy‐alone group than in the chemotherapy‐plus‐cetuximab group. Thus, the observed difference in progression‐free survival between the two groups was putatively smaller than actual, which could at least partly explain why the observed benefit from cetuximab was significant for overall survival but not for progression‐free survival.
Inconsistency of results
For the majority of the meta‐analyses in this review, there was no heterogeneity (I2 = 0%) among studies.
Indirectness of evidence
This review contains no indirect comparison of different treatment regimens, and the population, intervention, comparator, and outcomes of the included studies are similar to those who would be actually treated with chemotherapy plus cetuximab in clinical settings.
Imprecision
For overall survival, one‐year survival rate, and objective response rate, statistically significant results were achieved in this review and the 95% CIs of HRs or RRs were fairly narrow. Thus, the problem of imprecision is unlikely to affect the quality of evidence of these outcomes. However, the HR for progression‐free survival is at the borderline of statistical significance and RRs for most serious adverse events are not statistically significant, which might have resulted from, among other reasons, imprecision due to the relatively small sample size. Addtionally, for some serious adverse events (e.g. acneiform rash and hypomagnesemia), the 95% CIs of RRs are rather wide. For quality of life, the two relevant studies provided narrative description only and no detailed numerical data, precluding a "precise" understanding of the treatment effect on this outcome. Thus, it is justifiable to downgrade the quality of evidence on progression‐free survival, quality of life, and serious adverse events, taking the problem of imprecision into account.
Publication bias
In this review we did not construct funnel plots due to the limited number of studies included. There is no clear evidence for publication bias.
In summary, inconsistency of results, indirectness of evidence, and publication bias are unlikely to have affected the quality of evidence in this review. The quality of evidence is high for overall survival and one‐year survival rate, moderate for objective response rate (downgraded by study limitations), and low for progression‐free survival, quality of life, and serious adverse events (downgraded by study limitations and imprecision).
Potential biases in the review process
As the data sources we searched were all in English, it was not impossible that we missed some non‐English studies. This could lead to language bias if the results of the missing studies contradicted those of the included ones. In addition, due to the limited number of eligible studies, we were unable to construct the preplanned funnel plots, and thus we cannot exclude the possibility that publication bias exists in the present review (Higgins 2011).
Agreements and disagreements with other studies or reviews
Our findings are consistent with a previous phase Ⅱ trial that showed promising efficacy of cetuximab as first‐line treatment of advanced NSCLC (Herbst 2010). RTOG 0324, which was also a phase Ⅱ study, found that cetuximab, when combined with chemoradiation, seemed to be able to significantly improve the overall survival of unresectable stage ⅢA/B NSCLC (Blumenschein 2011). However, as concluded by a previous review, Nieder 2012, the efficacy of cetuximab combined with radiotherapy for stage Ⅲ NSCLC has been uncertain, mainly due to the problem of study design, e.g. lack of randomisation.
Our findings about the effectiveness of chemotherapy combined with cetuximab are generally consistent with Lin 2010, that systematic review based on the same four trials as included in our review. However, we found that adding cetuximab also improved one‐year survival rate, whereas Lin 2010, found no such improvement. Further examination showed that Lin 2010 included only three studies (Butts 2007; Pirker 2009; Rosell 2008) for the analyses on one‐year survival rate, while our review included all four trials. Regarding serious adverse events, Lin 2010 found that only two types of serious adverse events, i.e. rash and infusion reaction, occurred more in the cetuximab arm (Lin 2010), whereas our review showed that adding cetuximab caused significantly higher rates of seven types of serious adverse events. Close examination of the original papers suggested that the data extracted by us was more complete and accurate than that by Lin 2010.

Figure 1. The flow chart of study selection

Risk of bias summary: review authors' judgements about each risk of bias item for each included study.

Risk of bias graph: review authors' judgements about each risk of bias item presented as percentages across all included studies.

Forest plot of comparison: 1 chemotherapy plus cetuximab versus chemotherapy alone, outcome: 1.1 Overall survival.
Forest plot of comparison: 1 chemotherapy plus cetuximab versus chemotherapy alone, outcome: 1.2 Progression‐free survival.

Forest plot of comparison: 1 chemotherapy plus cetuximab versus chemotherapy alone, outcome: 1.3 Objective response rate.

Comparison 1 chemotherapy plus cetuximab versus chemotherapy alone, Outcome 1 Overall survival.

Comparison 1 chemotherapy plus cetuximab versus chemotherapy alone, Outcome 2 Progression‐free survival.
Comparison 1 chemotherapy plus cetuximab versus chemotherapy alone, Outcome 3 Objective response rate.
Comparison 1 chemotherapy plus cetuximab versus chemotherapy alone, Outcome 4 One‐year survival rate.
Comparison 1 chemotherapy plus cetuximab versus chemotherapy alone, Outcome 5 Abdominal pain.

Comparison 1 chemotherapy plus cetuximab versus chemotherapy alone, Outcome 6 Acneiform rash.
Comparison 1 chemotherapy plus cetuximab versus chemotherapy alone, Outcome 7 Anorexia.
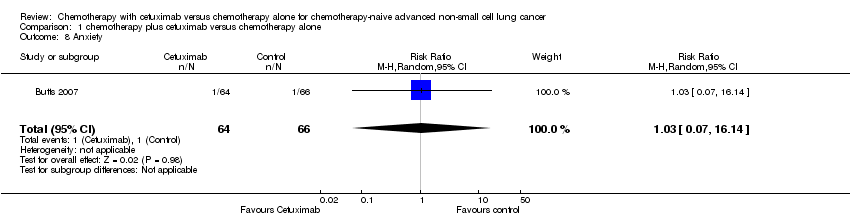
Comparison 1 chemotherapy plus cetuximab versus chemotherapy alone, Outcome 8 Anxiety.

Comparison 1 chemotherapy plus cetuximab versus chemotherapy alone, Outcome 9 Asthenia.

Comparison 1 chemotherapy plus cetuximab versus chemotherapy alone, Outcome 10 Back pain.
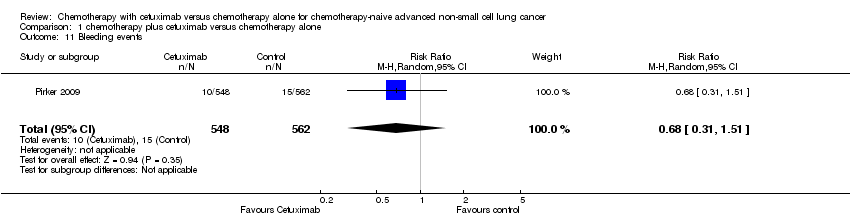
Comparison 1 chemotherapy plus cetuximab versus chemotherapy alone, Outcome 11 Bleeding events.

Comparison 1 chemotherapy plus cetuximab versus chemotherapy alone, Outcome 12 Cardiac events.
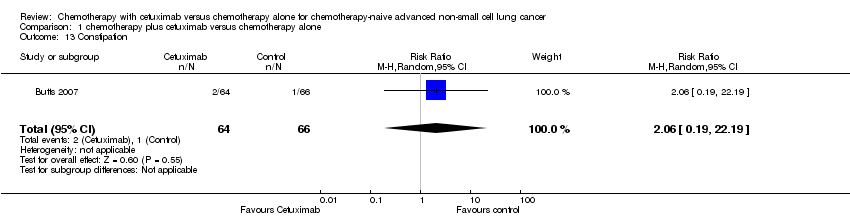
Comparison 1 chemotherapy plus cetuximab versus chemotherapy alone, Outcome 13 Constipation.
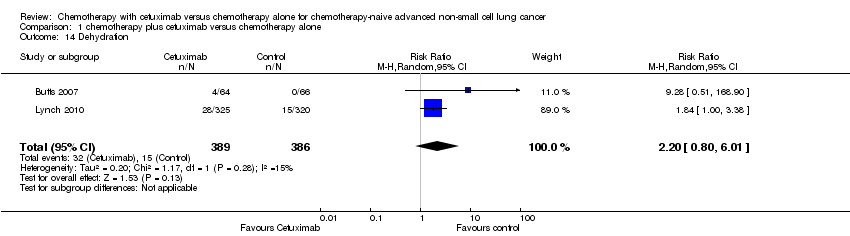
Comparison 1 chemotherapy plus cetuximab versus chemotherapy alone, Outcome 14 Dehydration.
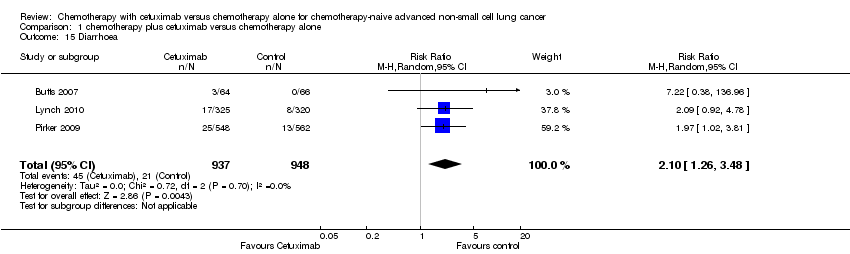
Comparison 1 chemotherapy plus cetuximab versus chemotherapy alone, Outcome 15 Diarrhoea.

Comparison 1 chemotherapy plus cetuximab versus chemotherapy alone, Outcome 16 Dysphasia.
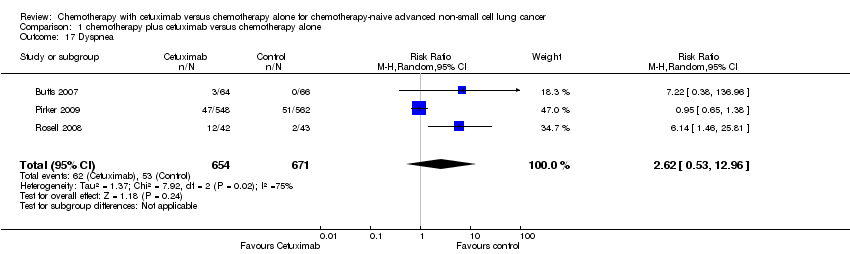
Comparison 1 chemotherapy plus cetuximab versus chemotherapy alone, Outcome 17 Dyspnea.

Comparison 1 chemotherapy plus cetuximab versus chemotherapy alone, Outcome 18 Epistaxis.

Comparison 1 chemotherapy plus cetuximab versus chemotherapy alone, Outcome 19 Fatigue.
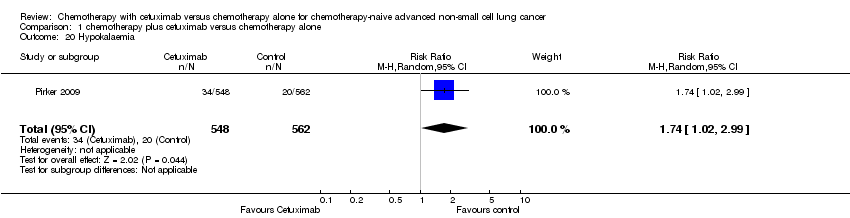
Comparison 1 chemotherapy plus cetuximab versus chemotherapy alone, Outcome 20 Hypokalaemia.
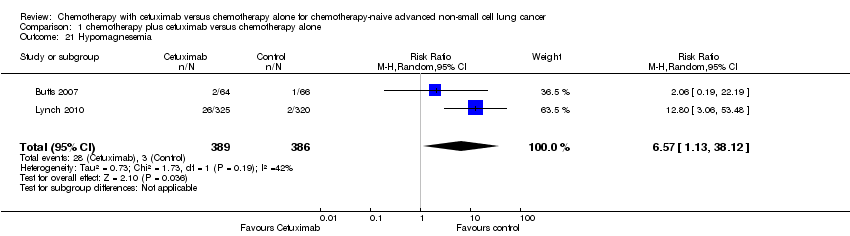
Comparison 1 chemotherapy plus cetuximab versus chemotherapy alone, Outcome 21 Hypomagnesemia.

Comparison 1 chemotherapy plus cetuximab versus chemotherapy alone, Outcome 22 Hypotension.

Comparison 1 chemotherapy plus cetuximab versus chemotherapy alone, Outcome 23 Infection.
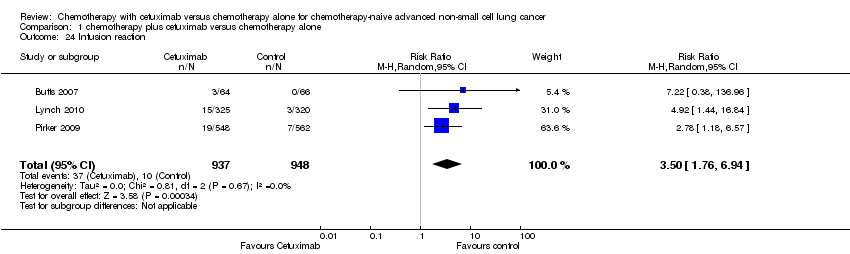
Comparison 1 chemotherapy plus cetuximab versus chemotherapy alone, Outcome 24 Infusion reaction.

Comparison 1 chemotherapy plus cetuximab versus chemotherapy alone, Outcome 25 Mucosal inflammation.

Comparison 1 chemotherapy plus cetuximab versus chemotherapy alone, Outcome 26 Nausea.

Comparison 1 chemotherapy plus cetuximab versus chemotherapy alone, Outcome 27 Pneumonia.

Comparison 1 chemotherapy plus cetuximab versus chemotherapy alone, Outcome 28 Pulmonary embolism.

Comparison 1 chemotherapy plus cetuximab versus chemotherapy alone, Outcome 29 Pyrexia.

Comparison 1 chemotherapy plus cetuximab versus chemotherapy alone, Outcome 30 Respiratory failure.
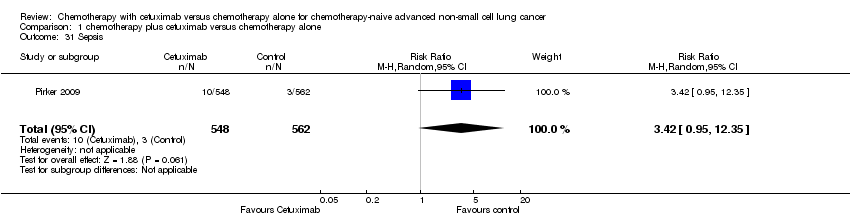
Comparison 1 chemotherapy plus cetuximab versus chemotherapy alone, Outcome 31 Sepsis.
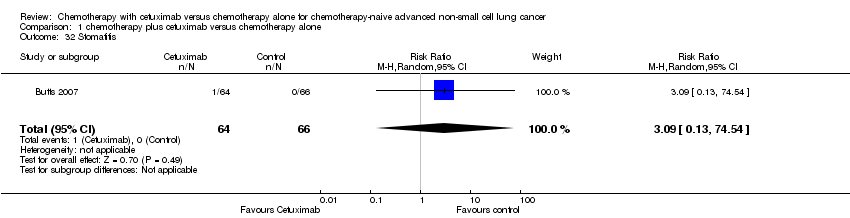
Comparison 1 chemotherapy plus cetuximab versus chemotherapy alone, Outcome 32 Stomatitis.

Comparison 1 chemotherapy plus cetuximab versus chemotherapy alone, Outcome 33 Syncope.

Comparison 1 chemotherapy plus cetuximab versus chemotherapy alone, Outcome 34 Vomiting.
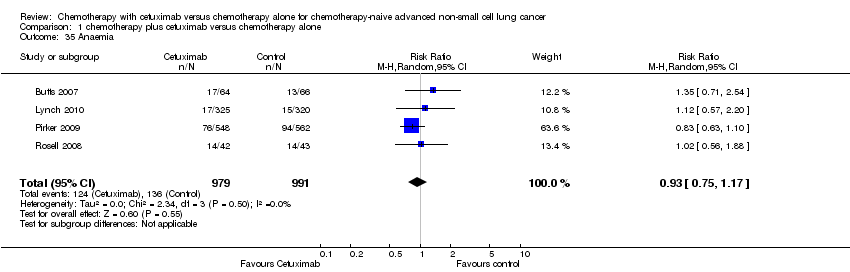
Comparison 1 chemotherapy plus cetuximab versus chemotherapy alone, Outcome 35 Anaemia.
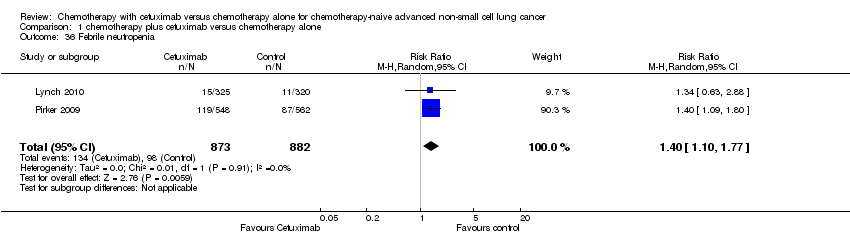
Comparison 1 chemotherapy plus cetuximab versus chemotherapy alone, Outcome 36 Febrile neutropenia.

Comparison 1 chemotherapy plus cetuximab versus chemotherapy alone, Outcome 37 Leukopenia.

Comparison 1 chemotherapy plus cetuximab versus chemotherapy alone, Outcome 38 Thrombocytopenia.
Comparison 1 chemotherapy plus cetuximab versus chemotherapy alone, Outcome 39 Neutropenia.
| Chemotherapy plus cetuximab compared with chemotherapy alone for chemotherapy‐naive advanced non‐small cell lung cancer | ||||||
| Patient or population: Patients with advanced non‐small cell lung cancer Settings: First‐line treatment Intervention: Chemotherapy plus cetuximab Comparison: Chemotherapy | ||||||
| Outcomes | Illustrative comparative risks* (95% CI) | Relative effect | No of Participants | Quality of the evidence | Comments | |
| Assumed risk | Corresponding risk | |||||
| Chemotherapy alone | Chemotherapy plus cetuximab | |||||
| Overall survival1 | 8.9 months | 10.5 months | HR 0.87 (0.79 to 0.96) | 2018 | ⊕⊕⊕⊕ | |
| Progression‐free survival1 | 4.4 months | 4.9 months | HR 0.91 (0.83 to 1.00) | 2018 | ⊕⊕⊝⊝ | |
| One‐year survival rate2 | 40 per 100 | 45 per 100 (41 to 50) | RR 1.13 (1.02 to 1.25) | 2018 | ⊕⊕⊕⊕ | |
| Objective response rate2 | 23 per 100 | 30 per 100 (26 to 35) | RR 1.31 (1.14 to 1.51) | 2018 | ⊕⊕⊕⊝ | |
| Quality of life3 | See comment | See comment | Not estimable | 1801 | ⊕⊕⊝⊝ | Both studies reported that there were no significant differences in the change of quality of life between the two treatment arms, but no detailed data were reported |
| Serious adverse events2,4 | 1. acneiform rash: 0.3 per 100 2. hypomagnesemia: 0.8 per 100 3. infusion reaction: 1.1 per 100 4. diarrhoea: 2.3 per 100 5. hypokalaemia: 3.6 per 100 6. febrile neutropenia: 7.6 per 100 7.leukopenia: 42.7 per 100 | 1. acneiform rash: 11.2 per 100 (3.2 to 39.3) 2. hypomagnesemia: 5.3 per 100 (0.9 to 30.5) 3. infusion reaction: 3.9 per 100 (1.9 to 7.6) 4. diarrhoea: 4.8 per 100 (2.9 to 8.0) 5. hypokalaemia: 6.3 per 100 (3.7 to 10.8) 6. febrile neutropenia: 10.6 per 100 (8.4 to 13.5) 7.leukopenia: 58.1 per 100 (50.0 to 67.5) | 1. acneiform rash: RR 37.36 (10.66 to 130.95) 2. hypomagnesemia: RR 6.57 (1.13 to 38.12) 3. infusion reaction: RR 3.50 (1.76 to 6.94) 4. diarrhoea: RR 2.10 (1.26 to 3.48) 5. hypokalaemia: RR 1.74 (1.02 to 2.99) 6. febrile neutropenia: RR 1.40 (1.10 to 1.77) 7.leukopenia: RR 1.36 (1.17 to 1.58) | 1. acneiform rash: 1970 2. hypomagnesemia: 775 3. infusion reaction: 1885 4. diarrhoea: 1885 5. hypokalaemia: 1110 6. febrile neutropenia: 1755 7.leukopenia: 1755 | ⊕⊕⊝⊝ | For other adverse events, there were no significant differences between the two treatment arms |
| *The basis for the assumed risk (e.g. the median control group risk across studies) is provided in footnotes. The corresponding risk (and its 95% confidence interval) is based on the assumed risk in the comparison group and the relative effect of the intervention (and its 95% CI). | ||||||
| GRADE Working Group grades of evidence | ||||||
| 1 For time‐to‐event outcomes, e.g. overall survival, the assumed risk was obtained by calculating the median value of the "median survival time of the control arm" reported by different studies. The corresponding risk was obtained in a similar way, i.e. by calculating the median value of the "median survival time of the intervention arm" reported by different studies. 2 For dichotomous outcomes, e.g. one‐year survival rate, the assumed risk was obtained by meta‐analysis of the one‐year survival rates of control arms from all relevant studies. 3 For the assessment of quality of life: In Lynch 2010, the FACT‐LCS5 questionnaire was used; in Pirker 2009, the European Organisation for Research and Treatment of Cancer quality of life questionnaire C30 (version 3.0), EORTC lung cancer specific QLQ‐LC13, and EuroQoL (EQ‐5D) questionnaires were used. 4 The overall risk of serious adverse events was not available. Thus, specific adverse events that occurred with significantly different frequencies in the two arms were summarised instead. 5 The quality of evidence is downgraded by two factors, i.e. study limitations and imprecision, according to the guidelines of the GRADE Working Group. 6 The quality of evidence is downgraded by one factor, i.e. study limitations, according to the guidelines of the GRADE Working Group. | ||||||
| Outcome or subgroup title | No. of studies | No. of participants | Statistical method | Effect size |
| 1 Overall survival Show forest plot | 4 | Hazard Ratio (Random, 95% CI) | 0.87 [0.79, 0.96] | |
| 2 Progression‐free survival Show forest plot | 4 | Hazard Ratio (Random, 95% CI) | 0.91 [0.83, 1.00] | |
| 3 Objective response rate Show forest plot | 4 | 2018 | Risk Ratio (M‐H, Random, 95% CI) | 1.31 [1.14, 1.51] |
| 4 One‐year survival rate Show forest plot | 4 | 2018 | Risk Ratio (M‐H, Random, 95% CI) | 1.13 [1.02, 1.25] |
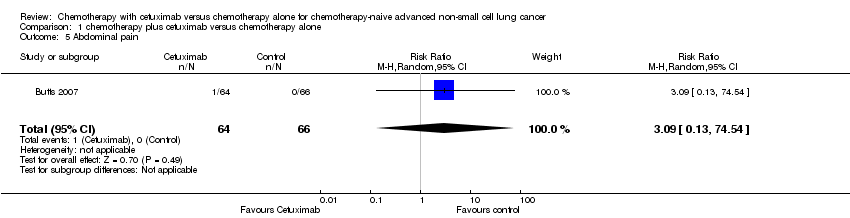
| 5 Abdominal pain Show forest plot | 1 | 130 | Risk Ratio (M‐H, Random, 95% CI) | 3.09 [0.13, 74.54] |
| 6 Acneiform rash Show forest plot | 4 | 1970 | Risk Ratio (M‐H, Random, 95% CI) | 37.36 [10.66, 130.95] |
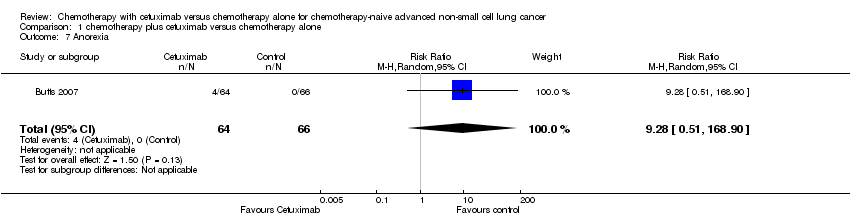
| 7 Anorexia Show forest plot | 1 | 130 | Risk Ratio (M‐H, Random, 95% CI) | 9.28 [0.51, 168.90] |
| 8 Anxiety Show forest plot | 1 | 130 | Risk Ratio (M‐H, Random, 95% CI) | 1.03 [0.07, 16.14] |
| 9 Asthenia Show forest plot | 2 | 215 | Risk Ratio (M‐H, Random, 95% CI) | 2.51 [0.10, 62.68] |
| 10 Back pain Show forest plot | 1 | 130 | Risk Ratio (M‐H, Random, 95% CI) | 5.15 [0.25, 105.31] |
| 11 Bleeding events Show forest plot | 1 | 1110 | Risk Ratio (M‐H, Random, 95% CI) | 0.68 [0.31, 1.51] |
| 12 Cardiac events Show forest plot | 1 | 1110 | Risk Ratio (M‐H, Random, 95% CI) | 1.14 [0.69, 1.87] |
| 13 Constipation Show forest plot | 1 | 130 | Risk Ratio (M‐H, Random, 95% CI) | 2.06 [0.19, 22.19] |
| 14 Dehydration Show forest plot | 2 | 775 | Risk Ratio (M‐H, Random, 95% CI) | 2.20 [0.80, 6.01] |
| 15 Diarrhoea Show forest plot | 3 | 1885 | Risk Ratio (M‐H, Random, 95% CI) | 2.10 [1.26, 3.48] |
| 16 Dysphasia Show forest plot | 1 | 130 | Risk Ratio (M‐H, Random, 95% CI) | 3.09 [0.13, 74.54] |
| 17 Dyspnea Show forest plot | 3 | 1325 | Risk Ratio (M‐H, Random, 95% CI) | 2.62 [0.53, 12.96] |
| 18 Epistaxis Show forest plot | 1 | 130 | Risk Ratio (M‐H, Random, 95% CI) | 3.09 [0.33, 28.97] |
| 19 Fatigue Show forest plot | 3 | 1885 | Risk Ratio (M‐H, Random, 95% CI) | 1.29 [0.86, 1.95] |
| 20 Hypokalaemia Show forest plot | 1 | 1110 | Risk Ratio (M‐H, Random, 95% CI) | 1.74 [1.02, 2.99] |
| 21 Hypomagnesemia Show forest plot | 2 | 775 | Risk Ratio (M‐H, Random, 95% CI) | 6.57 [1.13, 38.12] |
| 22 Hypotension Show forest plot | 1 | 130 | Risk Ratio (M‐H, Random, 95% CI) | 0.34 [0.01, 8.28] |
| 23 Infection Show forest plot | 1 | 85 | Risk Ratio (M‐H, Random, 95% CI) | 3.58 [0.79, 16.27] |
| 24 Infusion reaction Show forest plot | 3 | 1885 | Risk Ratio (M‐H, Random, 95% CI) | 3.50 [1.76, 6.94] |
| 25 Mucosal inflammation Show forest plot | 1 | 130 | Risk Ratio (M‐H, Random, 95% CI) | 0.34 [0.01, 8.28] |
| 26 Nausea Show forest plot | 3 | 860 | Risk Ratio (M‐H, Random, 95% CI) | 1.24 [0.75, 2.05] |
| 27 Pneumonia Show forest plot | 1 | 130 | Risk Ratio (M‐H, Random, 95% CI) | 3.09 [0.13, 74.54] |
| 28 Pulmonary embolism Show forest plot | 1 | 1110 | Risk Ratio (M‐H, Random, 95% CI) | 1.47 [0.79, 2.76] |
| 29 Pyrexia Show forest plot | 2 | 215 | Risk Ratio (M‐H, Random, 95% CI) | 2.24 [0.88, 5.71] |
| 30 Respiratory failure Show forest plot | 1 | 1110 | Risk Ratio (M‐H, Random, 95% CI) | 1.92 [0.82, 4.50] |
| 31 Sepsis Show forest plot | 1 | 1110 | Risk Ratio (M‐H, Random, 95% CI) | 3.42 [0.95, 12.35] |
| 32 Stomatitis Show forest plot | 1 | 130 | Risk Ratio (M‐H, Random, 95% CI) | 3.09 [0.13, 74.54] |
| 33 Syncope Show forest plot | 1 | 85 | Risk Ratio (M‐H, Random, 95% CI) | 3.58 [0.79, 16.27] |
| 34 Vomiting Show forest plot | 3 | 1325 | Risk Ratio (M‐H, Random, 95% CI) | 0.98 [0.69, 1.40] |
| 35 Anaemia Show forest plot | 4 | 1970 | Risk Ratio (M‐H, Random, 95% CI) | 0.93 [0.75, 1.17] |
| 36 Febrile neutropenia Show forest plot | 2 | 1755 | Risk Ratio (M‐H, Random, 95% CI) | 1.40 [1.10, 1.77] |
| 37 Leukopenia Show forest plot | 2 | 1755 | Risk Ratio (M‐H, Random, 95% CI) | 1.36 [1.17, 1.58] |
| 38 Thrombocytopenia Show forest plot | 3 | 860 | Risk Ratio (M‐H, Random, 95% CI) | 1.26 [0.96, 1.66] |
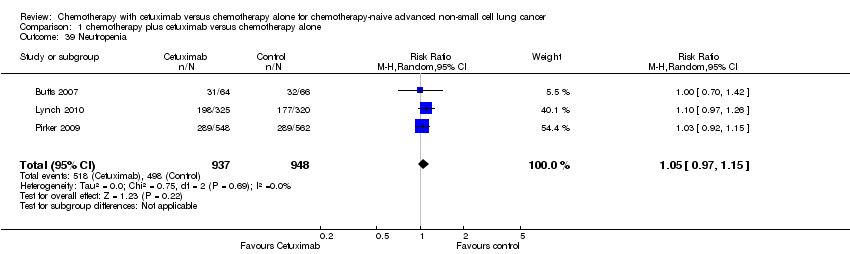
| 39 Neutropenia Show forest plot | 3 | 1885 | Risk Ratio (M‐H, Random, 95% CI) | 1.05 [0.97, 1.15] |