化疗与西妥昔单抗以及化疗单独用于化疗初治的晚期非小细胞肺癌
Referencias
References to studies included in this review
References to studies excluded from this review
References to ongoing studies
Additional references
Characteristics of studies
Characteristics of included studies [ordered by study ID]
| Methods | 1. Design: A multicentre, open‐label, parallel group, randomised phase II trial | |
| Participants | Inclusion criteria: chemotherapy‐naive patients at least 18 years of age and with an ECOG PS less than 2, with histologically or cytologically documented advanced NSCLC (stage IIIB with pleural effusion or stage IV) of all histologic subtypes 1. Female, n (%): 73 (55.7) 2. Age in years, median (range): 66 (35‐84) 3. White people, n (%): 109 (83.2) 4. ECOG PS 0‐1, n (%): 129 (98.5) 5. Tumour stage IIIB/IV: 123 (93.9) 6. Adenocarcinoma, n (%): 61 (46.6) 7. Never smoked, n (%): 19 (14.5) 8. EGFR expression, n (%): NA 9. KRAS mutations, n (%): NA 10. EGFR mutations, n (%): NA | |
| Interventions | 1. Arm A (n = 65): gemcitabine + cisplatin + cetuximab, or gemcitabine + carboplatin + cetuximab (21.5% received poststudy chemotherapy) Cross‐over between treatment arms was not allowed | |
| Outcomes | 1. Primary: Objective response rate 2. Secondary: Progression‐free survival, overall survival (including data on one‐year survival rate), safety, disease control rate, duration of response, time to response | |
| Notes | ||
| Risk of bias | ||
| Bias | Authors' judgement | Support for judgement |
| Random sequence generation (selection bias) | Unclear risk | No details on the procedure were provided |
| Allocation concealment (selection bias) | Unclear risk | There was no mention of allocation concealment |
| Blinding of participants and personnel (performance bias) | Low risk | No blinding. However, the results on the two outcomes were mainly determined by the biological, objective effect of treatments and unlikely to be affected by the participants' and personnels' knowledge of the assignment status |
| Blinding of participants and personnel (performance bias) | High risk | No blinding. Progression‐free survival, objective response rate, and serious adverse events are not objective outcomes and could be affected by participants' and/or personnels' knowledge of the assignment status. The study did not use quality of life as an outcome |
| Blinding of outcome assessment (detection bias) | Low risk | Quote: "The sponsor conducted centralized reviews to confirm investigator measurements and to determine best response. These reviews were blinded, as the sponsor reviewer did not receive information as to which treatment the patients were receiving" |
| Blinding of outcome assessment (detection bias) | Low risk | Quote: "The sponsor conducted centralized reviews to confirm investigator measurements and to determine best response. These reviews were blinded, as the sponsor reviewer did not receive information as to which treatment the patients were receiving" |
| Incomplete outcome data (attrition bias) | Low risk | Quote: "Efficacy analyses were performed on an intent‐to‐treat basis. Analyses of safety and dosing data were restricted to treated patients." In effect, the information on safety were available for almost all (130, 99.2%) patients |
| Selective reporting (reporting bias) | Low risk | Data on all outcomes concerned in this review, except quality of life, were reported in the original paper. Examination of the protocol of the trial showed that quality of life was not a pre‐specified outcome (see: http://clinicaltrials.gov/ct2/show/study/NCT00112346) |
| Other bias | Low risk | No evidence about other bias was found |
| Methods | 1. Design: A multicentre, open‐label, parallel group, randomised phase III trial | |
| Participants | Inclusion criteria: patients who had histologically or cytologically confirmed stage IV, stage IIIB (with malignant pleural effusion), or recurrent (after radiotherapy or surgery) NSCLC with bidimensionally measurable disease, were ≥ 18 years of age, and had an ECOG PS less than 2 1. Female, n (%): 280 (41.4) 2. Age in years, median (range): 65 (34‐87) 3. White people, n (%): 596 (88.1) 4. ECOG PS 0‐1, n (%): 665 (98.4) 5. Tumour stage IIIB/IV: 646 (95.6) 6. Adenocarcinoma, n (%): 354 (52.4) 7. Never smoked, n (%): 53 (7.8) 8. EGFR expression, n (%): NA 9. KRAS mutations, n (%): NA 10. EGFR mutations, n (%): NA | |
| Interventions | 1. Arm A (n = 338): taxane (paclitaxel or docetaxel) +carboplatin + cetuximab (24.3% received poststudy chemotherapy) 2. Arm B (n = 338): taxane (paclitaxel or docetaxel) +carboplatin (26% received poststudy cetuximab) Cross over to cetuximab was not permitted | |
| Outcomes | 1. Primary: Progression‐free survival 2. Secondary: Objective response rate, overall survival (including data on one‐year survival rate), quality of life, safety | |
| Notes | ||
| Risk of bias | ||
| Bias | Authors' judgement | Support for judgement |
| Random sequence generation (selection bias) | Unclear risk | No details on the procedure were provided |
| Allocation concealment (selection bias) | Unclear risk | There was no mention of allocation concealment |
| Blinding of participants and personnel (performance bias) | Low risk | No blinding. However, the results on the two outcomes were mainly determined by the biological, objective effect of treatments and unlikely to be affected by the participants' and personnels' knowledge of the assignment status |
| Blinding of participants and personnel (performance bias) | High risk | No blinding. The four outcomes are not objective in nature and could be affected by participants' and/or personnels' knowledge of the assignment status |
| Blinding of outcome assessment (detection bias) | Low risk | The outcomes were assessed by an independent radiologic review committee consisting of two primary radiologist reviewers and a third for adjudication. Final review was conducted by an oncologist, integrating radiologic assessment with clinical information |
| Blinding of outcome assessment (detection bias) | Low risk | The outcomes were assessed by an independent radiologic review committee consisting of two primary radiologist reviewers and a third for adjudication. Final review was conducted by an oncologist, integrating radiologic assessment with clinical information |
| Incomplete outcome data (attrition bias) | Low risk | Quote: "Baseline characteristics and efficacy were analyzed in all randomly assigned patients. Analyses of safety and dosing included only treated patients (patients receiving at least one dose of any study therapy)." Almost all (645, 95.4%) patients were available for safety analysis |
| Selective reporting (reporting bias) | Low risk | Data on all six outcomes concerned in this review were reported in the original paper |
| Other bias | Low risk | No evidence about other bias was found |
| Methods | 1. Design: A multicentre, open‐label, parallel group, randomised phase III trial | |
| Participants | Inclusion criteria: Chemotherapy‐naive patients with histologically or cytologically proven stage wet IIIB or stage IV NSCLC and immunohistochemical evidence of EGFR expression in at least one positively stained tumour cell 1. Female, n (%): 335 (29.8) 2. Age in years, median (range): 60 (18‐83) 3. White people, n (%): 946 (84.1) 4. ECOG PS 0‐1, n (%): 929 (82.6) 5. Tumour stage IIIB/IV: 1125 (100.0) 6. Adenocarcinoma, n (%): 532 (47.3) 7. Never smoked, n (%): 244 (21.7) 8. EGFR expression, n (%): 1125 (100.0) 9. KRAS mutations, n (%): NA 10. EGFR mutations, n (%): NA | |
| Interventions | 1. Arm A (n = 557): cisplatin + vinorelbine + cetuximab (17% received poststudy chemotherapy) 2. Arm B (n = 568): cisplatin + vinorelbine (27% received poststudy cetuximab) | |
| Outcomes | 1. Primary: Overall survival (including data on one‐year survival rate) 2. Secondary: Progression‐free survival, best overall response, quality of life, safety | |
| Notes | ||
| Risk of bias | ||
| Bias | Authors' judgement | Support for judgement |
| Random sequence generation (selection bias) | Low risk | Patients were randomised centrally using an interactive voice response system. The random allocation schedule was generated using a computer |
| Allocation concealment (selection bias) | Low risk | Quote: "......generated the random allocation schedule using a computer; physicians and study monitors did not have access to the code" |
| Blinding of participants and personnel (performance bias) | Low risk | No blinding. However, the results on the two outcomes were mainly determined by the biological, objective effect of treatments and unlikely to be affected by the participants' and personnels' knowledge of the assignment status |
| Blinding of participants and personnel (performance bias) | High risk | No blinding. The four outcomes are not objective in nature and could be affected by participants' and/or personnels' knowledge of the assignment status |
| Blinding of outcome assessment (detection bias) | Low risk | No blinding. However, overall survival and one‐year survival rate were objective, "hard" outcomes and were unlikely to have been affected by the subjective judgement of assessors |
| Blinding of outcome assessment (detection bias) | High risk | No blinding. The assessments of these outcomes involved subjective judgements and were vulnerable to the performance of assessors who were aware of the assignment status |
| Incomplete outcome data (attrition bias) | Low risk | Quote: "Efficacy analysis was by intention to treat". Almost all (1110, 98.7%) patients were available for safety analysis |
| Selective reporting (reporting bias) | Low risk | Data on all six outcomes concerned in this review were reported in the original paper |
| Other bias | Low risk | No evidence about other bias was found |
| Methods | 1. Design: A multicentre, open‐label, parallel group, randomised phase II trial | |
| Participants | Inclusion criteria: Chemotherapy‐naive patients with histologically or cytologically proven NSCLC, stage IV or stage IIIB with documented malignant pleural effusion, according to American Joint Committee on Cancer criteria, and immunohistochemical evidence of EGFR expression in the primary tumour and/or metastases 1. Female, n (%): 22 (25.6) 2. Age in years, median (range): 58 (33‐74) 3. White people, n (%): 86 (100.0) 4. ECOG PS 0‐1, n (%): NA (Karnofsky performance status 80‐100: 78 (92.9) 5. Tumour stage IIIB/IV: 86 (100.0) 6. Adenocarcinoma, n (%): 37 (43.0) 7. Never smoked, n (%): NA 8. EGFR expression, n (%): 86 (100.0) 9. KRAS mutations, n (%): NA 10. EGFR mutations, n (%): NA | |
| Interventions | 1. Arm A (n = 43): cisplatin + vinorelbine + cetuximab 2. Arm B (n = 43): cisplatin + vinorelbine | |
| Outcomes | 1. Primary: Overall response rate 2. Secondary: Overall survival (including data on one‐year survival rate), progression‐free survival, time to treatment failure, duration of response, safety | |
| Notes | ||
| Risk of bias | ||
| Bias | Authors' judgement | Support for judgement |
| Random sequence generation (selection bias) | Unclear risk | No details on the procedure were provided |
| Allocation concealment (selection bias) | Unclear risk | There was no mention of allocation concealment |
| Blinding of participants and personnel (performance bias) | Low risk | No blinding. However, the results on the two outcomes were mainly determined by the biological, objective effect of treatments and unlikely to be affected by the participants' and personnels' knowledge of the assignment status |
| Blinding of participants and personnel (performance bias) | High risk | No blinding. Progression‐free survival, objective response rate, and serious adverse events are not objective outcomes and could be affected by participants' and/or personnels' knowledge of the assignment status. The study did not use quality of life as an outcome |
| Blinding of outcome assessment (detection bias) | Low risk | No blinding. However, overall survival and one‐year survival rate were objective, "hard" outcomes and unlikely to have been affected by the subjective judgement of assessors |
| Blinding of outcome assessment (detection bias) | High risk | No blinding. The assessments of these outcomes involved subjective judgements and were vulnerable to the performance of assessors who were aware of the assignment status |
| Incomplete outcome data (attrition bias) | Low risk | Quote: "The efficacy analysis was based on the intent to treat population defined as all randomized patients. The safety analysis was based on all patients who had received any dose of study treatment." Almost all (85, 98.8%) patients were available for safety analysis |
| Selective reporting (reporting bias) | Unclear risk | Data on quality of life was not reported in the paper. As no protocol or registration can be found for this trial, it is difficult to say whether quality of life was a pre‐specified outcome. Thus, the risk for selective reporting bias was considered unclear |
| Other bias | Low risk | No evidence about other bias was found |
ECOG PS ‐ Eastern Cooperative Oncology Group performance status
EGFR ‐ epidermal growth factor receptor
NA ‐ not available
NSCLC ‐ non‐small cell lung cancer
Characteristics of excluded studies [ordered by study ID]
| Study | Reason for exclusion |
| Not comparing cetuximab plus chemotherapy with chemotherapy alone | |
| Single‐arm, non‐randomised study | |
| Single‐arm, non‐randomised study | |
| Not comparing cetuximab plus chemotherapy with chemotherapy alone | |
| Not comparing cetuximab plus chemotherapy with chemotherapy alone | |
| The drugs used in different arms were the same (treatment schedules were different) | |
| Single‐arm, non‐randomised study | |
| Single‐arm, non‐randomised study | |
| Duplicate of an included study (Lynch 2010) | |
| Single‐arm, non‐randomised study | |
| Duplicate of an included study (Pirker 2009) | |
| Single‐arm, non‐randomised study | |
| Single‐arm, non‐randomised study | |
| Single‐arm, non‐randomised study | |
| Not comparing cetuximab plus chemotherapy with chemotherapy alone | |
| Single‐arm, non‐randomised study | |
| Duplicate of an included study (Pirker 2009) | |
| Single‐arm, non‐randomised study | |
| Duplicate of an included study (Rosell 2008) | |
| Single‐arm, non‐randomised study | |
| Single‐arm, non‐randomised study | |
| Single‐arm, non‐randomised study | |
| Duplicate of an included study (Pirker 2009) |
Characteristics of ongoing studies [ordered by study ID]
| Trial name or title | |
| Methods | Randomised, phase III study |
| Participants | 1546 patients with advanced non‐small cell lung cancer |
| Interventions | Active Comparator: Arm I Patients receive carboplatin IV over 30 minutes and paclitaxel IV over 3 hours with or without bevacizumab IV over 30‐90 minutes on day 1. Treatment repeats every 21 days for up to 6 courses in the absence of disease progression or unacceptable toxicity. After completion of 6 courses, patients receiving bevacizumab may continue to receive bevacizumab (as above) in the absence of disease progression or unacceptable toxicity Experimental: Arm II Patients receive carboplatin and paclitaxel with or without bevacizumab as in arm I. Patients also receive cetuximab IV over 1‐2 hours on days 1, 8, and 15. Treatment repeats every 21 days for up to 6 courses in the absence of disease progression or unacceptable toxicity. After completion of 6 courses, patients may continue to receive cetuximab with or without bevacizumab (as above) in the absence of disease progression or unacceptable toxicity |
| Outcomes | Primary Outcome Measures: overall survival; progression‐free survival of EGFR FISH‐positive patients by institutional review |
| Starting date | |
| Contact information | |
| Notes |
EGFR ‐ epidermal growth factor receptor
Data and analyses
| Outcome or subgroup title | No. of studies | No. of participants | Statistical method | Effect size |
| 1 Overall survival Show forest plot | 4 | Hazard Ratio (Random, 95% CI) | 0.87 [0.79, 0.96] | |
| Analysis 1.1 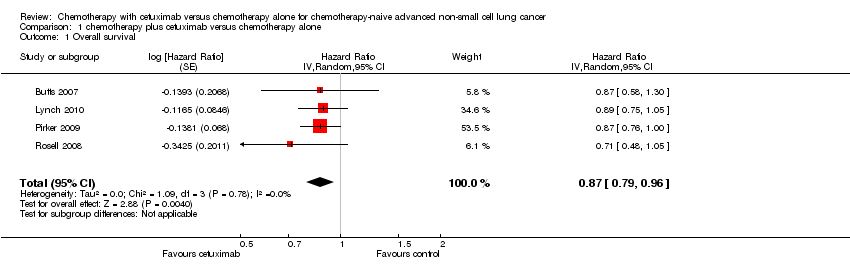 Comparison 1 chemotherapy plus cetuximab versus chemotherapy alone, Outcome 1 Overall survival. | ||||
| 2 Progression‐free survival Show forest plot | 4 | Hazard Ratio (Random, 95% CI) | 0.91 [0.83, 1.00] | |
| Analysis 1.2  Comparison 1 chemotherapy plus cetuximab versus chemotherapy alone, Outcome 2 Progression‐free survival. | ||||
| 3 Objective response rate Show forest plot | 4 | 2018 | Risk Ratio (M‐H, Random, 95% CI) | 1.31 [1.14, 1.51] |
| Analysis 1.3 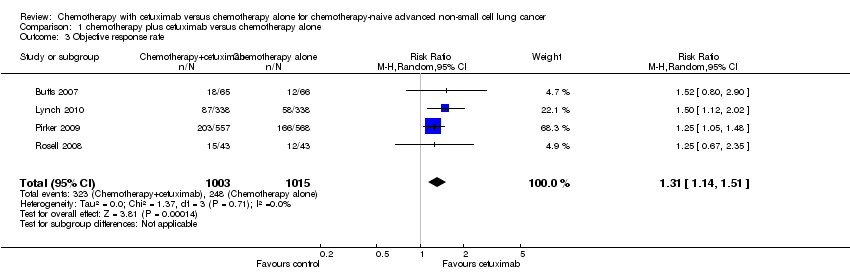 Comparison 1 chemotherapy plus cetuximab versus chemotherapy alone, Outcome 3 Objective response rate. | ||||
| 4 One‐year survival rate Show forest plot | 4 | 2018 | Risk Ratio (M‐H, Random, 95% CI) | 1.13 [1.02, 1.25] |
| Analysis 1.4  Comparison 1 chemotherapy plus cetuximab versus chemotherapy alone, Outcome 4 One‐year survival rate. | ||||
| 5 Abdominal pain Show forest plot | 1 | 130 | Risk Ratio (M‐H, Random, 95% CI) | 3.09 [0.13, 74.54] |
| Analysis 1.5  Comparison 1 chemotherapy plus cetuximab versus chemotherapy alone, Outcome 5 Abdominal pain. | ||||
| 6 Acneiform rash Show forest plot | 4 | 1970 | Risk Ratio (M‐H, Random, 95% CI) | 37.36 [10.66, 130.95] |
| Analysis 1.6  Comparison 1 chemotherapy plus cetuximab versus chemotherapy alone, Outcome 6 Acneiform rash. | ||||
| 7 Anorexia Show forest plot | 1 | 130 | Risk Ratio (M‐H, Random, 95% CI) | 9.28 [0.51, 168.90] |
| Analysis 1.7  Comparison 1 chemotherapy plus cetuximab versus chemotherapy alone, Outcome 7 Anorexia. | ||||
| 8 Anxiety Show forest plot | 1 | 130 | Risk Ratio (M‐H, Random, 95% CI) | 1.03 [0.07, 16.14] |
| Analysis 1.8  Comparison 1 chemotherapy plus cetuximab versus chemotherapy alone, Outcome 8 Anxiety. | ||||
| 9 Asthenia Show forest plot | 2 | 215 | Risk Ratio (M‐H, Random, 95% CI) | 2.51 [0.10, 62.68] |
| Analysis 1.9 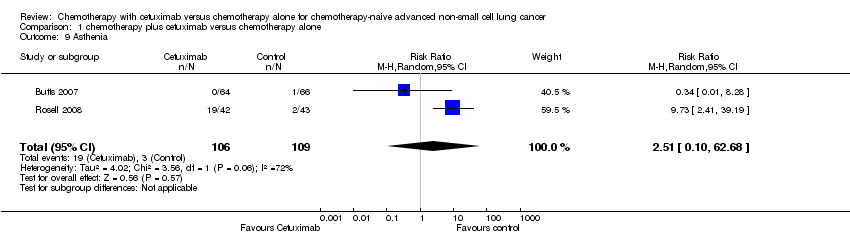 Comparison 1 chemotherapy plus cetuximab versus chemotherapy alone, Outcome 9 Asthenia. | ||||
| 10 Back pain Show forest plot | 1 | 130 | Risk Ratio (M‐H, Random, 95% CI) | 5.15 [0.25, 105.31] |
| Analysis 1.10  Comparison 1 chemotherapy plus cetuximab versus chemotherapy alone, Outcome 10 Back pain. | ||||
| 11 Bleeding events Show forest plot | 1 | 1110 | Risk Ratio (M‐H, Random, 95% CI) | 0.68 [0.31, 1.51] |
| Analysis 1.11  Comparison 1 chemotherapy plus cetuximab versus chemotherapy alone, Outcome 11 Bleeding events. | ||||
| 12 Cardiac events Show forest plot | 1 | 1110 | Risk Ratio (M‐H, Random, 95% CI) | 1.14 [0.69, 1.87] |
| Analysis 1.12  Comparison 1 chemotherapy plus cetuximab versus chemotherapy alone, Outcome 12 Cardiac events. | ||||
| 13 Constipation Show forest plot | 1 | 130 | Risk Ratio (M‐H, Random, 95% CI) | 2.06 [0.19, 22.19] |
| Analysis 1.13  Comparison 1 chemotherapy plus cetuximab versus chemotherapy alone, Outcome 13 Constipation. | ||||
| 14 Dehydration Show forest plot | 2 | 775 | Risk Ratio (M‐H, Random, 95% CI) | 2.20 [0.80, 6.01] |
| Analysis 1.14  Comparison 1 chemotherapy plus cetuximab versus chemotherapy alone, Outcome 14 Dehydration. | ||||
| 15 Diarrhoea Show forest plot | 3 | 1885 | Risk Ratio (M‐H, Random, 95% CI) | 2.10 [1.26, 3.48] |
| Analysis 1.15  Comparison 1 chemotherapy plus cetuximab versus chemotherapy alone, Outcome 15 Diarrhoea. | ||||
| 16 Dysphasia Show forest plot | 1 | 130 | Risk Ratio (M‐H, Random, 95% CI) | 3.09 [0.13, 74.54] |
| Analysis 1.16  Comparison 1 chemotherapy plus cetuximab versus chemotherapy alone, Outcome 16 Dysphasia. | ||||
| 17 Dyspnea Show forest plot | 3 | 1325 | Risk Ratio (M‐H, Random, 95% CI) | 2.62 [0.53, 12.96] |
| Analysis 1.17  Comparison 1 chemotherapy plus cetuximab versus chemotherapy alone, Outcome 17 Dyspnea. | ||||
| 18 Epistaxis Show forest plot | 1 | 130 | Risk Ratio (M‐H, Random, 95% CI) | 3.09 [0.33, 28.97] |
| Analysis 1.18  Comparison 1 chemotherapy plus cetuximab versus chemotherapy alone, Outcome 18 Epistaxis. | ||||
| 19 Fatigue Show forest plot | 3 | 1885 | Risk Ratio (M‐H, Random, 95% CI) | 1.29 [0.86, 1.95] |
| Analysis 1.19 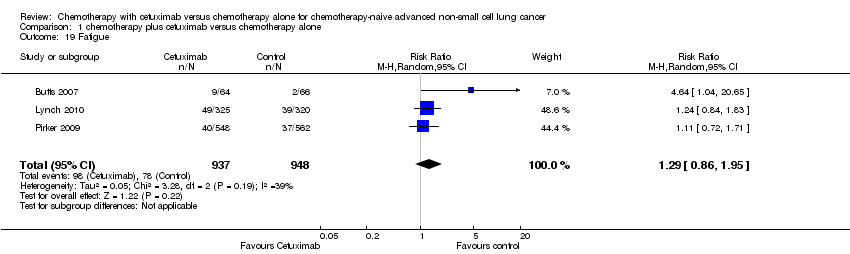 Comparison 1 chemotherapy plus cetuximab versus chemotherapy alone, Outcome 19 Fatigue. | ||||
| 20 Hypokalaemia Show forest plot | 1 | 1110 | Risk Ratio (M‐H, Random, 95% CI) | 1.74 [1.02, 2.99] |
| Analysis 1.20  Comparison 1 chemotherapy plus cetuximab versus chemotherapy alone, Outcome 20 Hypokalaemia. | ||||
| 21 Hypomagnesemia Show forest plot | 2 | 775 | Risk Ratio (M‐H, Random, 95% CI) | 6.57 [1.13, 38.12] |
| Analysis 1.21  Comparison 1 chemotherapy plus cetuximab versus chemotherapy alone, Outcome 21 Hypomagnesemia. | ||||
| 22 Hypotension Show forest plot | 1 | 130 | Risk Ratio (M‐H, Random, 95% CI) | 0.34 [0.01, 8.28] |
| Analysis 1.22  Comparison 1 chemotherapy plus cetuximab versus chemotherapy alone, Outcome 22 Hypotension. | ||||
| 23 Infection Show forest plot | 1 | 85 | Risk Ratio (M‐H, Random, 95% CI) | 3.58 [0.79, 16.27] |
| Analysis 1.23  Comparison 1 chemotherapy plus cetuximab versus chemotherapy alone, Outcome 23 Infection. | ||||
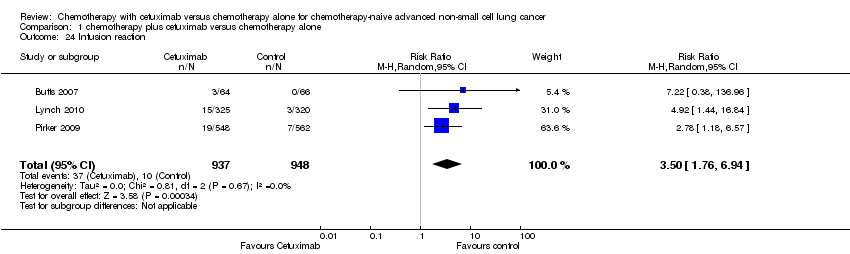
| 24 Infusion reaction Show forest plot | 3 | 1885 | Risk Ratio (M‐H, Random, 95% CI) | 3.50 [1.76, 6.94] |
| Analysis 1.24  Comparison 1 chemotherapy plus cetuximab versus chemotherapy alone, Outcome 24 Infusion reaction. | ||||
| 25 Mucosal inflammation Show forest plot | 1 | 130 | Risk Ratio (M‐H, Random, 95% CI) | 0.34 [0.01, 8.28] |
| Analysis 1.25  Comparison 1 chemotherapy plus cetuximab versus chemotherapy alone, Outcome 25 Mucosal inflammation. | ||||
| 26 Nausea Show forest plot | 3 | 860 | Risk Ratio (M‐H, Random, 95% CI) | 1.24 [0.75, 2.05] |
| Analysis 1.26 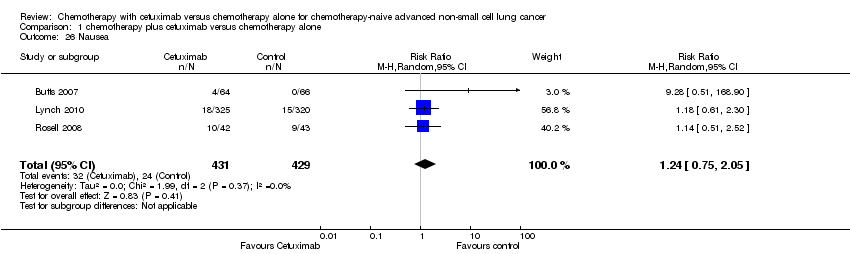 Comparison 1 chemotherapy plus cetuximab versus chemotherapy alone, Outcome 26 Nausea. | ||||
| 27 Pneumonia Show forest plot | 1 | 130 | Risk Ratio (M‐H, Random, 95% CI) | 3.09 [0.13, 74.54] |
| Analysis 1.27  Comparison 1 chemotherapy plus cetuximab versus chemotherapy alone, Outcome 27 Pneumonia. | ||||
| 28 Pulmonary embolism Show forest plot | 1 | 1110 | Risk Ratio (M‐H, Random, 95% CI) | 1.47 [0.79, 2.76] |
| Analysis 1.28  Comparison 1 chemotherapy plus cetuximab versus chemotherapy alone, Outcome 28 Pulmonary embolism. | ||||
| 29 Pyrexia Show forest plot | 2 | 215 | Risk Ratio (M‐H, Random, 95% CI) | 2.24 [0.88, 5.71] |
| Analysis 1.29  Comparison 1 chemotherapy plus cetuximab versus chemotherapy alone, Outcome 29 Pyrexia. | ||||
| 30 Respiratory failure Show forest plot | 1 | 1110 | Risk Ratio (M‐H, Random, 95% CI) | 1.92 [0.82, 4.50] |
| Analysis 1.30  Comparison 1 chemotherapy plus cetuximab versus chemotherapy alone, Outcome 30 Respiratory failure. | ||||
| 31 Sepsis Show forest plot | 1 | 1110 | Risk Ratio (M‐H, Random, 95% CI) | 3.42 [0.95, 12.35] |
| Analysis 1.31  Comparison 1 chemotherapy plus cetuximab versus chemotherapy alone, Outcome 31 Sepsis. | ||||
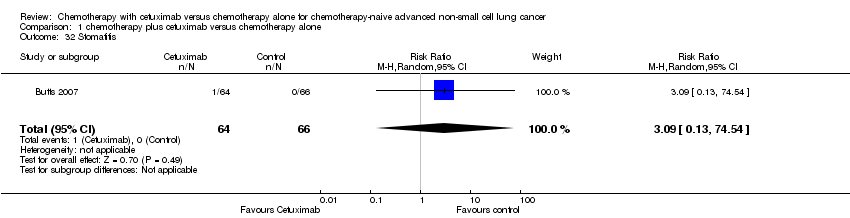
| 32 Stomatitis Show forest plot | 1 | 130 | Risk Ratio (M‐H, Random, 95% CI) | 3.09 [0.13, 74.54] |
| Analysis 1.32  Comparison 1 chemotherapy plus cetuximab versus chemotherapy alone, Outcome 32 Stomatitis. | ||||
| 33 Syncope Show forest plot | 1 | 85 | Risk Ratio (M‐H, Random, 95% CI) | 3.58 [0.79, 16.27] |
| Analysis 1.33 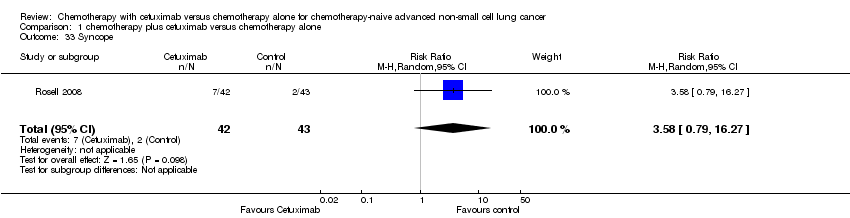 Comparison 1 chemotherapy plus cetuximab versus chemotherapy alone, Outcome 33 Syncope. | ||||
| 34 Vomiting Show forest plot | 3 | 1325 | Risk Ratio (M‐H, Random, 95% CI) | 0.98 [0.69, 1.40] |
| Analysis 1.34  Comparison 1 chemotherapy plus cetuximab versus chemotherapy alone, Outcome 34 Vomiting. | ||||
| 35 Anaemia Show forest plot | 4 | 1970 | Risk Ratio (M‐H, Random, 95% CI) | 0.93 [0.75, 1.17] |
| Analysis 1.35 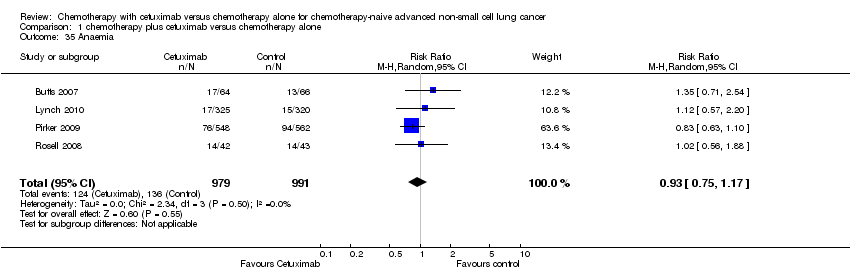 Comparison 1 chemotherapy plus cetuximab versus chemotherapy alone, Outcome 35 Anaemia. | ||||
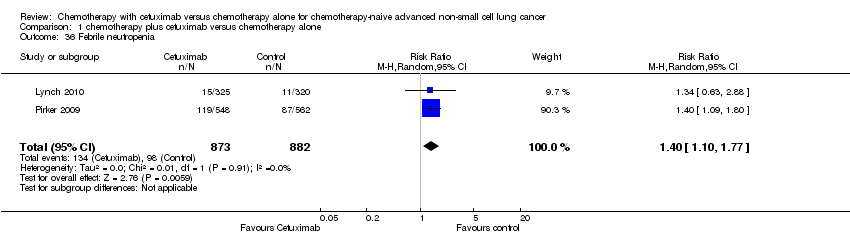
| 36 Febrile neutropenia Show forest plot | 2 | 1755 | Risk Ratio (M‐H, Random, 95% CI) | 1.40 [1.10, 1.77] |
| Analysis 1.36  Comparison 1 chemotherapy plus cetuximab versus chemotherapy alone, Outcome 36 Febrile neutropenia. | ||||
| 37 Leukopenia Show forest plot | 2 | 1755 | Risk Ratio (M‐H, Random, 95% CI) | 1.36 [1.17, 1.58] |
| Analysis 1.37 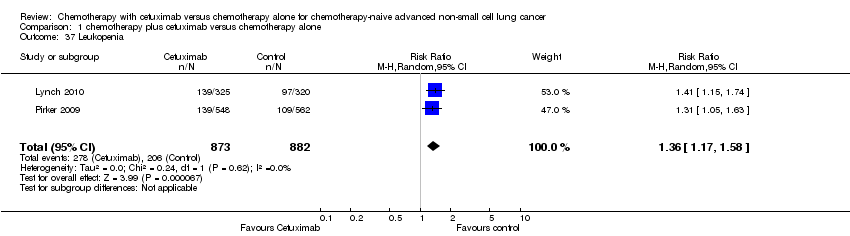 Comparison 1 chemotherapy plus cetuximab versus chemotherapy alone, Outcome 37 Leukopenia. | ||||
| 38 Thrombocytopenia Show forest plot | 3 | 860 | Risk Ratio (M‐H, Random, 95% CI) | 1.26 [0.96, 1.66] |
| Analysis 1.38  Comparison 1 chemotherapy plus cetuximab versus chemotherapy alone, Outcome 38 Thrombocytopenia. | ||||
| 39 Neutropenia Show forest plot | 3 | 1885 | Risk Ratio (M‐H, Random, 95% CI) | 1.05 [0.97, 1.15] |
| Analysis 1.39 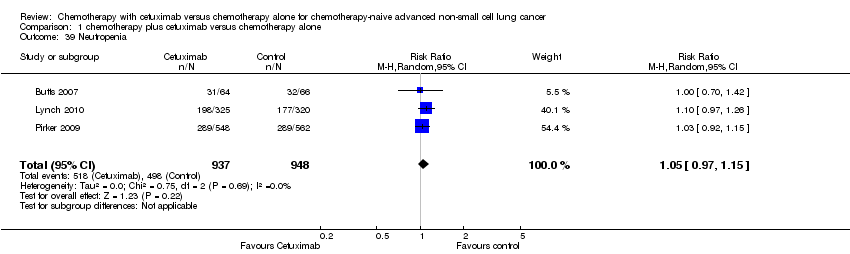 Comparison 1 chemotherapy plus cetuximab versus chemotherapy alone, Outcome 39 Neutropenia. | ||||

Figure 1. The flow chart of study selection

Risk of bias summary: review authors' judgements about each risk of bias item for each included study.

Risk of bias graph: review authors' judgements about each risk of bias item presented as percentages across all included studies.

Forest plot of comparison: 1 chemotherapy plus cetuximab versus chemotherapy alone, outcome: 1.1 Overall survival.
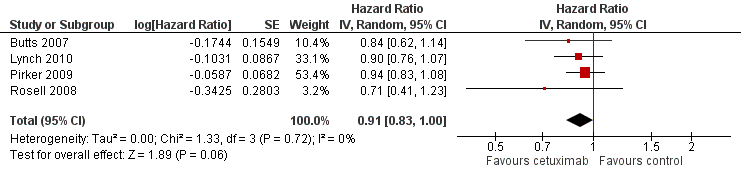
Forest plot of comparison: 1 chemotherapy plus cetuximab versus chemotherapy alone, outcome: 1.2 Progression‐free survival.

Forest plot of comparison: 1 chemotherapy plus cetuximab versus chemotherapy alone, outcome: 1.3 Objective response rate.

Comparison 1 chemotherapy plus cetuximab versus chemotherapy alone, Outcome 1 Overall survival.

Comparison 1 chemotherapy plus cetuximab versus chemotherapy alone, Outcome 2 Progression‐free survival.

Comparison 1 chemotherapy plus cetuximab versus chemotherapy alone, Outcome 3 Objective response rate.
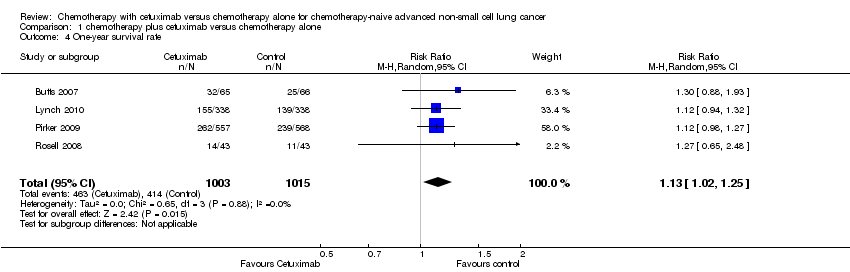
Comparison 1 chemotherapy plus cetuximab versus chemotherapy alone, Outcome 4 One‐year survival rate.
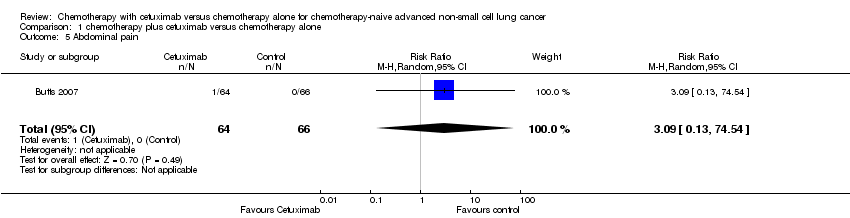
Comparison 1 chemotherapy plus cetuximab versus chemotherapy alone, Outcome 5 Abdominal pain.

Comparison 1 chemotherapy plus cetuximab versus chemotherapy alone, Outcome 6 Acneiform rash.
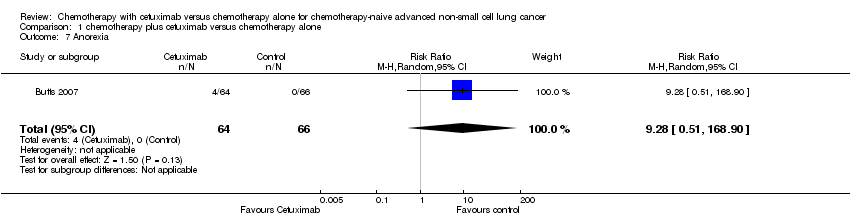
Comparison 1 chemotherapy plus cetuximab versus chemotherapy alone, Outcome 7 Anorexia.
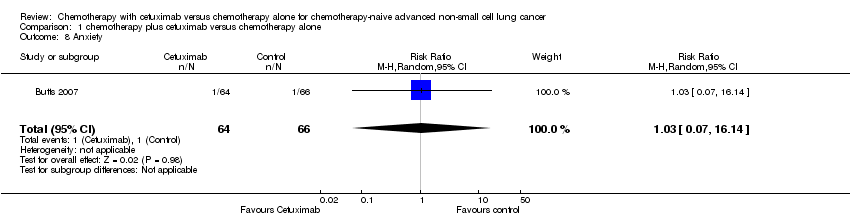
Comparison 1 chemotherapy plus cetuximab versus chemotherapy alone, Outcome 8 Anxiety.

Comparison 1 chemotherapy plus cetuximab versus chemotherapy alone, Outcome 9 Asthenia.

Comparison 1 chemotherapy plus cetuximab versus chemotherapy alone, Outcome 10 Back pain.
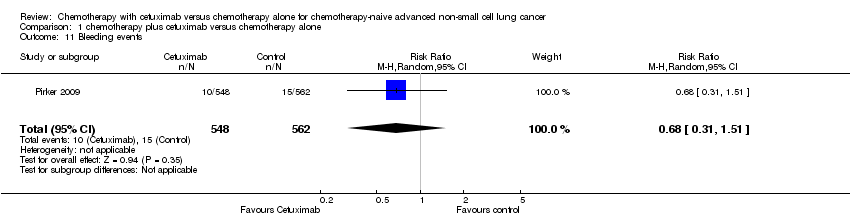
Comparison 1 chemotherapy plus cetuximab versus chemotherapy alone, Outcome 11 Bleeding events.

Comparison 1 chemotherapy plus cetuximab versus chemotherapy alone, Outcome 12 Cardiac events.
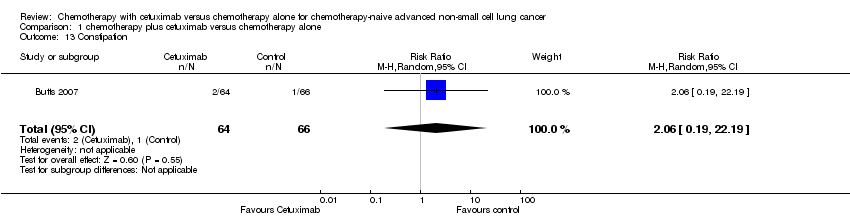
Comparison 1 chemotherapy plus cetuximab versus chemotherapy alone, Outcome 13 Constipation.
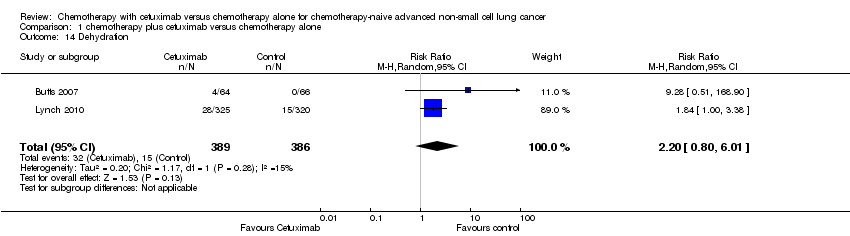
Comparison 1 chemotherapy plus cetuximab versus chemotherapy alone, Outcome 14 Dehydration.
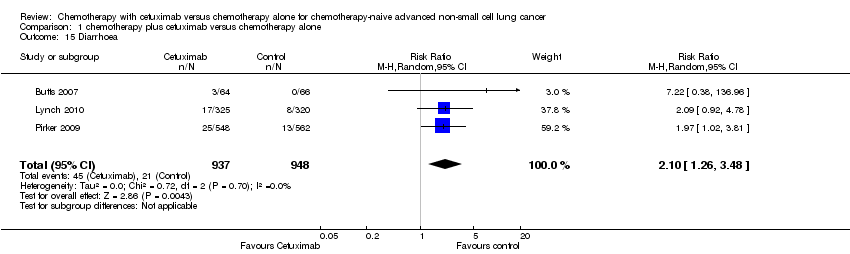
Comparison 1 chemotherapy plus cetuximab versus chemotherapy alone, Outcome 15 Diarrhoea.

Comparison 1 chemotherapy plus cetuximab versus chemotherapy alone, Outcome 16 Dysphasia.
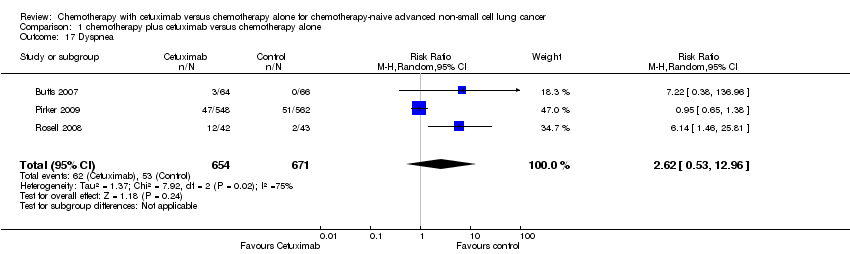
Comparison 1 chemotherapy plus cetuximab versus chemotherapy alone, Outcome 17 Dyspnea.

Comparison 1 chemotherapy plus cetuximab versus chemotherapy alone, Outcome 18 Epistaxis.

Comparison 1 chemotherapy plus cetuximab versus chemotherapy alone, Outcome 19 Fatigue.
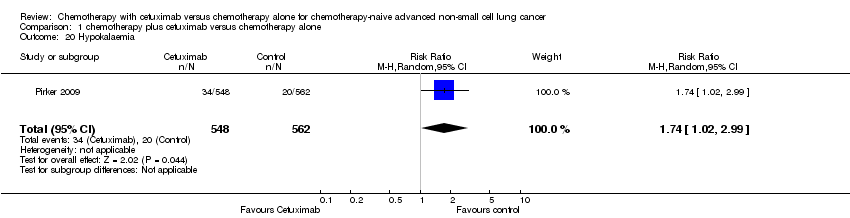
Comparison 1 chemotherapy plus cetuximab versus chemotherapy alone, Outcome 20 Hypokalaemia.
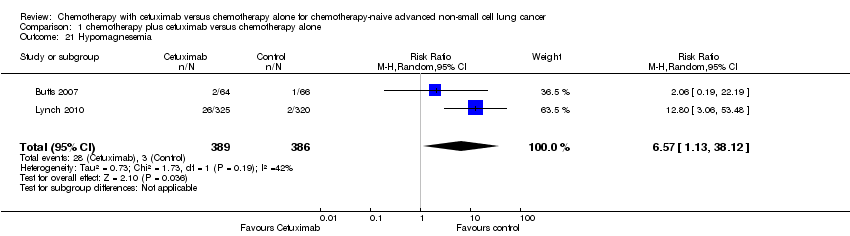
Comparison 1 chemotherapy plus cetuximab versus chemotherapy alone, Outcome 21 Hypomagnesemia.

Comparison 1 chemotherapy plus cetuximab versus chemotherapy alone, Outcome 22 Hypotension.

Comparison 1 chemotherapy plus cetuximab versus chemotherapy alone, Outcome 23 Infection.
Comparison 1 chemotherapy plus cetuximab versus chemotherapy alone, Outcome 24 Infusion reaction.

Comparison 1 chemotherapy plus cetuximab versus chemotherapy alone, Outcome 25 Mucosal inflammation.

Comparison 1 chemotherapy plus cetuximab versus chemotherapy alone, Outcome 26 Nausea.

Comparison 1 chemotherapy plus cetuximab versus chemotherapy alone, Outcome 27 Pneumonia.

Comparison 1 chemotherapy plus cetuximab versus chemotherapy alone, Outcome 28 Pulmonary embolism.

Comparison 1 chemotherapy plus cetuximab versus chemotherapy alone, Outcome 29 Pyrexia.

Comparison 1 chemotherapy plus cetuximab versus chemotherapy alone, Outcome 30 Respiratory failure.

Comparison 1 chemotherapy plus cetuximab versus chemotherapy alone, Outcome 31 Sepsis.
Comparison 1 chemotherapy plus cetuximab versus chemotherapy alone, Outcome 32 Stomatitis.

Comparison 1 chemotherapy plus cetuximab versus chemotherapy alone, Outcome 33 Syncope.

Comparison 1 chemotherapy plus cetuximab versus chemotherapy alone, Outcome 34 Vomiting.

Comparison 1 chemotherapy plus cetuximab versus chemotherapy alone, Outcome 35 Anaemia.
Comparison 1 chemotherapy plus cetuximab versus chemotherapy alone, Outcome 36 Febrile neutropenia.

Comparison 1 chemotherapy plus cetuximab versus chemotherapy alone, Outcome 37 Leukopenia.

Comparison 1 chemotherapy plus cetuximab versus chemotherapy alone, Outcome 38 Thrombocytopenia.

Comparison 1 chemotherapy plus cetuximab versus chemotherapy alone, Outcome 39 Neutropenia.
| Chemotherapy plus cetuximab compared with chemotherapy alone for chemotherapy‐naive advanced non‐small cell lung cancer | ||||||
| Patient or population: Patients with advanced non‐small cell lung cancer Settings: First‐line treatment Intervention: Chemotherapy plus cetuximab Comparison: Chemotherapy | ||||||
| Outcomes | Illustrative comparative risks* (95% CI) | Relative effect | No of Participants | Quality of the evidence | Comments | |
| Assumed risk | Corresponding risk | |||||
| Chemotherapy alone | Chemotherapy plus cetuximab | |||||
| Overall survival1 | 8.9 months | 10.5 months | HR 0.87 (0.79 to 0.96) | 2018 | ⊕⊕⊕⊕ | |
| Progression‐free survival1 | 4.4 months | 4.9 months | HR 0.91 (0.83 to 1.00) | 2018 | ⊕⊕⊝⊝ | |
| One‐year survival rate2 | 40 per 100 | 45 per 100 (41 to 50) | RR 1.13 (1.02 to 1.25) | 2018 | ⊕⊕⊕⊕ | |
| Objective response rate2 | 23 per 100 | 30 per 100 (26 to 35) | RR 1.31 (1.14 to 1.51) | 2018 | ⊕⊕⊕⊝ | |
| Quality of life3 | See comment | See comment | Not estimable | 1801 | ⊕⊕⊝⊝ | Both studies reported that there were no significant differences in the change of quality of life between the two treatment arms, but no detailed data were reported |
| Serious adverse events2,4 | 1. acneiform rash: 0.3 per 100 2. hypomagnesemia: 0.8 per 100 3. infusion reaction: 1.1 per 100 4. diarrhoea: 2.3 per 100 5. hypokalaemia: 3.6 per 100 6. febrile neutropenia: 7.6 per 100 7.leukopenia: 42.7 per 100 | 1. acneiform rash: 11.2 per 100 (3.2 to 39.3) 2. hypomagnesemia: 5.3 per 100 (0.9 to 30.5) 3. infusion reaction: 3.9 per 100 (1.9 to 7.6) 4. diarrhoea: 4.8 per 100 (2.9 to 8.0) 5. hypokalaemia: 6.3 per 100 (3.7 to 10.8) 6. febrile neutropenia: 10.6 per 100 (8.4 to 13.5) 7.leukopenia: 58.1 per 100 (50.0 to 67.5) | 1. acneiform rash: RR 37.36 (10.66 to 130.95) 2. hypomagnesemia: RR 6.57 (1.13 to 38.12) 3. infusion reaction: RR 3.50 (1.76 to 6.94) 4. diarrhoea: RR 2.10 (1.26 to 3.48) 5. hypokalaemia: RR 1.74 (1.02 to 2.99) 6. febrile neutropenia: RR 1.40 (1.10 to 1.77) 7.leukopenia: RR 1.36 (1.17 to 1.58) | 1. acneiform rash: 1970 2. hypomagnesemia: 775 3. infusion reaction: 1885 4. diarrhoea: 1885 5. hypokalaemia: 1110 6. febrile neutropenia: 1755 7.leukopenia: 1755 | ⊕⊕⊝⊝ | For other adverse events, there were no significant differences between the two treatment arms |
| *The basis for the assumed risk (e.g. the median control group risk across studies) is provided in footnotes. The corresponding risk (and its 95% confidence interval) is based on the assumed risk in the comparison group and the relative effect of the intervention (and its 95% CI). | ||||||
| GRADE Working Group grades of evidence | ||||||
| 1 For time‐to‐event outcomes, e.g. overall survival, the assumed risk was obtained by calculating the median value of the "median survival time of the control arm" reported by different studies. The corresponding risk was obtained in a similar way, i.e. by calculating the median value of the "median survival time of the intervention arm" reported by different studies. 2 For dichotomous outcomes, e.g. one‐year survival rate, the assumed risk was obtained by meta‐analysis of the one‐year survival rates of control arms from all relevant studies. 3 For the assessment of quality of life: In Lynch 2010, the FACT‐LCS5 questionnaire was used; in Pirker 2009, the European Organisation for Research and Treatment of Cancer quality of life questionnaire C30 (version 3.0), EORTC lung cancer specific QLQ‐LC13, and EuroQoL (EQ‐5D) questionnaires were used. 4 The overall risk of serious adverse events was not available. Thus, specific adverse events that occurred with significantly different frequencies in the two arms were summarised instead. 5 The quality of evidence is downgraded by two factors, i.e. study limitations and imprecision, according to the guidelines of the GRADE Working Group. 6 The quality of evidence is downgraded by one factor, i.e. study limitations, according to the guidelines of the GRADE Working Group. | ||||||
| Outcome or subgroup title | No. of studies | No. of participants | Statistical method | Effect size |
| 1 Overall survival Show forest plot | 4 | Hazard Ratio (Random, 95% CI) | 0.87 [0.79, 0.96] | |
| 2 Progression‐free survival Show forest plot | 4 | Hazard Ratio (Random, 95% CI) | 0.91 [0.83, 1.00] | |
| 3 Objective response rate Show forest plot | 4 | 2018 | Risk Ratio (M‐H, Random, 95% CI) | 1.31 [1.14, 1.51] |
| 4 One‐year survival rate Show forest plot | 4 | 2018 | Risk Ratio (M‐H, Random, 95% CI) | 1.13 [1.02, 1.25] |
| 5 Abdominal pain Show forest plot | 1 | 130 | Risk Ratio (M‐H, Random, 95% CI) | 3.09 [0.13, 74.54] |
| 6 Acneiform rash Show forest plot | 4 | 1970 | Risk Ratio (M‐H, Random, 95% CI) | 37.36 [10.66, 130.95] |
| 7 Anorexia Show forest plot | 1 | 130 | Risk Ratio (M‐H, Random, 95% CI) | 9.28 [0.51, 168.90] |
| 8 Anxiety Show forest plot | 1 | 130 | Risk Ratio (M‐H, Random, 95% CI) | 1.03 [0.07, 16.14] |
| 9 Asthenia Show forest plot | 2 | 215 | Risk Ratio (M‐H, Random, 95% CI) | 2.51 [0.10, 62.68] |
| 10 Back pain Show forest plot | 1 | 130 | Risk Ratio (M‐H, Random, 95% CI) | 5.15 [0.25, 105.31] |
| 11 Bleeding events Show forest plot | 1 | 1110 | Risk Ratio (M‐H, Random, 95% CI) | 0.68 [0.31, 1.51] |
| 12 Cardiac events Show forest plot | 1 | 1110 | Risk Ratio (M‐H, Random, 95% CI) | 1.14 [0.69, 1.87] |
| 13 Constipation Show forest plot | 1 | 130 | Risk Ratio (M‐H, Random, 95% CI) | 2.06 [0.19, 22.19] |
| 14 Dehydration Show forest plot | 2 | 775 | Risk Ratio (M‐H, Random, 95% CI) | 2.20 [0.80, 6.01] |
| 15 Diarrhoea Show forest plot | 3 | 1885 | Risk Ratio (M‐H, Random, 95% CI) | 2.10 [1.26, 3.48] |
| 16 Dysphasia Show forest plot | 1 | 130 | Risk Ratio (M‐H, Random, 95% CI) | 3.09 [0.13, 74.54] |
| 17 Dyspnea Show forest plot | 3 | 1325 | Risk Ratio (M‐H, Random, 95% CI) | 2.62 [0.53, 12.96] |
| 18 Epistaxis Show forest plot | 1 | 130 | Risk Ratio (M‐H, Random, 95% CI) | 3.09 [0.33, 28.97] |
| 19 Fatigue Show forest plot | 3 | 1885 | Risk Ratio (M‐H, Random, 95% CI) | 1.29 [0.86, 1.95] |
| 20 Hypokalaemia Show forest plot | 1 | 1110 | Risk Ratio (M‐H, Random, 95% CI) | 1.74 [1.02, 2.99] |
| 21 Hypomagnesemia Show forest plot | 2 | 775 | Risk Ratio (M‐H, Random, 95% CI) | 6.57 [1.13, 38.12] |
| 22 Hypotension Show forest plot | 1 | 130 | Risk Ratio (M‐H, Random, 95% CI) | 0.34 [0.01, 8.28] |
| 23 Infection Show forest plot | 1 | 85 | Risk Ratio (M‐H, Random, 95% CI) | 3.58 [0.79, 16.27] |
| 24 Infusion reaction Show forest plot | 3 | 1885 | Risk Ratio (M‐H, Random, 95% CI) | 3.50 [1.76, 6.94] |
| 25 Mucosal inflammation Show forest plot | 1 | 130 | Risk Ratio (M‐H, Random, 95% CI) | 0.34 [0.01, 8.28] |
| 26 Nausea Show forest plot | 3 | 860 | Risk Ratio (M‐H, Random, 95% CI) | 1.24 [0.75, 2.05] |
| 27 Pneumonia Show forest plot | 1 | 130 | Risk Ratio (M‐H, Random, 95% CI) | 3.09 [0.13, 74.54] |
| 28 Pulmonary embolism Show forest plot | 1 | 1110 | Risk Ratio (M‐H, Random, 95% CI) | 1.47 [0.79, 2.76] |
| 29 Pyrexia Show forest plot | 2 | 215 | Risk Ratio (M‐H, Random, 95% CI) | 2.24 [0.88, 5.71] |
| 30 Respiratory failure Show forest plot | 1 | 1110 | Risk Ratio (M‐H, Random, 95% CI) | 1.92 [0.82, 4.50] |
| 31 Sepsis Show forest plot | 1 | 1110 | Risk Ratio (M‐H, Random, 95% CI) | 3.42 [0.95, 12.35] |
| 32 Stomatitis Show forest plot | 1 | 130 | Risk Ratio (M‐H, Random, 95% CI) | 3.09 [0.13, 74.54] |
| 33 Syncope Show forest plot | 1 | 85 | Risk Ratio (M‐H, Random, 95% CI) | 3.58 [0.79, 16.27] |
| 34 Vomiting Show forest plot | 3 | 1325 | Risk Ratio (M‐H, Random, 95% CI) | 0.98 [0.69, 1.40] |
| 35 Anaemia Show forest plot | 4 | 1970 | Risk Ratio (M‐H, Random, 95% CI) | 0.93 [0.75, 1.17] |
| 36 Febrile neutropenia Show forest plot | 2 | 1755 | Risk Ratio (M‐H, Random, 95% CI) | 1.40 [1.10, 1.77] |
| 37 Leukopenia Show forest plot | 2 | 1755 | Risk Ratio (M‐H, Random, 95% CI) | 1.36 [1.17, 1.58] |
| 38 Thrombocytopenia Show forest plot | 3 | 860 | Risk Ratio (M‐H, Random, 95% CI) | 1.26 [0.96, 1.66] |
| 39 Neutropenia Show forest plot | 3 | 1885 | Risk Ratio (M‐H, Random, 95% CI) | 1.05 [0.97, 1.15] |