Sistemas de comunicación telefónica automatizados para la prevención de la salud y el tratamiento de enfermedades crónicas
Resumen
Antecedentes
Los sistemas de comunicación telefónica automatizados (SCTA) pueden enviar mensajes de voz y recopilar la información relacionada con la salud de los pacientes mediante el programa de reconocimiento de voz o el teclado numérico El SCTA puede complementar o reemplazar el contacto telefónico entre los profesionales de la salud y los pacientes. Hay cuatro tipos diferentes de SCTA: unidireccional (de sentido único, comunicación de voz no interactiva), sistemas de respuesta de voz interactiva (RVI), SCTA con funciones adicionales como el acceso a un experto para solicitar asesoramiento (SCTA Plus) y SCTA multimodal, en que las llamadas son parte de una intervención de componentes múltiples.
Objetivos
Evaluar los efectos de los SCTA para la prevención de enfermedades y el tratamiento de las enfermedades crónicas en los resultados de cambio de conducta, clínicos, procedimentales, cognitivos, centrados en el paciente y adversos.
Métodos de búsqueda
Se hicieron búsquedas en 10 bases de datos electrónicas (Registro Cochrane Central de Ensayos Controlados (Cochrane Central Register of Controlled Trials); MEDLINE; Embase; PsycINFO; CINAHL; Global Health; WHOLIS; LILACS; Web of Science; y en ASSIA); en tres fuentes de literatura gris (Dissertation Abstracts, Index to Theses, Australasian Digital Theses); y en dos registros de ensayos (www.controlled‐trials.com; www.clinicaltrials.gov) para obtener artículos publicados entre 1980 y junio 2015.
Criterios de selección
Se consideraban para la inclusión los ensayos aleatorios, en grupos y cuasialeatorios, estudios controlados del tipo antes y después y de series de tiempo interrumpido que comparan las intervenciones de SCTA, con cualquier control u otro tipo de SCTA. Eran aptos los estudios realizados en todos los ámbitos, para todos los consumidores/ciudadores, en cualquier situación de tratamiento de enfermedad crónica o de prevención de la salud.
Obtención y análisis de los datos
Se utilizaron los métodos Cochrane estándar para seleccionar y extraer datos y evaluar los estudios elegibles.
Resultados principales
Se incluyeron 132 ensayos (N = 4 669 689). Los estudios comprendieron diversas áreas clínicas, que evalúan muchas comparaciones basadas en la evaluación de diferentes tipos de SCTA y grupos de comparación variables. En 41 estudios se evaluaron los SCTA para la prevención de la salud, 84 para el tratamiento de enfermedades crónicas, y siete para los recordatorios de citas. Disminuyó la confiabilidad en las pruebas sobre todo debido al riesgo de sesgo para muchos resultados. Se consideró el riesgo de sesgo de los procesos de asignación como bajo para casi la mitad de los estudios y poco claro para el resto. Se consideró que el riesgo de realización o de detección en la mayoría de los estudios era poco claro debido al cegamiento, mientras que sólo en un 16% de los estudios el riesgo fue bajo. En general, se consideró incierto el riesgo de sesgo debido a los datos faltantes y al informe de resultado selectivo.
Para la prevención de la salud, los SCTA (SCTA Plus, RVI, unidireccional) quizás aumenten la vacunación en los niños (cociente de riesgos [CR] 1,25; intervalo de confianza [IC] del 95%: 1,18 a 1,32; cinco estudios, N = 10 454; confiabilidad moderada) y en menor grado en los adolescentes (CR 1,06; IC del 95%: 1,02 a 1,11; dos estudios, N = 5725; confiabilidad moderada). Los efectos de los SCTA en adultos están poco claros (CR 2,18; IC del 95%: 0,53 a 9,02; dos estudios, N = 1743; baja confiabilidad).
Para el cribado, los SCTA multimodales aumentan el uso de pruebas de detección para el cáncer de mama (CR 2,17; IC del 95%: 1,55 a 3,04; dos estudios, N = 462; alta confiabilidad) y el cáncer colorrectal (CCR) (CR 2,19; IC del 95%: 1,88 a 2,55; tres estudios, N = 1013; alta confiabilidad) versus la atención habitual. También puede aumentar el cribado de la osteoporosis. Las intervenciones de SCTA Plus quizás aumenten levemente el cribado del cáncer de cuello de útero (certidumbre moderada), pero los efectos sobre el cribado de la osteoporosis son inciertos. Los sistemas de RVI quizás aumenten el cribado de CCR a los seis meses (CR 1,36; IC del 95%: 1,25 a 1,48; dos estudios, N = 16 915; confiabilidad moderada) pero no a los 9 a 12 meses, con probablemente poco o ningún efecto de RVI (CR 1,05; IC del 95%: 0,99; 1,11; dos estudios, 2599 participantes; confiabilidad moderada) o el SCTA unidireccional en el cribado del cáncer de mama.
Los recordatorios de citas entregados a través de RVI o SCTA unidireccionales pueden mejorar las tasas de asistencia comparadas con ninguna llamada (certidumbre baja). Para el tratamiento a largo plazo, la medicación o la adherencia a las pruebas de laboratorio aportaron las pruebas más generales de las enfermedades (25 estudios, datos no combinados). Los SCTA multimodales versus la atención habitual mostraron efectos contradictorios (positivos e inciertos) sobre la adherencia a la medicación. El SCTA Plus quizás levemente (versus control; confiabilidad moderada) o probablemente (versus la atención habitual; confiabilidad moderada) mejore la adherencia a la medicación pero puede tener un efecto pequeño sobre la adherencia a las pruebas (versus control). El RVI quizás mejore levemente la adherencia a la medicación versus el control (certidumbre moderada). Comparado con atención habitual, el RVI quizás mejore la adherencia a las pruebas y aumente levemente la adherencia a la medicación hasta seis meses pero tiene poco o ningún efecto a más largo plazo (certidumbre moderada). El SCTA unidireccional, comparado con el control, puede tener poco efecto o mejorar levemente la adherencia a la medicación (certidumbre baja). Las pruebas indicaron poco o ningún efecto consistente de cualquier tipo de SCTA sobre los resultados clínicos (control de la presión arterial, lípidos en sangre, control del asma, cobertura terapéutica) relacionados con la adherencia, pero sólo un reducido número de estudios aportó datos clínicos de resultados.
Los resultados anteriores se centran en las áreas con los resultados más generales de las enfermedades. En áreas de enfermedades específicas, variaron los efectos de los SCTA, incluido por el tipo de intervención de SCTA en uso.
Los SCTA multimodales quizás reduzcan tanto el dolor por cáncer como el dolor crónico así como la depresión (certidumbre moderada), pero otros tipos de SCTA fueron menos efectivos. Según el tipo de intervención, los SCTA pueden tener efectos pequeños sobre los resultados para la actividad física, el tratamiento del peso, el consumo de alcohol y la diabetes mellitus. Los SCTA tienen poco o ningún efecto sobre los resultados relacionados con la insuficiencia cardíaca, la hipertensión, la salud mental o el abandono del hábito de fumar, y hay pruebas insuficientes para determinar los efectos para prevenir el abuso de sustancias/alcohol o el tratamiento de la drogadicción, el asma, la enfermedad pulmonar obstructiva crónica, la infección por VIH/SIDA, la hipercolesterolemia, la apnea obstructiva del sueño, la disfunción de la médula espinal o el estrés psicológico en las ciudadores.
Sólo cuatro ensayos (3%) informaron los eventos adversos, y estaba poco claro si estaban relacionados con las intervenciones.
Conclusiones de los autores
Las intervenciones de SCTA pueden cambiar la conducta de los pacientes en cuanto a su salud, mejorar los resultados clínicos y aumentar el cuidado de la salud, con efectos positivos en varias áreas importantes, incluida la vacunación, el cribado, la asistencia a citas médicas y la adherencia a los fármacos o las pruebas. La decisión de integrar las intervenciones de SCTA en la asistencia sanitaria de rutina debe reflejar las variaciones en la certidumbre de las pruebas disponibles y el tamaño de los efectos en distintas enfermedades, junto con la naturaleza diversa de las intervenciones de SCTA evaluadas. La investigación futura debe investigar tanto el contenido de las intervenciones de SCTA como la modalidad de las mismas; las experiencias de los usuarios, en particular con respecto a la aceptabilidad; y aclarar qué tipos de SCTA son más efectivos y rentables.
PICO
Resumen en términos sencillos
Sistemas de comunicación telefónica automatizados para la prevención de enfermedades y el tratamiento de enfermedades crónicas
Antecedentes
Los sistemas de comunicación telefónica automatizados (SCTA) envían mensajes de voz y recopilan la información relacionada con la salud de los pacientes mediante el programa de reconocimiento de voz o el teclado numérico. Esto podría reemplazar o complementar el contacto telefónico entre los profesionales de la salud y los pacientes. Se distinguen varios tipos de SCTA: mensajes de voz de sentido único a los pacientes (unidireccional), sistemas de respuesta de voz interactiva (RVI), los que presentan funciones adicionales como la derivación para el asesoramiento (SCTA Plus) y los que tienen el SCTA como parte de una intervención de componentes múltiples (multimodal).
Pregunta de la revisión
Esta revisión evaluó la efectividad de los SCTA para prevenir las enfermedades y el tratamiento de enfermedades crónicas.
Resultados
Se encontraron 132 ensayos con más de 4 millones de participantes en áreas de prevención de la salud y para el tratamiento de enfermedades crónicas.
Los estudios compararon los tipos de SCTA de muchas maneras.
Algunos estudios informaron los resultados en cuanto a las enfermedades. Para la prevención, los SCTA quizás aumenten la vacunación en los niños, y levemente en los adolescentes, aunque los efectos en adultos son inciertos. También para la prevención, los SCTA multimodales aumentan el número personas sometidas a cribado para el cáncer de mama o colorrectal y puede aumentar el cribado de la osteoporosis. El SCTA Plus quizás aumente levemente la asistencia para el cribado de cáncer de cuello de útero, con efectos inciertos sobre el cribado de la osteoporosis. El RVI quizás aumente el número cribado para el cáncer colorrectal hasta los seis meses, con poco efecto sobre el cribado del cáncer de mama.
Los SCTA (unidireccional o RVI) pueden mejorar la asistencia a las citas, elemento fundamental tanto para la prevención como para el tratamiento de las enfermedades.
Para el tratamiento a largo plazo, los SCTA multimodales tuvieron efectos inconsistentes sobre la adherencia a la medicación. La SCTA Plus quizás mejore la adherencia a la medicación versus la atención habitual. En comparación con el control, el SCTA Plus y el RVI quizás mejore levemente la adherencia, aunque el SCTA unidireccional puede tener pocos efectos o efectos ligeramente positivos. Ninguna intervención mejoró consistentemente los resultados clínicos. El RVI quizás mejore la adherencia a las pruebas, pero el SCTA Plus puede tener un efecto menor.
Los SCTA también se usaron en enfermedades específicas. Los efectos variaron según la enfermedad y el tipo de SCTA. Los SCTA multimodales, pero no otros tipos de SCTA, quizás reduzcan el dolor por cáncer y el dolor crónico. Los resultados pueden mejorar en pequeño grado cuando los SCTA se aplican a la actividad física, el tratamiento del peso, el consumo de alcohol y la diabetes. Sin embargo, hay pocos o ningún efecto en la insuficiencia cardíaca, la hipertensión, la salud mental o el abandono del hábito de fumar. No hay pruebas suficientes para establecer los efectos de los SCTA en varias áreas (abuso de sustancias/alcohol, adicciones, asma, enfermedad pulmonar obstructiva crónica, infección por el VIH/SIDA, colesterol alto, apnea obstructiva del sueño, disfunción de la médula espinal, estrés psicológico de los ciudadores).
Solamente cuatro ensayos informaron eventos adversos. Varió la certidumbre en las pruebas (alta a muy baja) y a menudo se disminuyó debido a las limitaciones de los estudios, lo que indica que la investigación adicional puede cambiar algunos resultados.
Conclusión
Los SCTA puede ser alentadores para cambiar las conductas en salud, mejorar los resultados de salud y aumentar el cuidado de la salud.
Conclusiones de los autores
Summary of findings
| ATCS versus control on immunisation rates | ||||||
| Patient or population: participants at risk of under‐immunisation (children, adolescents and adults) Comparison: no intervention, usual care or health information (letter) | ||||||
| Outcomes | Illustrative comparative risks* (95% CI) | Relative effect | No of participants | Quality of the evidence | Comments | |
| Assumed risk | Corresponding risk | |||||
| Control | ATCS | |||||
| Behavioural outcome: immunisation rate ATCS Plus, IVR, unidirectional versus no calls, letters, usual care at median follow‐up of 4 months | Study populationa: children Comparator: no intervention | RR 1.25 (1.18 to 1.32) | 10,454 | ⊕⊕⊕⊝ | Franzini 2000 (N = 1138) reported that compared with controls (no calls), unidirectional ATCS (autodialer) may increase immunisation rates in children (86% versus 64%, low certainty).d | |
| 308 per 1000 | 385 per 1000 | |||||
| Moderateb | ||||||
| 373 per 1000 | 466 per 1000 | |||||
| Behavioural outcome: immunisation rate Unidirectional ATCS versus usual care at median follow‐up of 15 months | Study populationa: adolescents Comparator: usual care | RR 1.06 | 5725 | ⊕⊕⊕⊝ | Szilagyi 2013 (N = 4115) also reported that unidirectional ATCS probably slightly improves the uptake of preventive care visits, compared with usual care (63% ATCS versus 59% usual care; moderate certainty evidencef). | |
| 543 per 1000 | 576 per 1000 | |||||
| Moderateb | ||||||
| 540 per 1000 | 572 per 1000 | |||||
| Behavioural outcome: immunisation rate Unidirectional ATCS versus no calls or health information at median follow‐up of 2.5 months | Study populationa: adults Comparator: no calls or health information | RR 2.18 (0.53 to 9.02) | 1743 | ⊕⊝⊝⊝ | — | |
| 10 per 1000 | 21 per 1000 | |||||
| Moderateb | ||||||
| 66 per 1000 | 144 per 1000 | |||||
| Adverse outcome: unintended adverse events attributable to the intervention ATCS+, IVR, unidirectional versus various controls | No studies reported adverse events. | |||||
| *The basis for the assumed risk (e.g. the median control group risk across studies) is provided in footnotes. The corresponding risk (and its 95% confidence interval) is based on the assumed risk in the comparison group and the relative effect of the intervention (and its 95% CI). ATCS Plus: automated telephone communication systems with additional functions; ATCS: automated telephone communication systems; CI: confidence interval; IVR: interactive voice response; RR: risk ratio; unidirectional ATCS enable non‐interactive voice communication and use one‐way transmission of information or reminders. | ||||||
| GRADE Working Group grades of evidence | ||||||
| aThe assumed risk represents the mean control group risk across studies (calculated by GRADEPro). | ||||||
| ATCS versus control on physical activity levels | |||
| Patient or population: participants at risk of developing long‐term conditions Settings: various settings Intervention: ATCS (multimodal/complex intervention, ATCS+, IVR) Comparison: no intervention, usual care, or IVR | |||
| Outcomes | Effect of intervention a | No of participants | Quality of the evidence |
| Behavioural outcome: physical activity Multimodal/complex interventionb versus no calls | The intervention may slightly improve the frequency of walks. | 181 (1 study) | ⊕⊕⊝⊝ Lowc |
| Behavioural outcome: physical activity, 12 months Multimodal/complex interventiond versus usual care | The intervention probably has mixed effects on gait speeds, little effect on functional outcomes (moderate certaintye) and may slightly increase physical activity levels (low certaintyf). | 700 (2 studies) | — |
| Behavioural outcome: physical activity ATCS Plus versus IVR control | 2 studies reported that ATCS Plus intervention may have little or no effect on different indices of physical activity. | 369 (2 studies) | ⊕⊕⊝⊝ Lowc |
| Behavioural outcome: physical activity IVR versus usual care, control or health education | 3 studies reported that IVR interventions may slightly improve several indices of physical activity (muscle strength, balance, moderate to vigorous physical activity) but may have little or no effect on others (physical activity levels, walking distance). | 216 (3 studies) | ⊕⊕⊝⊝ Lowg |
| Clinical outcome: metabolic markers, 12 months Multimodal/complex interventiond versus usual care | The intervention may have little or no effect on glycated haemoglobin, fasting insulin and glucose levels. | 302 (1 study) | ⊕⊕⊝⊝ Lowf |
| Clinical outcome: body weight measures Multimodal/complex interventiond ATCS Plus versus usual care or control | ATCS Plus intervention may have little or no effect on BMI, weight, waist or waist‐hip ratio, compared with control (71 participants; low certainty evidencec). Multimodal/complex intervention may have little or no effect on BMI, waist circumference or physical function, compared with usual care (302 participants; low certainty evidencef). | 373 (2 studies) | ⊕⊕⊝⊝ Low |
| Adverse outcome: unintended adverse events attributable to the intervention Multimodal/complex intervention, ATCS Plus, IVR versus various controls | No studies reported adverse events. | — | — |
| GRADE Working Group grades of evidence | |||
| ATCS: automated telephone communication systems; ATCS Plus: automated telephone communication systems with additional functions; IVR: interactive voice response. | |||
| aThe findings presented are based on a narrative summary and synthesis of results that were not amenable to statistical analysis; please see Effects of interventions for detailed findings. | |||
| ATCS versus control on screening rates | ||||||
| Patient or population: participants at risk for breast, colorectal or cervical cancer; or osteoporosis Settings: primary, secondary and tertiary care Intervention: ATCS (multimodal/complex intervention, ATCS Plus, IVR, unidirectional) Comparison: usual care, enhanced usual care or no intervention | ||||||
| Outcomes | Illustrative comparative risks* (95% CI) | Relative effect | No of participants | Quality of the evidence | Comments | |
| Assumed risk | Corresponding risk | |||||
| Usual care or enhanced usual care or no intervention | ATCS | |||||
| Behavioural outcome: breast cancer screening Multimodal/complex intervention versus usual care at 12 months follow‐up | Study populationa | RR 2.17 | 462 | ⊕⊕⊕⊕ | — | |
| 167 per 1000 | 363 per 1000 | |||||
| Moderateb | ||||||
| 167 per 1000 | 363 per 1000 | |||||
| Behavioural outcome: breast cancer screening IVR versus enhanced usual care at median follow‐up of 12 months | Study populationa | RR 1.05 | 2599 | ⊕⊕⊕⊝ | Unidirectional ATCS versus letter 1 further study (Fortuna 2014) (N = 1008) found that unidirectional ATCS (plus letter) probably has little or no effect on breast cancer screening rates at 12 months, adjusted OR 1.3 (95% CI 0.7 to 2.4; moderate certaintyd). | |
| 585 per 1000 | 614 per 1000 | |||||
| Moderateb | ||||||
| 432 per 1000 | 454 per 1000 | |||||
| Behavioural outcome: colorectal cancer screening Multimodal/complex intervention versus usual care at median follow‐up of 12 months | Study populationa | RR 2.19 | 1013 | ⊕⊕⊕⊕ | — | |
| 249 per 1000 | 545 per 1000 | |||||
| Moderateb | ||||||
| 167 per 1000 | 366 per 1000 | |||||
| Behavioural outcome: colorectal cancer screening IVR versus usual care at 6‐month follow‐up | Study populationa | RR 1.36 | 16915 | ⊕⊕⊕⊝ | IVR versus control 1 other study (Durant 2014) (N = 47,097) reported that IVR probably increases screening, with 1773 participants from the IVR group and 100 from the no‐call control group completing colorectal cancer screening within 3 months (moderate certaintyf). IVR versus usual care 1 study (Mosen 2010) (N = 6000) also reported that IVR probably increases completion of any colorectal cancer screening (moderate certaintyg). | |
| 119 per 1000 | 161 per 1000 | |||||
| Moderateb | ||||||
| 119 per 1000 | 162 per 1000 | |||||
| Behavioural outcome: colorectal cancer screening IVR, unidirectional ATCS versus usual care or letter at longer (9‐12 months) follow‐up | Study populationa | RR 1.01 | 21,335 | ⊕⊕⊕⊝ | IVR versus usual care 1 study (Simon 2010a) (N = 20,000) also reported that IVR probably increases slightly colorectal cancer screening via colonoscopy (moderate certaintyi). Unidirectional ATCS versus letter 1 further study (Fortuna 2014) (N = 1008) at 12 months found that unidirectional ATCS (plus letter) has probably little or no effect on colorectal cancer screening rates at 12 months (15.3% versus 12.2%; adjusted OR 1.2; 95% CI 0.6 to 2.4; moderate certaintyd). | |
| 302 per 1000 | 305 per 1000 | |||||
| Moderateb | ||||||
| 245 per 1000 | 247 per 1000 | |||||
| Behavioural outcome: cervical cancer screening ATCS Plus versus control (no calls) at 3 month follow‐up | See comment | See comment | Not estimable | 75,532 (1 study) | ⊕⊕⊕⊝ | Corkrey 2005 found that ATCS Plus intervention probably slightly improves cervical cancer screening rates at 3 months. |
| Adverse outcome: unintended adverse events attributable to the intervention Multimodal/complex intervention, ATCS Plus, IVR, unidirectional versus various controls | No studies reported adverse events. | |||||
| *The basis for the assumed risk (e.g. the median control group risk across studies) is provided in footnotes. The corresponding risk (and its 95% confidence interval) is based on the assumed risk in the comparison group and the relative effect of the intervention (and its 95% CI). | ||||||
| GRADE Working Group grades of evidence | ||||||
| aThe assumed risk represents the mean control group risk across studies (calculated by GRADEPro). | ||||||
| ATCS versus control for body weight | ||||||
| Patient or population: overweight or obese individuals (both children and adults) Comparison: usual care, no intervention or control | ||||||
| Outcomes | Illustrative comparative risks* (95% CI) | Relative effect | No of participants | Quality of the evidence | Commentsa | |
| Assumed risk | Corresponding risk | |||||
| Controls | ATCS | |||||
| Clinical and behavioural outcome: BMI score in adults Multimodal/complex intervention, ATCS Plus or IVR versus usual care at median follow‐up of 18 months | The mean BMI in the control groups was 34.7 kg/m2 | The mean BMI of adults in the intervention groups was 0.64 kg/m2lower | Not estimable | 672 | ⊕⊕⊝⊝ | ATCS Plus versus control Vance 2011 (N = 140) found that ATCS Plus may reduce slightly BMI (low certainty evidencec). |
| Clinical and behavioural outcome: body weight in adults, 12 weeks | See comment | See comment | Not estimable | See comment | See comment | ATCS Plus versus control Vance 2011 (N = 140) found that ATCS Plus may reduce slightly body weight and waist circumference (low certainty evidencec). IVR versus control Estabrooks 2008 (N = 77) reported that IVR may have little or no effect on body weight (percent lost or change in) (low certainty evidenced). |
| Clinical and behavioural outcome: body weight in adults, at median follow‐up of 18 months | See comment | See comment | Not estimable | See comment | See comment | ATCS (multimodal/complex intervention, ATCS Plus, IVR) versus usual care Bennett 2012 (N = 365) found that ATCS Plus probably slightly reduces body weight at 18 months (moderate certainty evidence).eBennett 2013 (N = 194) found that multimodal/complex intervention may reduce body weight at 18 months (low certainty evidence).f IVR versus usual care Goulis 2004 (N = 122) found that IVR probably reduces slightly body weight but probably has little or no effect on obesity assessment scores at 6 months (moderate certainty evidence).f |
| Clinical and behavioural outcome: blood pressure, blood glucose, cholesterol levels | See comment | See comment | Not estimable | See comment | See comment | ATCS (ATCS Plus, IVR) versus usual care/control Bennett 2012 (N = 365) found that ATCS Plus probably has little or no effect on systolic or diastolic blood pressure at 18 months (moderate certainty evidencee). ATCS Plus versus control Vance 2011 found that ATCS Plus may slightly improve slightly systolic blood pressure and blood glucose levels at 12 weeks (low certainty evidencec). IVR versus usual care Goulis 2004 (N = 122) found that IVR probably has little or no effect on systolic or diastolic blood pressure, plasma glucose levels, or high‐density lipoprotein cholesterol, but it probably slightly reduces total cholesterol and triglyceride levels at 6 months (moderate certainty evidence).e |
| Clinical outcome: BMI z‐score in children at median follow‐up of 7.5 months | See comment | See comment | Not estimable | See comment | ⊕⊕⊕⊝ | ATCS Plus versus control Estabrooks 2009 (N = 220) found that ATCS Plus has probably little or no effect on BMI z‐scores in children at 12 months. IVR versus control Wright 2013 (N = 100) found that IVR has probably little or no effect on BMI z‐scores in children at 3 months. |
| Behavioural outcome: physical activity, dietary habits in children at median follow‐up of 7.5 months | See comment | See comment | Not estimable | See comment | ⊕⊕⊕⊝ | ATCS Plus versus control Estabrooks 2009 (N = 220) found that ATCS Plus has probably little or no effect on self‐reported physical activity, sedentary behaviours or dietary habits at 12 months. IVR versus control (no calls) Wright 2013 (N = 100) found that IVR has probably little or no effect on total caloric intake, fruit intake, or sedentary behaviours at 3 months. |
| Adverse outcome: unintended adverse events attributable to the intervention IVR versus usual care | See comment | See comment | See comment | 559 (2 studies) | See comment | Bennett 2012 (N = 365) reported 1 serious musculoskeletal injury in the intervention group and 3 events (1 cardiovascular and 2 cases of gallbladder disease) in the usual care group (moderate certainty evidence).e,g Bennett 2013 (N = 194) reported 6 serious adverse events in the intervention arm, including gynaecological surgery in 2 participants and knee replacement, breast abscess, musculoskeletal injury, and cancer diagnosis in 1 participant each; all participants except the one with the cancer diagnosis required hospitalisation (low certainty evidence).f,g |
| *The corresponding risk (and its 95% confidence interval) is based on the assumed risk in the comparison group and the relative effect of the intervention (and its 95% CI). ATCS: automated telephone communication systems; ATCS Plus: automated telephone communication systems with additional functions; BMI: body Mass Index; CI: confidence interval; IVR: interactive voice response; SMD: Standardised mean difference. | ||||||
| GRADE Working Group grades of evidence | ||||||
| aAdditional findings presented are based on a narrative summary and synthesis of results that were not amenable to statistical analysis; please see Effects of interventions for detailed findings. | ||||||
| ATCS versus control as appointment reminders (reducing non‐attendance rates) | |||
| Patient or population: patients/healthcare consumers Comparison: no intervention (calls) or nurse‐delivered calls | |||
| Outcomes | Effect of interventiona | No of participants (studies) | Quality of the evidence |
| Health behaviour: attendance rates, 6 weeks ATCS Plus versus nurse‐delivered calls | ATCS Plus calls delivered 3 or 7 days prior to flexible sigmoidoscopy or/and colonoscopy examinations probably have little or no effect on appointment non‐attendance or preparation non‐adherence. | 3610 (1 study) | ⊕⊕⊕⊝ |
| Health behaviour: attendance rates, 4 months IVR versus no calls | IVR improves attendance rates: OR 1.52 (95% CI 1.34 to 1.71). | 12,092 (1 study) | ⊕⊕⊕⊕ High |
| Health behaviour: return tuberculin test rate, 3 days Unidirectional ATCS versus no calls | Unidirectional ATCS may improve test return rates. | 701 (1 study) | ⊕⊕⊝⊝ |
| Health behaviour: attendance rates, 1 month Unidirectional ATCS versus no calls | Undirectional ATCS may improve attendance rates RR 1.60 (95% CI 1.29 to 1.98). | 517 (1 study) | ⊕⊕⊝⊝ |
| Health behaviour: attendance rates, 6‐8 weeks Unidirectional ATCS versus no calls | 2 studies reported conflicting results: Reekie 1998 (N = 1000) reported that unidirectional ATCS probably decrease non‐attendance rates at 6 weeks; while Maxwell 2001 (N = 2304) reported the interventions probably have little or no effect at 2 months. | 3304 (2 studies) | ⊕⊕⊕⊝ |
| Health behaviour: attendance rates, 6 months Unidirectional ATCS versus no calls | Unidirectional ATCS may improve attendance: OR 1.50 (P < 0.01). | 2008 (1 study) | ⊕⊕⊝⊝ |
| Adverse outcome: unintended adverse events attributable to the intervention ATCS Plus, IVR, unidirectional ATCS versus various controls | No studies reported adverse events. | ||
| ATCS: automated telephone communication systems; ATCS Plus: automated telephone communication systems with additional functions; CI: confidence interval; IVR: interactive voice response; OR: odds ratio; RR: risk ratio. | |||
| GRADE Working Group grades of evidence | |||
| aThe findings presented are based on a narrative summary and synthesis of results, many of which were not amenable to statistical analysis; please see Effects of interventions for detailed findings. | |||
| ATCS versus control for adherence to medication or laboratory tests | ||||
| Patient or population: patients with various conditions or at risk of low adherence to medication or laboratory tests Settings: various settings Intervention: ATCS (multimodal/complex intervention, ATCS Plus, IVR, unidirectional ATCS) Comparison: usual care, no calls, controls (other ATCS) | ||||
| Outcomes | Effect of interventionsa | No of participants | Quality of the evidence | Comments |
| Behavioural outcome: adherence to medication Multimodal/complex interventionsb versus usual care or control | The effects of multimodal/complex interventions are inconclusive. | 888 (2 studies) | See comment | Ho 2014 (N = 241) reported that the multimodal/complex intervention probably improves adherence to cardioprotective medications at 12 months (moderate certaintyc). Stuart 2003 (N = 647) found uncertain effects of the intervention on adherence to antidepressant medications (very low certaintyc,d). |
| Behavioural outcome: adherence to medication ATCS Plus versus control or single IVR call | Results suggest that ATCS Plus probably slightly improve measures of adherence. | 2340 (2 studies) | See comment | Cvietusa 2012 (N = 1393) reported that ATCS Plus, compared with control, probably improves time to first inhaled corticosteroid refill and probably slightly improves the proportion of days with medication on hand in children (moderate certaintye). Stacy 2009 (N = 947) reported that ATCS Plus probably slightly improves statin adherence at 6 months, compared with a single IVR call (moderate certaintyf). |
| Behavioural outcome: adherence to laboratory tests ATCS Plus or IVR versus no intervention or usual care | Results suggest that ATCS Plus probably has little or no effect on adherence to testing, while IVR probably improves test completion. | 15,218 (3 studies) | See comment | ATCS Plus versus no intervention Derose 2009 (N = 13,057) found that ATCS Plus probably has little or no effect on adherence to testing (completion of all 3 recommended laboratory tests for diabetes patients) at 12 weeks (moderate certaintyg). Simon 2010b (N = 1200) found that these interventions probably have little or no effect on retinopathy examination rates or tests for glycaemia, hyperlipidaemia or nephropathy in diabetic patients at 12 months (moderate certaintyh). IVR versus usual care Feldstein 2006 (N = 961) found that IVR probably improves patients' completion of all recommended laboratory tests at 25 days follow‐up (moderate certaintyi). |
| Behavioural outcome: adherence to medication or composite outcome (medication adherence and rate of adverse events) ATCS Plus versus usual care | Results indicate that ATCS Plus probably improves medication adherence and may slightly improve a composite measure. | 35,816 (4 studies) | See comment | 2 studies (Derose 2013 (N = 5216) and Vollmer 2014 (N = 21,752)) reported that ATCS Plus probably improves adherence to statins to some extent. Vollmer 2011 (N = 8517) found that ATCS Plus probably slightly improves adherence to inhaled corticosteroids (moderate certaintyj). Sherrard 2009 (N = 331) found that ATCS Plus may slightly improve a composite measure of medication adherence and adverse events at 6 months follow‐up (low certaintyc,k). |
| Behavioural outcome: adherence to medication or laboratory tests IVR versus control | Results suggest that IVR probably improves slightly medication adherence. | 4,238,362 (4 studies) | See comment | Adams 2014 (N = 475) found that IVR may slightly improve comprehensiveness of screening and counselling (low certaintyc,l). Bender 2010 (N = 50) reported that IVR may improve adherence to anti‐asthmatic medications at 2.5 months follow‐up (low certaintyc,e). Leirer 1991 (N = 16) reported that IVR may slightly reduce medication non‐adherence (low certaintym). Mu 2013 (N = 4,237,821) found that IVR probably slightly improves medication refill rates at 1 month (moderate certaintyn). |
| Behavioural outcome: adherence to medication IVR versus usual care | Results indicate that IVR probably slightly improves some measures of medication adherence. | 56,140 (8 studies) | See comment | 2 studies (Boland 2014 (N = 70); Friedman 1996 (N = 267)) reported that IVR probably slightly improves adherence to glaucoma and anti‐hypertensive medications at 3 and 6 months respectively (moderate certainty).o 2 further studies (Glanz 2012 (N = 312); Migneault 2012 (N = 337)) reported that IVR has probably little or no effect on medication adherence at 8 and 12 months, respectively (moderate certainty).p 2 studies (Green 2011 (N = 8306); Reynolds 2011 (N = 30,610)) assessed adherence via refill rates, reporting that IVR probably slightly improves medication refill rates at 2 weeks (moderate certainty).q 2 further studies reported medication adherence assessed by medication possession ratio (MPR) at different time points. Patel 2007 (N = 15,051) found that IVR probably slightly improves MPR at 3 to 6 months, while Bender 2014 (N = 1187) reported that IVR probably improves MPR at 24 months (both studies of moderate certaintyr). |
| Behavioural outcome: adherence to medication Unidirectional ATCS versus control | Results suggest that unidirectional ATCS may have little effect, or improve medication adherence to a small degree. | 107 (2 studies) | See comment | 2 studies (Lim 2013 (N = 80); Ownby 2012 (N = 27)) reported that the intervention may have little effect or slightly improve medication adherence (low certaintys). |
| Clinical outcome: blood pressure Multimodal/complex, ATCS Plus, IVR versus usual care | Results suggest that ATCS Plus probably slightly reduces blood pressure, while multimodal/complex or IVR interventions probably have little or no effect on blood pressure. | 22,597 (3 studies) | See comment | Multimodal/complex intervention versus usual care Ho 2014 (N = 241) reported that multimodal intervention probably has little or no effect on achieving reduced blood pressure targets (moderate certaintyc). ATCS Plus versus usual care Vollmer 2014 (N = 21,752) reported that ATCS Plus probably slightly reduces systolic blood pressure (moderate certaintyt). IVR versus usual care Migneault 2012 (N = 337) reported that IVR probably has little or no effect on systolic or diastolic blood pressure (moderate certaintyc), while Friedman 1996 (N = 267) found that IVR may have little or no effect on systolic blood pressure but may slightly decrease diastolic blood pressure (low certaintyc,f). |
| Adverse outcome: unintended adverse events attributable to the intervention Multimodal/complex intervention, ATCS Plus, IVR, unidirectional versus various controls | No studies reported adverse events. | |||
| ATCS Plus: automated telephone communication systems with additional functions; CI: confidence interval; HR: hazard ratio; IVR: interactive voice response; MPR: medication possession ratio; OR: odds ratio; RR: risk ratio; SD: standard deviation | ||||
| GRADE Working Group grades of evidence | ||||
| aMultimodal intervention included ATCS Plus, medication reconciliation and tailoring, patient education and collaborative care in Ho 2014; and education, nurse‐delivered call and IVR in Stuart 2003. | ||||
| ATCS versus control on alcohol consumption | |||
| Patient or population: participants addicted to alcohol Settings: various settings Intervention: ATCS (ATCS Plus, IVR) Comparison: no intervention, usual care, advice/education or packaged CBT | |||
| Outcomes | Effect of interventiona | No of participants | Quality of the evidence |
| Behavioural outcomes: number of drinks per drinking day ATCS Plus, IVR versus usual care, (various) controls at median follow‐up of 2 months | ATCS Plus versus usual care Rose 2015 (N = 158) reported that ATCS Plus may have little or no effect on the number of drinks per drinking day at 2 months (low certaintyb,c). ATCS Plus versus control (advice/education) Hasin 2013 (N = 254) found that ATCS Plus may reduce the number of drinks per drinking day in the last 30 days at 2 months (low certaintyb,c), but it may have little effect at 12 months. IVR versus control (information) Rubin 2012 (N = 47) reported that IVR may slightly reduce the number of drinks per drinking day at 6 months (low certaintyc,e). | 459 (3 studies) | ⊕⊕⊝⊝ |
| Behavioural outcomes: drinking days, heavy drinking days, or total number of drinks consumed ATCS Plus, IVR versus (various) controls | ATCS Plus versus no intervention Mundt 2006 (N = 60) found that ATCS Plus may have little or no effect on drinking days, heavy drinking days, or total number of drinks consumed (low certaintyc,f). ATCS Plus versus control (packaged CBT) Litt 2009 (N = 110) found that ATCS Plus may have little or no effect on the number of heavy drinking days at 12 weeks posttreatment (low certaintyc,g). IVR versus control (information) Rubin 2012 (N = 47) reported that IVR may slightly reduce the number of heavy drinking days per month at 6 months (low certaintyc,e). | 217 (3 studies) | ⊕⊕⊝⊝ |
| Behavioural outcomes: proportion of days abstinent, other alcohol consumption indices, 12 weeks ATCS Plus versus control (packaged CBT) | ATCS Plus may slightly reduce the proportion of days abstinent but have little or no effect on coping or drinking problems or continuity of abstinence (Litt 2009). | 110 (1 study) | ⊕⊕⊝⊝ |
| Behavioural outcomes: weekly alcohol consumption, 6 months ATCS Plus versus usual care | ATCS Plus may have little or no effect on weekly alcohol consumption (Helzer 2008). | 338 (1 study) | ⊕⊕⊝⊝ |
| Behavioural outcomes: AUDIT score, 6 weeks IVR versus control (no intervention) | IVR probably improve slightly AUDIT scores (Andersson 2012). | 1423 (1 study) | ⊕⊕⊕⊝ |
| Behavioural outcomes: other alcohol consumption indices, 4 weeks IVR versus control (no intervention) | IVR may have little or no effect on drinking habits, alcohol craving, or PTSD symptoms (Simpson 2005). | 98 (1 study) | ⊕⊕⊝⊝ |
| Adverse outcome: unintended adverse events attributable to the intervention ATCS Plus, IVR versus various controls | No studies reported adverse events. | ||
| ATCS Plus: automated telephone communication systems with additional functions; AUDIT: Alcohol Use Disorders Identification Test; CBT: cognitive behavioural therapy; IVR: interactive voice response; PTSD: post‐traumatic stress disorder. | |||
| GRADE Working Group grades of evidence | |||
| aThe findings presented in this table are based on a narrative summary and synthesis of results that were not amenable to statistical analysis; please see Effects of interventions for detailed findings. | |||
| ATCS versus control on severity of cancer symptoms | ||||
| Patient or population: cancer patients Settings: various settings Intervention: ATCS (multimodal/complex intervention, ATCS Plus, IVR) Comparison: usual care, control (other ATCS, nurse‐delivered calls) | ||||
| Outcomes | Effects of interventiona | No of participants | Quality of the evidence | Comments |
| Clinical outcomes: symptoms (severity or burden) ATCS Plus versus usual care (via ATCS) or control, 4‐12 weeks | Results suggest that ATCS Plus may have little or no effect on symptom severity, distress or burden. | 701 (4 studies) | See comment | Cleeland 2011 (N = 79) found that ATCS Plus may slightly reduce symptom threshold events and cumulative distribution of symptom threshold events; and it may have little or no effect on mean symptom severity between discharge and 4 week follow‐up (low certaintyb,c). Mooney 2014 (N = 250) found that ATCS Plus probably has little or no effect on symptom severity scores at 6 week follow‐up (moderate certaintyc). Spoelstra 2013 (N = 119) found that ATCS Plus may have little or no effect on symptom severity at 10 week follow‐up (low certaintyc,d). Yount 2014 (N = 253) reported that ATCS Plus may have little or no effect on symptom burden at 12 weeks (low certaintyc,e). |
| Clinical outcomes: symptom severity, 10 weeks IVR versus nurse delivered calls | Results suggest that IVR may have little or no effect on symptom severity. | 437 (1 study) | ⊕⊕⊝⊝ | — |
| Clinical outcomes: pain Multimodal/complex interventiong versus usual care | Results indicate that multimodal intervention probably reduces pain at 3 months and probably slightly reduces pain at 12 months. | 405 (1 study) | ⊕⊕⊕⊝ | — |
| Clinical outcomes: depression Multimodal/complex interventiong versus usual care | Results indicate that multimodal intervention probably slightly reduces depression at 3 and 12 months. | 405 (1 study) | ⊕⊕⊕⊝ | — |
| Clinical outcomes:distress, 6 weeks ATCS Plus versus usual care (via IVR) | Results indicate that ATCS Plus probably has little or no effect on distress. | 250 (1 study) | ⊕⊕⊕⊝ | — |
| Behavioural outcome: medication adherence ATCS Plus versus usual care | Results indicate that ATCS Plus may have little or no effect on medication non‐adherence. | 119 (1 study) | ⊕⊕⊝⊝ | — |
| Adverse outcome: unintended adverse events attributable to the intervention Multimodal/complex intervention, ATCS Plus, IVR versus various controls | No studies reported adverse events. | |||
| ATCS: automated telephone communication systems; ATCS Plus: automated telephone communication systems with additional functions; IVR: interactive voice response. | ||||
| GRADE Working Group grades of evidence | ||||
| aThe findings presented in this table are based on a narrative summary and synthesis of results that were not amenable to statistical analysis; please see Effects of interventions for detailed findings. | ||||
| ATCS versus usual care for managing diabetes mellitus | ||||||
| Patient or population: patients with diabetes mellitus Comparison: usual care | ||||||
| Outcomes | Illustrative comparative risks* (95% CI) | Relative effect | No of Participants | Quality of the evidence | Commentsa | |
| Assumed risk | Corresponding risk | |||||
| Usual care | ATCS | |||||
| Clinical outcome: glycated haemoglobin or blood glucose ATCS Plus, IVR versus usual care at median follow‐up of 6 months | The mean glycated haemoglobin in the control groups was 8.41% | The mean glycated haemoglobin in the intervention groups was | Not estimable | 1216 | ⊕⊕⊝⊝ | ATCS Plus versus usual care 1 further study, Katalenich 2015 (N = 98), found that ATCS Plus may have little or no effect on median glycated haemoglobin levels compared with usual care at 6 months follow‐up (low certaintyc). IVR versus usual care 1 additional study, Homko 2012 (N = 80), found that IVR may have little or no effect on fasting blood glucose levels in pregnancy or infant birth weight at 26 months (low certaintyc). |
| Behavioural outcome: self‐monitoring of diabetic foot (various scales) ATCS Plus versus usual care at 12 months follow‐up | The mean self‐monitoring of diabetic foot in the control groups was 4.5 (range from 0 to 7, with higher scores indicating better foot care) | The mean self‐monitoring of diabetic foot in the intervention groups was | Not estimable | 498 | ⊕⊕⊕⊝ | — |
| Behavioural outcome: self‐monitoring of blood glucose ATCS Plus, IVR versus usual care, 6‐12 months | See comment | See comment | Not estimable | See comment | See comment | ATCS Plus versus usual care Lorig 2008 (N = 417) found that ATCS Plus may have little no effect on self‐monitoring of blood glucose at 6 months (low certainty evidencef). At 12 months, 2 studies (Piette 2001 (N = 272); Schillinger 2009 (N = 339)) reported that ATCS Plus probably slightly improves self‐monitoring of blood glucose (moderate certaintye). IVR versus usual care Graziano 2009 (N = 112) found that IVR probably slightly increases the mean change in frequency of self‐monitoring of blood glucose (moderate certainty evidenceg). |
| Behavioural outcome: medication adherence or use ATCS Plus versus usual care, 6‐12 months | See comment | See comment | Not estimable | 370 (2 studies) | See comment | Katalenich 2015 (N = 98) reported that ATCS Plus may have little or no effect on adherence rates at 6 months (low certaintyc), and Piette 2001 (N = 272) found that ATCS Plus has probably little or no effect on medication use at 12 months (moderate certaintyg. |
| Behavioural outcome: physical activity, diet, weight monitoring ATCS Plus versus usual care, 6‐12 months | See comment | See comment | Not estimable | 1028 (3 studies) | See comment | Lorig 2008 (N = 417) found that ATCS Plus may have little or no effect on aerobic exercise at 6 months (low certaintyf). Schillinger 2009 (N = 339) found that ATCS Plus may slightly improve diet and exercise and moderate intensity physical activity levels, but it may have little or no effect on vigorous intensity physical activity levels at 12 months (low certaintyc). Piette 2001 (N = 272) reported that ATCS Plus probably has little or no effect on weight monitoring (moderate certaintyg). |
| Adverse outcome: unintended adverse events attributable to the intervention ATCS Plus, IVR versus usual care | No studies were found that reported adverse events. | |||||
| The corresponding risk (and its 95% confidence interval) is based on the assumed risk in the comparison group and the relative effect of the intervention (and its 95% CI). ATCS Plus: automated telephone communication systems with additional functions; CI: confidence interval; HRQoL: health‐related quality of life; IVR: interactive voice response; SMD: standardised mean difference. | ||||||
| GRADE Working Group grades of evidence | ||||||
| aAdditional results are based on a narrative summary and synthesis of results that were not amenable to statistical analysis; please see Effects of interventions for detailed findings. | ||||||
| ATCS versus usual care for patients with heart failure | ||||||
| Patient or population: patients with heart failure Comparison: usual care or usual community care | ||||||
| Outcomes | Illustrative comparative risks* (95% CI) | Relative effect | No of participants | Quality of the evidence | Commentsa | |
| Assumed risk | Corresponding risk | |||||
| Usual care or usual community care | ATCS | |||||
| Clinical outcome: cardiac mortality ATCS Plus, IVR versus usual care or usual community care at median follow‐up of 11.5 months | Study populationb | RR 0.60 | 215 | ⊕⊝⊝⊝ | — | |
| 95 per 1000 | 57 per 1000 | |||||
| Moderatec | ||||||
| 96 per 1000 | 58 per 1000 | |||||
| Clinical outcome: all‐cause mortality ATCS Plus versus usual care or usual community care at median follow‐up of 11 months | Study populationb | RR 1 (0.79 to 1.28) | 2165 | ⊕⊕⊕⊝ | — | |
| 106 per 1000 | 106 per 1000 | |||||
| Moderatec | ||||||
| 106 per 1000 | 106 per 1000 | |||||
| Clinical outcome: heart failure hospitalisation ATCS Plus, IVR versus usual care or usual community care at median follow‐up of 11.5 months | See comment | See comment | Not estimable | 2329 (4 studies) | See comment | ATCS Plus versus usual care or usual community care Chaudhry 2010 (N = 1653) found that the intervention had little or no effect on hospitalisation for heart failure (high certainty). Krum 2013 (N = 405) also reported that there was probably little or no effect of the intervention for this same outcome (moderate certaintyg), while Capomolla 2004 (N = 133) reported that ATCS Plus may decrease hospitalisation rates for heart failure (low certaintyh). IVR versus usual care Kurtz 2011 (N = 138) reported that IVR intervention has uncertain effects on hospitalisation for heart failure (very low certaintyi). |
| Clinical outcome: all‐cause hospitalisation ATCS Plus versus usual care or usual community care | See comment | See comment | Not estimable | 2191 participants (3 studies) | See comment | ATCS Plus versus usual care Capomolla 2004 (N = 133) found that ATCS Plus may reduce all‐cause hospitalisation (for chronic heart failure, cardiac cause and other cause; low certaintyh), and Krum 2013 (N = 405) similarly reported that the intervention probably slightly decreased all‐cause hospitalisation (moderate certaintyg).fChaudhry 2010 (N = 1653) found that ATCS Plus has little or no effect on readmission for any reason (high certainty). |
| Clinical outcome: global health (well‐being) rating (7‐item questionnaire) ATCS Plus versus usual care 12 months | See comment | See comment | Not estimable | 405 participants (1 study) | ⊕⊕⊕⊝ | Krum 2013 (N = 405) reported that ATCS Plus probably increases slightly the proportion of patients with improved global health questionnaire ratings at 12 months. |
| Clinical outcome: emergency room and other health service use outcomes ATCS Plus versus usual care or usual community care | See comment | See comment | Not estimable | 1786 participants (2 studies) | See comment | Emergency room use Capomolla 2004 (N = 133) found that ATCS Plus may reduce emergency room use at (median) 11 months (low certaintyh). Other service use Chaudhry 2010 (N = 1653) found that ATCS Plus had little or no effect on number of days in hospital or number of hospitalisations (readmissions)(high certainty). |
| Adverse outcome: unintended adverse events attributable to the intervention ATCS Plus, IVR versus usual care | See comment | See comment | See comment | 1791 (2 studies) | See comment | ATCS Plus versus usual care Chaudhry 2010 (N = 1653) reported that no adverse events had occurred during the study (high certainty). IVR versus usual care Kurtz 2011 (N = 138) classified adverse events as cardiac mortality plus rehospitalisation for heart failure, reporting uncertain effects upon this composite outcome (very low certaintyi). |
| *The basis for the assumed risk (e.g. the median control group risk across studies) is provided in footnotes. The corresponding risk (and its 95% confidence interval) is based on the assumed risk in the comparison group and the relative effect of the intervention (and its 95% CI). ATCS Plus: automated telephone communication systems with additional functions; CI: confidence interval; CI: confidence interval; RR: risk ratio. | ||||||
| GRADE Working Group grades of evidence | ||||||
| aAdditional results are based on a narrative summary and synthesis of results that were not amenable to statistical analysis; please see Effects of interventions for detailed findings. | ||||||
| ATCS versus usual care for management of hypertension | |||||
| Patient or population: patients with hypertension Comparison: usual care, with and without education | |||||
| Outcomes | Illustrative comparative risks* (95% CI) | No of Participants | Quality of the evidence | Commentsa | |
| Assumed risk | Corresponding risk | ||||
| Usual care | ATCS | ||||
| Clinical outcome: systolic blood pressure (automated sphygmomanometer or electronic pressure monitor) ATCS Plus or IVR versus usual care at median follow‐up of 6 weeks | The mean systolic blood pressure in the control group was 141.1 mmHg | The mean systolic blood pressure in the intervention groups was (2.12 to 1.66 lower) | 65,256 | ⊕⊕⊕⊝ | 1 additional study (Dedier 2014) (N = 253) reported that compared with usual care plus education, IVR may have little or no effect on systolic blood pressure at 3 months (low certaintyc). |
| Clinical outcome: diastolic blood pressure (automated sphygmomanometer and electronic cuff) ATCS Plus, unidirectional versus usual care at median follow‐up of 14 weeks | The mean diastolic blood pressure in the control group was 81.2 mmHg | The mean diastolic blood pressure in the intervention groups was 0.02 mmHg higher (2.62 lower to 2.66 higher) | 65,056 | ⊕⊕⊝⊝ | — |
| Clinical outcome: blood pressure control, 26 weeks Multimodal/complex interventionf versus usual care | See comment | See comment | 166 (1 study) | ⊕⊕⊕⊝ | Bove 2013 (N = 241) found that a multimodal/complex intervention probably has little or no effect on blood pressure control. |
| Clinical outcome: Health statush, depressioni, 6 weeks ATCS Plus versus enhanced usual care (plus information) | See comment | See comment | 200 (1 study) | ⊕⊕⊝⊝ | Piette 2012 (N = 200) found that ATCS Plus may slightly improve health status and may decrease depressive symptoms. |
| Behavioural outcome: medication use Multimodal/complexk, ATCS Plus versus usual care or enhanced usual care (plus information) | See comment | See comment | 483 (2 studies) | ⊕⊕⊝⊝ | Multimodal/complex versus usual care Magid 2011 (N = 283) found that multimodal/complex intervention may have little or no effect on medication adherence assessed by Medication Possession Ratio or proportion adherent (low certaintyl). ATCS Plus versus enhanced usual care Piette 2012 (N = 200) found that ATCS Plus may reduce the number of medication‐related problemsm (low certaintyj). |
| Behavioural outcome: physical activity levels, 12 weeks IVR versus enhanced usual care | See comment | See comment | 253 (1 study) | ⊕⊕⊝⊝ | IVR versus enhanced usual care Dedier 2014 (N = 253) reported that IVR may slightly increase physical activity levels. |
| Adverse outcome: unintended adverse events attributable to the intervention Multimodal/complex intervention, ATCS Plus, IVR, unidirectional ATCS versus various controls | No studies reported adverse events. | ||||
| ATCS Plus: automated telephone communication systems with additional functions; CI: confidence interval; IVR: interactive voice response; MD: mean difference; SD: standard deviation. | |||||
| GRADE Working Group grades of evidence | |||||
| aAdditional results are based on a narrative summary and synthesis of results that were not amenable to statistical analysis; please see Effects of interventions for detailed findings. | |||||
| ATCS versus control for smoking cessation | ||||||
| Patient or population: patients with tobacco dependence Comparison: usual care, control (no calls, 'placebo' (inactive) ATCS, self‐help intervention, stage‐matched manuals) | ||||||
| Outcomes | Illustrative comparative risks* (95% CI) | Relative effect | No of participants | Quality of the evidence | Commentsa | |
| Assumed risk | Corresponding risk | |||||
| Control | ATCS | |||||
| Behavioural outcome: smoking abstinence Multimodal/complex intervention, ATCS Plus, IVR versus (various) controls or usual care at median follow‐up of 12 months | Study populationb | RR 1.2 | 2915 | ⊕⊕⊝⊝ | ATCS Plus versus usual care 1 further study, Reid 2011 (N = 440), reported that ATCS Plus may improve smoking abstinence rates at 26 weeks, and this may be maintained at 52 weeks (low certainty evidencef). | |
| 201 per 1000 | 241 per 1000 | |||||
| Moderatec | ||||||
| 241 per 1000 | 289 per 1000 | |||||
| Behavioural outcome: medication use Multimodal/complex, ATCS Plus versus control (inactive IVR or self‐help booklet) | See comment | See comment | See comment | 1127 (2 studies) | ⊕⊕⊕⊝ Moderateg | Multimodal/complex intervention versus control (self‐help booklet) Brendryen 2008 (N = 396) found that a multimodal/complex intervention probably has little or no effect on adherence to NRT (moderate certainty evidence). ATCS Plus versus control (inactive IVR) Regan 2011 (N = 731) found that ATCS Plus probably has little or no effect on medication use (moderate certainty evidence). |
| Behavioural outcome: support programme enrolment ATCS Plus versus control (inactive IVR) | See comment | See comment | See comment | 521 (1 study) | ⊕⊕⊝⊝ | Carlini 2012 found that ATCS Plus may improve re‐enrolment into a quit line support programme. |
| Adverse outcome: unintended adverse events attributable to the intervention Multimodal/complex intervention, ATCS Plus, IVR versus various controls | No studies were found that reported adverse events. | |||||
| *The basis for the assumed risk (e.g. the median control group risk across studies) is provided in footnotes. The corresponding risk (and its 95% confidence interval) is based on the assumed risk in the comparison group and the relative effect of the intervention (and its 95% CI). ATCS Plus: automated telephone communication systems with additional functions; CI: confidence interval; IVR: interactive voice response; NRT: nicotine replacement therapy; OR: odds ratio; RR: risk ratio; | ||||||
| GRADE Working Group grades of evidence | ||||||
| aAdditional results are based on a narrative summary and synthesis of results that were not amenable to statistical analysis; please see Effects of interventions for detailed findings. | ||||||
Antecedentes
Descripción
La demanda de aplicaciones de tecnología de información y comunicación en el ámbito de la asistencia sanitaria está aumentando, estimulada por un interés en facilitar la participación activa de los consumidores en el tratamiento de su propia salud así como por la necesidad de desarrollar plataformas que tengan un mayor alcance y también sean más eficaces en función de los costos que los enfoques tradicionales. Los sistemas de comunicación telefónicos automatizados (SCTA) son aplicaciones que se han usado para administrar tanto programas de prevención de la salud así como servicios para tratar las enfermedades crónicas.
El rango de intervenciones de SCTA incluidas en esta revisión abarca las siguientes:
-
SCTA unidireccionales. Es la forma no interactiva, que permite la comunicación por voz de sentido único no interactiva.
-
SCTA interactivos. Son sistemas que permiten la comunicación recíproca en tiempo real. La forma más común de este sistema es el de respuesta de voz interactiva RVI, que podría utilizarse, p.ej., para aportar sugerencias adaptadas automatizadas basadas en la monitorización del progreso de un individuo.
-
SCTA Plus. También son SCTA interactivos, aunque son más complejos e incluyen funciones adicionales, como el acceso a un asesor para formular preguntas.
Además, esta revisión incluye varias intervenciones de SCTA multimodales/complejos, definidas como cualquier tipo de SCTA (unidireccional, RVI o SCTA Plus) administrado como parte de un paquete complejo, multimodal, como la monitorización de los síntomas por parte de un profesional de la salud más monitorización automatizada por RVI más provisión de fármacos.
La prevención primaria de la salud se enfoca en mantener a los pacientes en buen estado, en la prevención de las enfermedades y las lesiones, y en la educación de los pacientes acerca de la adopción de comportamientos más saludables (Family Health Teams 2006). Hay dos tipos de estrategias de prevención primaria: promoción de la salud y prevención de enfermedades (Figura 1).
Un reto principal para los sistemas de asistencia sanitaria es prestar servicios preventivos que se dirigen sistemáticamente a los factores que contribuyen a las enfermedades (Gullotta 2014). En la prevención de la diabetes mellitus, p.ej., una combinación de factores cognitivos, fisiológicos y conductuales (como la falta de conocimiento sobre los factores de riesgo, la falta de actividad física y una dieta no saludable) puede contribuir con el desarrollo de la enfermedad Por lo tanto, una estrategia preventiva efectiva necesitaría tomar un enfoque integrador y dirigirse a cada uno de los factores influyentes (Figura 2).
Un método posible de comunicación de las actividades preventivas a la población es a través de la tecnología de información y comunicación (TIC) (Baranowski 2012; Haluza 2015).
Las enfermedades crónicas como las enfermedades cardiovasculares, el cáncer, la diabetes y las enfermedades pulmonares crónicas son las causas principales de muerte a nivel global (O'Dowd 2014). Los pacientes con enfermedades crónicas se enfrentan a retos como tratar síntomas complejos, los regímenes de medicación, la discapacidad y los ajustes en el modo de vida (Carolan 2014; Demain 2015).
Los programas de tratamiento de enfermedades crónicas efectivos reúnen los sistemas de información relevantes con un seguimiento continuo y el tratamiento seleccionado, incorporando las TIC para brindar información educativa accesible y conveniente así como herramientas de autocuidado para los pacientes con enfermedades crónicas (Galdas 2015).
Los consumidores usan cada vez más las TIC para la salud de innumerables maneras, como para acceder a las historias clínicas a través de portales en la web; mediante la comunicación en línea con otros, de forma presencial o en una comunidad virtual (Sawmynaden 2012); navegando en la Internet para encontrar información acerca de la salud y los servicios sanitarios; y transmitiendo los datos de salud o comunicando mensajes mediante la Web o el teléfono (Pappas 2011).
Hay algunas pruebas de que las herramientas como los SCTA pueden administrar información sanitaria a los consumidores de forma exitosa, lo cual facilita la promoción de la salud (Cohen‐Cline 2014; Oake 2009b), permite la participación activa de los consumidores en el tratamiento de su propia atención y facilita la investigación epidemiológica y en salud pública mediante el uso de los datos obtenidos de los pacientes (Hendren 2014; Maheu 2001).
Las TIC también pueden apoyar la prestación y la administración de programas de tratamiento de enfermedades. Hay pruebas de que los SCTA pueden proporcionar información sanitaria de forma exitosa a los pacientes para el tratamiento de enfermedades crónicas (Derose 2009; Derose 2013).
Prevención primaria de la salud
Tratamiento de enfermedades crónicas
TIC para la prevención primaria y el tratamiento de enfermedades crónicas
Descripción de la intervención
Los SCTA incorporan una plataforma de tecnología de computación especializada para entregar mensajes de voz y recopilar información de los consumidores mediante el programa de reconocimiento de voz o el teclado numérico (Piette 2012c). Se distinguen varios tipos de SCTA.
-
Los SCTA unidireccionales permiten la comunicación por voz de sentido único no interactiva. Podrían incluir intervenciones como las llamadas de recordatorio automatizadas para tomar la medicación o realizar otras acciones.
-
Los SCTA interactivos (p.ej. sistemas de RVI) permiten la comunicación recíproca en tiempo real, por ejemplo al realizar preguntas y recibir respuestas e intervenciones individualizadas (Reidel 2008; Rose 2015). Diferentes estudios han analizado los SCTA interactivos para el control de la diabetes (Katalenich 2015; Khanna 2014), la insuficiencia cardíaca (Chaudhry 2010; Krum 2013), la cardiopatía coronaria (Reid 2007), y el asma (Bender 2010). También se han usado en las iniciativas de promoción de la salud, centrándose en el comportamiento con respecto a la alimentación (Delichatsios 2001; Wright 2014), la actividad física (David 2012; Pinto 2002), y el abuso de sustancias (Aharonovich 2012).
-
Las intervenciones de SCTA Plus también son sistemas interactivos aunque incluyen funciones adicionales.
-
-
Funciones comunicativas avanzadas que incluyen el acceso a un asesor para solicitar asesoramiento (p.ej. función de “preguntar al experto”), el contacto programado con un asesor (p.ej. citas telefónicas o en persona) y acceso entre pares (p.ej. sistemas de comunicación con los pares).
-
Funciones complementarias que incluyen la comunicación automatizada sin voz (p.ej. correo electrónico o servicio de mensajes breves [SMS]) (Webb 2010).
-
En esta revisión, también se incluyen varias intervenciones de SCTA multimodales/complejas. Las mismas son paquetes más complejos de atención que las intervenciones de SCTA Plus y puede incluir cualquier tipo de SCTA (unidireccional, RVI o SCTA Plus) administrado como parte de un paquete complejo multimodal, como la monitorización de los síntomas por parte de un profesional de la salud más monitorización automatizada con RVI más provisión de fármacos.
De qué manera podría funcionar la intervención
Los SCTA son una modalidad de comunicación que puede reemplazar o complementar parte de la comunicación telefónica de persona a persona con una comunicación de computadora a persona (Lieberman 2012; McCorkle 2011).
Se reconoce que los SCTA – al igual que todas las otras intervenciones de salud – deben ser apoyados por modelos teóricos apropiados (Krupinski 2006; Puskin 2010). Los mismos incluyen el modelo transteórico (Prochaska 1984); la teoría del comportamiento planificado (Ajzen 1985); el Health Belief Model (Rosenstock 1974); Teoría Cognitiva Social (Bandura 2001); y la teoría de autorregulación (Leventhal 1984). El autocuidado o las aptitudes preventivas pueden desarrollarse mediante cualquiera de estos modelos (Barlow 2002).
Hay pruebas para sugerir que las intervenciones de cambio conductual apoyadas por una teoría pueden mejorar significativamente la conducta en cuanto a la salud (Fisher 2007; Gourlan 2015; Michie 2009; Webb 2010). La Figura 3 muestra un marco conceptual sobre cómo las teorías pueden influir en la conducta en cuanto a la salud e ilustra cómo los SCTA se usan en la prevención de la salud.
Los modelos de cognición social suponen que cualquier resultado de salud es la consecuencia de la interacción compleja entre factores sociales, ambientales, económicos, psicológicos y biomédicos (Edelman 2000; Jekauc 2015; Kelly 2009). Estos modelos se centran en los conceptos clave, como la autoeficacia y las actitudes que influyen en el comportamiento, que a su vez pueden dar lugar al cambio conductual (Hardeman 2005; Michie 2010; Vo 2015).
Las intervenciones de asistencia sanitaria administradas mediante los programas de tratamiento de enfermedades, como los apoyados por el modelo de atención de enfermedades crónicas, han producido una mejoría en la atención de los pacientes y los resultados de salud (Gee 2015; Lee 2011; Piatt 2006; Schillinger 2009). Según el modelo de atención de enfermedades crónicas, el tratamiento de las enfermedades crónicas requiere una interacción entre un equipo preparado proactivo de profesionales y un paciente informado y comprometido (Gammon 2015; Wagner 2002). Lo anterior puede lograrse mediante la interacción entre elementos como el apoyo al autocuidado, el diseño de sistemas de entrega, el apoyo a las decisiones y sistemas de información clínica (Webb 2006). La Figura 4 describe un marco que ilustra cómo los SCTA podrían funcionar en el tratamiento de las enfermedades crónicas, mediante el modelo de atención de enfermedades crónicas, con educación, monitorización y entrenamiento de los pacientes.
La importancia de la comunicación verbal es un proceso psicolingüístico, cognitivo‐emocional y educativo complejo, que incluye la transferencia de información entre una fuente (o remitente) y un destino (o receptor); depende en gran parte del tema/perspectiva de la comunicación, la eficacia percibida de la comunicación, el dominio de la persona al codificar y la comprensión del significado semántico decodificado en los mensajes verbales, y las intenciones comunicativas. Sin embargo, otras variables como el acento, el tono de voz, la velocidad del habla y el ruido de fondo también deben tenerse en cuenta al evaluar los SCTA (Krauss 2001).
Ventajas de los sistemas de comunicación telefónicos automatizados
Los SCTA como herramientas de obtención de datos tienen algunas ventajas sobre la consulta personal tradicional (Rosen 2015). Las mismas incluyen comodidad, sencillez, carácter anónimo y bajo costo (Lee 2003; Piette 2012c). Los SCTA pueden proporcionar acceso a la asistencia sanitaria 24 horas al día, siete días a la semana, junto con la información inmediata para el paciente (Hall 2000; Schroder 2009). Tanto los pacientes como los profesionales de la asistencia sanitaria que utilizan SCTA han informado un grado alto de satisfacción por parte de los usuarios, lo cual indica que son fáciles de usar y convenientes (Abu‐Hasaballah 2007).
La tecnología de los SCTA puede facilitar el acceso a poblaciones difíciles de alcanzar (p.ej. personas de bajo nivel socioeconómico) debido a que los SCTA requieren acceso sólo a un teléfono (privado o público) (Schroder 2009). Diferentes autores han encontrado que los SCTA son aceptables para las poblaciones con bajo índice de alfabetización (Glasgow 2004; Piette 2007; Piette 2012c), y otros han confirmado estos resultados en pacientes frágiles de edad muy avanzada (Mundt 2001). A diferencia de la interacción presencial, que puede producir respuestas socialmente deseables, lo cual da lugar al informe insuficiente de los comportamientos estigmatizantes y al informe excesivo de los comportamientos socialmente deseables, se ha encontrado que los SCTA producen un mejor autoinforme de las cuestiones delicadas (p.ej. abuso de sustancias, consumo de alcohol y antecedentes sexuales) y reducen el sesgo de autoinforme (Schroder 2009). También tienen el potencial de reducir los costos de prestación de asistencia sanitaria (Phillips 2015; Szilagyi 2013).
Desventajas de los sistemas de comunicación telefónicos automatizados
La programación de los SCTA implica inversión en el software y hardware, por ejemplo para permitir llamadas simultáneas múltiples y el desarrollo de un guión de voz apropiado para la población destinataria y el tema de investigación (Piette 2007; Schroder 2009). Los SCTA también pueden presentar dificultades con la provisión de apoyo inmediato al participante. Si surgen preguntas durante la entrevista (Schroder 2009), los SCTA no pueden capturar, interpretar, ni responder a las respuestas no verbales de los usuarios (Williams 2001). Los individuos con discapacidades físicas (p.ej. pérdida severa de la audición o el habla) pueden tener dificultad con los SCTA (Mundt 2001). Otros sencillamente pueden tener una preferencia fuerte por las interacciones con seres humanos en lugar de con mensajes de voz automatizados (Mahoney 2003). Además, para los individuos considerados por varias intervenciones basadas en SCTA, los SCTA podrían dar lugar a una sobrecarga de información y al rechazo total de las intervenciones. Finalmente, la protección de la información sanitaria individualmente identificable podría ser un reto.
Por qué es importante realizar esta revisión
Las revisiones existentes encontraron pruebas de la efectividad de los SCTA en la prevención de la salud y el tratamiento de las enfermedades crónicas (Krishna 2002; Lieberman 2012; Oake 2009b). Sin embargo, ninguna de las mismas fue concluyente, ni exploró la base teórica ni el mecanismo de acción de la intervención. La presente revisión llena este vacío con la investigación de los efectos de las intervenciones basadas en las construcciones teóricas y con la exploración de las técnicas de cambio conductual implementadas en la intervención (Abraham 2008; Michie 2011).
Además, no está claro qué tipos de SCTA son más efectivos para la prevención o el tratamiento de las enfermedades crónicas, en qué contexto, o para qué enfermedades. Esta revisión procura explorar diferentes interconexiones del diseño del programa de los SCTA y el diseño que puede usarse para grupos de población diversos (considerando factores como la edad, el nivel socioeconómico, el idioma preferido y el alfabetismo) (Car 2004; Pappas 2011). Recientemente se han publicado numerosos ensayos controlados aleatorios (ECA) que evalúan la efectividad de los SCTA.
Por lo tanto, se necesita una nueva revisión sistemática para evaluar críticamente las pruebas disponibles y guiar la implementación de los SCTA en la prevención de la salud y el tratamiento de las enfermedades crónicas.
Objetivos
Evaluar los efectos de los SCTA para la prevención de enfermedades y el tratamiento de las enfermedades crónicas en los resultados de cambio de conducta, clínicos, procedimentales, cognitivos, centrados en el paciente y adversos.
Los objetivos específicos secundarios incluyen:
-
la determinación de qué tipo de SCTA es más efectivo para la prevención de la salud y el tratamiento de las enfermedades crónicas;
-
la exploración de qué componentes del diseño de intervención contribuyen al cambio de conducta positivo del consumidor;
-
la exploración de las técnicas de cambio de conducta y los modelos teóricos que apoyan las intervenciones de SCTA.
Métodos
Criterios de inclusión de estudios para esta revisión
Tipos de estudios
Se incluyeron ECA, ECA con asignación al azar grupal, ensayos controlados cuasialeatorios, series de tiempo interrumpido (STI) y estudios controlados de antes y después (ECAD).
Se incluyeron ECAD y estudios STI debido a que a menudo se usan para establecer conclusiones acerca de “intervenciones prometedoras” listas para ser evaluadas cuando los ECA pueden ser demasiado costosos o sencillamente imprácticos o cuando no hay ECA suficientes sobre un tipo particular de intervención (Centre for Reviews and Dissemination 2008; Higgins 2011; Jackson 2005). Los diseños de series de tiempo interrumpido pueden considerar las tendencias cíclicas (es decir el resultado puede aumentar o disminuir con el transcurso del tiempo como observaciones estacionales u otras observaciones cíclicas). Para ser considerados para la inclusión, estos estudios debían haber cumplido con los criterios especificados por el Cochrane Effective Practice and Organisation of Care Review Group (EPOC) (Ryan 2009). Para los diseños de los ECAD, el momento adecuado de la obtención de datos para los grupos de control y de intervención tenía que haber sido el mismo, debía haber habido al menos dos sitios de intervención y dos sitios de control, y ambos grupos habrían sido comparables en cuanto a las características clave relacionadas con la demografía y el contexto de intervención. Para los diseños de STI, los estudios tenían que usar un punto claramente definido de tiempo en el que ocurrió la intervención y al menos tres puntos de datos antes y tres después de la intervención.
Tipos de participantes
-
Se incluyó a consumidores, incluidos los cuidadores, que recibieron los SCTA para la prevención o el tratamiento de las enfermedades crónicas, de forma independiente de la edad, el sexo, la educación, el estado civil, el estado laboral, o los ingresos.
-
Para el tratamiento de las enfermedades crónicas, se incluyó a consumidores que presentaban una o más enfermedades crónicas concurrentes (es decir multimorbilidad).
-
Se incluyó a consumidores en todos los contextos.
Tipos de intervenciones
Las intervenciones de SCTA incluidas en esta revisión incluyeron las siguientes:
-
SCTA unidireccionales: SCTA no interactivos que permitían la comunicación por voz de sentido único.
-
SCTA interactivos: sistemas que permiten la comunicación en dos sentidos y en tiempo real, como los sistemas de respuesta por voz interactivos o RVI.
-
SCTA Plus: sistemas de SCTA interactivos que incluyen funciones adicionales.
la revisión también incluía varias intervenciones con SCTA multimodales/complejos, definidas como cualquier tipo de SCTA (unidireccional, RVI o SCTA Plus) administradas como parte de un paquete complejo multimodal.
Se incluyeron estudios que evaluaban los SCTA unidireccionales o los SCTA interactivos. También se incluyeron estudios que comparaban intervenciones de SCTA (p.ej. SCTA unidireccionales versus SCTA interactivos o SCTA Plus) para comparar los efectos de diferentes diseños de intervención sobre la prevención de la salud o el tratamiento de las enfermedades crónicas.
Los SCTA interactivos tenían una función automatizada como información adaptada automatizada basada en la monitorización del progreso individual (p.ej. comparación con un estándar o con las metas, mensajes de refuerzo, mensajes de afrontamiento y mensajes automatizados de seguimiento). Aunque el protocolo (Cash‐Gibson 2012) indicó que se incluirían las intervenciones de SCTA Plus sólo si el estudio informaba explícitamente que los efectos de la intervención podían atribuirse al componente del SCTA, en la revisión se incluyeron todos los tipos de intervenciones de SCTA Plus debido a que, en una intervención compleja como esta, sería imposible atribuir el efecto de la intervención a uno de los componentes de la intervención. También se incluyeron estudios que administraban cualquier tipo de SCTA (unidireccional, RVI, o SCTA Plus) como parte de una intervención (paquete) complejo multimodal.
Las intervenciones se administraron para uno o más tipos de prevención o uno o más tipos de tratamiento para las enfermedades crónicas, como lo ilustrado en la Figura 1 y la Figura 5; respectivamente.
Se excluyeron estudios en que las intervenciones:
-
estaban dirigidas a profesionales de la salud o profesores con fines educativos;
-
se realizaron exclusivamente con el objetivo de registrar los antecedentes de forma electrónica o para la recopilación de datos o la evaluación del riesgo sin promoción de la salud ni ítems interactivos;
-
incluían sólo un componente no SCTA como la comunicación presencial o la comunicación escrita;
-
eran intervenciones basadas en la Web a las que se accedía a través de un teléfono móvil.
Se realizaron comparaciones versus diversos controles o estándares o formas mejoradas de atención habitual (es decir intervención con ningún SCTA). También se incluyeron comparaciones de un tipo de SCTA con otro, o el mismo tipo de SCTA administrado mediante diferentes modalidades de administración (p.ej. teléfono fijo versus teléfono móvil).
Como parte de esta revisión, se realizó un piloto y se aplicó la Complexity Assessment Tool for Systematic Reviews versión 1 (iCAT_SR) para intervenciones para evaluar las intervenciones complejas multimodales y se informaron los resultados de forma narrativa/cualitativa (Lewin 2015).
Tipos de medida de resultado
Resultados primarios
Los resultados primarios constaron de la conducta en cuanto a la salud y los resultados clínicos (definidos abajo). Para cada estudio, se incluyeron todos los resultados primarios relevantes, debido a que probablemente los mismos son sumamente significativos para los médicos, los consumidores, el público en general, los administradores y los responsables de políticas (Chandler 2013). Debido a la propagación amplia de los estudios incluidos y el hecho de que esta revisión representa el primer intento por evaluar sistemáticamente todas las pruebas relevantes sobre las intervenciones de SCTA ampliamente definidas, se creyó que era importante captar y revelar la mayor cantidad posible de información relevante sobre los resultados y los efectos de las intervenciones, para ayudar a elaborar integralmente dónde residen las pruebas y cómo se han evaluado. En las actualizaciones futuras de esta revisión, se podría considerar la posibilidad de modificar este enfoque para centrarse en un número y rango más pequeño de resultados si fuese probable que lo anterior mejorara la transparencia y la significación de los datos recopilados.
Se informaron los siguientes resultados en las tablas de “Resúmenes de los hallazgos”.
1. Resultados de la conducta en cuanto a la salud (categoría)
-
Cambios en las conductas que mejoran la salud (p.ej. actividad física, cumplimiento de los fármacos/aceptación de las pruebas de laboratorio recomendadas u otras pruebas)
-
Conducta relacionada con riegos (p.ej. consumo de tabaco)
Este resultado fue autoinformado o se recopiló mediante un cuestionario validado que fue autoadministrado o completado en una entrevista. En los estudios que midieron el mismo resultado utilizando tanto una medida autoinformada como una medida objetiva, se utilizó la medida objetiva. Por ejemplo, si un estudio sobre la actividad física midió las puntuaciones de la Metabolic Equivalent of Task (MET) mediante un recuerdo autoinformado de la actividad física de siete días así como un podómetro, se utilizó la puntuación obtenida del podómetro (objetivo).
2. Resultados clínicos (categoría)
-
Medidas fisiológicas (p.ej. presión arterial)
-
Bioquímica sanguínea (p.ej. niveles de glucosa)
Resultados secundarios
Para cada estudio, se seleccionaron todos los resultados secundarios relevantes debido a que los mismos también fueron significativos para los diversos proveedores.
1. Resultados del proceso (categoría)
-
Cambio en la aceptabilidad del servicio (p.ej. accesibilidad y utilización por parte del consumidor de las intervenciones para aplicar la información y el apoyo provisto a través de los SCTA)
-
Satisfacción (p.ej. satisfacción del paciente y del cuidador con la intervención)
-
Costo‐efectividad
2. Resultados cognitivos (categoría)
-
Cambios en el conocimiento (es decir conocimiento exacto del riesgo y percepción)
-
Actitud e intención de cambiar
-
Autoeficacia (es decir, la creencia de la persona en su capacidad para realizar una acción específica)
3. Resultados centrados en los pacientes (categoría)
-
Calidad de vida
4. Resultados adversos
-
Eventos adversos no intencionales atribuibles a la intervención
Results
Description of studies
See Characteristics of included studies and Characteristics of excluded studies for more details about individual studies.
Additional tables also contain supplementary information: Table 2 presents further information on participants of included studies, Table 3 reports details of the interventions assessed, and Table 4 presents an assessment of intervention complexity for studies evaluating the effects of highly complex (i.e. multimodal) ATCS interventions.
| Study ID | Study typea | Study subtypeb | Country | Sample size | Mean age (years unless stated otherwise) | Male (%) | Female (%) | Ethnicityc | Duration of condition | Comorbidities, medication | Incentives for participation | Incentives |
| P | Alcohol misuse | USA | 187 | 45 | 63 | 37 | White ‐ 54% Other ‐ 46% | — | — | Yes | Visa gift cards or checks (USD 50 per in‐person interview, USD 15 per phone interview). IG participants received USD 0.50 minimum for each daily call and USD 1.00 after seven consecutive calls | |
| P | I | USA | 1138 | — | — | — | — | — | — | — | — | |
| P | I | USA | 11,982 | 72 | — | — | — | — | — | — | — | |
| P | I | USA | 1227 | 2‐3 months | — | — | — | — | — | — | — | |
| P | I | USA | 3050 | 9 monthsd | 49 | 51 | Black ‐ 76% Hispanic ‐ 14% White ‐ 7% Other – 3% | — | — | — | — | |
| P | I | USA | 752 | 20 months | — | — | — | — | — | — | — | |
| P | I | USA | 8002 | — | 51 | 49 | Black ‐ 50% White ‐ 45% Other – 5% | — | — | — | — | |
| P | I | USA | 50 | 24 | 0 | 100 | Black ‐ 86% White ‐ 14% | — | — | Yes | USD 35 per month to help pay for cell phone service or a free, unlimited minutes cell phone until 6 weeks postpartum | |
| P | I | USA | 229 | 9 months | 52 | 48 | Black ‐ 90% Other – 7% Hispanic ‐ 3% | — | — | — | — | |
| P | I | USA | 3006 | — | 51 | 49 | Other – 41% Black ‐ 35% White ‐ 17% Hispanic ‐ 7% | — | — | — | — | |
| P | I | USA | 4115 | 14 | 50 | 50 | — | — | — | — | — | |
| P | Physical activity | USA | 71 | 57 | 0 | 100 | White ‐ 93% Other ‐ 7% | — | — | — | — | |
| P | Physical activity | USA | 181 | 69 | 99 | 1 | — | — | Mean (SD) number of comorbidities IG: 3.8 (1.5) CG: 3.9 (1.4) | Yes | USD 15 for completing each | |
| P | Physical activity | USA | 85 | 67 | 24 | 76 | Other ‐ 70% Black ‐ 30% | — | Mean co‐morbidities: 3 | — | — | |
| P | Physical activity | USA | 218 | 61 | 31 | 69 | White ‐ 90% Other ‐ 10% | — | — | — | — | |
| P | Physical activity | USA | 398 | 78 | 100 | 0 | White ‐ 77% Black ‐ 23% | — | Mean (SD) number of diseases IG: 5.2 (2.5) CG: 5.5 (2.7) | — | — | |
| P | Physical activity | USA | 302 | 67 | 97 | 3 | White ‐ 70% | — | Mean (SD) number of comorbidities IG: 4.2 (2.4) CG: 3.9 (2.4) | — | — | |
| P | Physical activity | USA | 298 | 46 | 28 | 72 | White ‐ 45% Black ‐ 45% Other ‐ 10% | — | — | — | — | |
| P | Physical activity | USA | 103 | 71 | 69 | 31 | — | — | Depression (unclear %) | — | — | |
| P | Screening | USA | 450 | 60 | 28 | 72 | Hispanic 87% Other‐ 13% | — | ≥ 1 long‐term conditions ‐ 68% | No | — | |
| P | Screening | USA | 11,010 | 61 | 54 | 46 | White ‐ 86% Other ‐ 14% | — | — | — | — | |
| P | Screening | Australia | 75,532 | — | 0 | 100 | — | — | — | — | — | |
| P | Screening | USA | 3547 | — | 0 | 100 | White ‐ 88% Black ‐ 11% Asian or Other ‐ 1% | — | — | — | — | |
| P | Screening | USA | 47,097 | 58 | 47 | 53 | — | — | — | — | — | |
| P | Screening | USA | 469 | — | 56 (for colorectal cancer) | 44 (for colorectal cancer) | White ‐ 61% Black ‐ 28% Latinos ‐ 5% Asian ‐ 5% | — | — | — | — | |
| P | Screening | USA | 1008 | — | 45 | 55 | White ‐ 48% Black ‐ 37% Other ‐ 15% | — | — | No | — | |
| P | Screening | USA | 366 | — | — | — | White ‐ 50% Black ‐ 41% Other (including Hispanic) ‐ 9% | — | — | — | — | |
| P | Screening | USA | 4685 | 57 | 0 | 100 | — | — | Anticonvulsants ‐ 6% Corticosteroids ‐ 4% COPD (unclear %) Oophorectomy ‐ 3% | — | — | |
| P | Screening | USA | 6000 | 60 | 50 | 50 | White ‐ 93% Other ‐ 7% | — | Obesity ‐ 40% | — | — | |
| P | Screening | USA | 685 | 58 | 38 | 62 | Non‐Hispanic white ‐ 78% Black ‐ 13% Other ‐ 9% | — | — | — | — | |
| P | Screening | USA | 20,936 | 57 | 47 | 53 | White ‐ 86% Other ‐ 9% Black ‐ 5% | — | — | — | — | |
| P | Screening | USA | 1973 | 69 | 8 | 92 | — | — | Use of oral glucocorticoids ‐ 22% Fractures ‐ 12% | — | — | |
| P | Stress management | USA | 100 (caregiver) | 63 (caregiver) | 22 (caregiver) | 78 (caregiver) | Black ‐ 64% Hispanic ‐ 21% White ‐ 15% Other ‐ 1% | — | — | — | — | |
| P | Substance use | USA | 33 | 46 | 76 | 24 | White ‐ 64% White ‐ 15% Hispanic ‐ 21% | — | HIV medication ‐ 64% Hepatitis A, B, or C ‐ 49% | Yes | USD 20 gift certificates for each assessment | |
| P | Weight management | USA | 365 | 55 | 31 | 69 | Black ‐ 71% Hispanic ‐ 13% White ‐ 4% Other ‐ 2% | — | Cholesterol medication ‐ 36% Diabetes medication ‐ 30% Mean BMI ‐ 37 kg/m2 | Yes | USD 50 reimbursement at the first 3 follow‐up visits and USD 75 at 24 months | |
| P | Weight management | USA | 194 | 35 | 0 | 100 | Black ‐ 100% | — | Hypertension ‐ 36% Metabolic syndrome ‐ 31% Depression ‐ 22% Diabetes mellitus ‐ 7% | Yes | Reimbursements of USD 50 each at baseline and at all follow‐up study visits | |
| P | Weight management | USA | 77 | 59 | 29 | 71 | White ‐ 68% Hispanic ‐ 18% Other ‐ 7% Black ‐ 4% Asian ‐ 3% | — | — | — | — | |
| P | Weight management | USA | 220 | 11 | 54 | 46 | White‐ 63% Hispanic ‐ 26% Other ‐ 11% | — | — | — | — | |
| P | Weight management | Greece | 122 | 44 | 12 | 88 | — | — | Hypertension ‐ 13% Diabetes mellitus ‐ 2% | — | — | |
| P | Weight management | USA | 140 | — | — | — | — | — | — | — | — | |
| P | Weight management | USA | 50 (child) | 10 (child) 40 (parent) | 58 (child) 4 (parent) | 42 (child) 96 (parent) | Black ‐ 72% Other ‐ 22% White ‐ 6% (parent) | — | BMI (child) ‐ 25.7 kg/m2 BMI (parent) ‐ 34 kg/m2 | Yes | For completing assessments (USD 40 parents; USD 10 child) | |
| E | Appointment reminder | USA | 517 | — | — | — | — | — | — | — | — | |
| E | Appointment reminder | USA | 3610 | 63 | 95 | 5 | White ‐ 83% Other ‐ 16% Hispanic ‐ 1% | — | — | — | — | |
| E | Appointment reminder | USA | 2304 | 29 | — | 100 | Hispanic ‐ 66% Black ‐ 19% White ‐ 13% Other ‐ 2% | — | — | — | — | |
| E | Appointment reminder | USA | 12,092 | 56 | 43 | 57 | — | — | — | — | — | |
| E | Appointment reminder | UK | 1000 | — | 33 | 67 | — | — | — | — | — | |
| E | Appointment reminder | USA | 2008 | 19d | 54 | 46 | Spanish‐speaking ‐ 39% Vietnamese‐speaking ‐ 28% English‐speaking ‐14% Other – 13% Tagalog‐speaking Filipino – 6% | — | — | — | — | |
| E | Appointment reminder | USA | 701 | < 12e | 45 | 55 | English‐speaking ‐ 59% Spanish‐speaking ‐ 29% Vietnamese‐speaking ‐ 3% Other – 9% | — | — | — | — | |
| M | Illicit drugs addiction | USA | 36 | 41 | 58 | 42 | White ‐ 58% Black ‐ 28% Other – 14% | On methadone treatment mean = 21.7 | — | Yes | USD 20 per week for completing weekly assessments and providing a urine sample | |
| M | Alcohol consumption | Sweden | 1423 | — | — | — | — | — | — | — | — | |
| M | Alcohol consumption | USA | 254 | 46 | 78 | 22 | Black ‐ 49% Hispanic ‐ 45% Other – 6% | 12.8y | HIV/AIDS (unclear %) | Yes | USD 20; USD 40 at last 2 post‐treatment follow‐ups | |
| M | Alcohol consumption | USA | 338 | 46 | 64 | 36 | White ‐ 97% | Currently dependent ‐ 67% | — | Yes | USD 30 for the | |
| M | Alcohol consumption | USA | 110 | 49 | 58 | 42 | White ‐ 86% Black ‐9%, Hispanic‐3% Other‐2% | Mean of 1.2 (SD 2.4) | — | Yes | The possible total incentive was USD 50.00 per week | |
| M | Alcohol consumption | USA | 60 | 42 | 55 | 45 | White ‐ 95% Black ‐5% | 52.3 heavy drinking days within past 3 months | — | Yes | Patients were paid USD 75 for the 30‐day follow‐up, USD 125 for the 90‐day follow‐up, and USD 200 for the 180‐day follow‐up | |
| M | Alcohol consumption | USA | 158 | 49 | 53 | 47 | — | Regular alcohol use mean = 17.94 years | — | Yes | USD 25 for each interview | |
| M | Alcohol consumption | USA | 47 | 57 | 60 | 40 | Caucasian ‐ 83% African‐American ‐ 13% | — | — | — | — | |
| M | Alcohol consumption | USA | 98 | 46 | 91 | 9 | White ‐ 45% Black ‐ 40% Native American ‐ 7% Other ‐ 6% Hispanic ‐ 2% | — | — | Yes | USD 25.00 each for the baseline and for the follow‐up assessments | |
| M | Asthma | USA | 6948 | 52 | 35 | 65 | White ‐ 92% Other ‐ 8% | — | Beta agonist ‐ 55% Oral steroids ‐ 46% COPD ‐ 33% | — | — | |
| M | Asthma | Australia | 121 | 7 | 53 | 47 | — | — | — | — | — | |
| M | Cancer | USA | 79 | 60 | 53 | 47 | White ‐ 85% Black ‐ 15% | — | — | — | — | |
| M | Cancer | USA | 405 | 59 | 32 | 68 | White ‐ 80% Black‐ 18% Other ‐ 2% | — | Depression ‐ 76% Pain ‐ 68% | — | — | |
| M | Cancer | USA | 250 | 55 | 24 | 76 | White/Caucasian ‐ 91% Other ‐ 9% | — | — | — | — | |
| M | Cancer | USA | 239 | 58 | 50 | 50 | White ‐ 89% Black‐ 6% Hispanic ‐ 4% Other 1% | Mean (SD) time since cancer diagnosis‐ IG: 36 months (35) CG: 26 months (32) | Mean (SD) symptoms (out of 13) IG: 3.4 (2.2) CG: 4.0 (2.4) | — | — | |
| M | Cancer | USA | 437 | 57 | 25 | 75 | — | — | Mean comorbidities: 2 | — | — | |
| M | Cancer | USA | 119 | 60 | 31 | 69 | White ‐ 76% Asian ‐ 17 % Black ‐ 7% | — | Capecitabine ‐ 35% Erlotinib ‐ 24% Lapatinib ‐ 9% Imatinibf ‐ 8% Temozolomide ‐ 6% Sunitinib ‐ 5% | — | — | |
| M | Cancer | USA | 253 | 61 | 49 | 51 | White ‐ 58% Black ‐ 36% Other ‐ 6% | — | Planned single chemotherapy ‐ 9% Planned combination chemotherapy ‐ 90% | — | — | |
| M | Chronic pain | USA | 250 | 55 | 83 | 17 | White ‐ 77 % | ≤ 5 years = 29% 6‐10 years = 19% > 10 years = 52% | Major depression‐ 24% Post‐traumatic stress disorder‐ 17% | — | — | |
| M | Chronic pain | USA | 55 | 46 | 14 | 86 | White ‐ 96% Other ‐ 4% | — | — | — | — | |
| M | COPD | UK | 79 | 69 | 74 | 26 | — | — | SABA ‐ 75% LAMA ‐ 43% LABA/ICS ‐ 43% ICS ‐ 33% SAMA ‐ 32% Oral steroids ‐ 25% LABA ‐ 18% | — | — | |
| M | Adherence | USA | 475 | 5 (child) 35 (parent) | 52 (child) 7 (parent) | 48 (child) 93 (parent) | Black ‐ 67% (child) 47% (parent); Other – 33% (child) 53% (parent) | — | — | Yes | Gift cards | |
| M | Adherence | USA | 50 | 42 | 36 | 64 | White ‐ 58% Black ‐ 20% Hispanic ‐ 18% Asian ‐ 4% | — | — | Yes | USD 25 for each completed visit | |
| M | Adherence | USA | 1187 | — | — | — | — | — | — | — | — | |
| M | Adherence | USA | 70 | 66 | 49 | 51 | African American ‐ 58% European ‐ 32% Asian ‐ 6% Hispanic ‐ 3% Middle Eastern ‐ 1% | Median 5 years in IG; 4.5 years in CG | Bimatoprost ‐ 11.5% Travoprost ‐ 17.5% Latanoprost ‐ 71.5% Bilateral medication ‐ 70% | — | — | |
| M | Adherence | USA | 1393 | — | — | — | — | — | — | — | — | |
| M | Adherence | USA | 13,057 | 51 | 54 | 46 | Other ‐ 48 % White ‐ 23% Hispanic ‐ 14% Black ‐ 10% Asian ‐ 5% | — | — | — | — | |
| M | Adherence | USA | 5216 | 56 | 49 | 51 | Hispanic ‐ 30% White ‐ 28% Unknown ‐ 23% Black ‐ 10% Asian and Pacific Islander ‐ 7.1% Other ‐ 1.7% Native American‐ 0.2% | — | Mean low‐density lipoproteins = 146 mg/dL | — | — | |
| M | Adherence | USA | 961 | 59 | 47 | 53 | — | — | Statins ‐ 32% Depression ‐ 11% | — | — | |
| M | Adherence | USA | 267 | 77 | 23 | 77 | Other ‐ 89 % Black: 11% | — | Other – 81% Heart disease ‐ 32% Diabetes mellitus ‐ 18% Stroke ‐ 7% | — | — | |
| M | Adherence | USA | 312 | 63 | 62 | 38 | Black ‐ 91% White ‐ 9% | — | — | Yes | USD 25 gift card | |
| M | Adherence | USA | 8306 | — | — | — | — | — | — | — | — | |
| M | Adherence | USA | 241 | 64 | 98 | 2 | White ‐ 78% | — | Hypertension ‐ 91% Hyperlipidaemia ‐ 85% Diabetes mellitus ‐ 45% Chronic kidney disease ‐ 23% Chronic lung disease ‐ 20% Prior heart failure ‐ 12% Peripheral arterial disease ‐ 10% Cerebrovascular disease ‐ 7% | — | — | |
| M | Adherence | USA | 16 | 71 | 31 | 69 | — | — | — | Yes | USD 25 for participating | |
| M | Adherence | USA | 80 | 66 | 51 | 49 | White ‐ 62% African‐American ‐ 10% Hispanic/Latino ‐ 9% Asian ‐ 9% East Indian ‐ 6% | Mean IG: 25.79 months; CG: 22.1 months | Number of medical problems: IG: 3.43 CG: 3.32 | — | — | |
| M | Adherence | USA | 337 | 57 | 30 | 70 | Black ‐ 100% | — | BMI ‐ 34.4 kg/m2 Diabetes ‐ 38% Stroke ‐ 7.5% | — | — | |
| M | Adherence | USA | 4,237,821 | 56 | 38.5 | 61.5 | — | — | Correspondence with the author: "All participants were on maintenance medications" | — | — | |
| M | Adherence | USA | 27 | 80 | — | — | — | — | Participants had cognitive (memory) impairment and were on donepezil, rivastigmine, or galantamine | — | — | |
| M | Adherence | USA | 15,051 | 57 | 53 | 47 | — | — | — | — | — | |
| M | Adherence | USA | 30,610 | — | — | — | — | — | — | — | — | |
| M | Adherence | Canada | 331 | 63 | — | — | — | — | — | — | — | |
| M | Adherence | USA | 1200 | 51 | 62 | 38 | Other ‐ 95% Black ‐ 5% | — | Insulin ‐ 19.4% (participants) | — | — | |
| M | Adherence | USA | 497 | 54 | 38 | 62 | — | — | Lipitor – 54% Zocor – 16% Other statin – 16% | — | — | |
| M | Adherence | USA | 647 | — | — | — | — | — | — | — | — | |
| M | Adherence | USA | 8517 | 54 | 34 | 66 | White ‐ 50% Other – 26% Asian ‐ 11% Mixed – 7% Native Hawaiian/Pacific Islander ‐ 4% Black ‐ 2% American Indian/Alaskan Native – 1% | — | COPD ‐ 33% | — | — | |
| M | Adherence | USA | 21,752 | 64 | 53 | 47 | White ‐ 47% Asian ‐ 17% Black ‐15% Native Hawaiian/Pacific Islander ‐ 11% Black ‐ 2% American Indian/Alaskan Native – 1% | — | Diabetes mellitus ‐ 78% CVD ‐ 36% Statin only ‐ 40% ACEI/ARB only ‐ 25% Statin and ACEI/ARB ‐ 35% low‐density lipoproteins among statin users (mean) = 93.4 mg/dL | — | — | |
| M | Diabetes mellitus | USA | 119 | 62 | 55 | 45 | White ‐ 77% Other – 23% | — | — | Yes | USD 25 | |
| M | Diabetes mellitus | USA | 80 | 30 | 0 | 100 | White ‐ 41% Black ‐ 34% Hispanic ‐ 18% Asians or others ‐ 7% | — | BMI ‐ 34.1 kg/m2 | — | — | |
| M | Diabetes mellitus | USA | 98 | 59 | 40 | 60 | Black ‐ 65% White ‐ 30% Other ‐ 3% Hispanic ‐ 1% Asian ‐ 1% | — | Other antidiabetic medications + insulin ‐ 80% Basal‐bolus regimen ‐ 40% Long‐acting insulin only ‐ 33% Mixed insulin only ‐ 17% Short‐acting insulin only ‐ 10% | — | — | |
| M | Diabetes mellitus | USA | 75 | 52 | 59 | 41 | Hispanic ‐ 100% | — | — | Yes | USD 10 for initial visit and USD 20 incentive card at the follow‐up | |
| M | Diabetes mellitus | USA | 100 | — | — | — | — | — | Psychiatric illness ‐ 46% Had been hospitalised over the past year ‐ 28% | — | — | |
| M | Diabetes mellitus | USA | 417 | 53 | 38 | 62 | Hispanic ‐ 100% | — | — | — | — | |
| M | Diabetes mellitus | USA | 248 | 55 | 41 | 59 | Hispanic ‐ 50% White ‐ 29% Other – 21% | — | BMI ‐ 33.7 kg/m2 Mean comorbidities: 1 | — | — | |
| M | Diabetes mellitus | USA | 272 | 61 | 97 | 3 | White ‐ 60% Black ‐ 18% Hispanic ‐ 12% Other ‐ 10% | — | BMI ‐ 31 kg/m2 Mean comorbidities: 2 | — | — | |
| M | Diabetes mellitus | USA | 339 | 56 | 43 | 57 | Hispanic ‐ 47% Asian ‐ 22% Black ‐ 20% White ‐ 8% Other ‐ 2% | — | BMI: 31 kg/m2 | Yes | USD 15 and USD 25 for the baseline and 1‐year follow‐up visits, respectively | |
| M | Diabetes mellitus | Australia | 120 | 57 | 63 | 37 | — | — | Low depression – 73% Intermediate depression – 23% High depression – 4% Low anxiety – 89% Intermediate anxiety – 8% High anxiety – 3% BMI ‐ 33 kg/m2 Insulin – 43% | — | — | |
| M | Heart failure | Italy | 133 | 57 | 88 | 12 | — | — | Diuretics ‐ 89% ACE inhibitors ‐ 84% Carvedilol ‐ 50% Nitrates ‐ 40% Digitalis ‐ 33% K + saver ‐ 21% | — | — | |
| M | Heart failure | USA | 1653 | 61d | 58 | 42 | White ‐ 49% Black ‐ 39% Other – 12% (inclusive of Hispanic or Latino – 3%) | — | Beta‐blocker – 79% Loop diuretic – 78% Hypertension ‐ 77% ACE inhibitor or ARB – 70% Coronary artery disease ‐ 50% Diabetes mellitus ‐ 47% Chronic kidney disease ‐ 46% Aldosterone‐receptor antagonist – 33% Digoxin – 25% COPD ‐ 21% | No | — | |
| M | Heart failure | Australia | 405 | 73 | 63 | 37 | — | — | Diuretics ‐ 80% Heart failure specific beta‐blockers ‐ 61% Systolic heart failure ‐ 60% ACE inhibitors ‐ 57.5% Diabetes mellitus ‐ 30.5% Aldosterone antagonist ‐ 26% ARB ‐ 25% Diastolic heart Internal cardio defibrillator ‐ 4.5% | — | — | |
| M | Heart failure | France | 138 | 68 | 79 | 21 | — | — | Loop diuretic – 92% ACE/AT2– 79% Beta‐blocker – 79% Spironolactone – 29% Digoxin – 9% (mean values) | — | — | |
| M | HIV | India | 631 | — | 57 | 43 | Asian ‐100% | — | Zidovudine‐based antiretroviral treatment – 44% Tenofovir‐based antiretroviral treatment – 44% Stavudine‐based antiretroviral treatment – 12% | Yes | Mobile phone plus wage compensation | |
| M | Hypercholestorolaemia | USA | 115 | 48 | 25 | 75 | White ‐ 87% Other – 13% | — | — | — | — | |
| M | Hypercholesterolaemia | USA | 123 | 57 | 25 | 75 | Black ‐ 77% Other – 23% | — | Mean BMI ‐ 31 kg/m2 | — | — | |
| M | Hypertension | USA | 241 | 60 | 21 | 79 | Black ‐ 81% White‐ 15% Hispanic ‐ 3% Other ‐ 1% | — | Hyperlipidaemia ‐ 46% Diabetes ‐ 32% | — | — | |
| M | Hypertension | USA | 253 | 58 | 27 | 73 | Black ‐ 100% | — | — | — | — | |
| M | Hypertension | USA | 64,773 | 61 | 46 | 54 | White ‐ 41%, Hispanic ‐ 25% Black ‐ 17% Other – 9% Asian ‐ 8% | — | Cardiovascular disease ‐ 38% Diabetes mellitus ‐ 27% Chronic kidney disease ‐ 10% | — | — | |
| M | Hypertension | USA | 283 | 66 | 65 | 35 | White ‐ 65% Other – 18% Hispanic ‐ 17% | — | Diabetes mellitus or chronic kidney disease – 55% | Yes | Clinically validated electronic blood pressure cuffs were provided at no cost to those who did not own one | |
| M | Hypertension | Honduras; Mexico | 200 | 58 | 33 | 67 | — | — | Blood pressure medication – 83% Diabetes mellitus ‐ 23% BMI ‐ 30.7 kg/m2 | — | — | |
| M | Mental health | USA | 164 | 39 | 24 | 76 | White ‐ 56% Black ‐ 32% Other – 12% | — | — | — | — | |
| M | Mental health | USA | 218 | 39 | 58 | 42 | White ‐ 93% Other – 7% | — | Social phobia ‐ 9%, Generalised anxiety disorder ‐8% Simple phobia – 6% Major depression – 2% Dysthymia – 2% | — | — | |
| M | Mental health | USA | 73 | 54 | 18 | 82 | Other – 74% Hispanic – 26% | — | — | — | — | |
| M | OSAS | USA | 30 | 46 | — | — | — | — | BMI ‐ 38 kg/m2 | — | — | |
| M | OSAS | USA | 250 | 55d | 82 | 18 | — | — | BMI ‐ 35.1 kg/m2 | — | — | |
| M | Smoking | Norway | 396 | 36 | 47 | 53 | — | — | — | Yes | All participants in both groups received a sample packet of nicotine replacement therapy products. | |
| M | Smoking | USA | 521 | 36 | 36 | 64 | White ‐ 81% Black ‐ 6% Other – 5% Hispanic/Latino ‐ 4% Native American – 3% Asian ‐ 1% | — | ≥ 1 long‐term conditions ‐ 47% | No | — | |
| M | Smoking | USA | 332 | 30 | 0 | 100 | White ‐ 61% Black ‐ 16% Hispanic ‐ 15% Other – 8% | — | — | — | — | |
| M | Smoking | Canada | 44 | 53 | 67 | 33 | — | Mean cigarettes/d: intervention ‐ 18.5 control ‐ 17.3 | — | — | — | |
| M | Smoking | Taiwan | 116 | 20 | 92 | 8 | Asian ‐ 100% | — | — | Yes | Equivalent of USD 6 | |
| M | Smoking | USA | 731 | 52 | 56 | 44 | — | — | — | — | — | |
| M | Smoking | Canada | 100 | 54 | 68 | 32 | — | — | Acute coronary syndrome ‐ 83% | — | — | |
| M | Smoking | Canada | 440 | — | — | — | — | — | — | — | — | |
| M | Smoking | USA | 397 | 53 | 48 | 52 | White ‐ 81% Hispanic ‐ 6% Black ‐ 4% Other/unknown ‐ 4% Native American ‐ 3% Asian/Pacific Islander ‐2.5% | Mean cigarettes/d: IG = 17.1 CG = 16.3 | Depressive symptoms (mean) IG = 9.3 CG = 10.3 | Yes | USD 50 for a saliva sample | |
| M | Smoking | USA | 2054 | 51 | 77 | 23 | White ‐ 89%, Black ‐ 5%, Other ‐ 4% Native American ‐ 2% | Mean cigarettes/d IG = 23.85 CG = 25.18 | — | — | — | |
| M | Spinal cord dysfunction | USA | 142 | 48 | 61 | 39 | White ‐ 80% (inclusive of Hispanic or Latino – 7%) Black ‐ 11% Other ‐ 9% | 11.7 y | Depression – 39% Pressure ulcers ‐ 7% | — | — |
aStudy type: P: prevention; M: management; E: either.
bStudy subtype: COPD: chronic obstructive pulmonary disease; HIV: human immunodeficiency virus; I: immunisation; LAMA: long‐acting muscarinic antagonist; OSAS: obstructive sleep apnoea syndrome; SABA: short‐acting β 2‐agonist; SAMA: short‐acting muscarinic antagonist
cPlease note that for reporting of participants' ethnicity, the terms used by authors of the included studies have been used in each case and are cited directly from each of the included studies.
dMedian.
eMajority of the participants.
Other abbreviations: CG: control group; IG: intervention group.
| Study ID | ATCSa | Contentb | Theoryc | BCTsd | Received instructions? | Callere | Telephone keypadf | Toll free | Study duration | Call durationg | Frequencyh | Intensity i | Speaker | Security arrangementj |
| IVR | AF | — | 1 | — | P | Other | — | 25 months | 29.3 min | — | — | Synthetic speech | — | |
| ATCS Plus | AF,SF | MI | 9, 25, 40 | Yes | E | Yes | Yes | 2 months | 1‐3 min | Daily | — | — | — | |
| IVR | AF | — | 25 | — | — | — | — | 1.5 months | — | — | < 500 words | — | — | |
| Unidirectional¹ | AF | TCD | 1, 42 | No | H | — | — | 6 months | — | 2 | 92 words | — | — | |
| IVR | AF | HBM | 20, 21, 42 | — | H | Yes | Yes | 2.5 months | < 5 min | 2 | — | — | — | |
| IVR | AF | — | 20,21 | — | — | — | — | 24 months | — | — | — | — | — | |
| ATCS Plus | AF, CF | SCT, TRA, TTM | 3, 9, 12, 13, 17, 20, 21, 25, 33, 39, 40, 42 | — | — | — | — | 24 months | — | — | — | — | — | |
| ATCS Plus¹ | AF, CF | SCT, TRA, TTM, MI | 3, 9, 12, 13, 17, 20, 21, 25, 33, 39, 40, 42 | — | H | — | — | 12 months | 2–4 min | Weekly | — | — | — | |
| IVR | AF | — | 29,42 | — | H | Yes | — | 3 months | — | Daily | 51 words | — | Reminder information was sent securely to Memotext¹ | |
| ATCS Plus¹ | AF, CF, SF | — | 9,10,42 | Yes | P | Yes¹ | Yes | 6 months | — | Biweekly | — | — | Password and log‐in | |
| ATCS Plus¹ | AF, SF | CBT, SCT, MI, SRT, SCL, RP | 3,12, 20,27, 34, 39 | Yes | P | Yes | — | 24 months | — | Twice daily then biweekly¹ for 6 weeks | — | Personal pronouns and active voice | — | |
| ATCS Plus | AF, CF | — | 20, 42 | Yes | P | Yes | Yes | 12 months | — | Daily | — | — | PIN² | |
| ATCS Plus | AF, CF | — | 3 | — | H | Yes | Yes | 4 months | — | — | — | — | — | |
| ATCS Plus | AF, CF | — | 20, 42 | Yes | P | Yes | Yes | 6 months | — | Daily | — | — | — | |
| ATCS Plus | AF, SF | — | 21 | Yes | H | Yes | — | 1 month | 4 weeks | Biweekly | — | — | — | |
| IVR | AF | — | 1,42 | — | H | — | — | 12 months | 5 min¹ | 1 | — | — | — | |
| ATCS Plus | AF, CF | — | 3, 27, 39 | Yes | H | Yes | — | 6 months | — | — | — | — | — | |
| ATCS Plus | AF, CF | — | 29,42 | — | H | Other | — | 12 months | — | ≤ 3 | — | — | — | |
| ATCS Plus | AF, CF | TTM, SCT, PST | 3,10 | Yes | E | — | — | 3 months | 15‐30 s² | Twice daily | — | — | — | |
| IVR | AF | TTM, SCT | 1,9 | — | H | — | — | 3 months | 10 min | Weekly | — | Pre‐recorded human speech | — | |
| IVR | AF | HBM¹ | 27, 42 | — | H | Yes | — | 24 months | 69 s | Average ‐ 3 | 224 words | Female voice | Verification³ | |
| IVR | AF | — | 3, 18, 20, 40, 42 | Yes | P | Yes | — | 2 months | — | 3‐day call², weekly | — | — | Password protected⁴ | |
| ATCS Plus | AF, SF | — | 40, 42 | — | H | Yes | Yes | 6 months | 40 s | 1 | 100 words | — | PIN⁵ | |
| ATCS Plus | AF, SF | — | 40, 42 | — | H | — | Yes | 3 months | 40 s | 1 | — | — | — | |
| Unidirectional | AF | — | 40 | No | H | — | — | 1 months | — | 1 | — | — | — | |
| Unidirectional | AF | — | 42 | No | H | — | — | 36 months | — | 1³ | — | — | — | |
| Unidirectional¹ | AF | TTM | 9,10,40 | — | H | — | — | 10 months | — | — | Approx 30 words | Nurse | — | |
| IVR | AF | — | 42 | — | H | — | — | 2 weeks | — | 1‐2 attempts | — | — | — | |
| IVR | AF | TTM | 20, 39 | Yes | P | Yes | Yes | 34 weeks | 5 min | — | — | Professional | Password protected⁴, PIN² | |
| IVR | AF | — | 3, 9 | Yes | — | — | — | 3 months | 1‐10 min³ | Weekly | — | — | — | |
| ATCS Plus | AF, CF | GM | 2, 3, 9, 15, 20 | — | E | — | — | 12 months | — | 10 | — | — | — | |
| IVR | AF | — | 3, 6, 20, 30, 39, 42 | Yes | E | Yes | Yes | 6 months | 30‐90 min² | Monthly | — | Female voice actor | Password protected⁴ | |
| IVR | AF | — | 39, 42 | — | — | — | — | 25 days | — | — | — | — | PIN⁶ | |
| ATCS Plus¹ | AF, CF | — | 20,42 | — | H | — | — | 26 weeks | — | Up to 4 | — | — | — | |
| Unidirectional | AF | — | 29,30 | — | H | — | — | 12 months | — | 2 | — | — | — | |
| Unidirectional | AF | — | 40,42 | No | H | — | — | — | — | — | — | — | — | |
| IVR | AF | SCT | 21, 32, 35, 39 | — | E | Yes | Yes | 6 months | 4 min | Weekly | — | — | Password protected⁴ | |
| IVR | AF | — | 3,16 | — | E | Other | — | 9 months | — | 12 | — | — | — | |
| IVR | AF | — | 1, 10, 20, 21, | Yes | — | — | — | 6 months | 15 min | Weekly | — | — | — | |
| IVR | AF | HBM | 3, 7, 20, 21, 42 | — | H | — | — | 12 months | > 1 min | Daily | — | Trained actor | PIN⁷ | |
| IVR | AF | — | 16 | — | H | Yes | — | — | — | — | — | — | — | |
| ATCS Plus | AF, SF | BT | 34 | — | E | Yes | — | 3 months | 8.6 min¹ | 12 | — | — | — | |
| ATCS Plus | AF, CF | HBM, SMP | 3, 7, 27, 30, 40 | — | H | — | — | 6W | — | 1 | — | — | — | |
| ATCS Plus | AF, CF, SF | — | 21, 40, 42 | Yes | H | — | — | 4 months | — | Daily, 4⁴ | — | — | — | |
| Unidirectional | AF | — | 20,42 | — | H | — | — | 1 month | — | — | 80 words | — | — | |
| ATCS Plus | AF, CF, SF | MI | 9,12 | Yes | P | — | Yes | 12 months | 60 days | Daily | 1‐3 min | — | — | |
| ATCS Plus | AF,CF | — | 20,34 | Yes | P | Yes | Yes | 6 months | 2 min | Daily | — | — | — | |
| ATCS Plus¹ | AF, CF | — | 20,42 | — | H | — | — | 25 weeks | 25 s | Up to 4 | — | — | — | |
| Unidirectional | AF | — | 16 | — | H | — | — | 3 months | 1 min | Monthly | 2 30‐s scripts | — | — | |
| ATCS Plus | AF, CF | — | 16 | — | H | — | — | 3 months | 4‐5 min | 1 | — | — | — | |
| ATCS Plus¹ | AF, CF | — | 20,42 | — | H | — | — | 12 months | — | Monthly⁵ | — | — | — | |
| IVR | AF | — | 21 | Yes | P | Yes | Yes | 26 months | — | Weekly | 45 s of speaking | — | PIN² | |
| IVR | AF | TTM, SCT | 4,20,21 | Yes | H | — | — | 6 months | 4.12 min | Weekly | 12.4 calls¹ | Digitised | — | |
| IVR | AF | — | 20, 39, 42 | — | E | Yes | — | 6 months | — | Daily | — | — | — | |
| ATCS Plus | AF, CF | SCT | 20, 39, 42 | — | E | Yes | — | 6 months | 2‐3 min | Biweekly | — | — | — | |
| IVR | AF | TTM | 7, 9, 20, 39 | Yes | P | Yes | — | 3 months | — | Weekly | — | — | Password protected⁴ | |
| ATCS Plus | AF,CF, SF | — | 16,21,30 | — | E | — | — | 6 months | — | Daily | — | — | — | |
| ATCS Plus | AF, SF | — | 20 | Yes | H | Yes | — | 3 months | — | 2.2/week | 26 calls¹ | Female voice | — | |
| ATCS Plus | AF, CF | — | 20,29,30 | — | H | — | — | 12 months | ≤ 10 min | Weekly | — | — | — | |
| IVR | AF | SCT, TTM | 3, 9, 20, 39 | Yes | H | Yes | — | 12 months | 10‐15 min | Weekly⁶ | — | — | — | |
| ATCS Plus¹ | AF, CF | TCM | 39 | — | E | — | — | 12 months | — | Biweekly, weekly, bimonthly, monthly⁷ | — | — | — | |
| ATCS Plus¹ | AF, CF | — | 21,39 | — | H | — | — | 12 months | — | Weekly⁸ | — | — | — | |
| ATCS Plus | AF, CF, SF | — | 20,21,42 | — | E | Yes | — | 12 months | — | Monthly | 18 questions | — | — | |
| IVR | AF | — | 39 | No | P | Yes | — | 24 months | 48 s¹ | Weekly | — | — | — | |
| ATCS Plus | AF, SF | — | 40, 42 | — | H | — | — | 24 months | — | — | — | — | — | |
| IVR | AF | — | 20,42 | Yes | H | Yes | — | 2 weeks | — | — | 3 segments | Personalised voice messages | — | |
| IVR | AF | — | 42 | — | H | — | — | 4 months | 96.8 s | — | — | — | — | |
| Unidirectional | AF | — | 42 | — | H | — | — | 5 months | — | Monthly | — | — | — | |
| Unidirectional | AF | — | 42 | — | H | — | — | 5 months | — | 2/d⁹ | — | — | — | |
| ATCS Plus | AF,SF | CBT | 3,20,34,38 | — | H | Yes | — | 12 weeks | 2.5 min | 8/d¹⁰ | — | — | — | |
| ATCS Plus | AF, CF | — | 21 | — | — | — | — | 15 months | 90 s | Monthly | — | — | — | |
| ATCS Plus¹ | AF, CF | — | 20, 21, 25, 42 | Yes | P | Yes | — | 6 months | 5‐10 min | Weekly | — | — | — | |
| ATCS Plus | AF, SF | PT, PM | 3, 13, 25, 39, 42 | Yes | P | Yes | Yes | 18 months | 18 min | — | 22 h/d² | Professional radio announcer | Password protected⁴ | |
| Unidirectional | AF | — | 40 | No | H | — | — | 2 months | — | — | — | — | — | |
| IVR | AF | — | 20, 21, 25, 34, 42 | — | H | Other | — | 24 months | 3‐5 min | Biweekly | — | — | — | |
| IVR | AF | SCT, TTM, MI | 25, 39 | Yes | — | Yes | Yes | 8 months | — | Weekly | — | African – American voice professionals | — | |
| ATCS Plus | AF, SF, CF | — | 21 | — | P | Yes | Yes | 1.5 months | 5.18 min¹ | Daily | — | — | Personalised password | |
| ATCS Plus | AF, SF | CBT | 17,34,38 | Yes | H | Yes | — | 1 month | 9.3 min¹ | Daily | — | — | — | |
| Unidirectional¹ | AF | SCT, TTM | 9, 10, 20, 25, 39 | — | H | — | — | 12 months | — | Monthly | Approx 60 words | Primary care provider | — | |
| Unidirectional¹ | AF | SCT, TTM | 9, 10, 20, 25, 39 | — | H | — | — | 12 months | — | Monthly | Approx 60 words | Primary care provider | — | |
| IVR | AF | — | 27, 42 | — | H | Yes | Yes | 6 months | 1 min | 3 | — | — | — | |
| IVR | AF | — | 25, 39 | — | H | — | — | 1 month | — | — | — | — | Correspondence with the author: "Upon answering a call, patients are required to authenticate with their date of birth." | |
| ATCS Plus | AF, CF, SF | CBT | 4,20,34,38 | Yes | E | — | Yes | 6 months | 9.2 min | Daily | — | — | Valid ID number and a personally | |
| Unidirectional | AF | — | 29 | Yes | H | — | — | 2 months | — | At least every 3 days | Every hour for 2 consecutive hours | Community health worker | — | |
| IVR | AF | CBT | 3, 16, 20, 22, 25, 39, 42 | Yes | P | — | Yes | 4 months | 3‐16 min | Daily | — | Experienced therapist | — | |
| Unidirectional | AF | — | 42 | — | H | — | — | 24 months | — | Daily | — | First author | — | |
| IVR | AF | — | 40 | — | H | — | — | 4 months | — | — | — | — | — | |
| IVR | AF | — | 39, 42 | — | — | — | — | 6 months | — | 3 | — | — | — | |
| ATCS Plus | AF, SF | CBT, TTM, MI | 9, 0, 12, 20, 21 | — | H | Yes | — | 2 months | 18.9 min^^ | Biweekly weeks 1‐3, weekly weeks 4‐6, no call week 7, weekly week 8‐9 | 8.61²,³ | — | — | |
| IVR | AF | — | 29, 30 | — | H | — | — | 3.5 months | — | up to 5 times | — | — | — | |
| ATCS Plus | AF, CF | SCT | 3, 18, 21, 25, 39 | No | E | Yes | Yes | 24 months | 1‐8 min² | Biweekly¹¹ | — | Human voice | PIN² | |
| ATCS Plus | AF, CF | SCT | 3, 18, 21, 25, 39 | — | H | Yes | — | 12 months | 1‐8 min² | Biweekly¹¹ | — | — | — | |
| ATCS Plus | AF, CF | — | 13, 20, 21, 39 | Yes | — | Yes | Yes | 1.5 months | ≤ 9 min | Weekly | — | Native speaker | — | |
| ATCS Plus | AF, SF | DMT, SCT, TTM | 3, 19, 20, 32 | Yes | P | Yes | — | 6 months | 10 min | Weekly (first 3 months), and at least biweekly thereafter | — | Digitised | — | |
| Unidirectional | AF | — | 39, 40 | No | H | — | — | — | — | — | — | Receptionist | — | |
| ATCS Plus | AF, CF | — | 20, 42 | — | H | — | — | 3 months | — | — | — | — | — | |
| ATCS Plus | AF, CF | — | 3, 9, 13, 39, 40, 42 | — | H | — | — | 12 months | 1‐20 min⁵ | 3 | — | — | — | |
| ATCS Plus | AF, CF | — | 20, 42 | — | — | — | — | 12 months | — | 8 | — | — | — | |
| IVR | AF | — | 42 | — | P | — | — | — | — | — | — | — | — | |
| ATCS Plus | AF, CF, SF | — | 13, 34 | — | H | — | Yes | 6 months | — | 5 times¹² | — | — | — | |
| ATCS Plus | AF, CF, SF | CBT | 4, 20, 34, 38 | Yes | P | — | — | 4 months | — | Daily | — | — | — | |
| IVR | AF | MI | 9, 12 | — | H | Other | — | 6 months | — | ≤ 26 calls over 13 weeks | — | — | — | |
| ATCS Plus | AF, CF | CCM, SCT | 1, 3, 9, 10, 13, 20, 21, 35, 39 | — | E | Yes | Yes | 12 months | 6‐12 min | Weekly | — | — | — | |
| ATCS Plus | AF, CF | — | 27, 39, 42 | — | H | — | — | 6 months | — | 11 | — | — | Password protected⁴ | |
| IVR¹ | AF | TPB | 16,20 | — | H | — | — | 24 months | — | Weekly | — | — | — | |
| IVR | AF | — | 17, 20, 42 | — | H | Other | — | 6 weeks | — | 3 calls 6 weeks apart | 12 questions; 397 words | Digitally | — | |
| IVR | AF | — | 17, 20, 30, 39, 40 | — | H | Yes | — | 2 months | — | Weekly¹³ | — | Female voice | — | |
| IVR | AF | GMDBC, Others² | 3, 27, 39 | Yes | E | — | — | 3 months | 2‐6 min | — | — | — | Verification | |
| ATCS Plus | AF, CF | — | 30, 42 | No | H | No | — | 12 months | — | 3¹⁴ | — | Human voice | — | |
| IVR | AF | — | 20 | Yes | P_H | Yes | Yes | 1 months | — | Daily | — | — | — | |
| ATCS Plus¹ | AF, CF | — | 16 | — | H | — | Yes | — | — | — | — | Female voice | — | |
| IVR | AF | SCT, MI | 3, 12, 17, 20, 25, 39, 40, 42 | — | E | Yes | — | 12 months | — | Weekly then monthly¹⁵ | — | — | Password protected⁴ | |
| IVR | AF | SCT | 3, 12, 17, 20, 25, 39, 40, 42 | Yes | E | Yes | — | 12 months | — | Weekly then monthly¹⁵ | — | — | Password protected⁴ | |
| ATCS Plus | AF, CF | CBT | 2, 20 | Yes | H | Yes | — | 2 months | — | Weekly | — | — | — | |
| ATCS Plus | AF, SF | HBM, CCM, SCT, TTM, MI, SRT, RL | 2, 3, 20, 32, 39 | — | H | — | Yes | 6 months | — | 3 | — | — | — | |
| Unidirectional | AF | — | 42 | — | H | — | — | 1 month | — | 1³ | — | Human voice | — | |
| IVR¹ | AF | — | 9, 10, 42 | Yes | P | Yes | — | 3 months | — | Daily/2 weeks; weekly/10 weeks | 25 calls | Female voice | — | |
| Unidirectional | AF | — | 42 | — | H | — | — | 18 months | — | Weekly | — | — | — | |
| Unidirectional | AF | — | 42 | — | H | — | — | 12 months | — | — | — | — | — | |
| Unidirectional | AF | HBM | 7*, 39, 40, 42 | No | H | — | — | — | — | 1¹⁶ | — | Female using native languages | — | |
| Unidirectional | AF | HBM | 39, 40, 42 | No | H | — | — | — | — | 1¹⁶ | — | Female using native languages | — | |
| IVR | AF | BET | 9, 20, 25, 34 | Yes | — | — | — | 6 months | ≤ 5 min | Daily | — | — | PIN⁶ | |
| ATCS Plus | AF,SF | — | 10 | — | — | — | — | 3 months | — | 3/week | — | — | — | |
| IVR¹ | AF | TTM | 4, 13, 20, 34, 38 | — | E | Yes | — | 6 months | 15‐20 min | Weekly¹⁷ | — | — | — | |
| ATCS Plus | AF, CF | — | 39 | — | H | Other | — | 10 months | < 10 min | 3¹⁸ | — | — | — | |
| ATCS Plus | AF, CF | — | 20, 42 | — | H | Other | Yes | 18 months | 2‐3 min | — | — | — | — | |
| ATCS Plus | AF, CF, SF | — | 20, 42 | Yes | H | Other | Yes | 12 months | 2‐3 min | Monthly | — | — | — | |
| IVR | AF | — | 3, 21, 39 | Yes | P | Yes | Yes | 6 months | 5‐20 min | Weekly | — | — | PIN⁶ | |
| IVR | AF | SCT | 2, 9, 10 | No | P | Other | — | 3 months | — | Biweekly | — | Synthetic speech | — | |
| IVR | AF | — | 21, 40 | — | H | Yes | — | 6 months | — | Biweekly | — | — | — | |
| ATCS Plus | AF, SF | — | 21, 40 | — | P | Yes | — | 3 months | — | Weekly | — | — | PIN | |
| Unidirectional | AF | SCT | 4,13 | — | — | — | — | — | — | — | — | — | — |
a ATCS ¹For more detailed evaluation of multimodal/complex interventions, please refer to Table 4.
b Content delivery: AF: automated functions; CF: communicative functions; SF: supplementary functions.
c Theory: BET: behavioural economic theory; BT: behavioural therapy; CBT: cognitive behavioural therapy; CCT: self‐management support strategies using chronic care model; DMT: Golan's model based on social–ecologic theory decision making theory; GMDBC: general model of the determinants of behavioural change; HBM: health belief model process theory; MI: motivational interviewing; PM: Pearlin's model of AD caregiver's stress; RL: reflective listening; RP: relapse prevention; SCT: social cognitive theory; SMP: social marketing principles; SRT: self‐regulation theory; TCD: theory of cognitive dissonance; TCM: 3‐component model; TPB: theory of planned behaviour; TRA: theory of reasoned action; TTM: transtheoretical model.
¹For enhanced letter reminders group.
²Synthesis of behavioural theories.
d Behaviour change techniques: 1 ‐ action planning; 2 ‐ agree behavioural contract; 3 ‐ barrier identification/problem solving; 4 ‐ emotional control training; 5 ‐ environmental restructuring; 6 ‐ facilitate social comparison; 7 ‐ fear arousal; 8 ‐ general communication skills training; 9 ‐ goal setting (behaviour); 10 ‐ goal setting (outcome); 11 ‐ model/demonstrate the behaviour; 12 ‐ motivational interviewing; 13 ‐ plan social support/social change; 14 ‐ prompt anticipated regret; 15 ‐ prompt identification as a role model/position advocate; 16 ‐ prompt practice; 17 ‐ prompt review of behavioural goals; 18 ‐ prompt review of outcome goals; 19 ‐ prompt self talk; 20 ‐ prompt self‐monitoring of behaviour; 21 ‐ prompt self‐monitoring of behavioural outcome; 22 ‐ prompt use of imagery; 23 ‐ prompting focus on past success; 24 ‐ prompting generalisation of a target behaviour; 25 ‐ provide feedback on performance; 26 ‐ provide information about other's approval; 27 ‐ provide information on consequences of behaviour in general; 28 ‐ provide information on consequences of behaviour to the individual; 29 ‐ provide information on where and when to perform the behaviour; 30 ‐ provide instruction on how to the perform the behaviour; 31 ‐ provide normative information about others' behaviour; 32 ‐ provide rewards contingent on effort or progress towards behaviour; 33 ‐ provide rewards contingent on successful behaviour; 34 ‐ relapse prevention/coping planning; 35 ‐ set graded tasks; 36 ‐ shaping; 37 ‐ stimulate anticipation of future rewards; 38 ‐ stress management; 39 ‐ tailoring; 40 ‐ teach to use prompts/cues; 41 ‐ time management; 42 ‐ use of follow up prompts.
¹Only those in the IG received importance statement.
e Caller: E ‐ either participant or healthcare provider/researcher; H ‐ healthcare provider/researcher; P ‐ participant; P_H ‐ If P fails to call then H calls.
f Telephone keypad for response: the calls were made using speech recognition (or speech‐enabled) technology; ¹‐ both data entry via Web screen or voice or telephone keypad.
g Duration of calls
¹Mean value.
²Assessments: 5‐8 min, health tips: 30‐60 s, healthcare education module: 3‐5 min.
³7 calls provided about 5–10 min of counselling, while the remaining 5 calls provided a tip of the week that lasted < 1 min.
⁴Screening session.
⁵20 min ‐ telecounselling, 30‐60 s ‐ health tips, 3‐5 min (optional) ‐ interactive self‐care education module.
h Frequency
¹Twice daily, follow‐up phase ‐ daily for another 4 weeks, twice a week for another 2 weeks, and then once a week.
²1st call 3 days after starting CPAP.
³Up to 9 attempts.
⁴Alert calls.
⁵The medication reminder calls occurred monthly; the medication refill calls were synchronised to when a medication refill was due. During months 2‐6 of the intervention, participants received both medication reminder (monthly) and medication refill calls (timed to refill due dates) for the 4 medications of interest. During months 7‐12 of the intervention, participants only received medication refill calls;
⁶2 weekly calls, 3 biweekly, and 10 monthly calls.
⁷Weeks 1‐3, biweekly; weeks 4‐11, weekly; months 3‐6, bimonthly; months 7‐12, monthly.
⁸For the first month, every other week for months 2 and 3, and monthly for months 4 through 12.
⁹Twice daily for 7 days until successful telephone contact was established.
¹⁰For assessment only (a total of 12 sessions were administered).
¹¹Up to 6 call attempts.
¹²At 2, 14, 30, 60, and 90 days postdischarge.
¹³ Except week 5.
¹⁴Up to six attempts, leaving up to two messages requesting a call back.
¹⁵1st month ‐ weekly followed by monthly calls.
¹⁶Up to 5 follow‐up calls at half hour intervals if busy phone lines or non‐response.
¹⁷Weekly for the first month, biweekly the second month, and monthly for months 3–6 and applied to smokers who received nicotine replacement therapy.
¹⁸5 months apart.
i Intensity
¹Mean value.
²Except for 2 h during the night for network file backup.
³Estimate for IG only.
j Security arrangement
¹Memotext ‐ the place where the reminders were actually generated.
²Personal identification number.
³Automated messages instructed the listener to 'press 1' if the call had reached the intended recipient, and they were not left on answering machines.
⁴Confidential password was used to access the system.
⁵Personal identification number (PIN) ‐ medical record number.
⁶PIN ‐ health record number and year of birth;
⁷PIN ‐ study number and telephone number.
| Assessment levels and criteria for each dimension | Study | Assessment of the intervention (a‐d)/description of the intervention/justification | Control (or usual care) |
| Core dimension 1: active components included in the intervention compared with the control | |||
| a. More than 1 component and delivered as a bundle b. More than 1 component c. 1 component | (a.) A mailed reminder letter, a free faecal immunochemical test, an automated telephone and text message reminding them that they were due for screening and that a faecal immunochemical test was being mailed to them, an automated telephone and text reminder 2 weeks later for those who did not return the faecal immunochemical test, and personal telephone outreach by a colorectal cancer screening navigator after 3 months | (b.) Usual care included computerised reminders, | |
| (a.) Behaviour change goals, self‐monitoring via IVR phone calls, tailored skills training materials, monthly interpersonal counselling calls, and a 12‐month gym membership. | (b.) Control group received + newsletters that covered general wellness topics but did not discuss weight, nutrition, or physical activity | ||
| (a.) Internet‐ and telephone‐based telemedicine system + automatically generated emails or telephone calls as reminders + sphygmomanometer, a weighting scale (if needed), a pedometer and instructions on their use | (c.) Control group received usual care | ||
| (a.) Email, webpages, IVR and short message service (SMS) + craving helpline | (c.) Control group received self‐help (booklet) | ||
| (a.) 10 personal phone calls from the nurse interspersed randomly with 10 automated phone calls + clinic‐based activity counselling | (b.) Clinic‐based activity counselling + no calls | ||
| (b.) Clinician prompt, patient prompts, patient outreach consisting of 2 personalised letters which also include testing kits for colorectal cancer and up to 4 ATCS calls over 26 weeks | (c.) The clinician was responsible for discussing cancer screening with the patients and for initiating any referral or for handing out faecal occult blood testing cards over 12 months | ||
| (b.) Letters, ATCS calls, a point‐of‐care prompt and mailing of a home colorectal cancer testing kit; and medical record reviews at week 12 | (c.) Usual care received blinded chart review | ||
| (b.) Medication reconciliation and tailoring, patient education (provided through automated voice messages and pharmacist telephone calls when requested by the patient), collaborative care between pharmacists and providers (primary care providers or cardiologists), and voice messaging reminders (educational and medication refill reminder calls). | (c.) Usual care received standard hospital discharge instructions e.g., numbers to call, follow‐up appointments, diet and exercise advice, a discharge medication list, and educational information about cardiac medications | ||
| (a.) Symptom monitoring by a nurse + automated monitoring either via IVR or by Internet + medications (analgesics, antidepressants) | (c.) Usual care from oncologist | ||
| (a.) Symptom monitoring, either via IVR or by Internet + nurse care + stepped care with analgesics | (c.) Usual care from primary care physician | ||
| (b.) Patient education, home blood pressure monitoring, home blood pressure measurement reporting to an ATCS, and clinical pharmacist management of hypertension with physician oversight + usual care | (c.) The control group received usual care | ||
| (b.) Baseline in‐person and biweekly then monthly telephone counselling by a lifestyle counsellor, one‐time clinical endorsement of physical activity and monthly automated telephone messaging by primary care provider, and quarterly tailored mailings of progress in physical activity. | (c.) Patients in the control group received usual care | ||
| (b.) 1 in‐person baseline counselling session, regular telephone counselling, physician endorsement in clinic with monthly ATCS calls encouragement, and tailored mailed materials, plus a consult to a Veterans Affairs (VA) weight management program. | (b.) Patients in the control group received usual care + MOVE | ||
| (b.) An IVR call once a week + a weekly non‐interactive neutral pictorial message sent out as a reminder 4 days after the IVR call + usual care | (b.) Usual care included up to 3 counselling sessions + antiretroviral treatment | ||
| (b.) Education and reminders delivered to primary care physicians + mailings and ATCS | (c.) The control group received no education | ||
| (b.) Treatment team education and patient self‐care education, nurse telephone call and IVR program | (c.) Treatment team education and patient self‐care education | ||
| (a.) Automated counselling plus nicotine replacement therapy, manuals, and expert system (TEL + EXP + NRT + MAN) | (c.) The control group received stage (of change) matched manuals | ||
| Core dimension 2: behaviours or actions of intervention recipients or participants to which the intervention is directed | |||
| a. Single target b. Dual target c. Multitarget d. Variesa | (a.) Single target: colorectal cancer screening | (a.) Single target: colorectal cancer screening | |
| (a.) Single target: weight management | (a.) Single target: weight management | ||
| (c.) Single target: diet, exercise, smoking and blood pressure control | (a.) Single target: blood pressure control | ||
| (a.) Single target: smoking abstinence | (a.) Single target: smoking abstinence | ||
| (c.) Multiple target: physical activity; BMI; mobility; quality of life | (c.) Multiple target: physical activity; BMI; mobility; quality of life | ||
| (b.) Dual target: breast cancer and colorectal cancer screening | (b.) Dual target: breast cancer and colorectal cancer screening | ||
| (b.) Dual target: breast cancer and colorectal cancer screening | (b.) Dual target: breast cancer and colorectal cancer screening | ||
| (c.) Medication adherence, blood pressure, blood lipid levels | (c.) Medication adherence, blood pressure, blood lipid levels | ||
| (b.) Dual target: pain and depression management | (b.) Dual target: pain and depression management | ||
| (a.) Single target: musculoskeletal pain management | (a.) Single target: musculoskeletal pain management | ||
| (b.) Dual target: blood pressure monitoring and blood pressure measuring | (b.) Dual target: blood pressure monitoring and blood pressure measuring | ||
| (c.) Multitarget: improving gait speed, self‐reported physical activity, function and disability | (c.) Multitarget: improving gait speed, self‐reported physical activity, function and disability | ||
| (c.) Multitarget: improving blood sugar indices, anthropometric measures, and self‐reported physical activity, health‐related quality of life, and physical function | (c.) Multitarget: improving blood sugar indices, anthropometric measures, and self‐reported physical activity, health‐related quality of life, and physical function | ||
| (a.) Single target: antiretroviral treatment medication adherence | (a.) Single target: antiretroviral treatment medication adherence | ||
| (a.) Single target: osteoporosis screening | (d.) Varies | ||
| (a.) Single target: antidepressant medication adherence | (a.) Single target: antidepressant medication adherence | ||
| (a.) Single target: smoking abstinence | (a.) Single target: smoking abstinence | ||
| Core dimension 3: organisational levels and categories targeted by the intervention | |||
| a. Multilevel b. Multicategory c. Single category | (c.) Intervention directed only at single category of individuals within the individual level: patients past due for colorectal cancer screening | (c.) Intervention directed only at single category of individuals within the individual level: patients past due colorectal cancer screening | |
| (c.) Intervention directed only at single category of individuals within the individual level: obese females of Black ethnic origin | (c.) Obese females of black ethnic origin | ||
| (c.) Intervention directed only at single category of individuals within the individual level: subjects with elevated blood pressure | (c.) Intervention directed only at single category of individuals within the individual level: subjects with elevated blood pressure | ||
| (c.) Intervention directed only at single category of individuals within the individual level: tobacco smokers | (c.) Tobacco smokers | ||
| (c.) Sedentary primary care patients | (c.) Sedentary primary care patients | ||
| (c.) Intervention directed only at single category of individuals within the individual level: patients past due recommended screening | (c.) Patients past due recommended screening | ||
| (c.) Intervention directed only at single category of individuals within the individual level: patients past due recommended screening | (c.) Patients past due recommended screening | ||
| (c.) Intervention directed only at single category of individuals within the individual level: patients after hospitalisation for acute coronary syndrome | (c.) Intervention directed only at single category of individuals within the individual level: patients after hospitalisation for acute coronary syndrome | ||
| (c.) Intervention directed only at single category of individuals within the individual level: cancer patients with depression and pain | (c.) Cancer patients with depression and pain | ||
| (c.) Intervention directed only at single category of individuals within the individual level: patients with musculoskeletal pain | (c.) Patients with musculoskeletal pain | ||
| (c.) Intervention directed only at single category of individuals within the individual level: patients with hypertension | (c.) Patients with hypertension | ||
| (c.) Intervention directed only at single category of individuals within the individual level: sedentary (otherwise healthy) older adults | (c.) Intervention directed only at single category of individuals within the individual level: sedentary (otherwise healthy) older adults | ||
| (c.) Intervention directed only at single category of individuals within the individual level: older adults at risk of diabetes mellitus | (c.) Intervention directed only at single category of individuals within the individual level: older adults at risk of diabetes mellitus | ||
| (c.) Intervention directed only at single category of individuals within the individual level: patients with HIV | (c.) Intervention directed only at single category of individuals within the individual level: patients with HIV | ||
| (b.) Intervention directed at 2 or more categories of individuals within the individual level: primary care physicians and their patients at‐risk of osteoporosis | (b.) Control intervention directed at 2 or more categories of individuals within the individual level: primary care physicians and their patients at‐risk of osteoporosis | ||
| (c.) Intervention directed only at single category of individuals within the individual level: patients with depression | (c.) Intervention directed only at single category of individuals within the individual level: patients with depression | ||
| (c.) Intervention directed only at single category of individuals within the individual level: tobacco smokers | (c.) Tobacco smokers | ||
| Core dimension 4: the degree of tailoring intended or flexibility permitted across sites or individuals in intervention implementation/application | |||
| a. Fully tailored/flexible b. Moderately tailored/flexible c. Inflexible d. Variesa | (b.) Moderately tailored/flexible: a mailed reminder letter, a free faecal immunochemical test, an automated telephone and text message reminder, an automated telephone and text reminder 2 weeks later (inflexible); personal telephone outreach (flexible) | (b.) Moderately tailored/flexible: computerised reminders, standing orders to give patients home faecal immunochemical test (inflexible); clinician feedback on colorectal cancer screening rates (flexible) | |
| (b.) Moderately tailored/flexible: self‐monitoring via IVR phone calls (inflexible); behaviour change goals, tailored skills training materials, monthly interpersonal counselling calls, and a 12‐month gym membership (flexible) | (c.) Newsletters sent were inflexible | ||
| (c.) Telemedicine system, reminders, sphygmomanometer, weighting scale and pedometer have all been standardised | (d.) Varies across interventions included in the review | ||
| (c.) E‐mail, web‐pages, IVR and SMS inflexible; quote: "Early in the morning, the user receives an e‐mail with instructions to open the day's web page. Each day for 6 weeks, the client opens a web page that is unique to that particular programme day." | (c.) Quote: "The booklet contains general cessation information, a 48‐day quit calendar, a 10‐day quit log, the telephone number of the national quit‐line and links to relevant and open on‐line tobacco cessation | ||
| (b.) Moderately tailored/flexible: nurse used a semi‐standardised protocol. | (d.) Varies across interventions included in the review | ||
| (c.) Clinician prompt, patient prompts, patient outreach all have been highly standardised | (b.) Discussions with patients were moderately tailored/flexible | ||
| (c.) Letters, ATCS calls, point‐of‐care prompts and blinded chart reviews all have been highly standardised | (c.) Blinded chart reviews have been highly standardised | ||
| (b.) Moderately tailored/flexible: medication reconciliation and tailoring, patient education, collaborative care between pharmacists and providers (flexible); and voice messaging reminders (inflexible) | (b.) Usual care was moderately tailored/flexible | ||
| (c.) Nurse care (using evidence‐based guidelines) and IVR monitoring and medications (all not flexible) | (d.) Varies across interventions included in the review | ||
| (c.) Symptom monitoring, either via IVR or by Internet, nurse care and stepped care with analgesics (not flexible) | (d.) Varies across interventions included in the review | ||
| (b.) Patient education, home blood pressure monitoring, home blood pressure measurement reporting to an ATCS (not flexible); and clinical pharmacist management of hypertension with physician oversight (flexible) | (d.) Varies across interventions included in the review | ||
| (b.) Moderately tailored/flexible: quote: "Providers were encouraged to modify the script to suit their personal style." | (d.) Varies across interventions included in the review | ||
| (b.) Moderately tailored/flexible: baseline counselling, regular telephone counselling, physician endorsement in clinic with monthly ATCS calls encouragement, and tailored mailed materials, plus a consult to a Veterans Affairs (VA) weight management programme | (d.) Varies across interventions included in the review | ||
| (c.) An IVR call once a week + a weekly non‐interactive neutral pictorial message sent out as a reminder 4 days after the IVR call + usual care (inflexible) | (c.) Usual care counselling sessions + antiretroviral treatment (inflexible) | ||
| (b.) An advance letter, an ATCS call, and the opportunity to schedule a bone mineral density test (not flexible); specially trained pharmacists educated physicians (flexible). | (d.) Varies across interventions included in the review | ||
| (b.) Moderately tailored/flexible: treatment team education and patient self‐care education, nurse telephone call and IVR programme | (b.) Moderately tailored/flexible: treatment team education and patient self‐care education, nurse telephone call | ||
| (b.) Automated counselling plus nicotine replacement therapy, manuals, and expert system were all moderately tailored/flexible | (c.) Stage‐based self‐help manuals were inflexible | ||
| Core dimension 5: the level of skill required by those delivering the intervention | |||
| a. High level skills b. Intermediate level skills c. Basic skills d. Variesa | (b.) Intermediate level skills required in setting up the IVR phone calls and text reminders, providing outreach calls | (b.) Intermediate level skills required in providing feedback on colorectal cancer screening rates | |
| (b.) Intermediate level skills required in delivering behaviour change goals, setting up the IVR phone calls, producing tailored skills materials and monthly interpersonal counselling calls | (c.) No specialised skills required in writing the newsletter | ||
| (b.) Intermediate level skills required in reviewing patients' reports (physicians), motivating patients (nurses), setting up the reminder calls, emails | (c.) No specialised skills required in providing usual care | ||
| (a.) Creating/writing emails, web‐pages, IVR and SMS requires high level skills | (c.) No specialised skills required in writing the booklet | ||
| (b.) Intermediate level skills required in prerecording automated telephone messages | (d.) Varies across interventions included in the review | ||
| (b.) Intermediate level skills required in e.g. prerecording automated telephone reminders | (c.) No specialised skills required in discussing breast cancer/colorectal cancer screening | ||
| (b.) Intermediate level skills required in e.g. prerecording automated telephone reminders | (c.) No specialised skills required in reviewing charts | ||
| (b.) Intermediate level skills required in e.g. educating patients and/or prerecording telephone reminders | (c.) No specialised skills required in providing usual care | ||
| (b.) Intermediate level skills required from nurses to manage pain and depression | (b.) Intermediate level skills required from nurses to manage pain and depression | ||
| (b.) Intermediate level skills required from nurses to manage musculoskeletal pain | (c.) Basic skills required from primary care physicians | ||
| (b.) Intermediate level skills required from pharmacists and physicians to manage hypertension | (d.) Varies | ||
| (b.) Intermediate level skills required from primary care providers in e.g., recording automated messages, counselling and consulting patients | (c.) Basc level skills required from primary care providers | ||
| (b.) Intermediate level skills required from primary care providers in recording automated messages, counselling and consulting patients | (b.) Intermediate level skills required from primary care providers in providing MOVE | ||
| (b.) Intermediate level skills required in setting up the IVR phone calls + pictorial messages | (c.) Basic skills required | ||
| (a.) Extensive specialised skills required: "The visits were conducted by specially trained pharmacists . . . These pharmacists also underwent a 1‐ day training program focused on osteoporosis and conducted by 2 of the study authors. This program included lectures on the epidemiology, diagnosis, and treatment of osteoporosis. Also, it reviewed principles of academic detailing and the specific goals of this intervention." | (d.) Varies | ||
| (b.) Intermediate level skills required in e.g., prerecording IVR calls | (c.) Basic skills required in delivering education and nurse calls | ||
| (b.) Intermediate level skills required in recording automated messages, providing feedback reports | (c.) Basic skills required | ||
| Core dimension 6: the level of skill required for the targeted behaviour when entering the study by those receiving the intervention in order to meet the intervention's objectives | |||
| a. High level skills b. Intermediate level skills c. Basic skills d. Variesa | (c.) No specialised skills required | (c.) No specialised skills required | |
| (c.) No specialised skills required | (c.) No specialised skills required | ||
| (b.) Intermediate level skills required. Quote: "subjects were trained on use of a computer and the Internet and were introduced to the Web site at the research centre. Telemedicine subjects received instructions on use of an optional telephone communication system". They also received instructions on the use of sphygmomanometer, weighting scale and pedometer | (c.) No specialised skills required | ||
| (b.) Access to the Internet, email and a cell phone on a daily basis was required | (c.) No specialised skills required | ||
| (c.) No specialised skills required | (c.) No specialised skills required | ||
| (c.) No specialised skills required | (c.) No specialised skills required | ||
| (c.) No specialised skills required | (c.) No specialised skills required | ||
| (c.) No specialised skills required | (c.) No specialised skills required | ||
| (c.) No specialised skills required | (c.) No specialised skills required | ||
| (c.) No specialised skills required | (c.) No specialised skills required | ||
| (b.) Patients were instructed about use of the ATCS, and trained on using an electronic blood pressure cuff | (d.) Varies across interventions included in the review | ||
| (d.) Varies across interventions included in the review | (c.) No specialised skills required | ||
| (d.) Varies across interventions included in the review | (c.) No specialised skills required | ||
| (c.) No specialised skills required | (c.) No specialised skills required | ||
| (c.) No specialised skills required | (c.) No specialised skills required | ||
| (c.) No specialised skills required | (c.) No specialised skills required | ||
| (c.) No specialised skills required | (c.) No specialised skills required | ||
| Core dimension 7: the degree of interaction between intervention components/the independence/interdependence of intervention components | |||
| a. High level interaction d. Variesa e. Unclear or unable to assess | (a.) High level interaction; quote: "The majority of faecal occult blood testing completions were accomplished with | (d.) Varies across interventions included in the review | |
| (b.) Moderate level of interaction; quote: "comprised 5 mutually reinforcing components" | (e.) Unclear or unable to assess in individuals receiving usual care | ||
| (b.) Moderate level of interaction of the intervention components: the automated calls and emails and the use of sphygmomanometer to measure blood pressure, weighting scale and pedometer to promote physical activity | (e.) Unclear or unable to assess in patients receiving usual care | ||
| (a.) High level interaction; quote: "further research is necessary to detect the active intervention | (c.) Independent | ||
| (a.) High level interaction; a synergistic effect has been observed | (e.) Unclear or unable to assess in patients receiving no calls | ||
| (a.) High level interaction; quote: "combined interventions are superior to simpler interventions such as reminders" | (c.) Independent | ||
| (a.) There is substantial interaction or inter‐dependency between ATCS calls, a point‐of‐care prompt and mailing of a home colorectal cancer testing kits | (c.) Independent | ||
| (b.) Moderate level of interaction: the intervention components are considered to be mutually reinforcing | (e.) Unclear or unable to assess in patients receiving usual care | ||
| (a.) High level interaction; triggered telephone calls occurred when ATCS monitoring indicated inadequate symptom improvement, non‐adherence to medication, adverse effects, suicidal ideation | (e.) Unclear or unable to assess in patients receiving usual care | ||
| (a.) High level interaction; IVR and nurse calls prompted adjustments in type or dose of analgesics delivered | (e.) Unclear or unable to assess in patients receiving usual care | ||
| (a.) There was a high level interaction between the intervention components: Quote: "This difference was likely due to greater therapy intensification (number and intensity of hypertension medications) in the intervention group" | (e.) Unclear or unable to assess in patients receiving usual care | ||
| (b.) Moderate level of interaction: personal and automatic calls are considered to be mutually reinforcing | (e.) Unclear or unable to assess in patients receiving usual care | ||
| (b.) Moderate level of interaction: personal and automatic calls are considered to be mutually reinforcing | (e.) Unclear or unable to assess in patients receiving usual care | ||
| (c.) The IVR calls and pictorial messages were independent of each other | (e.) Unclear or unable to assess in patients receiving usual care | ||
| (e.) Unable to assess the degree of interaction between physician education and ATCS calls | (e.) Unclear or unable to assess in patients receiving no intervention | ||
| (e.) Unable to assess the degree of interaction between education, nurse calls and IVR calls | (d.) Varies across interventions included in the review | ||
| (c.) Automated calls, nicotine replacement therapy, manuals, and expert system were independent of each other | (e.) Unclear or unable to assess in patients receiving stage‐matched manuals only | ||
| Core dimension 8: the interaction between the intervention and the context or setting | |||
| a. Highly context dependent d. Variesa e. Unclear or unable to assess | (d.) Varies across interventions included in the review | (d.) Varies across interventions included in the review | |
| (e.) Unable to assess the level of interaction between the intervention and the context | (e.) Unable to assess the level of interaction between the intervention and the context | ||
| (e.) Unable to assess the level of interaction between the intervention and the context | (d.) Varies across interventions included in the review | ||
| (e.) Unable to assess the level of interaction between the intervention and the context | (e.) Unable to assess the level of interaction between the intervention and the context | ||
| (e.) Unable to assess the level of interaction between the intervention and the context | (e.) Unable to assess the level of interaction between the intervention and the context | ||
| (d.) Varies across interventions included in the review | (d.) Varies across interventions included in the review | ||
| (d.) Varies across interventions included in the review | (d.) Varies across interventions included in the review | ||
| (d.) Varies across interventions included in the review | (d.) Varies across interventions included in the review | ||
| (e.) Unable to assess the level of interaction between the intervention and the context | (d.) Varies across interventions included in the review | ||
| (e.) Unable to assess the level of interaction between the intervention and the context | (d.) Varies across interventions included in the review | ||
| (d.) Varies across interventions included in the review | (d.) Varies across interventions included in the review | ||
| (d.) Varies across interventions included in the review | (d.) Varies across interventions included in the review | ||
| (d.) Varies across interventions included in the review | (d.) Varies across interventions included in the review | ||
| (e.) Unable to assess the level of interaction between the intervention and the context | (e.) Unable to assess the level of interaction between the intervention and the context | ||
| (e.) Unable to assess the level of interaction between the intervention and the context | (d.) Varies across interventions included in the review | ||
| (e.) Unable to assess the level of interaction between the intervention and the context | (d.) Varies across interventions included in the review | ||
| (e.) Unable to assess the level of interaction between the intervention and the context | (e.) Unable to assess the level of interaction between the intervention and the context | ||
| Core dimension 9: the degree to which the effects of an intervention are modified by factors relating to recipient, provider, or implementation factors | |||
| a. Highly dependent on individual‐level factors d. Variesa e. Unclear or unable to assess | (d.) Varies across interventions included in the review | (e.) Unclear or unable to assess | |
| (b.) Moderately dependent on individual‐level factor, i.e. registered dietitians or personalized progress reports | (e.) Unclear or unable to assess | ||
| (d.) Varies across interventions included in the review | (e.) Unclear or unable to assess | ||
| (c.) Largely independent of individual‐level factors | (c.) Largely independent of individual‐level factors | ||
| (d.) Varies across interventions included in the review | (d.) Varies across interventions included in the review | ||
| (d.) Varies across interventions included in the review | (e.) Unclear or unable to assess | ||
| (d.) Varies across interventions included in the review | (c.) The effects of the blinded chart reviews are not modified substantially by recipient or provider factors | ||
| (d.) Varies across interventions included in the review | (d.) Varies across interventions included in the review | ||
| (b.) Moderately dependent on individual‐level factor, i.e. nurse and pain‐psychiatrist specialist interaction | (e.) Unclear or unable to assess | ||
| (b.) Moderately dependent on individual‐level factor, i.e. nurse management | (e.) Unclear or unable to assess | ||
| (b.) Moderately dependent on individual‐level factor, i.e. clinical pharmacist management with physician oversight | (e.) Unclear or unable to assess | ||
| (e.) Unclear or unable to assess | (e.) Unclear or unable to assess | ||
| (e.) Unclear or unable to assess | (e.) Unclear or unable to assess | ||
| (e.) Unclear or unable to assess | (e.) Unclear or unable to assess | ||
| (b.) The effects of the intervention are modified by one of recipient or factors, e.g. pharmacists' knowledge | (e.) Unclear or unable to assess | ||
| (e.) Unclear or unable to assess | (e.) Unclear or unable to assess | ||
| (e.) Unclear or unable to assess | (e.) Unclear or unable to assess | ||
| Core dimension 10: the length of the causal pathway between the intervention and the outcome it is intended to affect | |||
| a. Pathway variable, long d. Variesa e. Unclear or unable to assess | (d.) Varies across interventions included in the review | (e.) Unclear or unable to assess | |
| (c.) Pathway linear, short. Quote: "The high rates of IVR call engagement and their correlation with greater weight losses" | (e.) Unclear or unable to assess | ||
| (d.) Varies across interventions included in the review | (e.) Unclear or unable to assess | ||
| (d.) Varies across interventions included in the review | (e.) Unclear or unable to assess | ||
| (d.) Varies across interventions included in the review | (e.) Unclear or unable to assess | ||
| (d.) Varies across interventions included in the review | (e.) Unclear or unable to assess | ||
| (d.) Varies across interventions included in the review | (e.) Unclear or unable to assess | ||
| (d.) Varies across interventions included in the review | (e.) Unclear or unable to assess | ||
| (d.) Varies across interventions included in the review | (e.) Unclear or unable to assess | ||
| (d.) Varies across interventions included in the review | (e.) Unclear or unable to assess | ||
| (d.) Varies across interventions included in the review | (e.) Unclear or unable to assess | ||
| (d.) Varies across interventions included in the review | (e.) Unclear or unable to assess | ||
| (d.) Varies across interventions included in the review | (e.) Unclear or unable to assess | ||
| (d.) Varies across interventions included in the review | (e.) Unclear or unable to assess | ||
| (d.) Varies across interventions included in the review | (e.) Unclear or unable to assess | ||
| (d.) Varies across interventions included in the review | (e.) Unclear or unable to assess | ||
aVaries across interventions to be considered for/included in the review.
Dimension 1: lists each component of the intervention and indicate whether they are delivered independently, together in bundles, or as integrated packages. If the intervention comprises 'usual care' plus an additional component, list 'usual care' as one component. Include dose, frequency, and duration of intervention if applicable.
Dimension 2: lists each behaviour or action; consider whether target behaviours are single, repeated, or linked.
Dimension 3: indicates which level(s) are targeted.
Dimension 4: indicates the degree of flexibility including variation in implementation from site to site permitted and/or intervention designed to tailor to individuals or specific implementation settings (there could be a rigid protocol where no variation is permitted or a loose protocol, i.e. most components of the intervention are tailored/flexible).
Dimension 5: indicates the level of skill required Indicate whether the required skills are multidisciplinary, interdisciplinary or single disciplinary. Note: there may be no new skills required.
Dimension 6: describes or lists the skills required
Dimension 7: describes the interaction between intervention components. Note: interaction may not be reported or may be implicit.
Dimension 8: describes the degree to which the effects of the intervention are dependent on the context or setting in which it is implemented.
Dimension 9: indicates the degree of modification.
Dimension 10: describes the causal pathway. It may or may not be linear, and there may be more than one causal pathway. It may be helpful to use diagrams.
Results of the search
The database searches yielded 14,347 records (CENTRAL: N = 1150; MEDLINE: N = 3768; Embase: N = 4714; PsycINFO: N = 2070; CINAHL: N = 435; Web of Science: N = 585; GlobalHealth: N = 679; WHOLIS: N = 291; LILACS: N = 108; ASSIA: N = 547). We identified a further 10 studies through Google searching. All records were imported into Endnote, and after de‐duplication (N = 3600), a total of 10,757 records remained for the first phase of the screening process. Based on title and abstract, we judged 384 records to be potentially eligible and retrieved the full text copies for detailed assessment. Screening the full text of 384 records resulted in inclusion of 132 trials that met our review inclusion criteria (Figure 6).
Included studies
Full details of each trial are presented in Characteristics of included studies; a summary is given below. We included a total of 132 studies in the review. Full data were not available for 64 others, which we present in Ongoing studies.
The included trials were published between 1991 and 2015: 5 had cluster designs (Feldstein 2006; Hess 2013; Franzini 2000; Krum 2013; Stuart 2003), 6 were quasi‐randomised (Dini 1995; Heyworth 2014; Kurtz 2011; Linkins 1994; Siegel 1992; Tanke 1994), and 121 had a parallel‐group design. No CBA or ITS studies met our inclusion criteria. Trial duration ranged from 25 days to 46 months, and study sample sizes varied from 16 to 4,237,821. Most studies took place in the USA (n = 114).
Eighty‐four studies focused on management of long‐term conditions, 41 were preventive healthcare studies, and 7 were specific to neither (appointment reminders/non‐attendance rates) (Figure 7). Table 2 presents further information about participant characteristics. Twenty‐two trials used unidirectional ATCS (102,240 participants), 50 used IVR (4,402,631 participants), 60 used ATCS Plus (154,932 participants). Seventeen studies used ATCS as part of complex/multimodal interventions (9886 participants). The two most common theories underpinning ATCS interventions among the included studies were the transtheoretical model (n = 16) and Bandura's social cognitive theory (n = 21) (Bandura 2001). The most common behaviour change technique was the use of follow‐up prompts (n = 57), followed by self‐monitoring of behaviour (n = 53). Table 3 presents details of other theories or behaviour change techniques used or intervention characteristics, and Table 5 presents information about primary measures and effectiveness of ATCS. Table 1 summarises continuous and dichotomous data related to primary outcomes (from at least two studies in the same category). A description of all 17 studies using complex/multimodal interventions, which by definition had two or more active components and in five studies were delivered as a bundle, appear with ratings of intervention complexity in Table 4.

Subgroups for preventive health and/or management of long term conditions in this review
| Study ID | Typea | Subtype | Participant age (years) | Sex | Ethnicityb | Primary outcome measures | Effectc |
| P | Alcohol misuse | 41‐70 | > 50% M | W | Drinking practices Spending on alcohol | 2 2 (median effect = 2) | |
| P | Immunisation | — | — | — | Immunisation status Cost‐effectiveness | 1 1 (median effect = 1) | |
| P | Immunisation | ≥ 71 | — | — | Herpes zoster immunisations | 1 | |
| P | Immunisation | 0‐21 | — | — | Immunisation status | 2 | |
| P | Immunisation | 0‐21 | M = F (± 3%) | W,B,H | Completion by the age of 24 months of the 4‐3‐1‐3 immunisations series | 2 | |
| P | Immunisation | 0‐21 | — | — | Immunisation status | 2 | |
| P | Immunisation | — | M = F (± 3%) | W,B | Immunisation status | 1 | |
| P | Immunisation | 22‐40 | > 50% F | W,B | Immunisation rate | 2 | |
| P | Immunisation | 0‐21 | M = F (± 3%) | B,H | Immunisation status | 2 | |
| P | Immunisation | 0‐21 | M = F (± 3%) | W,B,H | Immunisation status | 2 | |
| P | Immunisation | 0‐21 | M = F (± 3%) | — | Immunisation status Preventive visit rate | 1 1 | |
| P | Physical activity | 41‐70 | > 50% F | W | 1‐mile walk after the intervention | 5 | |
| P | Physical activity | 41‐70 | > 50% M | — | Self‐reported (diary) walking adherence | 1 | |
| P | Physical activity | 41‐70 | > 50% F | B | Minutes walked per week | 1 | |
| P | Physical activity | 41‐70 | > 50% F | W | Minutes of moderate to vigorous physical activity | 1 | |
| P | Physical activity | ≥ 71 | > 50% M | W,B | Gait speed (usual and rapid) Self‐reported physical activity Function and disability | 2, 1 1 2 (median effect = 2) | |
| P | Physical activity | 41‐70 | > 50% M | W | Homeostasis model assessment of insulin resistance | 2 | |
| P | Physical activity | 41‐70 | > 50% F | W,B | Energy expenditure in moderate‐intensity‐physical activity % meeting recommendations for moderate‐intensity‐physical activity Motivational readiness for physical activity | 2 2 2 (median effect = 2) | |
| P | Physical activity | ≥ 71 | > 50% M | — | Muscle strength Balance Walk distance Mood | 1 1 2 1 (median effect = 1) | |
| P | Screening | 41‐70 | > 50% F | H | Colorectal cancer screening adherence (faecal occult blood testing) | 1 | |
| P | Screening | 41‐70 | > 50% M | W | Receipt of any recommended colorectal cancer screening | 1 | |
| P | Screening | — | > 50% F | — | Screening rate | 2 | |
| P | Screening | — | > 50% F | W,B,A | Mammography adherence | 1 | |
| P | Screening | 41‐70 | M = F (± 3%) | — | Receipt of colorectal cancer screening after 3 months | — | |
| P | Screening | — | > 50% F | W,B,H,A | Chart documentation of breast cancer screening, colorectal cancer screening, or both | 1 | |
| P | Screening | — | > 50% F | W,B | Breast cancer and colorectal cancer screening | 2 | |
| P | Screening | — | > 50% F | W,B,H | Documentation of breast cancer screening, colorectal cancer screening, or both | 1 | |
| P | Screening | 41‐70 | > 50% F | — | Bone mineral density screening after 12 months | 1 | |
| P | Screening | 41‐70 | M = F (± 3%) | W | Completion of faecal occult blood testing at 6 months | 1 | |
| P | Screening | 41‐70 | > 50% F | W,B | Completed mammogram or colorectal cancer screening within 36 weeks of randomisation | 2 | |
| P | Screening | 41‐70 | M = F (± 3%) | W | Colorectal cancer screening | 2 | |
| P | Screening | 41‐70 | > 50% F | — | Bone mineral density testing and/or filling a prescription for a bone active medication | 1 | |
| P | Stress management among caregivers | 41‐70 | > 50% F | W,B | Caregiver's appraisal of the bothersome nature of caregiving Anxiety Depression | 2 2 2 (median effect = 2) | |
| P | Substance use | 41‐70 | > 50% M | W,H | Days using primary drug | 2 | |
| P | Weight management | 41‐70 | > 50% F | B,H | Change in body weight and BMI | 1 | |
| P | Weight management | 22‐40 | > 50% F | B | Change in body weight and BMI | 1 | |
| P | Weight management | 41‐70 | > 50% F | W,B,H,A | Physical activity Dietary habits Weight loss | 2 2 2 (median effect = 2) | |
| P | Weight management | 0‐21 | > 50% M | W,H | BMI z‐score Physical activity and sedentary behaviour Dietary habits Eating disorder symptoms | 2 2 2 2 (median effect = 2) | |
| P | Weight management | 41‐70 | > 50% F | — | Body weight BMI Systolic blood pressure Diastolic blood pressure Plasma glucose Serum triglycerides Serum serum high‐density lipoprotein‐cholesterol Total serum cholesterol SF‐36 EQ‐5D Obesity Assessment Survey | 1 2 2 2 2 1 1 2 2 2 2 (median effect = 2) | |
| P | Weight management | — | — | — | Weight change | 2 | |
| P | Weight management | 0‐21 | > 50% M | W,B | BMI Calorie intake Fat intake Fruit intake Vegetable intake Television‐viewing time | 2 2 2 2 2 2 (median effect = 2) | |
| E | Appointment reminder | — | — | — | Appointment adherence | 1 | |
| E | Appointment reminder | 41‐70 | > 50% M | W | Appointment non‐attendance Preparation non‐adherence | 2 2 (median effect = 2) | |
| E | Appointment reminder | 22‐40 | > 50% F | W,B,H | Attendance rate | 2 | |
| E | Appointment reminder | — | M = F (± 3%) | — | Appointment adherence | 1 | |
| E | Appointment reminder | — | — | — | Appointment adherence | 2 | |
| E | Appointment reminder | 0‐21 | > 50% M | H | Appointment adherence | 1 | |
| E | Appointment reminder | 0‐21 | > 50% F | W,H | Appointment adherence (3‐day interval) | 1 | |
| M | Illicit drugs addiction | 41‐70 | > 50% M | W,B | Patient interest Perceived efficacy Ease of use Treatment satisfaction Retention rate Drug consumption Methadone counselling Coping | 5 5 5 4 4 2 2 2 (median effect = 4) | |
| M | Alcohol consumption | — | — | — | AUDIT score | 1 | |
| M | Alcohol consumption | 41‐70 | > 50% M | B,H | Number of drinks per drinking day | 1 | |
| M | Alcohol consumption | 41‐70 | > 50% M | W | Weekly alcohol consumption | 3 | |
| M | Alcohol consumption | 41‐70 | > 50% M | W,B,H | Proportion of days abstinent Proportion of heavy drinking days Continuous abstinence Drinking problems Coping problems | 1 2 2 2 2 (median effect = 2) | |
| M | Alcohol consumption | 41‐70 | > 50% M | W,B | Self‐reported drinking patterns Blood alcohol content Work and social adjustment scale Obsessive–compulsive drinking scale SF‐36 health survey Drinker inventory of consequences | 2 2 2 2 2 2 (median effect = 2) | |
| M | Alcohol consumption | 41‐70 | M = F (± 3%) | — | Alcohol consumption | 2 | |
| M | Alcohol consumption | 41‐70 | > 50% M | W,B | Number of heavy drinking days per month % days abstinent per month Drinks per drinking day | 2 2 2 (median effect = 2) | |
| M | Alcohol consumption | 41‐70 | > 50% M | W,B | Drinking habits Alcohol craving Post‐traumatic stress disorder symptoms | 2 2 2 (median effect = 2) | |
| M | Asthma | 41‐70 | > 50% F | W | Healthcare utilisation Medication use QoL | 2 2 2 (median effect = 2) | |
| M | Asthma | 0‐21 | M = F (± 3%) | — | Healthcare utilisation | 4 | |
| M | Cancer | 41‐70 | > 50% M | W | Number of symptom threshold events Cumulative distribution of symptom threshold events Differences in mean symptom severity between discharge and follow‐up | 1 2 2 (median effect = 2) | |
| M | Cancer | 41‐70 | > 50% F | W,B | Depression severity Pain severity | 1 1 (median effect = 1) | |
| M | Cancer | 41‐70 | > 50% F | W | Symptom presence, severity, and distress data | 2 | |
| M | Cancer | 41‐70 | M = F (± 3%) | W,B,H | Prevalence of unmet needs | 2 | |
| M | Cancer | 41‐70 | > 50% F | — | Symptom severity | 2 | |
| M | Cancer | 41‐70 | > 50% F | W,B,A | Adherence to medications Symptom severity | 2 1 (median effect = 2) | |
| M | Cancer | 41‐70 | M = F (± 3%) | W,B,H | Symptom burden | 2 | |
| M | Chronic Pain | 41‐70 | > 50% F | W | Pain Function/disability Coping | 1 1 1 (median effect = 1) | |
| M | Chronic Pain | 41‐70 | > 50% M | W | Pain intensity | 1 | |
| M | Chronic obstructive pulmonary disease | 41‐70 | > 50% M | — | Frequency of exacerbations Proportion of patients experiencing 1 or more exacerbations | 2 2 (median effect = 2) | |
| M | Adherence | 0‐21 | > 50% M | B | Comprehensiveness of screening and counselling | 1 | |
| M | Adherence | 41‐70 | > 50% F | W,B,H,A | Medication adherence | 1 | |
| M | Adherence | 0‐21 | — | — | Medication adherence | 1 | |
| M | Adherence | 41‐70 | M = F (± 3%) | W,B,H,A | Medication adherence | 1 | |
| M | Adherence | 0‐21 | — | — | Medication adherence | 1 | |
| M | Adherence | 41‐70 | > 50% M | W,B,H,A | Adherence (completion of all 3 recommended laboratory tests) | 2 | |
| M | Adherence | 41‐70 | M = F (± 3%) | W,B,H,A | Medication adherence | 1 | |
| M | Adherence | 41‐70 | M = F (± 3%) | — | Completion of all recommended laboratory tests | 1 | |
| M | Adherence | ≥ 71 | > 50% F | B | Medication adherence Systolic blood pressure Diastolic blood pressure | 1 2 1 (median effect = 1) | |
| M | Adherence | 41‐70 | > 50% M | W,B | Medication adherence Refill adherence Appointment adherence | 2 2 2 (median effect = 2) | |
| M | Adherence | — | — | — | Medication refill rate | 1 | |
| M | Adherence | 41‐70 | > 50% M | W | Medication adherence | 1 | |
| M | Adherence | ≥ 71 | > 50% F | — | Medication non‐adherence Cognitive assessment | 1 2 (median effect = 2) | |
| M | Adherence | 41‐70 | M = F (± 3%) | W,B,H,A | Adherence rate Therapeutic coverage | 2 2 (median effect = 2) | |
| M | Adherence | 41‐70 | > 50% F | B | Medication adherence Diet Moderate or greater intensity physical activity | 2 1 4 (median effect = 2) | |
| M | Adherence | — | — | — | Medication adherence | 1 | |
| M | Adherence | ≥ 71 | — | — | Medication adherence | 1 | |
| M | Adherence | 41‐70 | M = F (± 3%) | — | HRQLAdherence to statins | 1 | |
| M | Adherence | — | — | — | Medication adherence (refill rate) | 1 | |
| M | Adherence | 41‐70 | — | — | Adherence and adverse events | 1 | |
| M | Adherence | 41‐70 | > 50% M | B | Retinopathy examination | 4 | |
| M | Adherence | 41‐70 | > 50% F | — | 6‐month point prevalence | 1 | |
| M | Adherence | — | — | — | Adherence to medications | 2 | |
| M | Adherence | 41‐70 | > 50% F | W,B,A | Medication adherence | 1 | |
| M | Adherence | 41‐70 | M = F (± 3%) | W,B,A | Medication adherence | 1 | |
| M | Diabetes mellitus | 41‐70 | > 50% M | W | Glycated haemoglobin | 2 | |
| M | Diabetes mellitus | 41‐70 | > 50% F | W,B,H | Maternal blood glucose level Infant birth weight | 2 2 (median effect = 2) | |
| M | Diabetes mellitus | 41‐70 | > 50% F | W,B,H,A | Glycated haemoglobin Medication adherence Quality of life Cost‐effectiveness | 2 2 2 1 (median effect = 2) | |
| M | Diabetes mellitus | 41‐70 | > 50% M | H | Glycated haemoglobin | 4 | |
| M | Diabetes mellitus | — | — | — | Glycated haemoglobin | 1 | |
| M | Diabetes mellitus | 41‐70 | > 50% F | H | Glycated haemoglobin Health distress Global health Hypoglycaemia Hyperglycaemia Activity limitation Fatigue Physical activity levels Communication with physician Glucose monitoring Self‐efficacy Healthcare utilisation | 4 4 4 2 4 4 4 2 4 1 4 2 (median effect = 4) | |
| M | Diabetes mellitus | 41‐70 | > 50% F | W,H | Depression Days cut down on activities because of illness Diabetes‐specific health‐related quality of life Satisfaction with care (English speakers only) General health‐related quality of life (English speakers only) | 1 2 1 1 2 6 1 1 (median effect = 1) | |
| M | Diabetes mellitus | 41‐70 | > 50% M | W,B,H | Glucose monitoring Foot inspection Weight monitoring Medication adherence Glycated haemoglobin Serum glucose levels Diabetic symptoms (all) Hyperglycaemic symptoms Hypoglycaemic symptoms Vascular symptoms Other symptoms Satisfaction with care (summary score) | 1 1 2 4 2 2 1 2 2 2 1 1 (median effect = 2) | |
| M | Diabetes mellitus | 41‐70 | > 50% F | W,B,H,A | Change in self management behaviour (self‐monitoring of blood glucose and self‐monitoring of diabetic foot) | 1 | |
| M | Diabetes mellitus | 41‐70 | > 50% M | — | Glycated haemoglobin Health‐related quality of life (mental) Health‐related quality of life (physical) | 1 1 2 (median effect = 1) | |
| M | Heart failure | 41‐70 | > 50% M | — | All‐cause mortality Re‐hospitalisation Emergency room use (composite outcome) | 1 | |
| M | Heart failure | 41‐70 | > 50% M | W,B | Readmission for any reason or death from any cause | 4 | |
| M | Heart failure | ≥ 71 | > 50% M | — | Packer clinical composite score: death, hospital admission for heart failure, withdrawal from study due to worsening heart failure, 7‐point global health assessment questionnaire | 2 | |
| M | Heart failure | 41‐70 | > 50% M | — | Cardiovascular deaths and hospitalisations (outcomes in isolation included cardiovascular deaths, hospitalisations for heart failure, and time to primary endpoint) | 1 | |
| M | HIV | — | > 50% M | A | Time to virological failure (viral load > 400 copies/mL on 2 consecutive measurements) | 2 | |
| M | Hypercholestorolemia | 41‐70 | > 50% F | W | Total cholesterol reduction | 2 | |
| M | Hypercholesterolemia | 41‐70 | > 50% F | B | Total cholesterol reduction | 2 | |
| M | Hypertension | 41‐70 | > 50% F | W,B,H | Blood pressure control at 6 months | 2 | |
| M | Hypertension | 41‐70 | > 50% F | H | Change in minutes of moderate or greater physical activity Change in systolic blood pressure | 1 2 (median effect = 2) | |
| M | Hypertension | — | — | — | Blood pressure | 1 | |
| M | Hypertension | 41‐70 | > 50% M | W,H | Proportion to achieve guideline‐recommended blood pressure goals Systolic blood pressure Diastolic blood pressure | 2 1 2 (median effect = 2) | |
| M | Hypertension | 41‐70 | > 50% F | — | Systolic blood pressure | 2 | |
| M | Mental health | 22‐40 | > 50% F | W,B | Quality of life (physical scale score and mental scale score) Depression Stress levels Total well‐being | 2, 2 2 2 2 (median effect = 2) | |
| M | Mental health | 22‐40 | > 50% M | W | Yale‐Brown obsessive compulsive scale (YBOCS) score | 1 | |
| M | Mental health | — | — | — | Emotional health Physical health Stress | 1 1 1 (median effect = 1) | |
| M | Obstructive sleep apnoea syndrome | 41‐70 | — | — | Continuous positive airway pressure use | 2 | |
| M | Obstructive sleep apnoea syndrome | 41‐70 | > 50% M | — | Continuous positive airway pressure use | 1 | |
| M | Smoking | 22‐40 | M = F (± 3%) | — | Repeated point abstinence | 1 | |
| M | Smoking | 22‐40 | > 50% F | W,B,H,A | Re‐enrollment into quit line support | 1 | |
| M | Smoking | 22‐40 | > 50% F | W,B | Smoking abstinence | 2 | |
| M | Smoking | 41‐70 | > 50% M | — | Self‐reported abstinence Biochemically confirmed smoking abstinence | 2 4 (median effect = 3) | |
| M | Smoking | 0‐21 | > 50% M | A | Stage of change Self‐efficacy Decisional balance | 5 5 5 (median effect = 5) | |
| M | Smoking | 41‐70 | > 50% M | — | Smoking abstinence | 4 | |
| M | Smoking | 41‐70 | > 50% M | — | Smoking abstinence | 2 | |
| M | Smoking | — | — | — | Smoking abstinence | 2 | |
| M | Smoking | 41‐70 | M = F (± 3%) | W,B,H,A | Biochemically confirmed tobacco abstinence at 6 months | 1 | |
| M | Smoking | 41‐70 | > 50% M | W,B,A | 24‐h point prevalence 7‐d point prevalence 6‐month prolonged abstinence | 2 2 2 (median effect = 2) | |
| M | Spinal cord dysfunction | 41‐70 | > 50% M | W,B,H | Prevalence of pressure ulcers Depression severity Healthcare utilisation | 2 1 2 (median effect = 2) |
aStudy type: E: either prevention or management; M: management of long‐term condition; P: prevention.
bEthnicity: A: American Indian/Alaskan native; B: black/African American; H: Hispanic; W: white.
cEffect: 1: Significant positive; 2: non‐sig positive; 3: significant negative; 4: non‐significant negative; 5: no difference (significant); 6: no difference (non‐significant)
In this section, we generally report the relevant outcomes from individual studies according to the priority (primary, secondary) assigned by the trial authors. However, we reorganise this information in Effects of interventions according to the primary and secondary outcomes identified for this review.
ATCS for preventive healthcare
Forty‐one studies evaluated the effectiveness of ATCS in preventive healthcare; study subtypes included alcohol misuse, immunisations, physical activity, screening, stress management among caregivers, substance abuse, and weight management.
Alcohol misuse
Tucker 2012 evaluated the effectiveness of IVR versus assessment‐only control for supporting natural resolutions in community‐dwelling problem drinkers in the USA (N = 187 participants). The participants' mean age was 45 years, and 63% were male. Participants in the intervention group received verbal feedback about their previous week's goals and set new goals for the following week. They listened to daily educational modules (up to five minutes for 24 weeks) on goal setting, relapse prevention, and support for stable resolution such as social networking, and they received monthly feedback letters summarising calling and drinking patterns. Outcomes were drinking practices and spending on alcohol.
Immunisation
Ten studies, all in the USA, evaluated ATCS for promoting immunisation uptake (Dini 2000; Franzini 2000; Hess 2013; LeBaron 2004; Lieu 1998; Linkins 1994; Nassar 2014; Stehr‐Green 1993; Szilagyi 2006; Szilagyi 2013). Sample sizes ranged from 50 participants in Nassar 2014 to 11,982 participants in Hess 2013. Six studies included more than 1000 participants (Dini 2000; Franzini 2000; LeBaron 2004; Linkins 1994; Szilagyi 2006; Szilagyi 2013).
Interventions generally focused on vaccinations for children (participants were parents), with some studies also focusing on adult immunisation (Hess 2013; Nassar 2014).
Eight studies used unidirectional ATCS (Dini 2000; Franzini 2000; Hess 2013; Linkins 1994; Nassar 2014; Stehr‐Green 1993; Szilagyi 2006; Szilagyi 2013), while LeBaron 2004 used ATCS Plus and Lieu 1998, IVR. Only LeBaron 2004 used communicative functions in addition to automated functions. Healthcare professionals initiated short calls (under two minutes) at a frequency ranging from twice per day in Linkins 1994 to once per month in Hess 2013. Typically, interventions aimed at providing follow‐up prompts.
Several studies had additional intervention arms including elements such as letter reminders or other forms of outreach (Dini 2000; Franzini 2000; LeBaron 2004; Lieu 1998; Szilagyi 2013). Controls included no calls (Dini 2000; Franzini 2000; Hess 2013; Linkins 1994; Stehr‐Green 1993), usual care (LeBaron 2004; Szilagyi 2006; Szilagyi 2013), letter only (Lieu 1998), or health information (Nassar 2014).
The primary outcome for all studies was immunisation status. Other primary outcomes included cost‐effectiveness (Franzini 2000) and preventive visit rate (Szilagyi 2013), while secondary outcomes were satisfaction (Nassar 2014), acceptability and costs (Dini 2000; Lieu 1998), and costs and process evaluation (Szilagyi 2013).
Physical activity
Eight studies, all in the USA, evaluated the effectiveness of ATCS for improving physical activity levels (David 2012; Dubbert 2002; Jarvis 1997; King 2007; Morey 2009; Morey 2012; Pinto 2002; Sparrow 2011). Sample sizes ranged from 71 in David 2012 to 398 in Morey 2009, and mean participant age ranged from 57 years in David 2012 to 71 years in Sparrow 2011.
David 2012 and Pinto 2002 used ATCS Plus; Jarvis 1997, King 2007, and Sparrow 2011, IVR; and Dubbert 2002, Morey 2009, and Morey 2012, unidirectional ATCS. In addition to the customary automated functions, David 2012 used communicative functions and Pinto 2002, supplementary functions. In David 2012, Dubbert 2002, Jarvis 1997, King 2007, Morey 2009, Morey 2012, and Pinto 2002, interventions were underpinned by the transtheoretical model, and in David 2012, King 2007, Morey 2009, Morey 2012, Pinto 2002, and Sparrow 2011, also by social cognitive theory. Participants in four studies could use touch‐tone telephone keypads to communicate with the system (Jarvis 1997; King 2007; Pinto 2002; Sparrow 2011). Call duration ranged from 10 to 30 seconds twice per day in David 2012 to 10 to 15 minutes (weekly) in King 2007.
Two studies had more than one intervention arm: King 2007 included automated advice (IVR) versus human advice arms, whereas Dubbert 2002 assessed 20 nurse‐delivered phone calls versus 10 nurse‐delivered plus 10 automated phone calls. Three studies used multimodal/complex interventions (see Table 4), including elements such as nurse‐delivered phone calls plus clinic‐based counselling (Dubbert 2002); biweekly and then monthly telephone counselling, clinical endorsement of physical activity, and quarterly tailored mailings of progress (Morey 2009); and in‐person baseline counselling, regular telephone counselling, physician endorsement in clinic, tailored mailings, and a consult to a Veterans Affairs (VA) weight management programme (Morey 2012).
In studies with one intervention arm, comparators included no‐coach IVR (David 2012), usual care (Jarvis 1997; Morey 2009), usual care + MOVE programme (Morey 2012), ATCS Plus call promoting healthy eating (Pinto 2002), and attention‐control via IVR (Sparrow 2011). Controls in other trials included attention‐control in King 2007 and no calls in Dubbert 2002.
Six studies measured adherence to physical activity (e.g. minutes or distance walking), usually as a primary outcome (Dubbert 2002; Jarvis 1997; King 2007; Morey 2009; Morey 2012; Pinto 2002; Sparrow 2011). Studies also assessed other outcomes: physical functioning and well‐being (King 2007);quality of life (Dubbert 2002); satisfaction (Jarvis 1997); energy expenditure and motivational readiness for physical activity (Pinto 2002); muscle strength, balance, and mood (Sparrow 2011); ability to complete a one‐mile walk after the intervention, body weight, BMI, waist and hip circumference, and self‐efficacy (David 2012); gait speed (usual and rapid), function and disability, and change in minutes of moderate/vigorous physical activity per week (Morey 2009); and fasting insulin and glucose levels using homeostasis model assessment of insulin resistance (HOMA‐IR), HbA1C, anthropometric measures, health‐related quality of life, and physical function (Morey 2012).
Screening
Thirteen studies evaluated ATCS for improving screening rates in Australia (Corkrey 2005) and the USA (Baker 2014; Cohen‐Cline 2014; DeFrank 2009; Durant 2014; Fiscella 2011; Fortuna 2014; Hendren 2014; Heyworth 2014; Mosen 2010; Phillips 2015; Simon 2010a; Solomon 2007). Sample sizes ranged from 366 in Hendren 2014 to 75,532 in Corkrey 2005, and mean participant age ranged from 40 years in DeFrank 2009 to 69 years in Solomon 2007. In Solomon 2007, 22% of patients were on oral glucocorticoids, while in Baker 2014, 68% had one or more long‐term conditions (LTC).
Five studies used ATCS Plus (Corkrey 2005; Fiscella 2011; Hendren 2014; Heyworth 2014; Solomon 2007); six, IVR (Cohen‐Cline 2014; DeFrank 2009; Durant 2014; Mosen 2010; Phillips 2015; Simon 2010a); and two, unidirectional ATCS (Baker 2014; Fortuna 2014). Corkrey 2005, Fiscella 2011, Hendren 2014, Heyworth 2014, and Solomon 2007 used communicative functions in addition to automated functions. A few studies specified the theoretical model underpinning the intervention: the health belief model (DeFrank 2009), the general model of the determinants of behavioural change (Simon 2010a), or theory of cognitive dissonance (Baker 2014). Typically, short calls (25 seconds to five minutes) provided information on consequences of behaviour in general, planning action, identifying barriers and solving problems as well as providing follow‐up prompts. Several studies had more than one intervention arm: DeFrank 2009 compared telephone calls (IVR) versus enhanced letter reminders; Fortuna 2014 assessed a letter plus unidirectional ATCS versus letter plus unidirectional ATCS Plus prompt versus letter plus personal call; Heyworth 2014 compared usual care plus IVR versus mailing plus usual care; and Phillips 2015 assessed IVR calls versus personalised letter versus IVR plus personalised letter. Several of the studies used multimodal/complex interventions with elements such as mailings, test kits, and personal counselling (see Table 4 for more information). In studies with more than one intervention arm, comparators (the least active arms) included enhanced usual care reminders (DeFrank 2009); reminder letter only (Fortuna 2014; Phillips 2015); or usual care alone (Heyworth 2014). Other controls consisted of usual care or no intervention (calls).
The primary outcome of most trials was documentation of one or more types of screening attendance at 3 to 12 months of the intervention (Baker 2014; Cohen‐Cline 2014; Corkrey 2005; Durant 2014; Fortuna 2014; Fiscella 2011; Hendren 2014; Heyworth 2014; Mosen 2010; Phillips 2015; Simon 2010a). DeFrank 2009 measured repeat adherence to screening, while Solomon 2007 assessed performance of bone mineral density testing or filling a prescription for a bone active medication. Four trials evaluated cost (Baker 2014; Corkrey 2005; Durant 2014; Phillips 2015).
Stress management among caregivers
One study in the USA (N = 100 dyads) evaluated the effectiveness of IVR for stress management in caregivers of people with disruptive behaviours associated with Alzheimer's disease (AD) (Mahoney 2003). The mean age of the caregivers was 63 years. and over 78% of them were women.
The trial compared usual care versus an ATCS Plus intervention with both automated and communicative functions, underpinned by process theory and Pearlin's model of caregiver stress. The intervention aimed to identify barriers/solve problems, plan social support/social change, provide feedback on performance, and tailor and provide follow‐up prompts. The IVR calls (lasting 18 min on average) provided advice on managing stress and their charges' behavioural problems, opportunities to communicate confidentially with nurse specialists or peers (through an online forum), and social conversation based on participants' interests.
The primary outcomes reported were the caregivers' experience of caregiving, anxiety, and depression.
Substance abuse
Aharonovich 2012 (N = 33) compared an ATCS Plus intervention versus motivational interviewing alone for reducing non‐injection drug use in participants (mean age 46, 76% men) with HIV in the USA. Participants were substance users attending HIV clinics.
The intervention consisted of brief counselling based on motivational interviewing aimed at goal setting, providing feedback on performance and teaching to use prompts/cues. Short (one to three min) daily calls used automated and supplementary functions and included personalised questions about the previous day's use of primary drug, amount in dollars spent on that drug, use of other drugs, HIV medication adherence, and feelings of wellness, stress, and overall quality of that day. Participants received immediate feedback and personal calls from a counsellor when they failed to call for 48 hours.
The main outcome was the number of days using the primary drug in the past 30 days.
Weight management
Seven studies based in Greece and the USA evaluated the effectiveness of ATCS in facilitating weight management in adults and/or children (Bennett 2012; Bennett 2013; Estabrooks 2008; Estabrooks 2009;Goulis 2004; Vance 2011; Wright 2013). Sample sizes ranged from 50 (dyads) in Wright 2013 to 365 participants in Bennett 2012, while mean age ranged from 10 years in Wright 2013 to 59 years in Estabrooks 2008. Many participants had co‐morbidities such as diabetes mellitus, metabolic syndrome, hypertension, and depression.
Three studies used ATCS Plus (Bennett 2012; Estabrooks 2009;Vance 2011); and four, an IVR system (Bennett 2013, Estabrooks 2008, Goulis 2004, and Wright 2013). The automated systems in Bennett 2012, Bennett 2013, and Estabrooks 2009 also had communicative functions, and in Vance 2011, they had supplementary functions. In three studies, interventions were underpinned by social cognitive theory (Bennett 2012; Bennett 2013; Wright 2013), and in one the intervention was embedded in Golan's model based on social ecologic theory (Estabrooks 2009). Typically, interventions aimed at planning action, identifying barriers, solving problems, setting goals, planning social support or social change, self‐monitoring of behaviour or behavioural outcome, providing feedback on performance, or providing rewards contingent on successful behaviour. Calls lasted from 1 to 10 min weekly in Estabrooks 2008 to 15 minutes weekly in Goulis 2004.
One study (Bennett 2013) used multimodal/complex interventions. For instance, in addition to IVR calls, the participants also received behaviour change goals, tailored skills training materials, monthly interpersonal counselling calls, and a 12‐month gym membership. Two studies had more than one intervention arm: Estabrooks 2009 included the Family Connections (FC) IVR versus FC ‐ workbook; and Vance 2011 used interactive telephone counselling (ITC) plus control intervention versus online behaviour‐based incentives (BI) plus control intervention versus control intervention plus ITC and BI. In these studies, comparators included FC group in Estabrooks 2009; and written materials and group meetings monthly in Vance 2011. Controls in other trials included usual care in Bennett 2012; Bennett 2013; Goulis 2004; or no intervention in Estabrooks 2008; Wright 2013.
In terms of outcomes, all studies assessed BMI or BMI z‐scores, usually as primary outcomes. Other outcomes were related to weight loss and other anthropometric measures (Bennett 2012; Bennett 2013; Estabrooks 2008; Estabrooks 2009; Goulis 2004; Vance 2011), dietary intake (Estabrooks 2008; Estabrooks 2009; Wright 2013), physical activity (Estabrooks 2008; Estabrooks 2009), television‐viewing time (Wright 2013), blood pressure (Bennett 2012; Goulis 2004; Vance 2011), lipid and glucose biomarkers (Goulis 2004; Vance 2011), health‐related quality of life (Goulis 2004), user satisfaction (Estabrooks 2008), adherence to medication or behavioural change (Bennett 2012; Bennett 2013), and adverse events (Bennett 2012; Bennett 2013).
ATCS for reducing non‐attendance rate (preventive healthcare or management of long‐term conditions)
All seven studies in this category evaluated the effectiveness of ATCS in providing appointment reminders or reducing non‐attendance rates (Dini 1995; Griffin 2011; Maxwell 2001; Parikh 2010; Reekie 1998; Tanke 1994; Tanke 1997). Reekie 1998 took place in the UK, while the rest were in the USA. Sample size ranged from 701 in Tanke 1997 to 12,092 in Parikh 2010, and the mean reported age of participants ranged from 19 years in Tanke 1994 to 63 years in Griffin 2011.
Parikh 2010 compared IVR versus staff reminder or no reminder. Griffin 2011 compared ATCS Plus three or seven days prior to appointment versus nurse‐delivered reminder, and the remaining studies assessed unidirectional ATCS versus no reminder (Dini 1995; Maxwell 2001; Tanke 1997), postal reminder (Maxwell 2001; Reekie 1998), staff reminder (Reekie 1998), automated reminders plus staff and postal reminder (Reekie 1998), and automated reminders plus importance statement, authority statement, and both (Tanke 1994). Only Griffin 2011 used communicative functions in addition to automated functions. Typically, participants received a single, completed (i.e. answered) reminder call before an appointment; these included instructions, opportunities to cancel or confirm appointment, information on consequences of non‐adherence, and prompts for follow‐up. Tanke 1994 and Tanke 1997 drew solely from the health belief model, while Griffin 2011 also consulted the model of social marketing principles.
The primary outcome in all studies was appointment adherence. Griffin 2011 also reported outcomes on appointment non‐attendance and preparation non‐adherence. Secondary outcomes included perceptions about the calls (Griffin 2011), satisfaction (Parikh 2010), attitudes (Tanke 1994), and perceptions of reminders (Tanke 1997).
ATCS for managing long‐term conditions
Eighty‐four studies evaluated the effectiveness of ATCS for managing long‐term conditions, focusing on adherence to medications/laboratory tests (the comparison that provides the most generally applicable evidence across conditions), addiction, alcohol consumption, asthma, cancer, chronic pain, chronic obstructive pulmonary disease, diabetes mellitus, heart failure, HIV, hypercholesterolaemia, hypertension, mental health, obstructive sleep apnoea syndrome, smoking, and spinal cord injury.
Adherence to medications/laboratory tests
Twenty‐five studies, all in North America, evaluated the effectiveness of ATCS in facilitating adherence to medications or laboratory tests (Adams 2014; Bender 2010; Bender 2014; Boland 2014; Cvietusa 2012; Derose 2009; Derose 2013; Feldstein 2006; Friedman 1996; Glanz 2012; Green 2011; Ho 2014; Leirer 1991; Lim 2013; Migneault 2012; Mu 2013; Ownby 2012; Patel 2007; Reynolds 2011; Sherrard 2009; Simon 2010b; Stacy 2009; Stuart 2003; Vollmer 2011; Vollmer 2014). Sample size ranged from 16 in Leirer 1991 to 4,237,821 in Mu 2013, with 10 studies' samples exceeding 1000 (Bender 2014; Cvietusa 2012; Derose 2009; Derose 2013; Green 2011; Patel 2007; Reynolds 2011; Simon 2010b; Vollmer 2011; Vollmer 2014). Mean age ranged from 5 years in Adams 2014 to 80 years in Ownby 2012. Participants were recruited from primary care (Feldstein 2006), or they had a variety of chronic conditions: diabetes mellitus (Derose 2009; Friedman 1996; Ho 2014; Simon 2010b; Vollmer 2014); coronary heart disease and/or cerebrovascular disease (Friedman 1996; Ho 2014; Vollmer 2014); hypertension, hyperlipidaemia, chronic kidney disease, chronic lung disease, peripheral arterial disease (Ho 2014; Vollmer 2014); or cognitive (memory) impairment (Ownby 2012).
Nine studies assessed an ATCS Plus system: in Cvietusa 2012, versus an unspecified control; in Derose 2009, versus no intervention, letter, letter plus call, letter plus call plus letter, or call plus letter; in Derose 2013, Sherrard 2009, Simon 2010b, and Vollmer 2011, versus usual care; in Stacy 2009, versus a generic enhanced care package (single IVR call plus self‐help booklet); and in Vollmer 2014, versus a less intensive IVR intervention. Participants in Ho 2014 received usual care or a complex/multimodal intervention including medication reconciliation and tailoring, patient education (through pharmacist telephone calls when requested by the patient), and collaborative care between pharmacists and providers (primary care providers or cardiologists).
Fifteen studies compared an IVR system: in Adams 2014, versus a less intensive IVR intervention (single automated call); in Bender 2010, Leirer 1991, and Mu 2013, versus no intervention; in Bender 2014, Boland 2014, Friedman 1996, Glanz 2012, Green 2011, Migneault 2012, Patel 2007, and Reynolds 2011, versus usual care; and in Feldstein 2006, versus electronic medical records or pharmacy team outreach. Stuart 2003 compared a multimodal/complex intervention versus education or education plus nurse calls, and Vollmer 2014 compared IVR to IVR Plus.
Two studies assessed unidirectional ATCS: Lim 2013 compared it to no intervention and Ownby 2012 compared automated reminding versus tailored information or no intervention.
Only four studies used supplementary functions in addition to automated functions (Derose 2009; Derose 2013; Stacy 2009; Vollmer 2014), while six studies also used communicative functions (Cvietusa 2012; Ho 2014; Sherrard 2009; Simon 2010b, Vollmer 2011; Vollmer 2014). Interventions were based on the health belief model (Bender 2010; Stacy 2009), the chronic care model (Stacy 2009), social cognitive theory (Friedman 1996; Migneault 2012), transtheoretical model (Migneault 2012); motivational interviewing (Migneault 2012); self‐regulation theory, and reflective listening (Stacy 2009).
Typically, interventions were aimed at providing information on consequences of behaviour in general, planning action, identifying barriers and solving problems as well as providing follow‐up prompts, tailoring, prompting self‐monitoring of behaviour, providing rewards contingent on effort or progress towards behaviour or providing information on consequences of behaviour. Call duration ranged from single, 40‐second calls in Derose 2009 and Derose 2013 to 29.3 minutes in Adams 2014.
Studies measured medication adherence in a variety of ways: medication possession ratio (MPR) (Bender 2014; Patel 2007), refill rates (Bender 2010; Boland 2014; Cvietusa 2012; Derose 2013; Friedman 1996; Glanz 2012; Green 2011; Ho 2014; Lim 2013; Migneault 2012; Mu 2013; Ownby 2012; Reynolds 2011; Stuart 2003; Vollmer 2011; Vollmer 2014), or other methods (Adams 2014; Sherrard 2009). In contrast, Leirer 1991 measured non‐adherence by calculating the time difference between the participant's self‐specified time for taking the medication and the actual time they took to scan the appropriate bar code label; investigators also measured cognitive assessment using the Schaie‐Thurstone adult mental abilities test. Eight studies measured other indicators related to healthcare usage (e.g. completion of recommended tests, visits to the emergency room) or coverage (Adams 2014; Bender 2014; Derose 2009; Feldstein 2006; Lim 2013; Simon 2010b; Sherrard 2009; Vollmer 2011). Five studies assessed participant and/or physician satisfaction (Adams 2014; Cvietusa 2012; Friedman 1996; Sherrard 2009; Stuart 2003). Four studies measured achievement of behavioural or clinical targets such as blood pressure, as both primary and secondary outcomes (Friedman 1996; Ho 2014; Migneault 2012; Vollmer 2014). Finally, Bender 2010 used the asthma control test, asthma quality of life questionnaire, and beliefs about medications questionnaire; Sherrard 2009 measured a composite outcome of adherence and adverse events, and Stacy 2009 reported outcome on point prevalence persistency.
Illicit drugs addiction
Moore 2013 (N = 36) evaluated ATCS Plus versus usual care for opioid dependency in participants (mean age 41, 58% men) receiving methadone maintenance and continuing to use illicit drugs. The study took place in the USA and aimed to prompt review of behavioural goals, prevent relapses, plan coping, or manage stress. Underpinned by social cognitive theory, the intervention used automated and communicative functions to provide patients with immediate assistance, training, and support and self‐monitoring in their own environment. Calls lasted an average of nine minutes daily for 28 days. Outcomes included patient interest, perceived efficacy, treatment satisfaction, retention rate, self‐reported drug use, methadone counselling, ease of use and coping skills.
Alcohol consumption
Eight studies evaluated the effectiveness of ATCS for managing alcohol intake: seven in the USA (Hasin 2013; Helzer 2008; Litt 2009; Mundt 2006; Rose 2015; Rubin 2012; Simpson 2005) and one in Sweden (Andersson 2012). Sample sizes ranged from 47 participants in Rubin 2012 to 1423 participants in Andersson 2012, and mean participant age ranged from 46 years in Hasin 2013 and Simpson 2005 to 57 years in Rubin 2012. The mean duration of alcoholism was over 10 years in all studies, and participants in Hasin 2013 were HIV positive.
Three studies were primarily interested in IVR: Andersson 2012 was a four‐arm trial comparing a single IVR call, a single online intervention, repeated IVR calls, and repeated online interventions; Rubin 2012 compared IVR versus an information pamphlet; and Simpson 2005 compared daily or weekly calls with a no‐intervention control. The remaining five compared ATCS Plus: to advice/education (Hasin 2013), usual care (Rose 2015), or other interventions or control (Helzer 2008; Litt 2009; Mundt 2006). Litt 2009 compared ATCS Plus versus a packaged cognitive behavioural therapy (CBT) intervention via IVR. Mundt 2006 had three arms: daily IVR with personal follow‐up on noncompliant callers (i.e. ATCS Plus), daily IVR without follow‐up, and usual care. Helzer 2008 had four arms: ATCS Plus with feedback, ATCS Plus with feedback and financial compensation; automated daily phone calls (ATCS only); and no calls, with a brief intervention and standard care. Systems in Litt 2009 and Helzer 2008 had supplementary functions, and those in Hasin 2013, Mundt 2006, and Rose 2015 had both communicative and supplementary functions in addition to the automated ones. The intervention was underpinned by CBT in three studies (Litt 2009; Mundt 2006; Rose 2015) and by motivational interviewing (MI) in two (Hasin 2013; Rubin 2012). The interventions were aimed at goal setting and motivational interviewing (Hasin 2013; Rubin 2012); providing feedback on performance (Andersson 2012); training of emotional control, prompting self‐monitoring of behaviour, preventing relapses/coping planning, and/or managing stress (Litt 2009; Mundt 2006; Rose 2015); prompting self‐monitoring of behaviour (Helzer 2008; Simpson 2005). The duration of intervention ranged from one month in Simpson 2005 to six months in Helzer 2008, Mundt 2006, and Rubin 2012, and it was delivered daily in Hasin 2013, Helzer 2008, Mundt 2006, Rose 2015, and Simpson 2005.
Primary outcomes included the alcohol use disorders identification test (AUDIT) score (Andersson 2012); proportion of days abstinent, proportion of heavy drinking days, continuous abstinence, drinking problems, and coping problems (Litt 2009); drinking days, heavy drinking days, and total drinks consumed (Mundt 2006); drinking habits, alcohol craving, and post‐traumatic stress disorder symptoms (Simpson 2005); number of drinks per drinking day in the last 30 days (Hasin 2013); weekly alcohol consumption (Helzer 2008); alcohol consumption (Rose 2015); and number of heavy drinking days per month, percent days abstinent per month, drinks per drinking day (Rubin 2012). Secondary outcomes included participant perceptions of the system (Rose 2015).
Asthma
Two studies evaluated ATCS for managing asthma (Vollmer 2006; Xu 2010).
Vollmer 2006 (N = 6948) compared ATCS Plus with automated and communicative functions versus staff calls or usual care in adults (mean age 52 years) in the USA, Healthcare professionals initiated three IVR calls lasting under 10 minutes, five months apart. The system asked questions related to healthcare utilisation, and participants received tailored feedback. Participants at high risk of exacerbations were flagged up and their primary care provider was alerted, triggering a follow‐up contact. In addition, the IVR system assigned a primary care provider to participants who did not regularly visit a consistent provider for asthma care. Outcomes included healthcare utilisation, asthma control, medication use, quality of life, and acceptability.
Xu 2010 (N = 121) studied children (mean age 7 years) in Australia, comparing a nurse support group versus an IVR system where participants received calls twice a week that asked questions about asthma symptoms and medication use. Based on touch‐tone responses, they received educational messages, appropriate messages from the asthma management plan, and medication reminders. Primary care physician had access to the reports generated by the IVR system. Outcomes included healthcare utilisation, medication use, health‐related quality of life, and cost.
Cancer
Seven studies, all in the USA, evaluated ATCS for helping cancer patients (Cleeland 2011; Kroenke 2010; Mooney 2014; Sikorskii 2007; Siegel 1992; Spoelstra 2013; Yount 2014). Sample sizes ranged from 79 participants in Cleeland 2011 to 437 participants in Sikorskii 2007, and mean age from 57 years in Sikorskii 2007 to 61 years in Yount 2014. Participants in Kroenke 2010 and Mooney 2014 had a variety of other co‐morbidities, and participants in Spoelstra 2013 were taking antineoplastic medications.
Five studies assessed an ATCS Plus system, comparing it to to a less intensive (IVR monitoring) intervention (Cleeland 2011), usual care (Kroenke 2010; Yount 2014), attention only via IVR (Mooney 2014), and a less intensive (adherence only) IVR intervention (Spoelstra 2013), By contrast, Siegel 1992 compared IVR versus a research interview by an experienced clinician, and Sikorskii 2007 compared it to telephone calls by specially trained nurses. In addition to automated functions, Kroenke 2010 and Spoelstra 2013 used communicative functions; Cleeland 2011 and Yount 2014, supplementary functions; and Mooney 2014, both. Kroenke 2010 used a multimodal/complex intervention (symptom monitoring by a nurse and medications) and was underpinned by the three‐component model, whereas Spoelstra 2013 had a CBT basis.
Typically, interventions were aimed at prompting self‐monitoring of behaviour and behavioural outcome, prompting review of behavioural goals, providing instructions on how to perform the behaviour, tailoring and teaching to use prompts/cues. The frequency of calls ranged from daily in Mooney 2014 to twice a week and then twice a month in Kroenke 2010.
Primary outcomes were symptom threshold events, cumulative distribution of symptom threshold events, differences in mean symptom severity between discharge and follow‐up (Cleeland 2011); depression and pain severity (Kroenke 2010); symptom severity, distress, and burden (if a symptom was present) (Mooney 2014; Sikorskii 2007; Spoelstra 2013; Yount 2014); the prevalence of unmet needs (Siegel 1992); and adherence to medications (Spoelstra 2013). Secondary outcomes included health‐related quality of life, disability, healthcare use (outpatient physician visits), and co‐interventions (depression treatments) in Kroenke 2010; system usability and acceptability in Mooney 2014; and health‐related quality of life, treatment satisfaction, symptom management barriers, and self‐efficacy in Yount 2014.
Chronic pain
Kroenke 2014 (N = 250) and Naylor 2008 (N = 55) evaluated ATCS versus usual care for managing chronic pain in adults (mean age 55 years and 46 years, respectively) in the USA.
Naylor 2008 used an IVR intervention underpinned by CBT, aiming to identify barriers; solve problems; prompt practice, self‐monitoring of behaviour, or imagery; and provide feedback on performance and follow‐up prompts. The calls lasted 3 to 16 minutes and consisted of daily self‐monitoring questionnaire that assessed coping, perceived pain control, mood, medication use, and stress. Participants were able to access a verbal review of eight different pain management skills they learned during the 11 weeks of CBT (relaxation response, diaphragmatic breathing, positive self‐talk, cognitive restructuring, activity‐rest pacing, distraction techniques, reappraisal of pain, and defusing catastrophising). Once a month the group therapist analysed computer‐collated patient‐specific data and called the IVR to record a personalised message with advice and encouragement for each participant. Outcomes were pain (total pain experience, pain intensity), function/disability, and coping.
Kroenke 2014 used an ATCS Plus system and multimodal/complex intervention (with nursing care and analgesics) with automated and communicative functions, aiming at tailoring and self‐monitoring of behavioural outcome. The calls were scheduled weekly for the first month, every other week for months 2 and 3, and monthly for months 4 through 12. Investigators assessed pain, anxiety, depression, the degree of improvement; analgesic adverse effects, adherence, and whether a medication change was desired. Primary outcomes included pain intensity, while secondary outcomes included difference in response rates, and mean brief pain inventory interference and pain severity scale scores, at 12 months.
Chronic obstructive pulmonary disease (COPD)
Halpin 2009 (N = 79) compared ATCS versus no intervention for managing COPD. The trial took place in the UK. Participants had a mean age of 69, were mostly men (74%), and were taking long and short‐acting muscarinic antagonists as well as short‐acting β 2‐agonists. Investigators tested an ATCS Plus system with automated, communicative, and supplementary functions, aiming at prompting self‐monitoring of behavioural outcomes, teaching to use prompts/cues; and using follow‐up prompts. Participants received weekly automated alert calls with tailored advice, an information pack with important information about their condition, thermometers to monitor the temperature in the bedroom and living room, and advice on recognising early symptoms of an exacerbation. Participants also completed a daily diary comprising the EXACT questionnaire plus additional questions such as the colour of their phlegm, presence of symptoms of a cold or flu, visit to a doctor or nurse on that day for breathing problems or a cold, and need for the study team to contact them. The responses to these questions were used as a trigger to contact the participant to determine if an exacerbation was starting.
The primary outcomes were frequency of exacerbations and proportion of patients experiencing one or more exacerbations. Secondary outcomes included changes in health status.
Diabetes mellitus
Ten studies evaluatedATCS for managing diabetes mellitus (Graziano 2009; Homko 2012; Katalenich 2015; Khanna 2014; Kim 2014; Lorig 2008; Piette 2000; Piette 2001; Schillinger 2009; Williams 2012). With the exception of Williams 2012, which took place in Australia, all the studies were in the USA. Sample sizes ranged from 75 participants in Khanna 2014 to 417 participants in Lorig 2008, and mean age ranged from 30 years in Homko 2012 to 62 years in Graziano 2009.
Participants in five studies had a BMI above 30 kg/m2 (Homko 2012; Piette 2000; Piette 2001; Schillinger 2009; Williams 2012); they were pregnant in Homko 2012 (33 weeks or less) and had elevated blood pressure and cholesterol levels in Khanna 2014. In Kim 2014, 46% of participants were diagnosed with psychiatric illnesses; and 28% had been hospitalised in the past year.
Seven studies compared an ATCS Plus system versus usual care (Katalenich 2015; Khanna 2014; Kim 2014; Lorig 2008; Piette 2000; Piette 2001; Schillinger 2009), and in the case of Schillinger 2009, also versus support, education, and patient activation. The remaining studies compared an IVR system with usual care (Homko 2012; Graziano 2009; Williams 2012). In addition to automated functions, five studies used communicative functions (Kim 2014; Lorig 2008; Piette 2000; Piette 2001; Schillinger 2009), one study used supplementary functions (Khanna 2014), and one study used both communicative and supplementary functions (Katalenich 2015). Three studies were underpinned by social cognitive theory (Piette 2000; Piette 2001; Schillinger 2009) and one was based on the chronic care model (Schillinger 2009). Typically, interventions were aimed at planning action, setting goals, identifying barriers and solving problems, prompting self‐monitoring of behaviour and/or behavioural outcomes, providing feedback on performance, tailoring and providing follow‐up prompts. Call duration and frequency ranged from 90 seconds monthly in Lorig 2008 to 5 to 20 minutes weekly in Williams 2012.
Primary outcomes included glycated haemoglobin (Graziano 2009; Katalenich 2015; Khanna 2014; Kim 2014; Lorig 2008; Piette 2001; Williams 2012); blood glucose level and infant birth weight (Homko 2012); health‐ or diabetes‐related quality of life (Katalenich 2015; Piette 2000; Williams 2012); self‐efficacy (Lorig 2008; Piette 2000); medication adherence and cost‐effectiveness (Katalenich 2015); health distress, global health, hypoglycaemia, hyperglycaemia, activity limitation, fatigue, glucose monitoring, and healthcare utilisation (Lorig 2008); depression, anxiety, days in bed because of illness, days cut down on activities because of illness (Piette 2000); glucose monitoring, foot inspection, weight monitoring, medication use, diabetic symptoms (all), and satisfaction with care (Piette 2001); and change in self‐management behaviours (consisting of the four domains/sub‐scales: self‐monitoring of blood glucose and self‐monitoring of diabetic foot, diet and exercise) (Schillinger 2009).
Secondary outcomes included self‐monitoring of blood glucose frequency (Graziano 2009); systolic blood pressure, diastolic blood pressure, BMI, waist circumference, total cholesterol, triglycerides, high‐density lipoproteins, and low‐density lipoproteins (Khanna 2014); outpatient speciality services utilisation (Piette 2001); and behavioral, functional, and metabolic outcomes (Schillinger 2009).
Heart failure
Four studies evaluated ATCS versus usual care for reducing healthcare utilisation in people with heart failure (Capomolla 2004; Chaudhry 2010; Krum 2013; Kurtz 2011); Kurtz 2011 had a third arm implementing a multidisciplinary team approach during visits to the heart failure clinic. Trials took place in the USA (Chaudhry 2010), Australia (Krum 2013), France (Kurtz 2011), and Italy (Capomolla 2004). Sample sizes ranged from 138 participants in Kurtz 2011 to 1653 participants in Chaudhry 2010, while mean age ranged from 57 years in Capomolla 2004 to 73 years in Krum 2013. Participants in Chaudhry 2010 and Krum 2013 had several co‐morbidities such as coronary artery disease, chronic kidney disease, chronic obstructive pulmonary disease, diabetes mellitus, and hypertension.
Three studies used an ATCS Plus system (Chaudhry 2010; Capomolla 2004; Krum 2013), while Kurtz 2011 used an IVR system. Chaudhry 2010 and Capomolla 2004 used communicative functions in addition to automated ones, and Krum 2013 used supplementary functions as well. Typically, interventions were aimed at prompting self‐monitoring of behaviour and/or behavioural outcome as well as tailoring and providing follow‐up prompts. The mean call duration, reported in one study (Kurtz 2011) was 48 seconds (weekly). In Chaudhry 2010 and Capomolla 2004, participants placed calls once a day; and in Krum 2013, participants or staff called once a month. The duration of intervention ranged from six months in Chaudhry 2010 to 24 months in Kurtz 2011.
Capomolla 2004 reported a composite primary outcome considering rehospitalisation, cardiac mortality and emergency room use; outcomes in isolation included hospitalisation for heart failure, cardiac mortality, all‐cause mortality, all‐cause hospitalisation (chronic heart failure, cardiac cause and other cause) and emergency room use. Chaudhry 2010 measured readmission for any reason or death from any cause, and Kurtz 2011 reported cardiovascular deaths and hospitalisation for heart failure, both in isolation and as a composite or adverse events. Finally, Krum 2013 reported the Packer clinical composite score (death, hospital admission for heart failure, withdrawal from study due to worsening heart failure, seven‐point global health assessment questionnaire) as its primary outcome. For the purposes of this review, we separated these component outcomes and reported data for each of the following individually: all‐cause mortality, hospitalisation for heart failure, all‐cause hospitalisation and global health (hospitalisation for heart failure or for any cause were identified as secondary outcomes by this study). Secondary outcomes also included intervention adherence in Capomolla 2004; and hospitalisation for heart failure, number of days in the hospital, number of hospitalisations, and adverse events in Chaudhry 2010.
HIV/AIDS
Shet 2014 (N = 631) evaluated ATCS versus usual care for managing HIV in India. The trial used an IVR intervention underpinned by the theory of planned behaviour, which aimed at goal setting, prompting self‐monitoring of behaviour, providing feedback on performance and relapse prevention/coping planning. Intensity and duration of calls was weekly for 24 months. In addition to IVR calls, the multimodal/complex intervention included a weekly non‐interactive neutral pictorial message sent out as a reminder four days after the IVR call plus usual care that consisted of to three counselling sessions and antiretroviral treatment. Primary outcomes were time to virological failure (viral load > 400 copies/mL on two consecutive measurements), and secondary outcomes were medication adherence (pill count), death rate, and attrition rate.
Hypercholesterolaemia
Two studies(total N = 238) evaluated ATCS versus usual care for managing hypercholesterolaemia in the USA (Hyman 1996; Hyman 1998). Mean participant age was 48 years in Hyman 1996 and 57 years in Hyman 1998. Participants in Hyman 1998 had a mean BMI greater than 30 kg/m2; and 58% of them had had history of smoking.
Hyman 1996 used an IVR system with daily interaction, and Hyman 1998 used an ATCS Plus intervention, underpinned by social cognitive theory, with two to three minute calls twice weekly. Interventions aimed at prompting self‐monitoring of behaviour, tailoring, and providing follow‐up prompts. The primary outcome reported in both studies was total cholesterol reduction. Secondary outcomes included acceptability of the IVR system (Hyman 1996), self‐efficacy, dietary knowledge, and fat intake scale (Hyman 1998).
Hypertension
Five studies evaluated ATCS for managing hypertension; one took place in Honduras/Mexico (Piette 2012), and four were in the USA (Bove 2013; Dedier 2014; Harrison 2013; Magid 2011). Sample size ranged from 166 participants in Bove 2013 to 64,773 participants in Harrison 2013, while mean age ranged from 58 years in Dedier 2014 and Piette 2012 to 66 years in Magid 2011. Participants in Bove 2013,Magid 2011, and Harrison 2013 were diagnosed with diabetes mellitus.
Bove 2013 and Magid 2011 compared multimodal/complex interventions including an ATCS Plus system with additional communicative (and in the case of Bove 2013, also supplementary) functions versus usual care. In addition to ATCS, participants in Bove 2013 received a sphygmomanometer, a weighting scale if needed, and a pedometer, whereas in Magid 2011 they also received patient education, home blood pressure monitoring, and clinical pharmacist management of hypertension with physician oversight in addition to usual (standard) care. Piette 2012 compared an ATCS system with communicative functions to primary care and education. Dedier 2014 assessed an IVR system underpinned by social cognitive theory versus primary care and education, while Harrison 2013 evaluated a unidirectional ATCS versus usual care. Interventions were typically aimed at planning action and setting goals, prompting self‐monitoring of behavioural outcome, providing rewards contingent on effort or progress towards behaviour, setting graded tasks and tailoring, prompting self‐monitoring of behaviour and providing follow‐up prompts or providing feedback on performance. Call duration was typically up to 10 min (weekly) in Magid 2011 and Dedier 2014. Call frequency was biweekly in Bove 2013.
All studies monitored blood pressure as a primary outcome, while Dedier 2014 also assessed change in minutes of moderate or intensive physical activity. Secondary outcomes included health status, depression, satisfaction, and medication‐related problems in Piette 2012 and medication adherence in Magid 2011.
Mental health
Three studies in the USA evaluated ATCS for managing mental health problems (Farzanfar 2011; Greist 2002; Zautra 2012). Sample sizes ranged from 73 in Zautra 2012 to 218 in Greist 2002, while mean participant age was 39 years in Farzanfar 2011 and Greist 2002 and 54 years in Zautra 2012. Mental problems included mild to moderate depression (Zautra 2012), social phobia and generalised anxiety disorder (9% each in Greist 2002).
Farzanfar 2011 compared an IVR counselling intervention versus advice only for facilitating social comparison, prompting self‐monitoring of behaviour, providing instruction on how to perform the behaviour, tailoring, and providing follow‐up prompts. The included TLC‐Detect system aimed at identifying undiagnosed and untreated mental health problems, with an initial 30 to 90 minute screening call and monthly follow‐up calls. Greist 2002 assessed a computer‐driven ATCS Plus system (via IVR) with supplementary functions, underpinned by the theory of behavioural change, versus clinician‐guided behaviour therapy or relaxation‐only therapy. The trial's focus was relapse prevention/coping planning; participants called 12 or more times to record a message for a behavioural therapist, who responded within 72 hours. Final steps also included barrier identification, problem solving, and relapse prevention techniques. In addition, participants also received a programmed workbook. The last study, Zautra 2012, compared two unidirectional ATCS interventions (one for personal control/mastery and the other for mindful awareness/acceptance), underpinned by social cognitive theory, versus a healthy lifestyle control. The focus of the study was emotional control training and planning of social support/social change.
The primary outcomes included quality of life (physical health scale and mental health scale), total depression, perceived stress levels/score, and total well‐being (WHO‐5) in Farzanfar 2011; Yale‐Brown obsessive compulsive scale in Greist 2002; and depression and stress in Zautra 2012. Secondary outcomes included clinical and patient global impressions and depression (Hamilton rating scale for depression) in Greist 2002 and satisfaction in Greist 2002 and Farzanfar 2011.
Obstructive sleep apnoea syndrome (OSAS)
Two studies in the USA evaluated ATCS for managing OSAS (DeMolles 2004; Sparrow 2010). Sample sizes were 30 and 250 participants, respectively, with mean ages of 46 years and 55 years. Both studies included participants who were obese (BMI greater than 35 kg/m2), and 82% of participants in Sparrow 2010 were men.
Both studies assessed an IVR system with automated functions. DeMolles 2004 compared once weekly calls (for two months) to usual care for barrier identification/problem solving, prompting review of outcome goals or self‐monitoring of behaviour, teaching to use prompts/cues and using of follow‐up prompts. Sparrow 2010 compared an IVR intervention underpinned by social cognitive theory and motivational interviewing consisting of once weekly (for the first month) then once monthly (up to one year) calls versus attention placebo control. The intervention aimed at barrier identification/problem solving, motivational interviewing, prompting review of behavioural goals, self‐monitoring of behaviour, providing feedback on performance, tailoring, teaching to use prompts/cues and using follow‐up prompts.
The primary outcome in both studies was continuous positive airway pressure (CPAP) use. Secondary outcomes included the sleep symptoms checklist, functional outcomes of sleep questionnaire (DeMolles 2004; Sparrow 2010), and depression (Sparrow 2010).
Smoking
Ten studies evaluated ATCS for managing tobacco dependence: five studies were conducted in the USA (Carlini 2012; Ershoff 1999; Regan 2011; Rigotti 2014; Velicer 2006), three in Canada (McNaughton 2013; Reid 2007; Reid 2011), one in Norway (Brendryen 2008), and one in Taiwan (Peng 2013). Sample sizes ranged from 44 in McNaughton 2013 to 2054 in Velicer 2006, and mean participant age ranged from 20 years in Peng 2013 to 54 years in Reid 2007. In Carlini 2012, 43% of participants had one or more chronic conditions. Participants in Reid 2007 were diagnosed with acute coronary syndrome and were hospitalised prior to the smoking cessation intervention.
Seven studies used an ATCS Plus system (Brendryen 2008; Carlini 2012; Peng 2013; Reid 2007; Reid 2011; Regan 2011; Rigotti 2014), one of which was a multimodal/complex intervention where participants received emails, web pages, SMS and an access to craving helpline (Brendryen 2008). Three studies used an IVR system (Ershoff 1999; McNaughton 2013; Velicer 2006), two of which had three arms: Ershoff 1999 compared the IVR intervention versus motivational interviewing or booklet only control, whereas Velicer 2006 compared three multimodal/complex interventions: nicotine replacement therapy (NRT) plus manual, NRT plus manual plus expert system, and NRT plus manual plus expert system plus IVR. Comparators in other studies included self‐help intervention (booklet) (Brendryen 2008), inactive IVR call (Carlini 2012; Peng 2013; Regan 2011), usual care (Reid 2007; Reid 2011; Rigotti 2014), and no calls (McNaughton 2013).
In addition to automated functions, four studies used communicative functions (Carlini 2012; Reid 2007; Reid 2011; Regan 2011), two used supplementary functions (Brendryen 2008; Peng 2013), and one used both (Rigotti 2014). Theoretical underpinnings included cognitive behavioural theory (Brendryen 2008; Peng 2013), motivational interviewing (Brendryen 2008; Peng 2013), relapse prevention and self‐regulation theory (Brendryen 2008), social cognitive theory (Brendryen 2008), and transtheoretical model of change (Peng 2013; Ershoff 1999; Velicer 2006). Interventions were typically aimed at planning action and setting goals, prompting self‐monitoring of behavioural outcome, providing rewards contingent on effort or progress towards behaviour, providing information on consequences of behaviour in general, setting graded tasks, tailoring, prompting self‐monitoring of behaviour and providing follow‐up prompts, providing feedback on performance, identifying barrier/solving problems, motivating individuals, planning social support/social change or preventing relapses/planning coping. The duration of intervention ranged from three calls only in Reid 2007 to biweekly IVR calls for two years in McNaughton 2013. The call duration ranged from 3 to 5 minutes in McNaughton 2013 to 18.9 minutes in Peng 2013.
Primary outcome measures included smoking abstinence rates (McNaughton 2013; Regan 2011; Reid 2007; Reid 2011; Velicer 2006), repeated point abstinence (Brendryen 2008); re‐enrolment into quit line support (Carlini 2012); biochemically confirmed smoking abstinence (Ershoff 1999; McNaughton 2013; Rigotti 2014); stage of change, self‐efficacy, and decisional balance (Peng 2013). Secondary outcome measures included nicotine replacement therapy adherence, self‐efficacy and nicotine dependence (averaged score) in Brendryen 2008; satisfaction with the intervention in Ershoff 1999; medication use in Regan 2011; and self‐reported tobacco abstinence and costs in Rigotti 2014.
Spinal cord dysfunction
One study (N = 142) compared an IVR system versus usual care for managing spinal cord injury or multiple sclerosis in the USA (Houlihan 2013). Participants' mean age was 48 years; they were predominantly men (61%) who had had their condition for an average of 11.7 years. At baseline, they were also diagnosed with pressure ulcers or depression. The intervention consisted of weekly calls lasting an average of 4.12 minutes, and it was underpinned by the transtheoretical model of change and social cognitive theory. The intervention was aimed at emotional control training, prompting self‐monitoring of behaviour and self‐monitoring of behavioural outcome. Authors reported prevalence of pressure ulcers, depression severity, and healthcare utilisation.
Excluded studies
We excluded 252 studies at the full‐text screening stage. Studies with reasons for exclusion are presented in Characteristics of excluded studies. These reasons pertained to a wrong type of intervention in 165 (65%) studies; inappropriate design in 65 studies (26%); no preventive healthcare/management of long‐term conditions in 21 (8%); or others (1%).
Risk of bias in included studies
We present our judgements about each risk of bias item across all included studies as (summary) percentages in Figure 8. Figure 9 shows judgements about each risk of bias item for each included study separately.
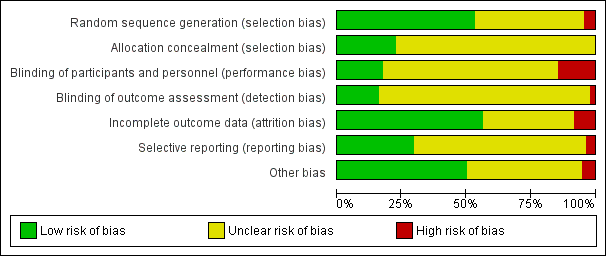
Risk of bias graph: review authors' judgements about each risk of bias item presented as percentages across all included studies.

Risk of bias summary: review authors' judgements about each risk of bias item for each included study.
Allocation
Among 132 included trials, 70 (53%) precisely explained an adequate randomisation process, so we rated them as being at low risk of bias. Fifty‐six studies (42%) had an unclear method of sequence generation, meaning there was insufficient information to assign a high or low risk rating. We considered six studies (5%) to be at high risk of bias for random sequence generation (Dini 1995; Heyworth 2014; Kurtz 2011; Linkins 1994; Siegel 1992; Tanke 1994). Heyworth 2014 used pseudo‐random number generator, and Dini 1995 assigned clients with last names beginning with the letters A through L to receive the intervention. Kurtz 2011 allocated participants without medical practitioner or telephone to the intervention group, and Linkins 1994 allocated children to an intervention group if their telephone numbers ended in an odd number. Siegel 1992 assigned participants to the experimental or control group based on the block of time during which investigators identified them, and Tanke 1994 used a quasi‐experimental design because of economic limitations/lack of resources.
Among the included trials, 30 (23%) explained how they performed allocation concealment, meriting their rating as being at low risk of bias. We assessed the other 102 (77%) studies as being at unclear risk of bias for allocation concealment (selection bias), meaning there was insufficient information to allow judgement of high or low risk. We did not consider any of the included studies to be at high risk of bias in this domain.
Blinding
Among the included trials, 23 (17.4%) precisely described an adequate procedure for blinding of participants and personnel, and we rated them as being at low risk of bias. Ninety studies (68.1%) had an unclear method of blinding, meaning there was insufficient information to allow judgement of high or low risk. We considered 19 studies (14.3%) to be at high risk of performance bias (Aharonovich 2012; Bennett 2012; Bennett 2013; Estabrooks 2008; Graziano 2009; Hasin 2013; Heyworth 2014; LeBaron 2004; Mu 2013; Litt 2009; Mooney 2014; Morey 2009; Piette 2012; Schillinger 2009; Shet 2014; Simon 2010a; Vollmer 2014; Williams 2012; Yount 2014). In these studies, the authors of primary studies clearly mentioned the reasons for lack of blinding.
Among the included trials, 21 (15.9%) described an adequate procedure for blinding of outcome assessors. We rated these studies as being at low risk of bias for this item. One hundred and eight studies (81.8%) had an unclear method of blinding of outcome assessors, meaning there was insufficient information to allow judgement of high or low risk. We considered three studies (2.2%) to be at high risk of detection bias (Glanz 2012; Sherrard 2009; Lim 2013); similarly, the reasons for non‐blinding of outcome assessors were clearly mentioned.
Incomplete outcome data
In 74 trials (56%), there was no substantial loss of data, or we considered that authors imputed them using appropriate methods. We rated these studies as being at low risk of bias for this domain. Forty‐eight studies (36%) had an unclear method of addressing of incomplete data, meaning there was insufficient information about reporting of attrition/exclusions to permit judgement of low or high risk of bias. We considered 11 studies (8%) to be at high risk of attrition bias (Ershoff 1999; Hyman 1996; Hyman 1998; Jarvis 1997; Khanna 2014; Lorig 2008; Mundt 2006; Peng 2013; Siegel 1992; Stuart 2003; Tucker 2012). Four trials included only the completers in the final analyses (Ershoff 1999; Hyman 1996; Jarvis 1997; Lorig 2008). Peng 2013 and Tucker 2012 potentially applied simple imputations inappropriately, and there was an imbalance in numbers and no reasons for missing data. Four studies all had a high attrition rate, potentially introducing bias (Hyman 1998; Khanna 2014; Siegel 1992 and Stuart 2003).
Selective reporting
Among the included trials, we considered 39 (29.5%) to be at low risk of reporting bias, meaning that authors reported all relevant outcomes of interest or that study protocols were available. We assigned an unclear rating to 88 studies (66.6%), meaning there was insufficient information to permit judgement of whether any risk of this bias was present. We considered five studies (4%) to be at high risk of reporting bias (Hyman 1996; Linkins 1994; Spoelstra 2013; Stuart 2003; Williams 2012). Hyman 1996 used a complete case analysis. Linkins 1994 did not report data on the differences between the groups by county, type of residence, ethnicity, sex, or age, and Spoelstra 2013 did not report outcomes on depression scores at the study's completion. Although the authors of Stuart 2003 mentioned that there were no significant differences in medication adherence among the three groups, the analyses were restricted to one subgroup of patients who completed the IVR calls. Williams 2012 did not report six‐month secondary outcomes.
Other potential sources of bias
In 66 trials (50%), there were no baseline imbalances, indicating low risk of other bias. Fifty‐nine studies (44.6%) had an unclear risk for this item, meaning there was insufficient information about baseline imbalances to permit judgement of low or high risk. We considered seven studies (5%) to have a potentially high risk of other bias because of significant baseline imbalances (Boland 2014; Durant 2014; Hess 2013; Magid 2011; Migneault 2012; Williams 2012), or in the case of Stuart 2003, because authors failed to report baseline characteristics.
We included five cluster RCTs in the review (Feldstein 2006; Franzini 2000; Hess 2013; Krum 2013; Stuart 2003). Only Krum 2013 appropriately adjusted for clustering in the analysis. For the remaining four studies, it was not possible to determine whether selective recruitment of cluster participants was likely to introduce bias, as they did not report sufficient details. Several indicated baseline differences between groups (Franzini 2000; Hess 2013), and one did not report any information about this (Stuart 2003). We calculated an approximate sample size for Hess 2013, while the other three studies have unit of analysis errors that may lead to overly precise effect estimates being reported for these studies (Feldstein 2006; Franzini 2000; Stuart 2003).
Overall quality of the evidence
We also assessed and reported on the quality of the evidence, using the GRADE criteria. Appendix 13 presents results of this assessment for each study, and we report them alongside the main results for the review in each 'Summary of findings' table.
Effects of interventions
See: Summary of findings for the main comparison Preventive healthcare: effects of ATCS on health services uptake (immunisations); Summary of findings 2 Preventive healthcare: effects of ATCS on physical activity levels; Summary of findings 3 Preventive healthcare: effects of ATCS on health services uptake (screening); Summary of findings 4 Preventive healthcare: effects of ATCS on weight management; Summary of findings 5 Preventive healthcare or management of long‐term conditions: effects of ATCS as appointment reminders/reducing non‐attendance rates; Summary of findings 6 Long‐term management: effects of ATCS on adherence to medication or laboratory tests; Summary of findings 7 Long‐term management: effects of ATCS on alcohol consumption; Summary of findings 8 Long‐term management: effects of ATCS on severity of cancer symptoms; Summary of findings 9 Long‐term management: effects of ATCS in the management of diabetes mellitus; Summary of findings 10 Long‐term management: effects of ATCS in patients with heart failure; Summary of findings 11 Long‐term management: effects of ATCS in the management of hypertension; Summary of findings 12 Long‐term management: effects of ATCS on smoking cessation
Table 1 presents additional information about the effects of ATCS interventions for both continuous and dichotomous outcomes for each study. Table 5 summarises the effectiveness of ATCS by specific categories and subcategories used to organise the review along with the effect estimates and selected median effect estimates.
ATCS for preventive healthcare
Alcohol misuse
Tucker 2012 evaluated an ATCS intervention versus control for preventing alcohol misuse.
Primary outcomes: behavioural outcomes
The IVR intervention may have little or no effect on drinking practices or spending on alcohol compared with control (assessment‐only) group (P > 0.20; low certainty evidence).
Immunisations
Ten studies evaluated ATCS compared with no calls, letters, usual care or health information for promoting immunisations (Dini 2000; Franzini 2000; Hess 2013; LeBaron 2004; Lieu 1998; Linkins 1994; Nassar 2014; Stehr‐Green 1993; Szilagyi 2006; Szilagyi 2013). For a summary of the effects of these comparisons on immunisation uptake, see summary of findings Table for the main comparison. We considered studies by separate population groups (children, adolescents, adults) as there was otherwise a high degree of heterogeneity in a pooled effect estimate.
Primary outcomes: behavioural outcomes
Immunisation rate
-
Children: ATCS versus control
Meta‐analysis of five studies considered to be sufficiently homogeneous found that ATCS (ATCS Plus, IVR, unidirectional) probably increased the uptake of immunisations in children compared with controls (no calls, letter, or usual care) (RR 1.25, 95% CI 1.18 to 1.32; moderate certainty evidence; Analysis 1.1; Dini 2000; LeBaron 2004; Lieu 1998; Linkins 1994; Stehr‐Green 1993). There was no evidence of heterogeneity among the studies (Tau2 = 0.00; Chi2 = 1.99, df = 4 (P = 0.74); I2 = 0%).
We could not include Franzini 2000 in the meta‐analysis, as it used a cluster RCT design and did not report sufficient information to allow for statistical pooling (i.e. regarding cluster size and within‐cluster or between‐cluster variance). Franzini 2000 reported that compared with controls (no calls), unidirectional ATCS (Autodialer) may increase immunisation rates in children (270/314 (86%) intervention group versus 273/429 (64%) control group, low certainty evidence).
-
Adolescents: unidirectional ATCS versus usual care
Meta‐analysis of two studies considered to be sufficiently homogeneous found that unidirectional ATCS, compared with usual care, probably slightly increased immunisation status of adolescents (RR 1.06, 95% CI 1.02 to 1.11; moderate certainty evidence; Analysis 1.2; Szilagyi 2006; Szilagyi 2013). There was no evidence of heterogeneity among the studies (Tau2 = 0.00; Chi2 = 0.28, df = 1 (P = 0.60); I2 = 0%). Szilagyi 2013 also reported that compared with usual care, unidirectional ATCS probably improved slightly the uptake of preventive care visits (63% ATCS versus 59% usual care; HR = 1.1, 95% CI 1.0 to 1.2; P < 0.05; moderate certainty evidence).
-
Adults: unidirectional ATCS versus no calls or health information
Two studies contributed data to this comparison and were considered sufficiently homogeneous to warrant meta‐analysis (Hess 2013; Nassar 2014). Hess 2013 used a cluster design but did not adjust for clustering; to calculate effective sample size, we used the Fleiss‐Cuzick estimator (see Appendix 14 for calculations). Meta‐analysis of the two studies found that the effects of unidirectional ATCS, compared with no calls in Hess 2013 or health information in Nassar 2014 were uncertain for immunisations in adults (RR 2.18, 95% CI 0.53 to 9.02; very low certainty evidence; Analysis 1.3). There was a substantial level of heterogeneity in the pooled studies (Tau2 = 0.68; Chi2 = 2.71, df = 1 (P = 0.10); I2 = 63%).
Secondary outcomes
Process outcomes: satisfaction/acceptability of ATCS
-
Children
Over 85% of the participants in Dini 2000 responded positively about the acceptability of unidirectional ATCS. Lieu 1998 found ATCS (IVR) to be an acceptable medium to deliver immunisation‐related reminders, with over 91% of the participants who received the intervention finding it very easy or somewhat easy to understand. Neither study reported comparison group data.
-
Adolescents
For 388 (27%) households in the unidirectional ATCS group, the reminder call was unanswered or was picked up by voice mail, but authors reported no comparison group data (Szilagyi 2013).
-
Adults
Nassar 2014 reported that the unidirectional ATCS intervention may lead to a slight increase in participants reporting that they learnt about the H1N1 virus (66.6% of participants), compared with 63.6% in the health information group (P = 0.41; low certainty).
Process outcomes: cost‐effectiveness
-
Children
In Dini 2000, unidirectional ATCS was more cost‐effective than phone plus letters (USD 4300 vs USD 4738) but less cost‐effective than letters only (USD 2254) (no data available for the no‐calls comparison group). Franzini 2000 reported that the average cost per child in the Autodialer was USD 15.46 compared with USD 11.46 in the controls (no calls); the incremental physician's office cost per child immunised relative to control was USD 4.06 (low certainty). In Lieu 1998, the estimated cost per child immunised was USD 9.80 using automated telephone messages alone, compared with USD 10.50 for letters alone.
-
Adolescents
Szilagyi 2013 reported that the total cost of the unidirectional ATCS intervention (excluding research costs) was USD 23,738.00, but authors did not report cost data for the usual care comparison group. Of all adolescents receiving a telephone reminder, the average cost was USD 16.68 per adolescent per year.
Physical activity
Eight studies evaluated various types of ATCS for improving physical activity levels, comparing them to no‐coach IVR call, no calls, usual care, usual care plus MOVE programme, attention only, or an IVR call promoting healthy eating (David 2012; Dubbert 2002; Jarvis 1997; King 2007; Morey 2009; Morey 2012; Pinto 2002; Sparrow 2011). For this outcome, the studies were too heterogeneous for statistical pooling. For a summary of the effects of these comparisons on physical activity and related outcomes, see summary of findings Table 2.
Primary outcomes: behavioural outcomes
Various indices of physical activity
-
Multimodal/complex intervention versus no intervention
Dubbert 2002 found that the intervention (10 nurse delivered calls plus 10 automated phone calls) may have improved slightly the frequency of walks compared with no calls during initiation (P = 0.003) and maintenance (P = 0.004) phases (low certainty evidence).
-
Multimodal/complex intervention versus usual care
Morey 2009 reported that the intervention (a combination of counselling by a lifestyle counsellor, automated telephone messaging, endorsement and tailored mailings) had probably little or no effect on usual gait speed or functional/disability outcomes, but probably improved slightly rapid gait speed (P = 0.04) and minutes of moderate/vigorous physical activity per week, compared with usual care at 12 months (mean (SD) = 126.6 min/week (142.9) versus 69.6 min/week (116.1); P < 0.001; moderate certainty evidence). Similarly, Morey 2012 reported that the multimodal intervention may slightly increase endurance physical activity at 12 months (mean (SD) = 133.60 min/week (136.47) versus 112.62 min/week (135.45); P < 0.001; low certainty evidence).
Together, these results suggest that multimodal/complex interventions may have little effect on several indices of physical activity, compared with usual care or no intervention.
-
ATCS Plus versus control (IVR)
David 2012 found that the ATCS Plus intervention may have little or no effect on time to complete the one‐mile walk compared with (no‐coach IVR call) controls. Similarly, Pinto 2002 found that compared with IVR control group, the intervention may have improved slightly the proportion of participants meeting recommendations for moderate‐intensity or vigorous‐intensity physical activity (P = 0.04), energy expenditure (P = 0.02), and motivational readiness (P = 0.04) at three months, but may have little or no effect on these outcomes at six months. In both studies the level of certainty for the evidence was low.
Together, these results suggest that ATCS Plus interventions may have little effect on several indices of physical activity, compared with IVR controls.
-
IVR versus usual care or attention or general health education (via IVR)
Jarvis 1997 found that the intervention may have little or no effect on physical activity levels (minutes walked per week) compared with usual care at three months (low certainty evidence). King 2007 reported that compared with attention control, the intervention may increase slightly minutes of moderate to vigorous physical activity at 6 and 12 months (P = 0.01, P = 0.045), but it may have little or no effect on this outcome at 18 months (P = 0.10; low certainty evidence). Sparrow 2011 found that compared with weekly general health education (via IVR) controls, the intervention may have improved slightly muscle strength (P = 0.035), balance (P = 0.029), and reduce depressive symptoms (P = 0.030), but may have little or no effect on walking distance (P = 0.91; low certainty evidence).
Taken together, these results suggest that IVR interventions may slightly improve several indices of physical activity, but the quality of evidence is low, and results are mixed across different measures of physical activity.
Overall, the results suggest that less complex ATCS interventions (i.e. IVR interventions) may be slightly more likely to improve outcomes related to exercise than more complex interventions (ATCS Plus or multimodal interventions) when compared with usual care or various controls. However, these interventions were not directly tested against one another.
Primary outcomes: clinical outcomes
Body mass index (BMI), anthropometric measures, metabolic markers
-
Multimodal/complex intervention versus usual care
Morey 2012 reported that there may be little or no differences between the multimodal intervention (similar to Morey 2009, a combination of counselling by a lifestyle counsellor, automated telephone messaging, endorsement and tailored mailings) and usual care in terms of fasting insulin and glucose levels, glycated haemoglobin (mean (SD) = 5.90% (0.44) versus 5.93% (0.36); P = 0.08); BMI (mean (SD) = 30.74 kg/m2 (3.88) versus 30.64 kg/m2 (3.62); P = 0.31); waist circumference (mean (SD) = 103.92 cm (10.02) versus 104.43 cm (11.73); P = 0.68); or physical function (mean (SD) = 62.52 (21.79) versus 66.24 (20.91); P = 0.09; low certainty evidence).
-
ATCS Plus versus control
David 2012 found that the ATCS Plus intervention may have little or no effect on BMI, weight (kg), waist (cm) or waist‐hip ratio, compared with (no‐coach IVR call) controls (low certainty evidence).
Together, these results suggest that ATCS Plus and multimodal/complex interventions may have little effect on measures of body weight or metabolic markers, compared with usual care or control.
Secondary outcomes
Cognitive outcomes: self‐efficacy
David 2012 found that the ATCS Plus intervention may have little or no effect on self‐efficacy for walking compared with no‐coach IVR call controls (low certainty evidence).
Process outcomes: satisfaction with ATCS
In Jarvis 1997, users were very satisfied with the IVR system. Analysis of users' satisfaction data shows a high user satisfaction score for Telephone‐Linked Communication for Activity Counseling and Tracking (IVR), with the mean of 8.6 points (where 1 = very dissatisfied and 10 = very satisfied); 74% of the women rated their satisfaction with the intervention as 10 of 10. Intervention users' perceived benefit score was 7.5 of 10; 63% of the women rated the benefit of TLC as 10 of 10. However, for satisfaction and perceived benefit outcomes, authors reported no data for the usual care comparison group.
Patient‐centred outcomes: quality of life
In Dubbert 2002 the multimodal intervention may have had little or no effect on physical or mental health quality of life as measured by the Short Form‐36 Health Survey (SF‐36) summary scores, compared with no intervention (low certainty evidence). King 2007 reported that the intervention may have little or no effect on physical functioning and well‐being at 12‐months, compared with attention control (IVR group: vitality plus scale (range from 10 (negative) to 50 (positive) adjusted mean square = 35.9 points (SD 6.3) versus attention control: 34.8 points (SD 5.8); IVR group: satisfaction with fitness scale (20 items) adjusted mean square = 32.8 points (SD 12.1) versus control: 30.0 points (SD 11.9); low certainty evidence). Morey 2012 reported there may be little or no differences between the multimodal intervention and usual care in terms of health‐related quality of life at 12 months (mean (SD) = 58.12 points (42.29) versus 61.68 points (41.82); P = 0.92; scale from 0 to 100, with higher scores indicating better outcome; low certainty evidence).
Screening
Thirteen trials compared ATCS intervention to no intervention, usual care or usual community care for changing screening rates (Baker 2014; Cohen‐Cline 2014; Corkrey 2005; DeFrank 2009; Durant 2014; Fiscella 2011; Fortuna 2014; Hendren 2014; Heyworth 2014; Mosen 2010; Phillips 2015; Simon 2010a; Solomon 2007). For a summary of the effects of these comparisons on screening rates for different conditions, see summary of findings Table 3.
Primary outcomes: clinical outcomes
Breast cancer screening
-
Multimodal/complex intervention versus usual care
Fiscella 2011 and Hendren 2014 compared the effects of usual care with those of multimodal/complex interventions, which included combinations of multiple ATCS calls, patient outreach (letters), and prompts for patients and clinicians, on screening rates for breast cancer at 12 months.
Meta‐analysis of these two studies, considered to be sufficiently homogeneous, found that the multimodal/complex intervention increased breast cancer screening rates compared with usual care (RR 2.17, 95% CI 1.55 to 3.04; high certainty evidence; Analysis 2.1). There was no evidence of heterogeneity among the studies (Tau2 = 0.00; Chi2 = 0.79, df = 1 (P = 0.37); I2 = 0%).
-
IVR versus enhanced usual care (letter or reminder)
Meta‐analysis of two studies considered to be sufficiently homogeneous found that compared with enhanced usual care (letter or reminder, IVR has probably little or no effect on breast cancer screening (RR 1.05, 95% CI 0.99 to 1.11; moderate certainty evidence; Analysis 2.1; DeFrank 2009; Phillips 2015). There was no evidence of heterogeneity among the studies (Tau2 = 0.00; Chi2 = 0.26, df = 1 (P = 0.61); I2 = 0%).
-
Unidirectional ATCS (plus letter) versus letter alone
Fortuna 2014 found that compared with letter alone, unidirectional ATCS (plus letter) probably has little or no effect on breast cancer screening rates at 12 months (22.8% versus 17.8%; adjusted OR 1.3, 95% CI 0.7 to 2.4; moderate certainty evidence).
Overall, these results suggest that more complex ATCS interventions (i.e. multimodal interventions) may be more likely to improve outcomes related to breast cancer screening than less complex interventions (IVR or unidirectional ATCS), when compared with usual care or control. However, these interventions were not directly tested against one another.
Colorectal cancer screening
-
Multimodal/complex intervention versus usual care
Baker 2014, Fiscella 2011, and Hendren 2014 compared usual care versus multimodal/complex interventions, which included combinations of ATCS calls, letters, prompts for patients and clinicians, and provision of testing (colorectal cancer kits), on colorectal cancer screening rates.
Meta‐analysis of these three studies, considered to be sufficiently homogeneous, found that multimodal/complex interventions increased colorectal cancer screening rates (RR 2.19, 95% CI 1.88 to 2.55; high certainty evidence; Analysis 2.2). There was no evidence of heterogeneity among the studies (Tau2 = 0.00; Chi2 = 1.29, df = 2 (P = 0.52); I2 = 0%).
-
IVR versus control (no call)
Durant 2014 compared IVR with control, reporting that IVR probably increased colorectal cancer screening, with 1773 participants from the IVR group and 100 from the no calls control group completing colorectal cancer screening within three months (without segmentation) (moderate certainty evidence).
-
IVR versus usual care or enhanced usual care (letter)
Meta‐analysis of two studies considered to be sufficiently homogeneous found that compared with usual care, IVR probably increased colorectal cancer screening at six months (RR 1.36, 95% CI 1.25 to 1.48; moderate certainty evidence; Analysis 2.2; Cohen‐Cline 2014; Mosen 2010). There was no evidence of heterogeneity among the studies (Tau2 = 0.00; Chi2 = 1.01, df = 1 (P = 0.31); I2 = 1%). Mosen 2010 also reported that compared with usual care, IVR probably increased completion of any colorectal cancer screening (23.9% versus 17.6%; moderate certainty evidence).
Two other studies evaluating this comparison reported results at later time points (Phillips 2015; Simon 2010a).
Meta‐analysis of these two studies, considered to be sufficiently homogeneous, found that IVR had probably little or no effect on colorectal cancer screening rates, compared with usual care or letters only at longer follow‐up (9 to 12 months) (RR 1.01, 95% CI 0.97 to 1.05; moderate certainty evidence; Analysis 2.2). There was no evidence of heterogeneity among the studies (Tau2 = 0.00; Chi2 = 0.47, df = 1 (P = 0.49); I2 = 0%). Simon 2010a also reported that IVR probably improved slightly colorectal cancer screening: a total of 21.4% of participants in the IVR group and 20.3% in the usual care group underwent colonoscopy following the intervention (adjusted OR 1.08, 95% CI 1.00 to 1.16; P = 0.04; moderate certainty evidence). The trialists reported including screening via colonoscopy as a secondary outcome as they anticipated that the intervention may also increase rates of uptake due to increased public awareness that colonoscopy is the most sensitive and frequently recommended screening test (Simon 2010a).
Overall these results suggest that compared with usual care or letter, IVR interventions probably increase colorectal cancer screening rates at some time points (6 months), but probably have little or no effect on colorectal cancer screening rates at later time points (9 to 12 months).
-
Unidirectional ATCS versus letter
Fortuna 2014 found that compared with letter alone, unidirectional ATCS (plus letter) had probably little or no effect on colorectal cancer screening rates at 12 months (15.3% versus 12.2%; adjusted OR 1.2, 95% CI 0.6 to 2.4; moderate certainty evidence).
Overall, these results suggest that more complex ATCS interventions (i.e. multimodal interventions) may be slightly more likely to improve colorectal cancer screening rates than less complex interventions (IVR and unidirectional ATCS) when compared with usual care or letters alone. However, these interventions were not directly tested against one another.
Cervical cancer screening
-
ATCS Plus versus control (no call)
Corkrey 2005 compared an ATCS Plus intervention with control, reporting that the intervention probably improved slightly the cervical cancer screening rate at two months (increase by 0.43%; moderate certainty evidence).
Osteoporosis screening
-
Multimodal/complex intervention versus no intervention
Solomon 2007 found that a multimodal intervention (education and reminders delivered to primary care physicians, mailings and ATCS) may increase the uptake of bone mineral density test or filling a prescription for osteoporosis medication at 10 months, compared with no intervention (adjusted model: 14% versus 10%; RR 1.52, 95% CI 1.13 to 2.05; P = 0.006; low certainty evidence).
-
ATCS Plus versus usual care
Heyworth 2014 reported that the effects of the ATCS Plus intervention versus usual care for bone mineral density screening were uncertain (adjusted analyses 18.6% versus 24.6 %, P < 0.001; very low certainty evidence).
Overall, these results suggest that multimodal interventions increase breast cancer and colorectal cancer screening rates when compared with usual care, and when compared with control they may increase osteoporosis screening rates. An ATCS Plus intervention probably slightly improves the rate of cervical cancer screening compared with control; however, results are based on a single comparison. The effects of ATCS Plus interventions on osteoporosis screening rates are uncertain. Compared with control, usual care or enhanced usual care, IVR interventions probably improve colorectal cancer screening rates at earlier (six months) but not later time points, but they probably have little or no effect on breast cancer screening rates. Unidirectional ATCS interventions, compared with letter or control, probably have little or no effect on breast cancer or colorectal cancer screening rates.
Secondary outcomes
Process outcomes: cost‐effectiveness
-
ATCS versus controls
In Baker 2014, the estimated cost of the multimodal outreach intervention was USD 34.59 per patient, and the estimated cost per completed colorectal cancer screening test was USD 43.13; however, no cost‐effectiveness data were available for the usual care arm. In Corkrey 2005 the cost per additional screen for cervical cancer in the IVR group was AUD 388.23 (in a random sample of women who were aged 20 to 69 years, without a hysterectomy, and unscreened); authors provided no cost‐effectiveness data for the control group. Durant 2014 reported a communication cost per screening of USD 14.84; this was further calculated to 18,738 colorectal cancer prevention years, with a resultant communication cost of USD 1.56 per colorectal cancer prevention year. In Phillips 2015, the cost of mammography mailings was USD 2.36, and colorectal cancer letters (including faecal immunochemical test kits) cost USD 7.17 per patient per mailing, compared with USD 0.92 per patient receiving IVR alone.
Stress management
Primary outcomes: clinical outcomes
Carers' psychological outcomes
-
ATCS Plus versus usual care
Mahoney 2003 found that compared with usual care, ATCS Plus has probably little or no effect on caregivers' appraisal of the bothersome nature of care, depression, or state anxiety at 6, 12, and 18 months (moderate certainty evidence).
Substance use
Primary outcomes: clinical outcomes
Days of drug use
-
ATCS Plusversus versus motivational interviewing
Aharonovich 2012 found that compared with usual delivery of motivational interviewing, delivery via ATCS Plus delivered motivational interviewing probably had little or no effect on days of using primary drug over the previous 30 days at 30 and 60 days post‐treatment (Cohen's d = 0.62; moderate certainty evidence).
Weight management
Seven studies evaluated ATCS for facilitating weight management: five in adults and two in children (Bennett 2012; Bennett 2013; Estabrooks 2008; Estabrooks 2009;Goulis 2004; Vance 2011; Wright 2013). For a summary of the effects of these comparisons on weight management and related outcomes in adults and children, see summary of findings Table 4.
Primary outcomes: clinical and behavioural outcomes in adults
BMI scores
-
ATCS (multimodal/complex intervention, ATCS Plus, IVR) versus usual care/no intervention
Five trials evaluated ATCS versus usual care or no intervention for weight management in adults (Bennett 2012; Bennett 2013; Estabrooks 2008; Goulis 2004; Vance 2011). Meta‐analysis of three trials considered to be sufficiently homogeneous showed that compared with usual care, ATCS interventions may have reduced slightly BMI in adults (MD −0.64 kg/m2, 95% CI −1.38 to 0.11; low certainty evidence; Analysis 3.1; Bennett 2012; Bennett 2013; Goulis 2004). There was a substantial level of heterogeneity among the studies (Tau2 = 0.25; Chi2 = 6.41, df = 2 (P = 0.04); I2 = 69%). Vance 2011 did not provide sufficient data to contribute to the meta‐analysis but reported that BMI in the intervention group (ATCS Plus plus written materials and group meetings) may have slightly been improved (mean reduction = 0.46 kg/m2; P < 0.001), compared with control (written materials and group meetings) (low certainty evidence). We did not include the remaining two trials in the meta‐analysis, as they reported weight loss rather than BMI (Estabrooks 2008, Vance 2011). The three studies pooled in meta‐analysis for BMI (Bennett 2012; Bennett 2013; Goulis 2004) also measured weight loss and other primary outcomes, reported below.
Weight loss
-
ATCS (multimodal/complex intervention, ATCS Plus, IVR) versus usual care/controls
Bennett 2012 found that compared with usual care (self‐help booklet), the ATCS Plus intervention probably reduced slightly body weight in adults at 18 months (MD −0.95 kg, 95% CI −2.03 to 0.14; moderate certainty evidence). Bennett 2013 found that compared with usual care, the multimodal/complex intervention may have reduced body weight in adults at 18 months (MD −1.7 kg, 95% CI −3.3 to −0.2; low certainty evidence).
Vance 2011 found that compared with written materials and monthly group meetings alone, the addition of ATCS Plus to these interventions may have reduced slightly body weight (for within‐group differences P < 0.001; mean reduction = 6.11 kg) and waist circumference (P < 0.001; mean reduction = 1.94 cm; low certainty evidence).
-
IVR versus usual care/control
Estabrooks 2008 found that compared with no calls, IVR may have had little or no effect on the percentage of lost body weight (mean (SD) 2.63% (3.08) versus 1.64% (1.78); P = 0.13) and on the change in body weight (mean (SD) 85.9 kg (18.6) versus 85.8 kg (18.2), P = 0.13) at three months (low certainty evidence). Goulis 2004 found that, compared with usual care, IVR probably reduced slightly body weight at six months (mean (SD) 89.2 kg (14.7) versus 99.6 kg (23.8); P = 0.05), but it probably had little or no effect on obesity assessment scores (mean (SD) 45.9 (19.6) versus 50.8 (16.5); moderate certainty evidence).
Blood pressure, glucose and cholesterol levels
-
ATCS (ATCS Plus, IVR) versus usual care
Bennett 2012 found that there was probably little or no difference between the ATCS Plus intervention and usual care (self‐help booklet) arms at 18 months in terms of systolic (MD −5.83 mmHg, 95% CI −10.38 to −1.28) or diastolic (MD −2.24 mmHg, 95% CI −5.16 to 0.69) blood pressure (moderate certainty evidence).
-
ATCS Plus versus control
Vance 2011 found that compared with a control group (written materials and group meetings), the intervention group (ATCS Plus plus written materials and group meetings) may have improved slightly their systolic blood pressure (P = 0.01; mean reduction = 2.97 mmHg) and blood glucose levels (P = 0.02; mean reduction = 3.02 mg/dL) at 12 weeks (low certainty evidence).
-
IVR versus usual care
Goulis 2004 found that, compared with usual care, IVR probably had little or no effect on systolic blood pressure (mean intervention group (SD) 123.8 mmHg (14.2) versus 128.6 mmHg (19.4) usual care); diastolic blood pressure (mean intervention group (SD) 74.6 mmHg (8.5) versus 79.5 mmHg (14.0) usual care); plasma glucose levels (mean intervention group (SD) 104.7 mg/dL (25.0) versus 108.3 mg/dL (31.3) usual care); or high‐density lipoprotein cholesterol (mean intervention group (SD) 47.5 mg/dL (12.0) versus 45.3 mg/dL (12.1) usual care), but it probably reduced slightly total cholesterol (mean intervention group (SD) 220.7 mg/dL (42.6) versus 239.6 mg/dL (41.5) usual care; P = 0.05); and triglyceride levels at six months (mean intervention group (SD) 122.3 mg/dL (31.4) versus 140.7 mg/dL (37.2) usual care; P = 0.01; moderate certainty evidence).
Medication adherence
-
ATCS Plus versus usual care
Bennett 2012 found that there was probably little or no difference between the ATCS Plus intervention and usual care (self‐help booklet) arms at 18 months in terms of medication adherence measured with the Hill‐Bone compliance to hypertension therapy scale (MD −0.31, 95% CI −0.86 to 0.25, P = 0.28; moderate certainty evidence).
Physical activity
-
IVR versus control
Estabrooks 2008 found that compared with no calls, IVR may have had little or no effect on daily minutes of moderate to vigorous physical activity (mean (SD) 25.15 min/d (29.82) versus 21.38 min/d (12.18), P = 0.47) or dietary habits (starting the conversation questionnaire scale (range from 7 (best) to 31 (worst)) at three months (mean 19.34 points (2.61) versus 20.13 points (2.84), P = 0.60; low certainty evidence).
Adverse outcomes
In Bennett 2012, there was one serious musculoskeletal injury reported in the intervention group and three events (one cardiovascular and two cases of gallbladder disease) in the usual care group. In Bennett 2013, there were six serious adverse events reported in participants in the multimodal ATCS intervention arm. These included gynaecological surgery in two participants and knee replacement, breast abscess, musculoskeletal injury, and cancer diagnosis in one participant each. All of these events required hospitalisation except for the cancer diagnosis. Authors of both studies reported that they could not determine whether the adverse events resulted from participation in the study.
Overall, these results suggest that ATCS (multimodal, ATCS Plus) interventions may slightly reduce BMI scores and body weight in adults, compared with usual care or control, while IVR interventions appear less effective. The effects of interventions on other clinical or behavioural measures appear mixed. It is not clear whether adverse events are associated with ATCS interventions or not.
Primary outcomes:clinical and behavioural outcomes in children
Weight management (BMI z‐scores)
Two trials that were too heterogeneous for pooling evaluated different ATCS interventions for facilitating weight management in children (Estabrooks 2009;NCT01953653).
-
ATCS Plus versus control
Estabrooks 2009 found that compared with Family Connections (education by a dietician in small groups) control group, ATCS Plus had probably little or no effect on BMI z‐scores (mean intervention (SD) 1.98 kg/m2 (0.03) versus control 1.95 kg/m2 (0.04)); moderate self‐reported physical activity (mean intervention (SD) 2.79 days/week (1.95) versus control 2.71 days/week (2.21)); sedentary behaviours (screen time) (mean intervention (SD) 5.47 h/d (1.96) versus control 5.60 h/d (2.04)); or dietary habits (sugary drinks) (mean intervention (SD) 1.80 L/week (1.64) versus control 1.76 L/week (1.85)) at 12 months (moderate certainty evidence).
-
IVR versus control
Wright 2013 found that compared with a wait‐list control, IVR probably had little or no effect on BMI z‐scores (mean intervention (SD) 1.9 kg/m2 (0.28) versus control 1.9 kg/m2 (0.3), P = 0.48)); total caloric intake (mean intervention (SD) 744.0 kcal (385.0) versus control 958 kcal (475.0); P = 0.06); fruit intake (mean intervention (SD) 1.1 cups/day (0.7) versus control 1.5 cups/day (1.1); P = 0.12)), and sedentary behaviours (television viewing time) (mean intervention (SD) 1.0 h/d (1.5) versus control 1.8 h/d (2.4); P = 0.22)) at three months (moderate certainty evidence).
Overall, these results suggest that ATCS interventions, compared with control, probably have little effect on weight management assessed by BMI z‐scores or other proxy measures of weight management in children.
Secondary outcomes
Process outcomes: adherence to the service
-
ATCS versus usual care
At 24 months in Bennett 2012, intervention group participants had completed 70.6% of the total 18 telephone counselling calls; 80.4% had completed calls 1 to 6; 65.0%, calls 7 to 12; and 66.7%, calls 13 to 18. Over 40.0% of intervention participants tracked their behaviour change goals weekly for at least 50% of trial weeks, and 25.0% tracked weekly for at least 75% of trial weeks. However, authors reported no data for these measures of adherence for the usual care (self‐help booklet) group.
Process outcomes: satisfaction
-
IVR versus control
Estabrooks 2008 reported that more than 50% of the participants in the IVR group were satisfied with the intervention, but authors reported no comparative data for satisfaction in the control group.
Patient‐centred outcomes: quality of life
-
IVR versus usual care
Goulis 2004 found that, compared with usual care, IVR probably had little or no effect on quality of life (as measured both by EQ‐5D and SF‐36 instruments) (moderate certainty evidence).
ATCS for reducing non‐attendance rate (preventive healthcare or management of long‐term conditions)
Seven studies evaluated ATCS (as appointment reminders) versus no intervention or nurse‐delivered reminder calls for reducing non‐attendance rates (Dini 1995; Griffin 2011; Maxwell 2001; Parikh 2010; Reekie 1998; Tanke 1994; Tanke 1997). For this outcome, the studies were too heterogeneous for statistical pooling. For a summary of the effects of these comparisons on appointment attendance, see summary of findings Table 5.
Primary outcomes: behavioural outcomes
Non‐attendance rates
-
ATCS Plus versus nurse‐delivered calls
Griffin 2011 found that compared with a nurse‐delivered call, an ATCS Plus call delivered either three or seven (IVR3 or IVR7) days prior to flexible sigmoidoscopy or/and colonoscopy examinations probably had little or no effect on either appointment non‐attendance or preparation non‐adherence at six weeks (moderate certainty evidence).
-
IVR versus no reminder
Parikh 2010 found that compared with no reminder, IVR improved attendance at four months (OR 1.52, 95% CI 1.34 to 1.71, P < 0.0001; high certainty evidence).
-
Unidirectional ATCS versus control (no calls)
Two studies compared the effects of unidirectional ATCS and control on attendance rates at time points up to one month (Dini 1995; Tanke 1997), and three studies assessed the effects of this comparison at time points ranging from six weeks to six months (Maxwell 2001; Reekie 1998; Tanke 1994).
Dini 1995 found that unidirectional ATCS may have improved attendance at one month (rate ratio 1.60, 95% CI 1.29 to 1.98, P < 0.05). Tanke 1997 reported that compared with no calls, unidirectional ATCS may have improved return rates of tuberculin test at three days (OR 1.71, P < 0.05). Taken together, these studies provided low certainty evidence for this outcome.
In three further studies of low certainty, which assessed non‐attendance rates at later time points, there were mixed results when unidirectional ATCS interventions were compared with no‐call control groups. Reekie 1998 reported that unidirectional ATCS probably reduced non‐attendance rates at six weeks (OR 3.41, 95% CI 1.87 to 6.2, P < 0.001; moderate certainty evidence). In contrast, Maxwell 2001 found that unidirectional ATCS probably had little or no effect on non‐attendance rates at two months (moderate certainty evidence), while Tanke 1994 found that attendance rates may have been increased at six months (OR 1.50, P < 0.01; low certainty evidence).
Overall, these results suggest that certain ATCS interventions (IVR, unidirectional ATCS) may improve attendance rates when compared with control, although the certainty of the evidence varied from high to low.
Secondary outcomes
Process outcomes: satisfaction
-
ATCS Plus, IVR, unidirectional versus controls (nurse‐delivered calls, no calls)
Griffin 2011 reported that the intervention may have had little or no effect on participants' perceptions of experiences compared with the nurse‐call control group for flexible sigmoidoscopy. However, for the colonoscopy group, those who had received the nurse‐delivered calls versus the IVR3 or the IVR7 intervention calls (ATCS Plus) had slightly more positive perceptions about the call (35% versus 21% versus 26%; low certainty evidence). In Parikh 2010, 72% of the participants in the IVR group stated that the reminder was helpful, compared with 31% in no reminder (control) group who answered the same question (high certainty evidence). In Tanke 1994, 85% of the participants in the unidirectional ATCS group stated that the reminders were helpful (attitude questionnaire, question 3: mean response 6.73; scale range from 1 (negative) to 7 (positive)). In Tanke 1997, 65% of the participants in the unidirectional ATCS group endorsed the most positive response about the automated reminders.
ATCS for managing long‐term conditions
Adherence to medication or laboratory tests
We included 25 studies that compared ATCS with various control strategies (no intervention, usual care, or other ATCS interventions) for facilitating adherence to either medications or laboratory tests (Adams 2014; Bender 2010; Bender 2014; Boland 2014; Cvietusa 2012; Derose 2009; Derose 2013; Feldstein 2006; Friedman 1996; Glanz 2012; Green 2011; Ho 2014; Leirer 1991; Lim 2013; Migneault 2012; Mu 2013; Ownby 2012; Patel 2007; Reynolds 2011; Sherrard 2009; Simon 2010b; Stacy 2009; Stuart 2003; Vollmer 2011; Vollmer 2014). In several of these studies, we could group results and consider them together, as interventions and outcomes were similar. For other studies, we could not combine results with data from other trials within the same comparison due to differences in outcome measures, timing of outcome assessment, or both. For a summary of the effects of ATCS interventions, compared with various controls, on adherence to either medications or laboratory tests in various groups of participants, see summary of findings Table 6.
Primary outcomes: behavioural outcomes
Adherence
-
Multimodal/complex interventions versus usual care or control (education and call)
Ho 2014 reported that compared with the usual care group, multimodal intervention (ATCS Plus, medication reconciliation and tailoring, patient education and collaborative care) probably improved adherence to cardioprotective medications at 12 months (89% versus 74%, P = 0.003; moderate certainty evidence). Stuart 2003 reported uncertain effects of a complex intervention (education, nurse‐delivered call and IVR intervention) versus control on adherence to antidepressant medications at four months (very low certainty evidence).
-
ATCS Plus versus control or other ATCS
Cvietusa 2012 reported that compared with control group (unspecified), ATCS Plus probably improved time to first inhaled corticosteroid refill (HR 1.26, 95% CI 1.12 to 1.42), and probably improved slightly the proportion of days with medication on hand in children (38% versus 28%, P < 0.001; moderate certainty evidence). Stacy 2009 reported that compared with an enhanced care control group (via IVR), ATCS Plus probably improved statin adherence (measured with six‐month point prevalence persistency; adjusted OR 1.64, 95% CI 1.19 to 2.26; moderate certainty evidence).
-
ATCS Plus versus usual care or no calls
Three studies reported the effects of ATCS Plus versus usual care on medication adherence, and we considered findings together.
Derose 2013 reported that ATCS Plus probably improved adherence to statins (RR 1.63, 95% CI 1.50 to 1.76, P < 0.001), as did Vollmer 2014, reporting a small increase in statin adherence at 12 months (mean change 0.02, 95% CI 0.01 to 0.03). Similarly, Vollmer 2011 reported an increase in adherence to inhaled corticosteroids (mean change 0.02, 95% CI 0.01 to 0.03, P = 0.002). Taken together these results suggest that ATCS Plus interventions, compared with usual care, probably improve medication adherence (moderate certainty evidence).
Three further studies assessed the effects of ATCS Plus on other measures of adherence that could not be combined.
Sherrard 2009 found that compared with usual care, ATCS Plus may have improved medication adherence compared with usual care (74.5% versus 49.7% compliant with the intervention; RR 0.34, 95% CI 0.20 to 0.56; P < 0.001) and may have improved slightly a composite measure that assessed increased medication adherence and reduced adverse events (51% versus 39%, RR 0.60, 95% CI 0.37 to 0.96, P = 0.041; low certainty evidence).
Derose 2009 found that compared with no calls, ATCS Plus probably had little or no effect on adherence to testing (completion of all three recommended laboratory tests for diabetes patients) at 12 weeks (OR 1.09, 95% CI 0.92 to 1.28; moderate certainty evidence).
Simon 2010b found that compared with usual care (no intervention), ATCS Plus probably had little or no effect on retinopathy examination rates (adjusted HR 0.93, 95% CI 0.71 to 1.22) tests for glycaemia (HR 0.72, 95% CI 0.38 to 1.37), hyperlipidaemia (HR 1.31, 95% CI 0.56 to 3.05), or nephropathy (HR 1.14, 95% CI 0.69 to 1.89) in diabetic patients at 12 months (moderate certainty evidence).
Overall, these results suggest that ATCS Plus interventions probably improve adherence to medications but may have little effect on adherence to tests, compared with usual care or no calls.
-
IVR versus control (other ATCS) or no calls
Four studies evaluated IVR interventions compared with other ATCS or no calls for effects on adherence but reported different outcome measures that could not be combined.
Adams 2014 found that compared with a single IVR call, the more comprehensive (repeated) IVR intervention may have slightly improved the comprehensiveness of screening and counselling in primary care parent‐child consultations (85.7% intervention group versus 72.6% control; P = 0.04; low certainty evidence). Bender 2010 reported that compared with no calls, IVR may have improved adherence to anti‐asthmatic medications at 10 weeks (intervention group mean 64.5% (SD 17.2) versus control mean 49.1% (SD 16.8) adherent at 10 weeks, P = 0.003; low certainty evidence). Leirer 1991 reported that compared with no calls, the IVR intervention may have reduced slightly medication non‐adherence (assessed as mean hours not adhering to medication, mean intervention group (SD) 3.68 h (2.62) versus 14.76 h (SD 13.98) control group; P < 0.03); low certainty evidence). Mu 2013 found that compared with no calls, IVR probably improved slightly medication refill rates at one month (26.41% intervention versus 21.85% control, P < 0.001; moderate certainty evidence).
Overall these results suggest that IVR interventions probably slightly improve measures of medication and other adherence compared with control (other ATCS) or no calls, but evidence was of uniformly low certainty.
-
IVR versus usual care
Nine studies assessed the effects of IVR interventions compared with usual care. Several studies reported comparable outcomes and time points and could be grouped for consideration.
Four studies reported medication adherence: two at 3 to 6 months (Boland 2014; Friedman 1996), and two at 8 to 12 months (Glanz 2012; Migneault 2012).
Boland 2014 reported that IVR improved adherence to glaucoma medications at three months (IVR median (range) 73% (32 to 96) versus usual care 67% (7 to 98), as did Friedman 1996 for anti‐hypertensive medication adherence at 6 months (6% higher in IVR group, P = 0.03). In comparison, at later time points, Migneault 2012 and Glanz 2012 reported little effect on adherence when IVR was compared with education‐only usual care at 8 months or usual care at 12 months, respectively.
Taken together, these studies suggest that IVR interventions probably slightly increase medication adherence at shorter time points (up to six months) but probably have little or no effect at longer time points when compared with usual care (moderate certainty evidence).
Two studies assessed IVR versus usual care for medication adherence, using refill rates, and we considered their findings together. Green 2011 and Reynolds 2011 reported that the IVR intervention increased medication refill rates by 5.7% (P < 0.001) and 6.3% (P < 0.001), respectively, at two weeks. Taken together, these results suggest that IVR probably slightly increased medication adherence, assessed by refill rates at two weeks (moderate certainty evidence).
Bender 2014 and Patel 2007 assessed the effects of IVR on medication adherence, as measured by the medication possession ratio (MPR), but we did not consider them together because they measured outcomes at very different time points. Patel 2007 reported that the IVR intervention led to a very slight increase in the MPR at three to six months, compared with usual care (0.759 intervention group versus 0.738 usual care (moderate certainty evidence). In comparison, Bender 2014 reported that the MPR probably increases by 25.4% with IVR over usual care over the 24‐month interval (moderate certainty evidence).
Feldstein 2006 assessed the effects of IVR interventions on adherence to testing (completion of all recommended laboratory tests), reporting that compared with usual care, the IVR intervention probably improved participants' adherence (HR 4.1, 95% CI 3.0 to 5.6, P < 0.001; moderate certainty evidence). However, this study did not adjust for clustering (unit of analysis error) and so may have reported an overly precise effect estimate.
Overall, the results suggest that IVR interventions probably improve adherence to medications/laboratory tests when compared with usual care; however, most results were based on studies of moderate certainty evidence, and the size of effects were variable and sometimes very small.
-
Unidirectional ATCS versus control (no intervention)
Two studies assessed the effects of unidirectional ATCS interventions in comparison with no intervention on medication adherence: Lim 2013 reported little effect on adherence at five months, while Ownby 2012 reported a small increase in medication adherence (mean (ATCS group) 75.7, 95% CI 65.0 to 86.5 versus mean (control group) 60.3, 95% CI 47.2 to 73.2; P = 0.02). Taken together, results from these two studies suggest that unidirectional ATCS may improve adherence to medications to a small degree compared with control, although this is based on low certainty evidence.
Primary outcomes: clinical outcomes
Blood pressure/lipids, disease control
-
Multimodal/complex intervention versus usual care
Ho 2014 reported that compared with usual care, a multimodal intervention (ATCS Plus, medication reconciliation and tailoring, patient education and collaborative care) probably had little or no effect on achieving reduced blood pressure targets (49% usual care versus 59% intervention group; P = 0.23) or low‐density lipoprotein cholesterol level targets (83% usual care versus 72% intervention; P = 0.14; moderate certainty evidence).
-
ATCS Plus versus usual care
Vollmer 2014 reported that compared with usual care, ATCS Plus probably reduced slightly overall systolic blood pressure (mean change= −0.5 mmHg, 95% CI −1.0 to 0.0; P = 0.041) but probably had little or no effect on overall low‐density lipoprotein levels (mean Δ change −0.6 ml/dL, 95% CI −1.8 to 0.7; P = 0.379; moderate certainty evidence).
-
IVR versus usual care
In Migneault 2012 the IVR intervention probably had little or no effect on diet, physical activity, systolic blood pressure, or diastolic blood pressure at 12 months (moderate certainty evidence). Similarly, Friedman 1996 reported that IVR may have had little or no effect on systolic blood pressure at six months (mean change from baseline −11.5 mmHg intervention group versus −6.8 mmHg usual care; P = 0.20) but that it may have slightly decreased diastolic blood pressure (mean change from baseline −5.2 mmHg intervention group versus −0.8 mmHg usual care; P = 0.02; low certainty evidence).
-
IVR versus no calls
Bender 2010 reported that compared with no calls, IVR probably had little or no effect on asthma control test (5‐item questionnaire where higher scores indicate better outcome) (intervention group mean (SD) −1.12 (3.90) versus −1.84 (4.14) control; P = 0.530; moderate certainty evidence).
-
Unidirectional ATCS versus control
Lim 2013 reported that there may have been little effect or no difference between unidirectional ATCS and control in terms of therapeutic coverage (low certainty evidence).
Secondary outcomes
Process outcomes: healthcare use
-
ATCS Plus versus usual care
Sherrard 2009 reported that the ATCS Plus intervention may have had little or no effect on emergency room visits (RR 1.04, 95% CI 0.63 to 1.73) or hospitalisations (RR 0.77, 95% CI 0.41 to 1.45; low certainty evidence), while Vollmer 2011 reported that among the participants who were successfully contacted, the rate of acute asthma healthcare utilisation may have increased slightly in the intervention group compared with usual care control (RR 1.06, P = 0.038; low certainty evidence).
Process outcomes: satisfaction with ATCS
-
Multimodal/complex intervention versus control (education and call)
In Stuart 2003, 50% of the participants rated the system as very helpful, 40% as somewhat helpful, and 10% as not helpful; authors did not provide data for the comparison group (very low certainty evidence).
-
ATCS Plus versus usual care
In Sherrard 2009, 90% of the participants were satisfied with the medication information provided by ATCS Plus, and 93% responded that they preferred an IVR follow‐up as opposed to no calls (low certainty evidence). Authors did not report comparative data for this study.
-
IVR versus control
Adams 2014 reported that parents in the IVR personal health partner (PHP) intervention group were slightly more likely than those in control group (single IVR call) to report feeling "more prepared"for the visit (81% versus 67%, P = 0.001) and to report that use of PHP reduced their visit time (63% versus 45%, P < 0.001). However, authors also reported that the IVR intervention may have had little or no effect on medication management (19.1% versus 9.7%; P = 0.19; low certainty evidence). In Friedman 1996, 85% of the physicians stated they read reports from the IVR system regularly.
Process outcomes: acceptability of service
-
ATCS Plus versus control
In Cvietusa 2012, two‐thirds of intervention group parents reported that the ATCS Plus calls were helpful and that the programme improved the care of their child's asthma.
-
IVR versus usual care
In Friedman 1996, 94% of patients reported that the IVR system "was easy to use". There were no data presented for comparison groups for the acceptability outcomes in either of these two studies, and the evidence was of low certainty.
Process outcomes: cost‐effectiveness
-
IVR versus usual care
In Friedman 1996, the computed cost per patient user for six months of IVR use was USD 32.50 (low certainty evidence). There were no comparison data presented for costs.
Cognitive outcomes: beliefs, cognition
-
IVR versus no calls
Bender 2010 reported that compared with no calls, IVR probably improved beliefs about medications (range scores above 0 (more positive beliefs) and scores below 0 (more negative beliefs)) (intervention group mean (SD) 0.25 (1.07) versus −0.51 (0.913) control; P = 0.007; moderate certainty evidence), while Leirer 1991 reported that compared with no calls, the IVR intervention may have had little or no effect on cognitive abilities (low certainty evidence).
Patient‐centred outcomes: quality of life
-
IVR versus no calls
Bender 2010 reported that compared with no calls, IVR probably had little or no effect on asthma‐related quality of life (32 questions where higher scores indicate better outcome) (intervention group mean (SD) −0.15 (0.92) versus −0.38 (1.06) control; P = 0.42; moderate certainty evidence).
Illicit drug addiction
We only identified one study that focused on addiction to illicit drugs (Moore 2013).
Primary outcomes: clinical outcomes
Substance use
-
ATCS Plus versus usual care
Moore 2013 reported that compared with usual care, ATCS Plus may have had little or no effect on self‐reported opioid, cannabis, or cocaine use (low certainty evidence).
Primary outcomes: behavioural outcomes
ATCS Plus may have had little or no effect on the number of counselling sessions attended when compared with usual care at four weeks (mean (SD) intervention group 3.3 sessions (9.5) versus 1.0 session (1.0) usual care; adjusted P = 0.72; low certainty evidence).
Secondary outcomes
Cognitive outcomes: coping skills
The intervention may have had little or no effect on coping skills when compared with usual care at four weeks (mean 0.82 intervention group versus mean 0.54 usual care group; low certainty evidence).
Process outcomes: acceptability of ATCS
Ratings of acceptability and perceived efficacy (each rated from 1 to 5 points on an ascending scale) showed negligible change over the four weeks of study. In the intervention group, mean interest at the end of the study was 3.6 (SD 0.9), mean perceived efficacy was 3.7 (SD 1.0), and mean perceived ease of use was 4.8 (SD 0.4). For these acceptability outcomes, authors reported no data from the comparison group.
Process outcomes: satisfaction
ATCS Plus may have had little or no effect on satisfaction with methadone treatment scores (five‐item Likert‐like scale) when compared with usual care at four weeks (mean (SD) 4.1 (1.2) intervention group versus 4.4 (0.8) usual care group; adjusted P = 0.62; low certainty evidence).
Alcohol consumption
Eight trials compared ATCS to no intervention, usual care, another intervention (advice/education; packaged cognitive behavioural therapy (via IVR)) or an informational pamphlet in managing alcohol consumption (Andersson 2012; Hasin 2013; Helzer 2008; Litt 2009; Mundt 2006; Rose 2015; Rubin 2012; Simpson 2005). For this outcome, the studies were too heterogeneous for statistical pooling. For a summary of the effects of these comparisons on alcohol intake, see summary of findings Table 7.
Primary outcomes: behavioural outcomes
Alcohol consumption
-
ATCS Plus versus no intervention or usual care
Three studies compared ATCS Plus versus control or usual care, reporting several different measures of alcohol use (Helzer 2008; Mundt 2006; Rose 2015).
Helzer 2008 found that compared with control (no calls), ATCS Plus may have had little or no effect on weekly alcohol consumption (number of drinks/week) at six months (mean 22.4 intervention group versus 18.3 control group; P > 0.05; low certainty evidence). Likewise, Mundt 2006 found that compared with no intervention, ATCS Plus may have had little or no effect on drinking days, heavy drinking days, or total drinks consumed (P > 0.05; low certainty evidence). Rose 2015 reported that compared with usual care, ATCS Plus may have had little or no effect on the number of drinks per drinking day (P = 0.45; low certainty evidence).
Overall, these results suggest that ATCS Plus interventions may have little or no effect, when compared with no intervention or usual care, on measures of alcohol consumption, although the certainty of the evidence was low in all cases.
-
ATCS Plus versus another intervention
Two studies compared ATCS Plus interventions with another form of intervention, reporting different alcohol use measures that could not be combined.
Compared with advice/education, Hasin 2013 found that ATCS Plus may have reduced the number of drinks per drinking day in the last 30 days at two months (effect size Cohen's d = 0.44, 95% CI 0.07 to 0.81, P = 0.01; low certainty evidence), but it probably had little or no effect at 12 months. Litt 2009 compared ATCS Plus with packaged cognitive behavioural therapy, finding a slight reduction in the proportion of days abstinent at 12 weeks post‐treatment (P < 0.05) but negligible effect on the number of heavy drinking days, coping or drinking problems, or continuity of abstinence (low certainty evidence).
Overall, these results suggest that ATCS Plus interventions may have little or no effect on alcohol consumption when compared with selected other interventions.
-
IVR versus control (no intervention)
Two studies compared the effects of IVR and control on different measures of alcohol consumption.
Andersson 2012 found that compared with no intervention, IVR probably improved slightly results of the AUDIT score at six weeks (moderate certainty evidence). Simpson 2005 found that compared with no calls, IVR may have had little or no effect on drinking habits, alcohol craving, or post‐traumatic stress disorder symptoms at four weeks (low certainty evidence).
-
IVR versus control (information)
Rubin 2012 reported that compared with an informational pamphlet, IVR may have reduced slightly the number of heavy drinking days per month (effect size −0.74, P = 0.02) and drinks per drinking day (effect size −0.49), and it may have increased slightly the percent days abstinent per month (effect size 0.45) at six‐month follow‐up (low certainty evidence).
Overall, these results suggest that IVR interventions may slightly improve some measures of alcohol consumption, compared with no intervention or information provision, but the size of the effect is small and the evidence of low certainty.
Secondary outcomes
Process outcomes:acceptability of ATCS
-
ATCS Plus versus usual care
In Rose 2015, 88% of the patients found the ATCS system easy to use overall (88% responded 'somewhat' or 'very easy'), and users rated each feature as somewhat or very useful (low certainty evidence). There were no comparison data presented for acceptability.
Asthma
Vollmer 2006 and Xu 2010 evaluated two different ATCS interventions versus usual care for managing asthma.
Primary outcomes: clinical outcomes
Asthma control
-
ATCS Plus versus usual care
Vollmer 2006 found that compared with usual care, ATCS Plus may have had little or no effect on asthma control in the 12 months post‐randomisation (low certainty evidence).
Primary outcomes: behavioural outcomes
Medication use
-
ATCS Plus versus usual care
Vollmer 2006 found that compared with usual care, ATCS Plus may have had little or no effect on medication use (past four weeks) in the 12 months post‐randomisation (low certainty evidence).
-
IVR versus usual care
Xu 2010 found that compared with usual care, IVR may have had little or no effect on medication (oral steroid rescue medication) use (OR 0.55, 95% CI 0.22 to 1.38; P = 0.20) (low certainty evidence).
Overall, these results suggest that ATCS interventions may have little or no effect on improving selected outcomes in asthma, compared with usual care, but the evidence was of low certainty and was based on only two trials.
Secondary outcomes
Patient‐centred outcomes: quality of life
-
ATCS Plus versus usual care
Vollmer 2006 found that compared with usual care, ATCS Plus may have had little or no effect on quality of life (low certainty evidence).
-
IVR versus usual care
Xu 2010 found that compared with usual care, IVR may have had little or no effect on health‐related quality of life (low certainty evidence).
Process outcomes: satisfaction
-
ATCS Plus versus usual care
Vollmer 2006 suggested that ATCS Plus probably had little or no effect on satisfaction, compared with usual care. The mean satisfaction with asthma care (on a 7 point scale) was 6 and 5.9 in the intervention and usual care groups, respectively (P = 0.17; low certainty evidence).
Process outcomes: cost‐effectiveness/resource use
-
ATCS Plus versus usual care
Vollmer 2006 found that compared with usual care, ATCS Plus may have had little or no effect on healthcare use in the 12 months post‐randomisation (low certainty evidence).
-
IVR versus usual care
Xu 2010 found that compared with usual care, IVR may have reduced slightly the total healthcare costs (mean AUD −451, 95% CI −1075 to 172), but it may have had little or no effect on healthcare utilisation (OR 1.17, 95% CI 0.46 to 2.98, P = 0.75; low certainty evidence).
Cancer
Seven studies evaluated the effectiveness of ATCS compared with control, usual care, usual care delivered by another ATCS (IVR), interviews with clinicians, or telephone calls by nurses in managing cancer patients (Cleeland 2011; Kroenke 2010; Mooney 2014; Siegel 1992; Sikorskii 2007; Spoelstra 2013; Yount 2014). For this outcome, the studies were too heterogeneous for statistical pooling. For a summary of the effects of these comparisons on symptom severity in cancer patients, see summary of findings Table 8.
Primary outcomes: clinical outcomes
Symptom severity, distress, or burden
-
Multimodal/complex intervention versus usual care
Kroenke 2010 reported that compared with usual care, a multimodal/complex intervention (ATCS plus symptom monitoring by a nurse and medications) probably reduced pain at three months (standardised effect size* 0.67, 95% CI 0.33 to 1.02) and probably reduced slightly pain at 12 months (standardised effect size 0.39, 95% CI, 0.01 to 0.77) (moderate certainty evidence).
*Standardised effect sizes were calculated as the mean group difference divided by the pooled baseline SD, where an effect size of 0.2 is modest and 0.5 is moderate (according to authors' definition).
-
ATCS Plus versus control or usual care delivered via ATCS
Cleeland 2011 found that compared with automated monitoring (via IVR) and usual symptom care, ATCS Plus may have reduced slightly symptom threshold events (rate ratio (for difference between groups) 0.88, 95% CI 0.78 to 0.98) and the cumulative distribution of symptom threshold events; however, it may have had little or no effect on mean symptom severity between discharge and follow‐up (low certainty evidence). Mooney 2014 found that compared with an attention control group (via IVR), ATCS Plus probably had little or no effect on symptom severity or distress scores (MD 0.06, P = 0.58; moderate certainty evidence). Spoelstra 2013 found that compared with usual care (symptom management toolkit (SMT) and an automated voice response (AVR) phone system alone), the ATCS Plus intervention (AVR system and SMT complemented by nurse strategies to manage unresolved symptoms and improve adherence) may have had little or no effect on symptom severity (range 0 (the symptom did not occur) to 10 (worst imaginable) (mean (SD) intervention group 11.0 (10.4) versus 11.6 (12.1) usual care group); low certainty evidence). Yount 2014 reported that compared with monitoring alone (via IVR), ATCS Plus (monitoring and reporting functions) may have had little or no effect on symptom burden at 12 weeks (low certainty evidence).
Overall, these results suggest that ATCS Plus interventions may have little or no effect on symptoms (severity, distress or burden) in cancer patients, when compared with control or usual care delivered via another ATCS, although the evidence was of mostly low certainty, and in some studies the involvement of ATCS systems as part of usual care may have prevented any effects of the intervention from being detected.
-
IVR versus nurse calls
Sikorskii 2007 found that compared with telephone calls by nurses, the automated telephone symptom management intervention may have had little or no effect on symptom severity (low certainty evidence).
Depression
-
Multimodal/complex intervention versus usual care
Kroenke 2010 reported that compared with usual care, a multimodal/complex intervention probably reduced slightly depression at 3 months (standardised effect size 0.42, 95% CI 0.16 to 0.69) and at 12 months (standardised effect size 0.41, 95% CI 0.08 to 0.72), but it probably had little or no effect on disability (range from 0 to 10) (mean (SD) intervention 3.95 points (2.95) versus usual care 4.57 points (3.24); P = 0.011) or co‐interventions (depression treatment by mental health professional) (mean (SD) intervention 34 (26.6) versus usual care 39 (29.8); P = 0.56) at 12 months follow‐up (moderate certainty evidence).
Primary outcomes: behavioural outcomes
Medication adherence
-
ATCS Plus versus usual care (via IVR)
Spoelstra 2013 found that compared with usual care (symptom management toolkit (SMT) and an automated voice response (AVR) phone system alone), the ATCS Plus intervention (AVR system and SMT complemented by nurse strategies to manage unresolved symptoms and improve adherence) may have had little or no effect on medication non‐adherence (intervention group 40% versus usual care group 18%; low certainty evidence).
Overall, compared with usual care or control, these results suggest that multimodal/complex interventions probably improve both pain and depression measured at different time points, whereas ATCS Plus interventions may have little or no effect on symptoms or adherence to medications. Similarly, IVR may have little or no effect on symptoms, compared with either control or when used as a comparison with ATCS Plus, although evidence was of generally low certainty and based on few studies.
Secondary outcomes
Patient‐centred outcomes: quality of life
-
Multimodal/complex interventions versus usual care
Kroenke 2010 reported that the multimodal intervention probably had little or no effect on overall quality of life (range from 0 (worse) to 10 (better)) compared with usual care (mean (SD) intervention group 6.20 points (2.27) versus 6.07 points (2.18) usual care group; P = 0.46) at 12 months follow‐up (moderate certainty evidence).
-
ATCS Plus versus control (via IVR)
Yount 2014 reported that compared with monitoring alone (via IVR), ATCS Plus (monitoring and reporting functions) may have had little or no effect on health‐related quality of life (27‐item, with higher scores indicating better outcome) (intervention mean (SD) 77.9 points (19.8) versus control 77.1 points (18.0); P = 0.78) at 12 weeks (low certainty evidence).
Process outcomes: healthcare use, costs
-
Multimodal/complex intervention versus usual care
Kroenke 2010 reported that the multimodal intervention probably had little or no effect on healthcare use compared with usual care (mean (SD) intervention 15.6 outpatient physician visits (9.9) versus usual care 16.4 outpatient physician visits(13.4); P = 0.55) at 12 months follow‐up (moderate certainty evidence).
Process outcomes: satisfaction, acceptability of the service
-
ATCS Plus versus control (via IVR)
In Mooney 2014, participants reported high satisfaction and ease of use for the automated ATCS Plus system. Overall, 94% found the automated system quite or very easy to use, 91% found the call length acceptable, and 77% said they were quite or very satisfied with using the system. Authors reported no comparison group data for this acceptability outcome. Yount 2014 reported that compared with monitoring alone (via IVR), ATCS Plus (monitoring and reporting functions) may have had little or no effect on satisfaction with explanations provided to them (mean (SD) 2.60 (0.57) versus 2.70 (0.53); P = 0.23) at 12 weeks (low certainty evidence).
Cognitive outcomes: barriers, unmet needs
-
ATCS Plus versus control (via IVR)
Yount 2014 reported that compared with monitoring alone (via IVR), ATCS Plus (monitoring and reporting functions) may have had little or no effect on symptom management barriers (mean (SD) 56.7 (14.4) versus 52.7 (16.9); P = 0.094) or self‐efficacy (mean (SD) 88.2 (18.9) versus 90.5 (19.9); P = 0.45) at 12 weeks (low certainty evidence).
-
IVR versus control
Siegel 1992, comparing a comprehensive clinician‐delivered needs assessment with IVR‐delivered needs assessment, reported uncertain effects on the prevalence of unmet needs (very low certainty evidence).
Chronic pain
Kroenke 2014 and Naylor 2008 evaluated two different ATCS interventions versus usual care.
Primary outcomes: clinical outcomes
Pain
-
Multimodal/complex intervention versus usual care
Kroenke 2014 found that compared with usual care, the intervention (ATCS Plus, nurse care, and stepped care with analgesics) probably reduced pain intensity at 12 months (mean (SD) intervention group 3.57 (2.22) versus 4.59 (2.13) usual care group; MD = −1.02, 95% CI −1.58 to −0.47; P < 0.001, where a 1 point change is clinically relevant), pain severity (scores range from 0 to 10,with higher scores representing worse pain) (MD −1.00, 95% CI −1.53 to −0.46; P < 0.001), pain interference (brief pain inventory) (MD −1.05, 95% CI −1.71 to −0.39; P < 0.001), and differences in response rates at 12 months (total pain score responders) (MD 1.91, 95% CI 1.36 to 2.69; P < 0.001; moderate certainty evidence).
-
IVR versus usual care
Naylor 2008 reported that compared with usual care, IVR may have reduced slightly typical pain intensity (range from 0 (no pain) to 10 (worst pain)) (mean usual care −1.0 (SD 1.8) versus IVR group mean −2.3 (SD 2.3) at eight‐month follow‐up (low certainty evidence).
Overall, these results suggest that a multimodal/complex intervention probably improves, and an IVR intervention may slightly improve, measures of chronic pain management in adults.
Secondary outcomes
Patient‐centred outcomes: quality of life
Naylor 2008 reported that compared with usual care, IVR may have slightly improved function/disability and coping as measured with SF‐36 mental health composite (mean (SD) 10.4 (14.2) versus 1.1 (12.0); P < 0.05), SF‐36 physical health composite (mean (SD) 8.9 (10.1) versus 2.6 (7.3); P < 0.001), and total pain experience (mean (SD) −18.1 (13.5) versus −3.5 (11.4); P < 0.0001); at eight‐month follow‐up (low certainty evidence).
Chronic obstructive pulmonary disease (COPD)
Primary outcomes: clinical outcomes
Exacerbations, health status
-
ATCS Plus versus control (no calls)
Halpin 2009 reported that compared with no calls, the ATCS Plus intervention probably had little or no effect on the frequency of exacerbations or the proportion of participants experiencing one or more COPD exacerbation, and that there were probably little or no differences in the frequency, severity, or duration of events measured with the EXAcerbations of Chronic pulmonary disease Tool (EXACT) and patient‐reported outcome scale, nor were there changes in health status (mean (standard error (SE)) intervention 49.7 points (2.4) versus control 51.5 points (2.4) between the ATCS Plus and no calls control group at four months (moderate certainty evidence).
Diabetes mellitus
Ten studies evaluated ATCS versus usual care for managing diabetes mellitus (Graziano 2009; Homko 2012; Katalenich 2015; Khanna 2014; Kim 2014; Lorig 2008; Piette 2000; Piette 2001; Schillinger 2009; Williams 2012). In several of these studies, we could combine results because outcome measures and timing were comparable. In other cases, we could not combine results with data from other studies within the same comparison due to differences in outcome measures, timing of outcome assessment, or both. For a summary of the effects of ATCS interventions, compared with usual care for managing diabetes mellitus, see summary of findings Table 9.
Primary outcomes: clinical outcomes
Glycated haemoglobin
-
ATCS (ATCS Plus or IVR) versus usual care
We performed meta‐analysis on seven trials considered to be sufficiently homogeneous (Graziano 2009; Khanna 2014; Kim 2014; Lorig 2008; Piette 2001; Schillinger 2009; Williams 2012). It showed that compared with usual care, ATCS (ATCS Plus, IVR) may have reduced slightly glycated haemoglobin levels (MD −0.26%, 95% CI −0.50 to −0.01; low certainty evidence; Analysis 4.1). There was a moderate level of heterogeneity of the pooled studies (Tau2 = 0.06; Chi2 = 11.41, df = 5 (P = 0.04); I2 = 48%).
Homko 2012 and Katalenich 2015 did not report data amenable to meta‐analysis for this outcome, reporting different outcomes or the same outcome differently. Reporting median glycated haemoglobin levels, Katalenich 2015 found that compared with usual care, ATCS Plus may have had little or no effect at six months (P > 0.05; low certainty evidence). Homko 2012 found that compared with usual care, IVR may have had little or no effect on fasting blood glucose levels in pregnancy (P = 0.26) or infant birth weight at 26 months (P = 0.30; low certainty evidence).
Blood glucose levels, diabetes‐related symptoms
-
ATCS Plus versus usual care
Lorig 2008 found that compared with usual care, ATCS Plus may have improved symptoms of hypoglycaemia (range from 0 to 12, with higher scores indicating worse outcome) (mean intervention change (SD) −0.453 (1.80) versus 0.029 (1.46); P = 0.042) and symptoms of hyperglycaemia (range from 0 to 12, with higher scores indicating worse outcome) (mean intervention change (SD) −0.827 (2.11) versus 0.029 (2.09); P < 0.001) at six months (low certainty evidence).
Piette 2001 found that compared with usual care, ATCS Plus probably slightly improved diabetes‐related symptoms (all symptoms) at 12 months (adjusted values: intervention group mean (SE) 3.7 (0.2) versus 4.4 (0.2); P = 0.04; moderate certainty evidence).
Blood pressure, blood lipids
-
ATCS Plus versus usual care
Khanna 2014 found that compared with usual care, ATCS Plus may have had little or no effect on systolic blood pressure (P = 0.43), diastolic blood pressure (P = 0.93), total cholesterol (P = 0.70), triglycerides (P = 0.55), high‐density lipoprotein (P = 0.75), or low‐density lipoprotein levels (P = 0.08) at three months (low certainty evidence).
Schillinger 2009 found that compared with usual care, ATCS Plus may have had little or no effect on systolic blood pressure (mean intervention (SD) 136.9 mmHg (20.4) versus 141.5 mmHg (23.9), standardised effect size 0.19, P = 0.20) or diastolic blood pressure (mean intervention (SD) 75.4 mmHg (12.3) versus 78.5 mmHg (18.5), standardised effect size 0.14, P = 0.40; low certainty evidence).
BMI, anthropometrics
-
ATCS Plus versus usual care
Khanna 2014 found that compared with usual care, ATCS Plus may have had little or no effect on BMI (P = 0.21) or waist circumference (P = 0.31) at three months (low certainty evidence). Schillinger 2009 found that compared with usual care, ATCS Plus may have had little or no effect on BMI (mean intervention (SD) 30.7 kg/m2 (6.9) versus 31.4 kg/m2 (8.5), standardised effect size −0.06, P = 0.8); low certainty evidence).
Psychological outcomes, mental health
-
ATCS Plus versus usual care
Piette 2000 found that compared with usual care, ATCS Plus probably had little or no effect on anxiety (P = 0.496) but probably improved slightly symptoms of depression (P = 0.023) (moderate certainty evidence). Lorig 2008 found that compared with usual care, ATCS Plus may have improved health distress (five‐items scale) (mean intervention change (SD) 0.595 (1.30) versus control −0.089 (1.29); P = 0.009) at six months (low certainty evidence). Schillinger 2009 found that compared with usual care, ATCS Plus may have had little or no effect on mental health (SF‐12, scale range 0–100 with higher scores indicating better outcome) (mean intervention (SD) 67.0 (25.8) versus 64.2 (27.2), standardised effect size 0.18, P = 0.20) (low certainty evidence).
Functional status
-
ATCS Plus versus usual care
Piette 2000 found that compared with usual care, ATCS Plus probably had little or no effect on decreased activity due to illness (P = 0.248) but probably reduced slightly days in bed because of illness (P = 0.026; moderate certainty evidence). Lorig 2008 found that compared with usual care, ATCS Plus may have had little or no effect on self‐reported global health (range from 0 to 5, with higher scores indicating better outcome) (mean intervention change (SD) −0.128 (1.30) versus control −0.023 (0.807); P = 0.713), activity limitation (range from 0 to 4) (mean intervention change (SD) −0.149 (1.05) versus control −0.119 (1.12); P = 0.273), or fatigue (range from 0 to 10, with higher scores indicating worse fatigue) (mean intervention change (SD) −0.254 (3.08) versus −0.145 (3.48); P = 0.694) at six months (low certainty evidence). Schillinger 2009 found that compared with usual care, ATCS Plus may have had little or no effect on physical health functional status (SF‐12, scale range 0–100 with higher scores indicating better outcome) (mean intervention (SD) 60.2 (29.1) versus 56.7 (31.3), standardised effect size 0.11, P = 0.4 ) but may have improved slightly functional status (mean intervention (SD) 1.4 bed days/month (2.7) versus 3.1 bed days/month (7.2), rate ratio 0.5, 95% CI 0.3 to 1.0, P = 0.05; low certainty evidence).
Primary outcomes:behavioural outcomes
Self‐monitoring of diabetic foot
-
ATCS Plus versus usual care
Meta‐analysis of two trials, considered to be sufficiently homogeneous, suggested that compared with usual care, ATCS Plus probably improved slightly self‐monitoring of diabetic foot (SMD 0.24, 95% CI 0.06 to 0.42; moderate certainty evidence; Analysis 4.2; Piette 2001; Schillinger 2009). There was no evidence of heterogeneity among the studies (Tau2 = 0.00; Chi2 = 0.67, df = 1 (P = 0.41); I2 = 0%). We expressed the effect size as standardised mean difference (SMD) because the studies used different measurement instruments, i.e. seven‐ item Likert‐like scale and telephone interview.
Self‐monitoring of blood glucose
-
ATCS Plus versus usual care
Lorig 2008 found that compared with usual care, ATCS Plus may have had little or no effect on self‐monitoring of blood glucose (mean intervention change (SD) 0.05 times/week (0.39) versus control 0.08 times/week (0.37); P = 0.457) at six months (low certainty evidence). At 12 months, however, pooled data from two studies showed that ATCS Plus probably improved slightly self‐monitoring of blood glucose compared with usual care (moderate certainty evidence)(Piette 2001; Schillinger 2009).
-
IVR versus usual care
Graziano 2009 found that compared with usual care, IVR probably increased slightly the mean change in frequency of self‐monitoring of blood glucose (P < 0.001; moderate certainty evidence).
Weight monitoring
-
ATCS Plus versus usual care
Piette 2001 found that compared with usual care, ATCS Plus probably had little or no effect on weight monitoring at 12 months (range from 0 = never to 5 = daily) (adjusted values: intervention group mean (SE) 2.6 (0.1) versus 2.5 (0.1); P = 0.60; moderate certainty evidence).
Physical activity, diet
-
ATCS Plus versus usual care
Lorig 2008 found that compared with usual care, ATCS Plus may have had little or no effect on aerobic exercise (mean intervention change (SD) 3.60 min/week (107) versus control −3.47 min/week (115); P = 0.891) at six months (low certainty evidence). Schillinger 2009 found that compared with usual care, ATCS Plus may have slightly improved diet (mean (SD) 4.4 (1.1) versus 3.9 (1.5), standardised effect size 0.42; P = 0.003), and exercise (mean (SD) 2.6 (2.0) versus 1.9 (1.8), standardised effect size 0.47, P = 0.0008) and may have improved moderate intensity physical activity levels (two more hours/week with intervention) (standardised effect size 0.31, P = 0.03) but may have had little or no effect on vigorous intensity physical activity levels (standardised effect size 0.21, P = 0.10) at 12 months (low certainty evidence).
Medication adherence
-
ATCS Plus versus usual care
Katalenich 2015 found that compared with usual care, ATCS Plus may have had little or no effect on adherence rates at six months (P = 0.04; low certainty evidence). Piette 2001 found that compared with usual care, ATCS Plus probably had little or no effect on medication use at 12 months (adjusted values: intervention group any medication problem 45 versus 39; P = 0.40; moderate certainty evidence).
Overall, the results suggest that compared with usual care, ATCS interventions (ATCS Plus, IVR) probably slightly reduce glycated haemoglobin levels and probably slightly improve self‐monitoring of diabetic foot and blood glucose levels. ATCS Plus interventions may also slightly improve symptoms associated with diabetes, depression, and distress, but they may have little or no effect on medication adherence or use, anxiety, blood pressure, BMI, or weight monitoring, and they appear to have mixed effects on functional measures, diet, and physical activity levels.
Secondary outcomes
Process outcomes: satisfaction with care
-
ATCS Plus versus usual care
Piette 2001 found that compared with usual care, ATCS Plus probably improved slightly satisfaction with care measured with the Employee Health Care Value Survey (range from 1 = poor to 5 = excellent) at 12 months (adjusted values: intervention group mean (SE) 3.8 (0.05) versus usual care 3.7 (0.04); P = 0.05; moderate certainty evidence). Schillinger 2009 found that compared with usual care, ATCS Plus may have improved participant assessment of chronic illness care (100‐point scale, with higher scores representing greater chronic care model alignment) (mean intervention (SD) 58.9 (23.1) versus 48.2 (26.5), standardised effect size 0.51; P = 0.0003); low certainty evidence).
Process outcomes: cost‐effectiveness
-
ATCS Plus versus usual care
Katalenich 2015 found that compared with usual care, ATCS Plus may have reduced healthcare expenditure (estimated cost for intervention USD 681.82 per participant versus estimated cost of USD 1131.07 usual care per participant, P < 0.001; low certainty evidence).
Process outcomes: healthcare use
-
ATCS Plus versus usual care
Lorig 2008 found that compared with usual care, ATCS Plus may have had little or no effect on healthcare utilisation as measured with physician visits (mean intervention change (SD) −0.028 visits/past six months (3.14) versus −0.064 visits/past six months (2.64); P = 0.852), accident and emergency visits (mean intervention change (SD) −0.107 visits/past six months (0.820) versus control −0.081 visits/past six months (0.943); P = 0.665), or length of hospital stay (mean intervention change (SD) 0.35 days (7.18) versus control −0.09 days (1.49); P = 0.26) (low certainty evidence). Piette 2001 found that compared with usual care, ATCS Plus probably increased the use of specialty services including podiatry clinics (adjusted values: intervention group 62 visits versus 42 visits; P = 0.003), foot examinations (92 examinations versus 72 examinations; P = 0.0002), and diabetes clinics (61 visits versus 25 visits; P = 0.03), and probably increased slightly cholesterol testing (87 versus 78; P = 0.05). However, it probably had little or no effect on opthalmopathy visits (40 visits versus 38 visits; P = 0.8; moderate certainty evidence).
Cognitive outcomes: self‐efficacy
-
ATCS Plus versus usual care
Lorig 2008 reported that ATCS Plus may have improved self‐efficacy scores (assessed on a 0 to 10 scale) (mean change intervention (SD) 0.695 points (2.36) versus usual care 0.004 points (2.37); P < 0.001; low certainty evidence). Piette 2000 found that compared with usual care, ATCS Plus probably improved slightly self‐efficacy (P = 0.006; moderate certainty evidence).
Patient‐centred outcomes: quality of life
-
ATCS Plus versus usual care
Katalenich 2015 found that compared with usual care, ATCS Plus may have had little or no effect on on quality of life at six months (P = 0.04; low certainty evidence). Piette 2000 found that compared with usual care, ATCS Plus probably had little or no effect on diabetes‐specific health‐related quality of life (P = 0.770; moderate certainty evidence). Williams 2012 found that compared with usual care, IVR may have improved the mental health‐related quality of life component of the SF‐36 (MD 3.0, 95% CI 0.8 to 5.2 P = 0.007) but may have had little or no effect on the physical component (MD 0.4, 95% CI −1.7 to 2.4, P = 0.7; low certainty evidence).
Heart failure
Four studies evaluated ATCS versus usual care for improving health outcomes and reducing healthcare utilisation in participants with heart failure (Capomolla 2004; Chaudhry 2010; Krum 2013; Kurtz 2011). For a summary of the effects of ATCS interventions versus usual care on heart failure outcomes, see summary of findings Table 10.
Below, we report results for individual outcomes except for the study by Kurtz 2011, which defined adverse events as a composite outcome of cardiac mortality plus rehospitalisation for heart failure.
Primary outcomes: clinical outcomes
Hospitalisation for heart failure
Four studies reported the effects of ATCS interventions on this outcome, but we could not statistically pool results because of high heterogeneity (over 90%). We therefore present the results narratively.
-
ATCS Plus versus usual care or usual community care
Chaudhry 2010 found that compared with usual care, the intervention had little or no effect on hospitalisation for heart failure (27.5% intervention group versus 27% usual care; P = 0.81; high certainty evidence), with Krum 2013 also reporting that there was probably little or no effect for the intervention on this same outcome (14.3% intervention group versus 16.7% usual care; adjusted HR 0.78, 95% CI 0.45 to 1.33, P = 0.36; moderate certainty evidence). Capomolla 2004 reported that ATCS Plus may decrease hospitalisation rates for heart failure (25.4% intervention group versus 87.9% usual community care; P < 0.05; low certainty evidence).
-
IVR versus usual care
Kurtz 2011 reported that the IVR intervention had uncertain effects on hospitalisation for heart failure (13% intervention group versus 34% usual care; P < 0.05; very low certainty evidence).
Cardiac mortality
-
ATCS Plus, IVR versus usual care
Meta‐analysis of two trials, considered to be sufficiently homogeneous, found that ATCS had uncertain effects on cardiac mortality compared with usual care (RR 0.60, 95% CI 0.21 to 1.67; very low certainty evidence; Analysis 5.1; Capomolla 2004; Kurtz 2011). There was no evidence of heterogeneity (Chi2 = 0.99, df = 1 (P = 0.32); I2 = 0%).
All‐cause mortality
-
ATCS Plus versus usual care or usual community care
Meta‐analysis of three trials, considered to be sufficiently homogeneous, found that ATCS probably had little or no effect on all‐cause mortality compared with usual care or usual community care (RR 1.00, 95% CI 0.79 to 1.28; moderate certainty evidence; Analysis 5.2; Capomolla 2004; Chaudhry 2010; Krum 2013). There was no evidence of heterogeneity (Chi2 = 1.06, df = 2 (P = 0.59); I2 = 0%).
All‐cause hospitalisation
-
ATCS Plus versus usual care or usual community care
Capomolla 2004 found that compared with usual community care, ATCS Plus may have reduced all‐cause hospitalisation (for chronic heart failure, cardiac cause and other cause; 22 in intervention group versus 77 in control group; P < 0.009; low certainty evidence), and Krum 2013 similarly reported that the intervention probably slightly decreased all‐cause hospitalisation (45.9% intervention group versus 55.9% usual care; P = 0.021; moderate quality evidence). However, Chaudhry 2010 (the largest, highest quality study) found that the ATCS Plus intervention had little or no effect on readmission for any reason (49.3% intervention group versus 47.4% usual care; P = 0.45; high certainty evidence).
Global health rating
-
ATCS Plus versus usual care
Krum 2013 reported that the intervention probably improved slightly the proportion of participants with improved global health questionnaire ratings at 12 months (35.6% intervention group versus 28.4% receiving usual care; no further data; moderate certainty evidence).
Adverse events
-
ATCS Plus versus usual care
Chaudhry 2010 did not report any adverse events during the study period.
-
IVR versus usual care
Kurtz 2011 classified adverse events as cardiac mortality plus rehospitalisation for heart failure (reported as individual outcomes above), with uncertain effects upon this composite outcome reported (22% in intervention group versus 44% usual care group; P < 0.04; very low quality evidence).
Overall, these results suggest that, compared with usual care, ATCS interventions probably have little or no effect on hospitalisation for heart failure, all‐cause mortality, or all‐cause hospitalisation. Effects on cardiac mortality are uncertain, as are adverse events associated with the intervention in this population.
Secondary outcomes
Process outcomes: usability of ATCS
-
ATCS Plus versus usual care
Capomolla 2004 found that adherence to the ATCS system was 81%. There were no comparison group data for the usability outcome in this study (low certainty evidence).
Process outcomes: cost‐effectiveness/resource use
-
ATCS Plus versus usual care
Capomolla 2004 found that compared with usual community care, ATCS Plus may have reduced emergency room use at (median) 11 months (1 visit in intervention group versus 12 visits in usual care group, P < 0.05; low certainty evidence).
Chaudhry 2010 found that compared with usual care, the intervention had little or no effect on length of hospital stay (mean (SD) intervention group 7.2 days (15.6) versus 7.0 days (14.9) usual care, P = 0.27) or number of hospitalisations (none: 50.7% intervention versus 52.6% usual care group; one admission: 24% intervention versus 25.6% usual care; five or more admissions: 3% intervention versus 2.4% usual care group; high certainty evidence).
HIV/AIDS
Only Shet 2014 assessed the effects of ATCS interventions in HIV/AIDS, comparing a complex multimodal intervention (a combination of IVR calls, a weekly non‐interactive neutral pictorial message, plus three counselling sessions and antiretroviral treatment) with usual care.
Primary outcomes: clinical outcomes
Time to virological failure
Shet 2014 reported that the intervention did not change the time to virological failure (unadjusted HR 0.98, 95% CI 0.67 to 1.47, P = 0.95; high certainty evidence).
Mortality
There were 21/315 (6.7%) deaths in the intervention compared with 23/316 (7.3%) in usual care arm. Mortality assessment showed that 4.51 deaths per 100 person‐years (95% CI 2.94 to 6.91) occurred in the intervention arm, compared with 5.04 deaths per 100 person‐years (3.35 to 7.58) in the standard care arm (high certainty evidence).
Primary outcomes: behavioural outcomes
Medication adherence
Shet 2014 found that the complex intervention had little or no effect on medication adherence (unadjusted incidence rate ratio 1.24, 95% CI 0.93 to 1.65, P = 0.14; high certainty evidence).
Attrition from the study
Attrition occurred at the rate of 3.43 dropouts per 100 person‐years (95% CI 2.10 to 5.61) and 4.82 dropouts per 100 person‐years (3.17 to 7.31) in the intervention and usual care arms, respectively (high certainty evidence).
Hypercholesterolaemia
Hyman 1996 and Hyman 1998 evaluated ATCS (IVR and ATCS Plus, respectively) versus usual care for managing hypercholesterolaemia.
Primary outcomes: clinical outcomes
Total cholesterol
-
ATCS Plus versus usual care
Hyman 1998 found that compared with usual care, ATCS Plus may have had little or no effect on total cholesterol levels (P = 0.58; low certainty evidence).
-
IVR versus usual care
Hyman 1996 found that compared with usual care, IVR may have had little or no effect on total cholesterol levels (P = 0.94; low certainty evidence).
Primary outcomes:behavioural outcomes
Dietary fat intake
-
ATCS Plus versus usual care
Hyman 1998 found that ATCS Plus may have had little or no effect on dietary fat intake (−2.1 versus −2.0; low certainty evidence).
Overall, these results suggest that, compared with usual care, ATCS interventions may have very little or no effect on total cholesterol levels or dietary intake of fats in people with hypercholesterolemia, although evidence was of low certainty and from a small number of studies.
Secondary outcomes
Cognitive outcomes: knowledge, self‐efficacy
-
ATCS Plus versus usual care
Hyman 1998 found that ATCS Plus may have had little or no effect on self‐efficacy or on knowledge about saturated and polyunsaturated fats: at baseline both groups scored 37% of items correct on a 9‐point knowledge scale; postintervention, the ATCS Plus group improved by 0.14 and the usual care group by 0.06 items on the scale (low certainty evidence).
Process outcomes: acceptability
-
IVR versus usual care
Hyman 1996 reported that 83.3% of a subset evaluating the IVR intervention indicated the phone messages were helpful. There was no comparison group for this acceptability outcome.
Hypertension
Five trials evaluated the effectiveness of ATCS compared with usual care with and without education for managing hypertension (Bove 2013; Dedier 2014; Harrison 2013; Magid 2011; Piette 2012). For a summary of the effects of these comparisons on hypertension, see summary of findings Table 11.
Primary outcomes: clinical outcomes
-
ATCS (multimodal/complex intervention, ATCS Plus, unidirectional ATCS) versus usual care or enhanced usual care (plus information)
Systolic blood pressure
Meta‐analysis of three trials, considered to be sufficiently homogeneous, found that ATCS probably reduced slightly systolic blood pressure compared with usual care with or without information (MD −1.89 mmHg, 95% −2.12 to −1.66; moderate certainty evidence; Analysis 6.1; Harrison 2013; Magid 2011; Piette 2012). There was no evidence of heterogeneity among the pooled studies (Tau2 = 0.00; Chi2 = 1.48, df = 2 (P = 0.48); I2 = 0%).
Diastolic blood pressure
Meta‐analysis of two trials reported no effect for ATCS on diastolic blood pressure compared with usual care (MD 0.02 mmHg, 95% CI −2.62 to 2.66; low certainty evidence; Analysis 6.2; Harrison 2013; Magid 2011). There was a substantial degree of heterogeneity in the meta‐analysed studies (Tau2 = 2.84; Chi2 = 3.63, df = 1 (P = 0.06); I2 = 72%).
We did not include two studies in the meta‐analysis, as they reported different outcomes or insufficient information to allow inclusion (Bove 2013; Dedier 2014).
Bove 2013 found that compared with usual care, a multimodal/complex intervention (ATCS Plus plus sphygmomanometer, a weighting scale, pedometer, and instructions on their use) probably had little or no effect on blood pressure control at six months (54.5% controlled in intervention group versus 52.3% in usual care group, P = 0.43; moderate certainty evidence).
Dedier 2014 reported that compared with usual care plus education, IVR may have had little or no effect on systolic blood pressure at three months (P > 0.05; low certainty evidence).
Health status
-
ATCS Plus versus enhanced usual care (plus information)
Piette 2012 found that compared with enhanced usual care, ATCS Plus may have slightly improved overall health status (mean (SE) 2.5 (0.09) versus 2.1 (0.08), P = 0.0009, where 1 = poor and 5 = excellent) at six weeks (low certainty evidence).
Depression
-
ATCS Plus versus enhanced usual care (usual care plus information)
Piette 2012 found that compared with enhanced usual care, ATCS Plus may have reduced depressive symptoms on the 10‐item Center for Epidemiologic Studies Depression Scale (CESD) at six weeks (MD −2.5, 95% CI −4.1 to −0.8; P = 0.004; low certainty evidence).
Primary outcomes: behavioural outcomes
Medication adherence/use
-
Multimodal/complex versus usual care
Magid 2011 found that compared with usual care, a multimodal/complex intervention (ATCS Plus plus patient education, home blood pressure monitoring, and clinical pharmacist management of hypertension with physician oversight) may have had little or no effect on medication adherence assessed as either medication possession ratio (mean intervention group 0.85 (SD 0.19) versus usual care group mean 0.84 (SD 0.19), P = 0.88) or the proportion of people adherent (69.9% intervention versus 69.4% usual care classified as adherent; low certainty evidence).
-
ATCS Plus versus enhanced usual care (plus information)
Piette 2012 found that compared with enhanced usual care, ATCS Plus may have reduced the number of medication‐related problems measured using a seven‐item index (intervention group mean (SE) 2.8 (0.2) versus control group 3.6 (0.2)) at six weeks (low certainty evidence).
Physical activity
-
IVR versus enhanced usual care
Dedier 2014 reported that compared with usual care plus education, IVR may have increased slightly physical activity levels (143.2 min/week intervention group versus 110.2 min/week control group, P = 0.007; low certainty evidence).
Overall, these results suggest that, compared with usual care, ATCS interventions may have little or no effect on blood pressure or medication adherence in people with hypertension but may improve some outcomes such as medication problems, depressive symptoms, physical activity, and perceived health status to a small degree. However, almost all results were based on low certainty evidence.
Secondary outcomes
Process outcomes: satisfaction
-
ATCS Plus versus enhanced usual care
Piette 2012 found that compared with usual care and information, ATCS Plus may have improved slightly participants' satisfaction with hypertension care scores at six weeks (mean (SE) intervention group 1.8 (0.06) versus 1.4 (0.09) usual care group; P = 0.06; where 0 = not receiving care for hypertension; 1 = receiving care but dissatisfied; 2 = satisfied; low certainty evidence).
Mental health
Three studies evaluated different ATCS interventions versus advice only (Farzanfar 2011), relaxation therapy (Greist 2002), or healthy lifestyle (Zautra 2012) for managing mental health problems.
Primary outcomes: clinical outcomes
Obsessive compulsive disorder symptoms
-
ATCS Plus versus control (relaxation therapy)
Greist 2002 found that compared with control, ATCS Plus may have improved symptoms of obsessive compulsive disorder (Yale‐Brown obsessive compulsive scale score, range 0‐40) at three months (mean (SD) intervention group 19.0 points (7.2) versus control 24.1 points (6.7); P < 0.001; low certainty evidence).
Depression, stress symptoms, other outcomes
-
ATCS Plus versus control (relaxation therapy)
Greist 2002 found that compared with control, ATCS Plus may have had little or no effect on depressive symptoms measured with the Hamilton rating scale for depression (range 0‐50) at three months (mean intervention group (SD) 9.6 points (7.9) versus 10.0 points (8.2); P = 0.16) but may have improved results on the clinical global impressions scale (38% versus 14% 'much' or 'very much' improved; P = 0.002) and the patient's global impressions scale (38% versus 15% 'much' or 'very much' improved; P = 0.004) (low certainty evidence).
-
IVR versus control (advice)
Farzanfar 2011 reported that compared with control, IVR may have had little or no effect on depressive symptoms measured with total depression score (scale from 0 to 27 with higher values indicating more depression) at six months (mean change from baseline for intervention group (SD) −2.2 points (4.7) versus −1.8 points (4.5) or symptoms of stress measured with stress questionnaire score (score from 1 to 16 with higher values indicating greater stress) (mean change from baseline for intervention group (SD) −2.1 points (3.4) versus −1.8 points (3.1); low certainty evidence).
-
Unidirectional ATCS versus control (healthy lifestyle)
Zautra 2012 found that compared with control, the intervention may have had little or no effect on stress but may have reduced slightly depressive symptoms at one month (P < 0.05; low certainty evidence).
Well‐being
-
IVR versus control (advice)
Farzanfar 2011 reported that compared with control, IVR may have had little or no effect on well‐being index total scores (score from 0 to 25 with higher values indicating better functioning) (mean change from baseline for intervention group (SD) 3.7 points (6.8) versus 3.5 points (7.1); low certainty evidence).
Overall, these results suggest that, compared with various controls, ATCS interventions may have little or no effect on several indices of mental health, but the results are based on a small number of studies, with evidence of low certainty.
Secondary outcomes
Process outcomes: acceptability of service
-
IVR versus control (advice)
In Farzanfar 2011, more than 60% of the participants found the ATCS intervention useful, user‐friendly, informative and appropriately paced (low certainty evidence). Authors reported no comparison group data for this outcome.
Process outcomes: satisfaction
-
ATCS Plus versus control (relaxation therapy)
Greist 2002 found that compared with control, ATCS Plus may have improved satisfaction scores (low certainty evidence).
Patient‐centred outcomes: quality of life
-
IVR versus control (advice)
Farzanfar 2011 reported that compared with control, IVR may have had little or no effect on quality of life at six months (physical health scale) but may have improved slightly quality of life mental health scale scores (scale from 0 to 100) at six months (mean increase from baseline for intervention group (SD) 10.9 (10.1) versus 6.0 (12.7); P < 0.10 with higher scores indicating better outcome; low certainty evidence).
Obstructive sleep apnoea syndrome (OSAS)
DeMolles 2004 and Sparrow 2010 assessed ATCS interventions (IVR) versus usual care or attention placebo, respectively, for managing the symptoms of OSAS.
Primary outcomes: clinical outcomes
Sleep symptoms
-
IVR versus usual care or control (attention placebo via IVR)
DeMolles 2004 found that compared with usual care, IVR may have had little or no effect on improving functional outcomes of sleep (P = 0.171) but may have slightly improved scores on the sleep symptoms checklist (maximum score 45, lower score indicates improvement) (intervention group mean (SD) 9.4 (6.0) versus usual care group mean 13.4 (6.6), P = 0.047; low certainty evidence).
Sparrow 2010 found that compared with control, the slightly increased continuous positive airway pressure (CPAP) adherence in the IVR group was associated with a greater reduction in depressive symptoms (regression coefficient −0.028, SE 0.014, 95% CI 0.056 to 0.000, P = 0.048) and improvements in function (regression coefficient 0.021, SE 0.007, 95% CI 0.008 to 0.035, P = 0.003; low certainty evidence).
Primary outcomes: behavioural outcomes
CPAP use
-
IVR versus usual care or control (attention placebo via IVR)
DeMolles 2004 found that compared with usual care, IVR may have increased slightly CPAP use at two months (intervention group mean (SD) 4.4 h nightly use (3.0) versus 2.9 h nightly use (2.4) in usual care group, P = 0.07; low certainty evidence). Sparrow 2010 found that compared with control, IVR may have increased slightly CPAP use at both 6 months (median 2.4 h nightly use intervention group versus 1.48 h nightly use control) and 12 months (median 2.98 h nightly use intervention group versus 0.99 h nightly use control group; low certainty evidence).
Overall, these results suggest that, compared with usual care or attention placebo, IVR interventions may slightly increase CPAP use in both the short and long term, with mixed effects on functional sleep outcomes and symptoms, although these results are based on low certainty evidence from only two small studies.
Smoking
We included 10 studies that evaluated ATCS versus various controls (no calls, usual care, control ('placebo' ATCS (IVR), self‐help intervention, stage‐matched manuals) on smoking abstinence and related outcomes (Brendryen 2008; Carlini 2012; Ershoff 1999; McNaughton 2013; Peng 2013; Reid 2007; Reid 2011; Regan 2011; Rigotti 2014; Velicer 2006). For a summary of the effects of ATCS interventions compared with various controls, see summary of findings Table 12.
Primary outcomes: clinical outcomes
Smoking abstinence
-
ATCS (multimodal/complex intervention, ATCS Plus, IVR) versus control (no calls, usual care, inactive IVR)
Meta‐analysis of seven trials considered to be sufficiently homogeneous suggested that, compared with control, ATCS may have had little or no effect on maintaining smoking abstinence (RR 1.20, 95% CI 0.98 to 1.46; low certainty evidence; Analysis 7.1; Brendryen 2008; Ershoff 1999; McNaughton 2013; Regan 2011; Reid 2007; Rigotti 2014; Velicer 2006). There was a moderate level of heterogeneity of the meta‐analysed studies (Tau2 = 0.04; Chi2 = 12.35, df = 6 (P = 0.05); I2 = 51%).
Smoking abstinence (other measures)
-
ATCS Plus, IVR versus usual care or no calls
Rigotti 2014 also reported that compared with usual care, ATCS Plus improved self‐reported continuous abstinence rates at six months (28% versus 16%; RR 1.70, 95% CI 1.15 to 2.51; P = 0.007; high certainty evidence); while McNaughton 2013 reported that compared with no calls, IVR may have had little or no effect on biochemically confirmed smoking abstinence at two years (21.7% of intervention group versus 42.9% of control group; P = 0.13; low certainty evidence).
We did not include three studies in meta‐analysis: Reid 2011 did not report sufficient information to allow us to include their data on abstinence, while Carlini 2012 and Peng 2013 reported outcomes other than abstinence rates.
-
ATCS Plus versus usual care
Reid 2011 reported that compared with usual care, ATCS Plus may have improved the continuous smoking abstinence rate at 26 weeks (38.7% versus 29.5%; adjusted OR 1.58, 95% CI 1.04 to 2.42; P = 0.034), and this was maintained at 52 weeks (35.6% versus 28.6%; adjusted OR 1.45; 95% CI 0.94 to 2.22; P = 0.093; low certainty evidence).
Primary outcomes: behavioural outcomes
Medication use
-
Complex/multimodal intervention versus control (self‐help booklet)
Brendryen 2008 found that compared with control, a multimodal/complex intervention probably had little or no effect on adherence to nicotine replacement therapy (93% in intervention group versus 87% control group; P = 0.07; moderate certainty evidence).
-
ATCS Plus versus control (inactive IVR)
Regan 2011 found that compared with control, ATCS Plus probably had little or no effect on medication use (moderate certainty evidence).
Support programme enrolment
-
ATCS Plus versus control (inactive IVR)
Carlini 2012 found that compared with control, ATCS Plus may have improved re‐enrolment into a quitline support programme (OR 11.2, 95% CI 5.4 to 23.3, P < 0.001; low certainty evidence).
Overall, these results suggest that compared with various controls, ATCS interventions may have little or no effect on maintenance of smoking abstinence. ATCS Plus interventions increase abstinence at six months, but effects of IVR and ATCS Plus at longer time points appear inconsistent. ATCS Plus may improve cessation programme support enrolment, with probably little or no effect on adherence to medication, but the certainty of the evidence was variable (moderate to low).
Secondary outcomes
Process outcomes: cost‐effectiveness
-
ATCS Plus versus usual care
Rigotti 2014 found that the incremental per‐participant costs in the intervention group were USD 540 (year 1) and USD 294 (subsequent years) (high certainty evidence). There was no comparative data presented for cost‐effectiveness outcomes.
Process outcomes: acceptability
-
IVR versus control (booklet)
Ershoff 1999 reported that 25% of intervention non‐users felt that they did not know enough about the automated system; 33% did not think it could help them to quit smoking, and 20% did not like the idea of entering information into a computer. There was no comparison group for satisfaction outcomes.
Cognitive outcomes: self‐efficacy
-
Complex/multimodal intervention versus control (self‐help booklet)
Brendryen 2008 found that compared with a self‐help booklet, ATCS Plus (complex intervention) probably increased smoking cessation self‐efficacy (seven‐point scale) at 12 months (mean intervention group (SD) 5.10 points (1.41) versus control 4.38 points (1.31); P < 0.001); moderate certainty evidence).
-
ATCS Plus versus control (inactive IVR)
Peng 2013 found that compared with control, ATCS Plus may have had little or no effect on self‐efficacy, stage of change or decisional balance toward smoking cessation at four weeks (P > 0.05; low certainty evidence).
Spinal cord dysfunction
One study evaluated IVR versus usual care for managing spinal cord dysfunction (Houlihan 2013).
Primary outcomes: clinical outcomes
Pressure ulcers, depression
Houlihan 2013 reported that compared with usual care, the IVR (CareCall) may have had little or no effect on the number of pressure ulcers (in adjusted models), but may have reduced slightly the severity of depression at six months in those with depression at baseline (effect size −0.56; P = 0.038; low certainty evidence).
Sensitivity analyses
There were not enough data (at least 10 studies) included in any of the pooled analyses to perform sensitivity analyses.
Assessment of publication bias
Formal assessment of potential publication bias was not feasible given the small number of trials contributing data to outcomes within different comparisons in this review.
Discusión
Los SCTA son una plataforma tecnológica mediante la cual los profesionales de la salud pueden recopilar información relevante o proporcionar apoyo a las decisiones, fijación de metas, entrenamiento, recordatorios o conocimiento relacionado con la salud a los consumidores a través de teléfonos inteligentes, tabletas, telefonía fija, o teléfonos móviles, mediante programas de reconocimiento de la voz o teclado numérico. Los SCTA tienen el potencial de transformar los sistemas de asistencia sanitaria modernos al fortalecer a los consumidores, cambiando sus comportamientos, mejorando los resultados clínicos y previniendo la enfermedad. Esta revisión sistemática evaluó las pruebas sobre la efectividad de las intervenciones de SCTA para mejorar una amplia variedad de resultados relacionados con la salud en cuanto a la prevención de la salud y el tratamiento de las enfermedades crónicas.
Resumen de los resultados principales
SCTA para la prevención de la salud
Efectividad de los SCTA para mejorar la aceptación de la inmunización
Las pruebas indican que los SCTA (SCTA Plus, RVI, unidireccionales) probablemente aumentan la aceptación de las inmunizaciones en los niños en comparación con ningún recordatorio, cartas o atención habitual (pruebas de confiabilidad moderada). En comparación con la atención habitual, probablemente aumentan levemente la aceptación de la inmunización en los adolescentes (pruebas de confiabilidad moderada) y tienen efectos inciertos sobre la aceptación en adultos (pruebas de confiabilidad muy baja) (Resumen de los hallazgos para la comparación principal). Se consideraron los resultados por separado por población, debido a que de otro modo había un grado demasiado alto de heterogeneidad en los cálculos del efecto agrupados. Los análisis de subgrupos por tipo de SCTA no fueron posibles debido al número desigual de estudios en las categorías respectivas (SCTA Plus versus RVI versus SCTA unidireccionales) y el número pequeño de estudios tanto dentro de cada comparación como en general. Aunque las pruebas son alentadoras en cuanto a la mejoría de la aceptación de la inmunización, los estudios adicionales pueden reducir el nivel de inconfiabilidad asociada con algunos de los resultados, en particular los de los adultos.
Efectividad de los SCTA para mejorar los niveles de actividad física
Las pruebas sobre la efectividad de los SCTA para mejorar los niveles de actividad física son de confiabilidad generalmente baja. Los resultados indican que las intervenciones multimodales/complejas y con SCTA Plus pueden tener un efecto pequeño sobre varios índices del peso corporal, los marcadores metabólicos o la actividad física, mientras que las intervenciones con RVI pueden mejorar varias medidas, pero no todas, de la actividad física, en comparación con la atención habitual u otros controles (Resumen de los hallazgos 2). Aunque las pruebas pueden indicar algunos efectos alentadores para las intervenciones de SCTA seleccionadas, se necesitan estudios de mejor calidad metodológica para informar tanto la práctica como la política.
Efectividad de los SCTA para mejorar la aceptación del cribado
Las pruebas indican que para el cribado del cáncer de mama, las intervenciones multimodales/complejas aumentan las tasas de cribado (pruebas de alta confiabilidad), mientras que la RVI o las intervenciones de SCTA unidireccionales probablemente tienen poco o ningún efecto (pruebas de confiabilidad moderada) en comparación con el control, la atención habitual o la atención habitual mejorada. Para el cribado del cáncer colorrectal, las intervenciones multimodales/complejas aumentan las tasas de cribado (pruebas de alta confiabilidad) en comparación con la atención habitual, y las intervenciones con RVI probablemente mejoran las tasas de cribado a los seis meses pero no en puntos temporales posteriores (pruebas de confiabilidad moderada) en comparación con el control, la atención habitual, o la atención habitual mejorada. Las intervenciones de SCTA unidireccionales probablemente tienen poco o ningún efecto sobre las tasas de cribado del cáncer colorrectal (pruebas de confiabilidad moderada) en comparación con el control. Para el cáncer cervicouterino, una intervención con SCTA Plus probablemente mejora levemente la tasa de cribado en comparación con el control (pruebas de confiabilidad moderada), mientras que para el cribado de la osteoporosis, una intervención multimodal puede aumentar la aceptación del cribado en comparación con ninguna intervención (pruebas de baja confiabilidad), aunque los efectos de una intervención con SCTA Plus son inciertos en comparación con la atención habitual (Resumen de los hallazgos 3). Estos resultados indican que las intervenciones de SCTA Plus más complejas (es decir intervenciones multimodales/complejas), puede tener mayor probabilidad de mejorar los resultados relacionados con el cribado del cáncer de mama y del cáncer colorrectal que las intervenciones menos complejas (RVI y SCTA unidireccionales). Sin embargo, ningún ensayo evaluó directamente estas intervenciones comparándolas entre sí. En términos generales, las pruebas son alentadoras para la efectividad de algunas intervenciones de SCTA (complejas/multimodales) para el aumento de la aceptación del cribado, y parece improbable que los ensayos futuros cambien el nivel existente de confiabilidad.
Efectividad de los SCTA para la reducción del peso corporal
En los adultos, las pruebas indican que en comparación con diversos controles, los SCTA (multimodales/complejos, SCTA Plus) pueden apoyar una pérdida de peso leve (reducción en el IMC o el peso corporal), aunque los efectos de la RVI fueron contradictorios (pruebas de baja confiabilidad) (Resumen de los hallazgos 4). Los efectos de las intervenciones sobre otras medidas clínicas o conductuales en adultos son contradictorias, y no está claro si los eventos adversos pueden asociarse con las intervenciones de SCTA, o no. En los niños, las pruebas indican que en comparación con el control, las intervenciones de SCTA (SCTA Plus o RVI) probablemente tienen poco efecto sobre el control del peso evaluado con las puntuaciones z del IMC u otras medidas aproximadas del control del peso (pruebas de confiabilidad moderada). Para los estudios que evalúan los efectos de los SCTA en el control del peso, el metanálisis no fue posible debido al número pequeño de estudios y el grado alto de heterogeneidad entre los estudios. En términos generales, se necesitan ensayos para reducir el nivel existente de inconfiabilidad relacionada con los efectos de las intervenciones de SCTA sobre el control del peso tanto en los adultos como en los niños, y para investigar más a fondo cualquier evento adverso posible asociado con las intervenciones de SCTA en esta área.
Efectividad de los SCTA para la reducción de las tasas de inasistencia (recordatorios de citas)
Las pruebas indican que en comparación con ninguna llamada, las intervenciones de SCTA Plus probablemente tienen poco o ningún efecto sobre las tasas de asistencia. Las intervenciones con RVI o unidireccionales pueden mejorar las tasas de asistencia (ya sea la prevención de la salud o el tratamiento de las enfermedades crónicas), aunque los efectos fueron algo inconsistentes entre los puntos temporales (Resumen de los hallazgos 5), y las pruebas variaron de confiabilidad alta a baja. Los ensayos adicionales, que incluyen modelos económicos o análisis de costo‐eficacia, pueden reducir el nivel de inconfiabilidad acerca de los efectos del rango de intervenciones de SCTA para mejorar la asistencia a las citas.
SCTA para el tratamiento de las enfermedades crónicas
Efectividad de los SCTA para mejorar el cumplimiento de los fármacos o las pruebas de laboratorio
Los efectos de los SCTA en el cumplimiento de los fármacos o las pruebas de laboratorio aportan las pruebas más generales a través del tratamiento de las enfermedades crónicas; ver Resumen de los hallazgos 6. Las pruebas indican que los efectos de las intervenciones multimodales/complejas versus atención habitual o control son inconsistentes, y las pruebas fueron de confiabilidad variable, de manera que se necesita más investigación para establecer conclusiones firmes. Sin embargo, las intervenciones de SCTA Plus probablemente mejoran el cumplimiento con la medicación de forma leve a moderada en comparación con la atención habitual o el control aunque probablemente tienen poco efecto sobre el cumplimiento de las pruebas. Las intervenciones con RVI probablemente mejoran levemente las medidas del cumplimiento con la medicación en comparación con el control y probablemente mejoran el cumplimiento de las pruebas. Las pruebas también indican que las intervenciones con RVI probablemente mejoran levemente el cumplimiento de los fármacos a los seis meses aunque tienen poco o ningún efecto en los puntos temporales más largos en comparación con la atención habitual. Sin embargo, vale la pena señalar que la mayoría de los resultados se basaron en estudios con pruebas de confiabilidad moderada, y el tamaño de los efectos fue variable. Para los SCTA unidireccionales, las pruebas indican que en comparación con el control, estas intervenciones pueden tener poco efecto o pueden mejorar el cumplimiento de los fármacos a un grado pequeño. Los efectos de las intervenciones de SCTA sobre los resultados clínicos (control de la presión arterial, lípidos en sangre, control del asma, cobertura terapéutica) fueron inconsistentes, y en general se encontró poco o ningún efecto para las intervenciones. Sin embargo, sólo un número pequeño de estudios contribuyó con datos de resultado clínicos, y las pruebas fueron de confiabilidad moderada a baja, lo cual significa que se necesita investigación adicional que evalúe estos resultados para determinar más claramente los efectos sobre la salud así como los efectos en la conducta (cumplimiento). Ninguna de las intervenciones de SCTA se analizó directamente comparándolas entre sí. En términos generales, las pruebas indican que algunas intervenciones de SCTA podrían tener efectos alentadores sobre la medicación o el cumplimiento de las pruebas, aunque se necesita investigación de alta calidad adicional para definir mejor el tamaño de los efectos y para reducir la inconfiabilidad antes de que dichas intervenciones quizá se consideren para el uso como parte de la práctica habitual. Habiendo dicho esto, la empresa que realizó el ECA más grande en esta área encuentra valor y sigue colocando recordatorios telefónicos automatizados renovados para la medicación.
Efectividad de los SCTA para la reducción del consumo de alcohol
Las pruebas indican que las intervenciones de SCTA Plus pueden tener poco o ningún efecto sobre las medidas del consumo de alcohol en comparación con ninguna intervención, atención habitual u otras intervenciones (tratamiento cognitivo–conductual o educación/asesoramiento), aunque la confiabilidad de las pruebas fue baja en todos los casos. De igual manera, las intervenciones con RVI pueden mejorar levemente algunas medidas del consumo de alcohol en comparación con ninguna intervención o provisión de información, aunque el tamaño del efecto es pequeño, y las pruebas de confiabilidad generalmente baja (Resumen de los hallazgos 7). En esta área, los estudios fueron demasiado heterogéneos para el agrupamiento estadístico, y parece probable que la investigación adicional cambie la confiabilidad de las pruebas en relación con los efectos de las intervenciones de SCTA.
Efectividad de los SCTA para la reducción de la gravedad de los síntomas del cáncer
Las pruebas indican que en comparación con la atención habitual o el control, las intervenciones multimodales/complejas probablemente alivian el dolor y la depresión a los tres meses y más, aunque posiblemente a un grado más pequeño en los puntos temporales posteriores. Las intervenciones de SCTA Plus pueden tener poco o ningún efecto sobre los síntomas (gravedad, angustia o carga) o el cumplimiento con la medicación, aunque las pruebas fueron en su mayoría de confiabilidad baja y en algunos estudios la inclusión de los sistemas de SCTA como parte del suministro de atención habitual puede haber impedido la detección de cualquier efecto de la intervención. De igual manera, la RVI puede tener poco o ningún efecto sobre la gravedad de los síntomas, en comparación con el control o los SCTA Plus, aunque las pruebas fueron de confiabilidad generalmente baja y se basaron en pocos estudios (Resumen de los hallazgos 8). Parece probable que la investigación adicional en esta área cambie la confiabilidad en los efectos del uso de SCTA para tratar de aliviar los síntomas del cáncer.
Efectividad de los SCTA para el control de la diabetes mellitus
Las pruebas indican que, en comparación con atención habitual, las intervenciones de SCTA (SCTA Plus, RVI) pueden reducir levemente los niveles de hemoglobina glucosilada y probablemente mejorar de forma leve las conductas de autocuidado relacionadas con la diabetes como la automonitorización de los pies y los niveles de glucosa en la sangre, aunque pueden tener poco o ningún efecto sobre la monitorización del peso o el cumplimiento con la medicación o su uso, y parecen tener efectos contradictorios en la dieta y los niveles de actividad física (Resumen de los hallazgos 9). Las intervenciones de SCTA Plus a veces pueden tener un costo‐eficacia mayor que la atención habitual, aunque también pueden influir en la administración de asistencia sanitaria en formas cuya repercusión todavía no se comprende plenamente. En términos generales, las pruebas, aunque prometedoras para algunos resultados, fueron de confiabilidad baja a moderada. La investigación futura, incluidos los estudios que comparan directamente las intervenciones de SCTA Plus y RVI entre sí, podrían reducir las dudas existentes.
Efectividad de los SCTA para la insuficiencia cardíaca
En comparación con la atención habitual o la atención comunitaria habitual, las intervenciones de SCTA (SCTA Plus, RVI) probablemente tienen poco o ningún efecto sobre la hospitalización por insuficiencia cardíaca, la mortalidad por todas las causas o la hospitalización por todas las causas. Los efectos sobre la mortalidad cardíaca son inciertos debido a la confiabilidad muy baja de las pruebas para este resultado. Tampoco se conocen los efectos de los SCTA sobre los eventos adversos en esta población debido a los hallazgos inconsistentes de los dos estudios que buscaron específicamente los eventos adversos (Resumen de los hallazgos 10).
Efectividad de los SCTA para la hipertensión
En comparación con la atención habitual o la atención habitual mejorada, las intervenciones de SCTA (multimodales/complejas, SCTA Plus, RVI, SCTA unidireccionales) pueden tener poco o ningún efecto sobre la presión arterial en los pacientes con hipertensión. Las pruebas fueron de confiabilidad variable (de baja a moderada). Aunque para la presión arterial sistólica probablemente hubo una disminución pequeña con el uso de SCTA, este hecho no fue confirmado por los cambios en la presión arterial diastólica, que fueron insignificantes. Las intervenciones de SCTA pueden tener efectos positivos pequeños sobre los resultados relacionados incluidos los problemas con la medicación, los síntomas de depresión, la actividad física, y el estado de salud percibido, pero poco o ningún efecto sobre el cumplimiento con la medicación. Por lo tanto, actualmente las pruebas no son concluyentes para los resultados principales, y la mayoría de los resultados se basaron en pruebas de baja confiabilidad. Se considera que los ensayos futuros podrían reducir el nivel existente de inconfiabilidad en esta área (Resumen de los hallazgos 11).
Efectividad de los SCTA para el abandono del hábito de fumar
Las pruebas indican que en comparación con diversos controles o atención habitual, las intervenciones de SCTA (multimodales/complejas, SCTA Plus, RVI) pueden tener poco o ningún efecto sobre el mantenimiento de la abstinencia del hábito de fumar; las pruebas fueron de confiabilidad generalmente baja y hubo un nivel moderado de heterogeneidad en los estudios metanalizados. Las intervenciones de SCTA Plus pueden aumentar la abstinencia a los seis meses, aunque los efectos de la RVI y los SCTA Plus en puntos temporales más largos parecen inconsistentes. Los SCTA Plus pueden mejorar la inclusión en los programas de apoyo al abandono del hábito, probablemente con poco o ningún efecto sobre el cumplimiento de los fármacos, aunque la confiabilidad de las pruebas fue variable (moderada a baja). Ver Resumen de los hallazgos 12.
Compleción y aplicabilidad general de las pruebas
Se identificaron dos estudios de países de bajos ingresos (Honduras/México y la India) y uno de ingresos medios (Taiwán), y los 129 estudios restantes se realizaron en países de ingresos altos (Reino Unido, Estados Unidos, Australia, Noruega, Francia, Grecia, Italia, Suecia y Canadá). Sólo 14 estudios tuvieron lugar en los años noventa, mientras que los 118 restantes se realizaron desde 2000 en adelante. En la mayoría de los estudios, hubo información faltante acerca del modelo teórico que apoya la intervención con SCTA. De manera similar, a menudo hubo una descripción insuficiente del contenido de la llamada, lo cual dificultó el análisis, la interpretación, o la replicación de los resultados en cualquier profundidad, o la replicación de los componentes de los estudios.
En cuanto a la aplicación práctica de las intervenciones de SCTA, una gran parte de los estudios no informó si los participantes recibieron instrucciones sobre cómo utilizar el sistema. En varios ensayos, estuvo poco claro si los pacientes o los profesionales de la asistencia sanitaria iniciaron las llamadas o si los participantes usaron un teclado telefónico para interactuar con los sistemas (o no). Con frecuencia, también se omitió información acerca de la duración de la intervención, la frecuencia y la intensidad; la seguridad (efectos adversos) y el costo‐eficacia; los arreglos de seguridad; o las características de los hablantes.
Hay varias ventajas posibles de los SCTA, como la comodidad, el bajo costo, el acceso las 24 horas, y el carácter anónimo del participante, lo cual significa que las respuestas pueden ser menos propensas a las influencias del estigma y la conveniencia social percibida (Phillips 2015; Schroder 2009; Szilagyi 2013). Los estudios anteriores también informaron que tanto los pacientes como los profesionales informan un grado alto de satisfacción con los SCTA (Abu‐Hasaballah 2007), lo cual es consistente con estos resultados. El número pequeño de estudios que evalúan la satisfacción o la aceptabilidad de los SCTA informó que los participantes en general valoraron mucho estos aspectos, lo cual puede agregarse al atractivo de estos sistemas en la práctica. Los SCTA también pueden proporcionar un medio para comprometer a las poblaciones difíciles de alcanzar (Schroder 2009). Sin embargo, algunas personas con discapacidades, como la pérdida de audición grave o dificultades del habla, pueden ser incapaces de usar dichas intervenciones o de comprometerse con ellas plenamente, por lo cual los investigadores y los profesionales deben considerar con cuidado a las poblaciones a las cuales deberían orientarse las intervenciones de SCTA más adecuadamente antes de la ejecución.
Los estudios incluidos rara vez informaron sobre los eventos adversos asociados con la ejecución de las intervenciones de SCTA, como la sobrecarga de información, la preferencia por las interacciones con seres humanos, o los resultados clínicos o relacionados con la salud que presentaron un empeoramiento potencial. Lo anterior sigue siendo una duda principal en las pruebas sobre los efectos beneficiosos y perjudiciales posibles de este grupo de intervenciones en su totalidad y requiere evaluación en los estudios futuros.
Se sabe que no se han podido reunir algunos de los objetivos de la revisión, incluida la posibilidad de determinar qué componentes del diseño de las intervenciones pueden contribuir al cambio de conducta positivo, o qué tipos de SCTA son más efectivos para la prevención de la salud o el tratamiento de las enfermedades crónicas. Sin embargo, se consideró que los análisis de subgrupos no eran factibles debido a la distribución desigual y al número insuficiente de estudios en los subgrupos/categorías respectivas y las comparaciones y debido a la considerable heterogeneidad de las poblaciones, las intervenciones, los grupos comparadores y las medidas de resultado usadas. No obstante, se logró establecer que en algunos casos las intervenciones complejas/multimodales parecieron ser más efectivas que las menos complejas, aunque lo anterior fue de naturaleza observacional y varió a través de diferentes condiciones incluidas en la revisión. Esta relación posible entre la complejidad de la intervención de SCTA y la efectividad necesita investigación adicional, posiblemente mediante la extracción y el delineado de los componentes y las características esenciales más activos de las intervenciones de SCTA. Por ejemplo, la exploración de si el grado de interactividad de los SCTA influye en la efectividad en diferentes contextos es uno de dichos caminos. Será también de importancia la identificación de las características de las intervenciones de SCTA que son fundamentales para su efectividad en diferentes finalidades. Dichas preguntas podrían incluir la posibilidad de considerar si y cómo las intervenciones preventivas (p.ej. cribado y recordatorios de inmunización) son diferentes de las intervenciones usadas para controlar las enfermedades crónicas. La función y las finalidades de las intervenciones de SCTA en estos últimos contextos pueden abarcar un rango mayor de finalidades individuales, por períodos variables (p.ej. episódicos, continuos) y pueden requerir un mayor grado de adaptación individual para satisfacer las necesidades de los usuarios.
Las comparaciones directas entre diferentes tipos de SCTA también serían útiles para comprender mejor los efectos de dichas intervenciones e identificar más claramente los componentes y las características esenciales versus no esenciales. Esta revisión incluyó estudios que usaban intervenciones complejas/multimodales así como una variedad amplia de comparaciones, incluidas las intervenciones de SCTA similares comparadas entre sí (p.ej. Cleeland 2011; Peng 2013; Pinto 2002; Spoelstra 2013). Aunque este hecho aumenta el generalizabilidad de los resultados, aún hay mucho que determinar a pesar de la gran cantidad de bibliografía reciente recopilada aquí.
Se reconoce que el alcance de esta revisión es muy amplio (tanto prevención de la salud como tratamiento de las enfermedades crónicas), y una de sus fortalezas es que es el primer intento sistemático y riguroso de organizar y evaluar las pruebas de la efectividad en esta área del tema. También se reconoce que hay muchas otras posibles maneras de estructurar u organizar esta revisión, como según el tipo de intervención (en lugar de la condición), por tipos de resultados, o con un énfasis exclusivo en la prevención de la salud (en lugar de en combinación con el tratamiento de las enfermedades crónicas). Se considerarán factores como estos al planificar la actualización de esta revisión y también se evaluará la utilidad de diferentes marcos teóricos o modelos de lógica como base para estructurar o informar la revisión a un nivel general.
Calidad de la evidencia
Se evaluó la calidad de las pruebas mediante el sistema GRADE y los resultados se presentaron en Resumen de los hallazgos 6 para la comparación que aporta las pruebas más generales a través de las enfermedades crónicas y las tablas de “Resumen de los hallazgos” 1 a 5 y 7 a 12 para las comparaciones adicionales. Se encontró que la certeza en las pruebas para la mayoría de los resultados fue baja, aunque la misma fue variable (con una variación de muy baja a alta). Fue predominantemente baja en ciertas subcategorías de las condiciones, incluido el cumplimiento de los fármacos o las pruebas de laboratorio, el consumo de alcohol, los recordatorios de las citas, la diabetes mellitus, la actividad física y el hábito de fumar y fue predominantemente de calidad moderada para el cribado y los síntomas del cáncer. En otros casos como la inmunización, la insuficiencia cardíaca, la hipertensión y el control del peso, la calidad de las pruebas varió considerablemente por resultado.
Las razones de la disminución de las pruebas más comúnmente fue relevante al riesgo de sesgo (es decir limitaciones metodológicas de los estudios incluidos): se disminuyeron una vez cuando hubo principalmente un riesgo poco claro de sesgo entre los siete dominios de la herramienta o cuando hubo un riesgo alto de sesgo de selección y de sesgo de deserción, y se disminuyeron dos veces cuando hubo un riesgo alto de sesgo para dominios múltiples de la asignación al azar; ocultación de la asignación; o sesgo de deserción, realización o detección. También se disminuyeron una vez cuando los resultados eran de un único estudio para una comparación/resultado particular (a menos que el estudio fuera grande, preciso y en general sin limitaciones principales evaluadas mediante el riesgo de sesgo). Otras razones de la disminución de las pruebas incluyeron inconsistencia (se disminuyeron una vez cuando hubo heterogeneidad alta / diferencias en la dirección del efecto); la dificultad para la generalización de las pruebas (se disminuyeron una vez para un resultado solamente ‐ niveles de actividad física cuando había diferencias en la población y las comparaciones usadas); y la imprecisión (se disminuyeron una vez si el tamaño de la muestra era pequeño o el cálculo del efecto presentaba intervalos de confianza amplios que proporcionaban diferentes mensajes acerca de los efectos de la intervención en el límite superior e inferior del intervalo de confianza). En general, se consideró que el procedimiento de asignación al azar fue adecuado en un 53% de los estudios y la ocultación de la asignación en un 23%. Se consideró que los datos de resultado estaban completos en un 56% de los estudios y que el informe selectivo conllevó un riesgo bajo en un 29,5%. No hubo ningún desequilibrio al inicio (lo cual indica un bajo riesgo de “otro” sesgo) en 50% de los estudios. Sin embargo, del mismo modo que con muchas intervenciones conductuales, casi un 83% de los estudios no realizó el cegamiento tanto de los participantes como del personal, o abandonaron o describieron el cegamiento de forma insuficiente, debilitando la confianza en que las medidas tomadas por el estudio eran adecuadas para prevenir el conocimiento de quienes recibieron la intervención. De igual manera, un 83% de los estudios estuvieron en riesgo incierto o alto para el cegamiento de los evaluadores de resultado, y aunque este hecho en muchos casos puede ser más posible de lograr, incluso con las intervenciones conductuales, sólo una minoría de los estudios realizó claramente este paso.
En términos generales, el potencial alto de sesgo en muchos de los estudios incluidos (y por lo tanto dentro de las subcategorías de la revisión) reduce la confiabilidad de los resultados (reflejado por las clasificaciones GRADE) y por ende las inferencias de los resultados. Aunque esta revisión proporciona la primera evaluación sistemática rigurosa de las pruebas de la efectividad a través de esta área amplia, los resultados son constreñidos por la calidad de las pruebas en muchas de las subcategorías identificadas. Las actualizaciones futuras de esta revisión podrían optar por centrarse en áreas en las cuales las pruebas son de mayor calidad, y podrían incluir estudios acumulados suficientes dentro de las subcategorías particulares del tema para permitir la exploración de la solidez de los efectos mediante los análisis de sensibilidad u otros enfoques analíticos.
Sesgos potenciales en el proceso de revisión
Se redujeron al mínimo los sesgos potenciales en el proceso de revisión al adherirse estrictamente a las guías esbozadas por Higgins 2011. Específicamente, se cree que se ha utilizado una estrategia de búsqueda integral; y en todos los casos, dos revisores evaluaron de forma independiente los criterios de elegibilidad, extrajeron los datos, evaluaron el riesgo de sesgo y usaron los criterios GRADE para evaluar críticamente la calidad de las pruebas. Sin embargo, es posible que se hayan omitido algunos estudios relevantes en los procesos de búsqueda. También se reconoce que no se han alcanzado algunos de los objetivos de la revisión, incluida la exploración de los componentes del diseño de intervención que pueden contribuir al cambio de conducta positivo de los consumidores. Este hecho se debió principalmente al número desigual y la distribución de los estudios en categorías respectivas (intervenciones unidireccionales, RVI, SCTA Plus, multimodales/complejas), en lugar de a las decisiones deliberadas de no realizar dichos análisis planificados. También se tomó la decisión de presentar en las tablas de “Resumen de los hallazgos” sólo las áreas del trastorno para las cuales se habían identificado cuatro o más estudios para la inclusión. Se tomó esta decisión netamente debido al tamaño y al alcance de la revisión, no basado en los hallazgos de los estudios. No se cree que este enfoque haya introducido sesgo en la revisión aunque se informó sobre los métodos para documentar transparentemente las decisiones como investigadores.
Acuerdos y desacuerdos con otros estudios o revisiones
Una revisión por Lieberman 2012 recomendó que los abordajes terapéuticos basados en RVI sean empleados por los consultorios multidisciplinarios y los profesionales que tratan a los pacientes con dolor crónico, debido a que estas tecnologías son clínicamente beneficiosas, versátiles y efectivas en función de los costos. Aunque dicha revisión no fue sistemática y por lo tanto fue más susceptible al sesgo, en general está de acuerdo con los resultados de la presente revisión. De igual manera, Corkrey 2002b estableció la conclusión de que la RVI se muestra prometedora en varias áreas de salud. Recalcaron la importancia de la investigación adicional en ciertas áreas no exploradas como la evaluación sistemática de la voz, las interconexiones multilingües, la prevalencia de teléfonos táctiles, las tasas de respuesta de la encuesta, el sesgo ilustrativo, el uso por parte de las personas de edad más avanzada y la aceptabilidad. Piette 2012c sugirió que la monitorización telefónica automatizada y las llamadas de apoyo al autocuidado pueden mejorar algunos resultados del tratamiento de las enfermedades crónicas, como el control glucémico y el control de la presión arterial, en los países de ingresos bajos y medios. Hay revisiones Cochrane similares que investigaron la efectividad de los mensajes a través de teléfonos móviles (SMS, MMS) para la prevención de la salud (Vodopivec‐Jamsek 2012; Gurol‐Urganci 2013), intervenciones administradas a través de teléfonos o móviles para prevenir la infección por VIH en los pacientes con pruebas negativas para el HIV (Van Velthoven 2013), y los sistemas de recordatorio para mejorar el cumplimiento por parte de los pacientes de las citas en los consultorios especializados en tuberculosis (Liu 2014). Todas las revisiones encontraron pruebas limitadas para apoyar la efectividad de dichas intervenciones.

Primary preventive healthcare

Influencing factors and preventive strategies in type 2 diabetes

Conceptual framework of ATCS in preventive healthcare
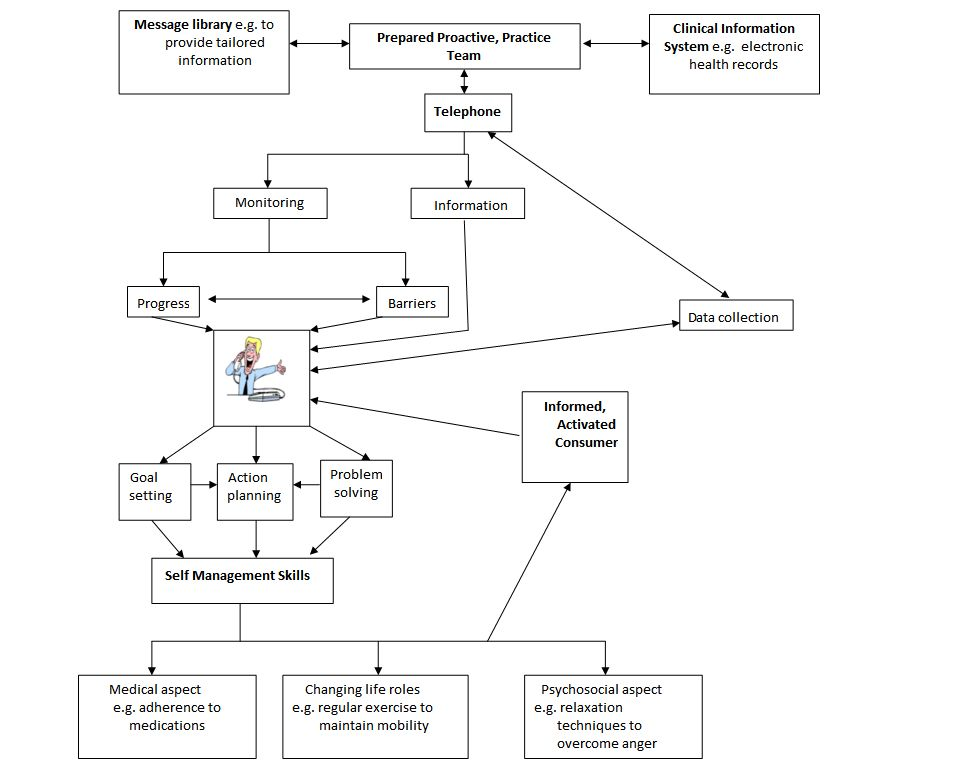
Conceptual framework of ATCS in the management of long‐term conditions

Management of long‐term conditions
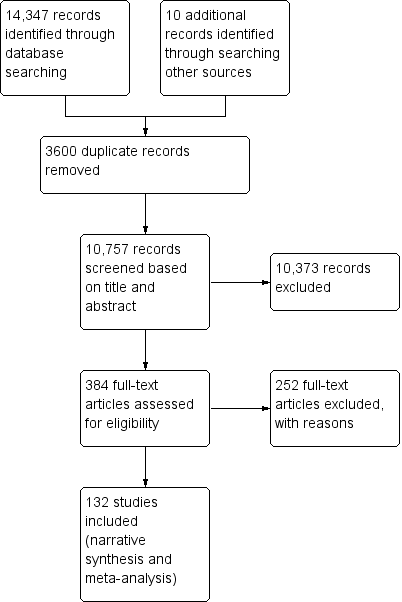
Study flow diagram

Subgroups for preventive health and/or management of long term conditions in this review

Risk of bias graph: review authors' judgements about each risk of bias item presented as percentages across all included studies.

Risk of bias summary: review authors' judgements about each risk of bias item for each included study.
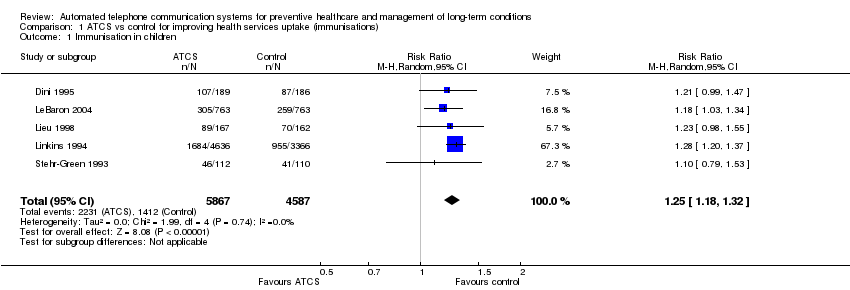
Comparison 1 ATCS vs control for improving health services uptake (immunisations), Outcome 1 Immunisation in children.

Comparison 1 ATCS vs control for improving health services uptake (immunisations), Outcome 2 Immunisation in adolescents.

Comparison 1 ATCS vs control for improving health services uptake (immunisations), Outcome 3 Immunisation in adults.

Comparison 2 ATCS vs control for improving health services uptake (screening rates), Outcome 1 Breast cancer screening.
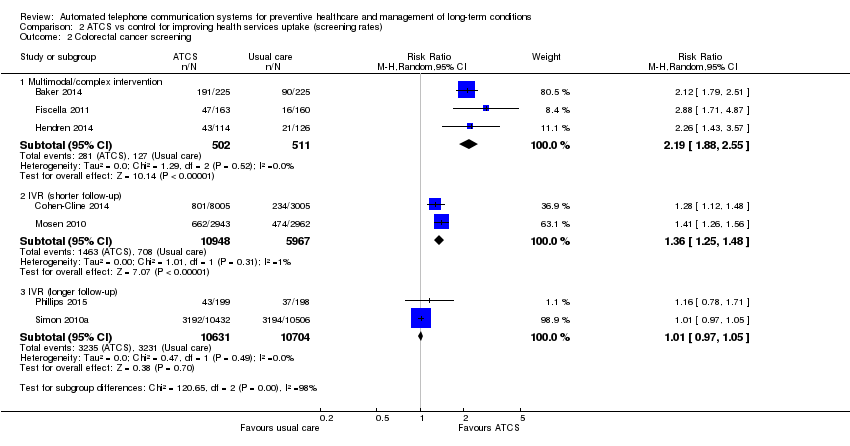
Comparison 2 ATCS vs control for improving health services uptake (screening rates), Outcome 2 Colorectal cancer screening.
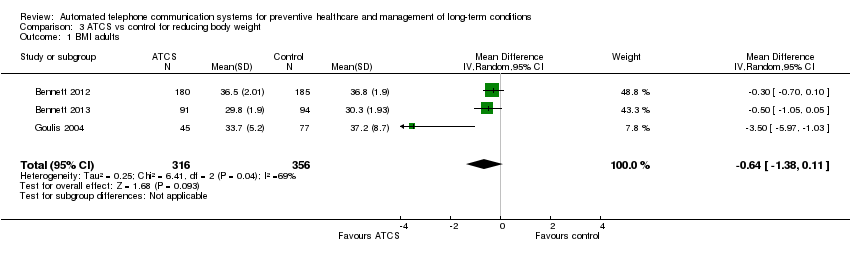
Comparison 3 ATCS vs control for reducing body weight, Outcome 1 BMI adults.
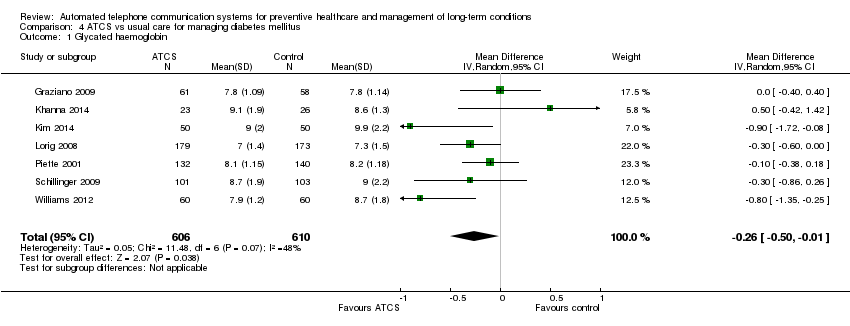
Comparison 4 ATCS vs usual care for managing diabetes mellitus, Outcome 1 Glycated haemoglobin.

Comparison 4 ATCS vs usual care for managing diabetes mellitus, Outcome 2 Self‐monitoring of diabetic foot.

Comparison 5 ATCS vs usual care for reducing healthcare utilisation in patients with heart failure, Outcome 1 Cardiac mortality.
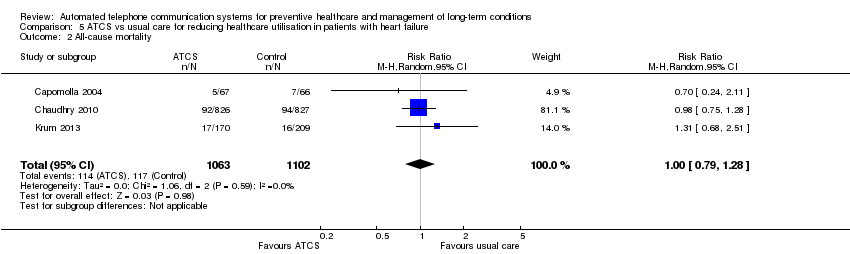
Comparison 5 ATCS vs usual care for reducing healthcare utilisation in patients with heart failure, Outcome 2 All‐cause mortality.

Comparison 6 ATCS vs usual primary care and education or usual care for managing hypertension, Outcome 1 Systolic blood pressure.

Comparison 6 ATCS vs usual primary care and education or usual care for managing hypertension, Outcome 2 Diastolic blood pressure.
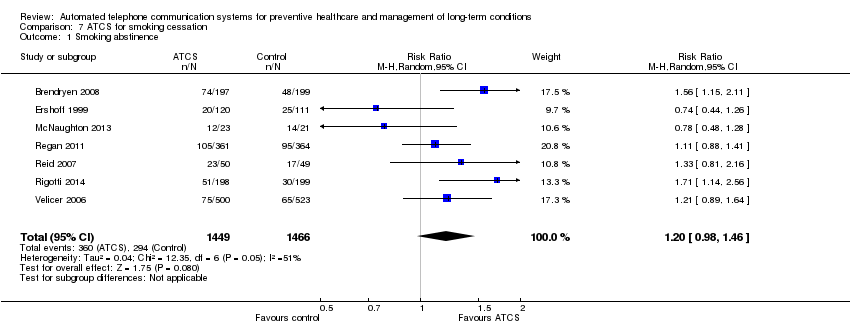
Comparison 7 ATCS for smoking cessation, Outcome 1 Smoking abstinence.
| ATCS versus control on immunisation rates | ||||||
| Patient or population: participants at risk of under‐immunisation (children, adolescents and adults) Comparison: no intervention, usual care or health information (letter) | ||||||
| Outcomes | Illustrative comparative risks* (95% CI) | Relative effect | No of participants | Quality of the evidence | Comments | |
| Assumed risk | Corresponding risk | |||||
| Control | ATCS | |||||
| Behavioural outcome: immunisation rate ATCS Plus, IVR, unidirectional versus no calls, letters, usual care at median follow‐up of 4 months | Study populationa: children Comparator: no intervention | RR 1.25 (1.18 to 1.32) | 10,454 | ⊕⊕⊕⊝ | Franzini 2000 (N = 1138) reported that compared with controls (no calls), unidirectional ATCS (autodialer) may increase immunisation rates in children (86% versus 64%, low certainty).d | |
| 308 per 1000 | 385 per 1000 | |||||
| Moderateb | ||||||
| 373 per 1000 | 466 per 1000 | |||||
| Behavioural outcome: immunisation rate Unidirectional ATCS versus usual care at median follow‐up of 15 months | Study populationa: adolescents Comparator: usual care | RR 1.06 | 5725 | ⊕⊕⊕⊝ | Szilagyi 2013 (N = 4115) also reported that unidirectional ATCS probably slightly improves the uptake of preventive care visits, compared with usual care (63% ATCS versus 59% usual care; moderate certainty evidencef). | |
| 543 per 1000 | 576 per 1000 | |||||
| Moderateb | ||||||
| 540 per 1000 | 572 per 1000 | |||||
| Behavioural outcome: immunisation rate Unidirectional ATCS versus no calls or health information at median follow‐up of 2.5 months | Study populationa: adults Comparator: no calls or health information | RR 2.18 (0.53 to 9.02) | 1743 | ⊕⊝⊝⊝ | — | |
| 10 per 1000 | 21 per 1000 | |||||
| Moderateb | ||||||
| 66 per 1000 | 144 per 1000 | |||||
| Adverse outcome: unintended adverse events attributable to the intervention ATCS+, IVR, unidirectional versus various controls | No studies reported adverse events. | |||||
| *The basis for the assumed risk (e.g. the median control group risk across studies) is provided in footnotes. The corresponding risk (and its 95% confidence interval) is based on the assumed risk in the comparison group and the relative effect of the intervention (and its 95% CI). ATCS Plus: automated telephone communication systems with additional functions; ATCS: automated telephone communication systems; CI: confidence interval; IVR: interactive voice response; RR: risk ratio; unidirectional ATCS enable non‐interactive voice communication and use one‐way transmission of information or reminders. | ||||||
| GRADE Working Group grades of evidence | ||||||
| aThe assumed risk represents the mean control group risk across studies (calculated by GRADEPro). | ||||||
| ATCS versus control on physical activity levels | |||
| Patient or population: participants at risk of developing long‐term conditions Settings: various settings Intervention: ATCS (multimodal/complex intervention, ATCS+, IVR) Comparison: no intervention, usual care, or IVR | |||
| Outcomes | Effect of intervention a | No of participants | Quality of the evidence |
| Behavioural outcome: physical activity Multimodal/complex interventionb versus no calls | The intervention may slightly improve the frequency of walks. | 181 (1 study) | ⊕⊕⊝⊝ Lowc |
| Behavioural outcome: physical activity, 12 months Multimodal/complex interventiond versus usual care | The intervention probably has mixed effects on gait speeds, little effect on functional outcomes (moderate certaintye) and may slightly increase physical activity levels (low certaintyf). | 700 (2 studies) | — |
| Behavioural outcome: physical activity ATCS Plus versus IVR control | 2 studies reported that ATCS Plus intervention may have little or no effect on different indices of physical activity. | 369 (2 studies) | ⊕⊕⊝⊝ Lowc |
| Behavioural outcome: physical activity IVR versus usual care, control or health education | 3 studies reported that IVR interventions may slightly improve several indices of physical activity (muscle strength, balance, moderate to vigorous physical activity) but may have little or no effect on others (physical activity levels, walking distance). | 216 (3 studies) | ⊕⊕⊝⊝ Lowg |
| Clinical outcome: metabolic markers, 12 months Multimodal/complex interventiond versus usual care | The intervention may have little or no effect on glycated haemoglobin, fasting insulin and glucose levels. | 302 (1 study) | ⊕⊕⊝⊝ Lowf |
| Clinical outcome: body weight measures Multimodal/complex interventiond ATCS Plus versus usual care or control | ATCS Plus intervention may have little or no effect on BMI, weight, waist or waist‐hip ratio, compared with control (71 participants; low certainty evidencec). Multimodal/complex intervention may have little or no effect on BMI, waist circumference or physical function, compared with usual care (302 participants; low certainty evidencef). | 373 (2 studies) | ⊕⊕⊝⊝ Low |
| Adverse outcome: unintended adverse events attributable to the intervention Multimodal/complex intervention, ATCS Plus, IVR versus various controls | No studies reported adverse events. | — | — |
| GRADE Working Group grades of evidence | |||
| ATCS: automated telephone communication systems; ATCS Plus: automated telephone communication systems with additional functions; IVR: interactive voice response. | |||
| aThe findings presented are based on a narrative summary and synthesis of results that were not amenable to statistical analysis; please see Effects of interventions for detailed findings. | |||
| ATCS versus control on screening rates | ||||||
| Patient or population: participants at risk for breast, colorectal or cervical cancer; or osteoporosis Settings: primary, secondary and tertiary care Intervention: ATCS (multimodal/complex intervention, ATCS Plus, IVR, unidirectional) Comparison: usual care, enhanced usual care or no intervention | ||||||
| Outcomes | Illustrative comparative risks* (95% CI) | Relative effect | No of participants | Quality of the evidence | Comments | |
| Assumed risk | Corresponding risk | |||||
| Usual care or enhanced usual care or no intervention | ATCS | |||||
| Behavioural outcome: breast cancer screening Multimodal/complex intervention versus usual care at 12 months follow‐up | Study populationa | RR 2.17 | 462 | ⊕⊕⊕⊕ | — | |
| 167 per 1000 | 363 per 1000 | |||||
| Moderateb | ||||||
| 167 per 1000 | 363 per 1000 | |||||
| Behavioural outcome: breast cancer screening IVR versus enhanced usual care at median follow‐up of 12 months | Study populationa | RR 1.05 | 2599 | ⊕⊕⊕⊝ | Unidirectional ATCS versus letter 1 further study (Fortuna 2014) (N = 1008) found that unidirectional ATCS (plus letter) probably has little or no effect on breast cancer screening rates at 12 months, adjusted OR 1.3 (95% CI 0.7 to 2.4; moderate certaintyd). | |
| 585 per 1000 | 614 per 1000 | |||||
| Moderateb | ||||||
| 432 per 1000 | 454 per 1000 | |||||
| Behavioural outcome: colorectal cancer screening Multimodal/complex intervention versus usual care at median follow‐up of 12 months | Study populationa | RR 2.19 | 1013 | ⊕⊕⊕⊕ | — | |
| 249 per 1000 | 545 per 1000 | |||||
| Moderateb | ||||||
| 167 per 1000 | 366 per 1000 | |||||
| Behavioural outcome: colorectal cancer screening IVR versus usual care at 6‐month follow‐up | Study populationa | RR 1.36 | 16915 | ⊕⊕⊕⊝ | IVR versus control 1 other study (Durant 2014) (N = 47,097) reported that IVR probably increases screening, with 1773 participants from the IVR group and 100 from the no‐call control group completing colorectal cancer screening within 3 months (moderate certaintyf). IVR versus usual care 1 study (Mosen 2010) (N = 6000) also reported that IVR probably increases completion of any colorectal cancer screening (moderate certaintyg). | |
| 119 per 1000 | 161 per 1000 | |||||
| Moderateb | ||||||
| 119 per 1000 | 162 per 1000 | |||||
| Behavioural outcome: colorectal cancer screening IVR, unidirectional ATCS versus usual care or letter at longer (9‐12 months) follow‐up | Study populationa | RR 1.01 | 21,335 | ⊕⊕⊕⊝ | IVR versus usual care 1 study (Simon 2010a) (N = 20,000) also reported that IVR probably increases slightly colorectal cancer screening via colonoscopy (moderate certaintyi). Unidirectional ATCS versus letter 1 further study (Fortuna 2014) (N = 1008) at 12 months found that unidirectional ATCS (plus letter) has probably little or no effect on colorectal cancer screening rates at 12 months (15.3% versus 12.2%; adjusted OR 1.2; 95% CI 0.6 to 2.4; moderate certaintyd). | |
| 302 per 1000 | 305 per 1000 | |||||
| Moderateb | ||||||
| 245 per 1000 | 247 per 1000 | |||||
| Behavioural outcome: cervical cancer screening ATCS Plus versus control (no calls) at 3 month follow‐up | See comment | See comment | Not estimable | 75,532 (1 study) | ⊕⊕⊕⊝ | Corkrey 2005 found that ATCS Plus intervention probably slightly improves cervical cancer screening rates at 3 months. |
| Adverse outcome: unintended adverse events attributable to the intervention Multimodal/complex intervention, ATCS Plus, IVR, unidirectional versus various controls | No studies reported adverse events. | |||||
| *The basis for the assumed risk (e.g. the median control group risk across studies) is provided in footnotes. The corresponding risk (and its 95% confidence interval) is based on the assumed risk in the comparison group and the relative effect of the intervention (and its 95% CI). | ||||||
| GRADE Working Group grades of evidence | ||||||
| aThe assumed risk represents the mean control group risk across studies (calculated by GRADEPro). | ||||||
| ATCS versus control for body weight | ||||||
| Patient or population: overweight or obese individuals (both children and adults) Comparison: usual care, no intervention or control | ||||||
| Outcomes | Illustrative comparative risks* (95% CI) | Relative effect | No of participants | Quality of the evidence | Commentsa | |
| Assumed risk | Corresponding risk | |||||
| Controls | ATCS | |||||
| Clinical and behavioural outcome: BMI score in adults Multimodal/complex intervention, ATCS Plus or IVR versus usual care at median follow‐up of 18 months | The mean BMI in the control groups was 34.7 kg/m2 | The mean BMI of adults in the intervention groups was 0.64 kg/m2lower | Not estimable | 672 | ⊕⊕⊝⊝ | ATCS Plus versus control Vance 2011 (N = 140) found that ATCS Plus may reduce slightly BMI (low certainty evidencec). |
| Clinical and behavioural outcome: body weight in adults, 12 weeks | See comment | See comment | Not estimable | See comment | See comment | ATCS Plus versus control Vance 2011 (N = 140) found that ATCS Plus may reduce slightly body weight and waist circumference (low certainty evidencec). IVR versus control Estabrooks 2008 (N = 77) reported that IVR may have little or no effect on body weight (percent lost or change in) (low certainty evidenced). |
| Clinical and behavioural outcome: body weight in adults, at median follow‐up of 18 months | See comment | See comment | Not estimable | See comment | See comment | ATCS (multimodal/complex intervention, ATCS Plus, IVR) versus usual care Bennett 2012 (N = 365) found that ATCS Plus probably slightly reduces body weight at 18 months (moderate certainty evidence).eBennett 2013 (N = 194) found that multimodal/complex intervention may reduce body weight at 18 months (low certainty evidence).f IVR versus usual care Goulis 2004 (N = 122) found that IVR probably reduces slightly body weight but probably has little or no effect on obesity assessment scores at 6 months (moderate certainty evidence).f |
| Clinical and behavioural outcome: blood pressure, blood glucose, cholesterol levels | See comment | See comment | Not estimable | See comment | See comment | ATCS (ATCS Plus, IVR) versus usual care/control Bennett 2012 (N = 365) found that ATCS Plus probably has little or no effect on systolic or diastolic blood pressure at 18 months (moderate certainty evidencee). ATCS Plus versus control Vance 2011 found that ATCS Plus may slightly improve slightly systolic blood pressure and blood glucose levels at 12 weeks (low certainty evidencec). IVR versus usual care Goulis 2004 (N = 122) found that IVR probably has little or no effect on systolic or diastolic blood pressure, plasma glucose levels, or high‐density lipoprotein cholesterol, but it probably slightly reduces total cholesterol and triglyceride levels at 6 months (moderate certainty evidence).e |
| Clinical outcome: BMI z‐score in children at median follow‐up of 7.5 months | See comment | See comment | Not estimable | See comment | ⊕⊕⊕⊝ | ATCS Plus versus control Estabrooks 2009 (N = 220) found that ATCS Plus has probably little or no effect on BMI z‐scores in children at 12 months. IVR versus control Wright 2013 (N = 100) found that IVR has probably little or no effect on BMI z‐scores in children at 3 months. |
| Behavioural outcome: physical activity, dietary habits in children at median follow‐up of 7.5 months | See comment | See comment | Not estimable | See comment | ⊕⊕⊕⊝ | ATCS Plus versus control Estabrooks 2009 (N = 220) found that ATCS Plus has probably little or no effect on self‐reported physical activity, sedentary behaviours or dietary habits at 12 months. IVR versus control (no calls) Wright 2013 (N = 100) found that IVR has probably little or no effect on total caloric intake, fruit intake, or sedentary behaviours at 3 months. |
| Adverse outcome: unintended adverse events attributable to the intervention IVR versus usual care | See comment | See comment | See comment | 559 (2 studies) | See comment | Bennett 2012 (N = 365) reported 1 serious musculoskeletal injury in the intervention group and 3 events (1 cardiovascular and 2 cases of gallbladder disease) in the usual care group (moderate certainty evidence).e,g Bennett 2013 (N = 194) reported 6 serious adverse events in the intervention arm, including gynaecological surgery in 2 participants and knee replacement, breast abscess, musculoskeletal injury, and cancer diagnosis in 1 participant each; all participants except the one with the cancer diagnosis required hospitalisation (low certainty evidence).f,g |
| *The corresponding risk (and its 95% confidence interval) is based on the assumed risk in the comparison group and the relative effect of the intervention (and its 95% CI). ATCS: automated telephone communication systems; ATCS Plus: automated telephone communication systems with additional functions; BMI: body Mass Index; CI: confidence interval; IVR: interactive voice response; SMD: Standardised mean difference. | ||||||
| GRADE Working Group grades of evidence | ||||||
| aAdditional findings presented are based on a narrative summary and synthesis of results that were not amenable to statistical analysis; please see Effects of interventions for detailed findings. | ||||||
| ATCS versus control as appointment reminders (reducing non‐attendance rates) | |||
| Patient or population: patients/healthcare consumers Comparison: no intervention (calls) or nurse‐delivered calls | |||
| Outcomes | Effect of interventiona | No of participants (studies) | Quality of the evidence |
| Health behaviour: attendance rates, 6 weeks ATCS Plus versus nurse‐delivered calls | ATCS Plus calls delivered 3 or 7 days prior to flexible sigmoidoscopy or/and colonoscopy examinations probably have little or no effect on appointment non‐attendance or preparation non‐adherence. | 3610 (1 study) | ⊕⊕⊕⊝ |
| Health behaviour: attendance rates, 4 months IVR versus no calls | IVR improves attendance rates: OR 1.52 (95% CI 1.34 to 1.71). | 12,092 (1 study) | ⊕⊕⊕⊕ High |
| Health behaviour: return tuberculin test rate, 3 days Unidirectional ATCS versus no calls | Unidirectional ATCS may improve test return rates. | 701 (1 study) | ⊕⊕⊝⊝ |
| Health behaviour: attendance rates, 1 month Unidirectional ATCS versus no calls | Undirectional ATCS may improve attendance rates RR 1.60 (95% CI 1.29 to 1.98). | 517 (1 study) | ⊕⊕⊝⊝ |
| Health behaviour: attendance rates, 6‐8 weeks Unidirectional ATCS versus no calls | 2 studies reported conflicting results: Reekie 1998 (N = 1000) reported that unidirectional ATCS probably decrease non‐attendance rates at 6 weeks; while Maxwell 2001 (N = 2304) reported the interventions probably have little or no effect at 2 months. | 3304 (2 studies) | ⊕⊕⊕⊝ |
| Health behaviour: attendance rates, 6 months Unidirectional ATCS versus no calls | Unidirectional ATCS may improve attendance: OR 1.50 (P < 0.01). | 2008 (1 study) | ⊕⊕⊝⊝ |
| Adverse outcome: unintended adverse events attributable to the intervention ATCS Plus, IVR, unidirectional ATCS versus various controls | No studies reported adverse events. | ||
| ATCS: automated telephone communication systems; ATCS Plus: automated telephone communication systems with additional functions; CI: confidence interval; IVR: interactive voice response; OR: odds ratio; RR: risk ratio. | |||
| GRADE Working Group grades of evidence | |||
| aThe findings presented are based on a narrative summary and synthesis of results, many of which were not amenable to statistical analysis; please see Effects of interventions for detailed findings. | |||
| ATCS versus control for adherence to medication or laboratory tests | ||||
| Patient or population: patients with various conditions or at risk of low adherence to medication or laboratory tests Settings: various settings Intervention: ATCS (multimodal/complex intervention, ATCS Plus, IVR, unidirectional ATCS) Comparison: usual care, no calls, controls (other ATCS) | ||||
| Outcomes | Effect of interventionsa | No of participants | Quality of the evidence | Comments |
| Behavioural outcome: adherence to medication Multimodal/complex interventionsb versus usual care or control | The effects of multimodal/complex interventions are inconclusive. | 888 (2 studies) | See comment | Ho 2014 (N = 241) reported that the multimodal/complex intervention probably improves adherence to cardioprotective medications at 12 months (moderate certaintyc). Stuart 2003 (N = 647) found uncertain effects of the intervention on adherence to antidepressant medications (very low certaintyc,d). |
| Behavioural outcome: adherence to medication ATCS Plus versus control or single IVR call | Results suggest that ATCS Plus probably slightly improve measures of adherence. | 2340 (2 studies) | See comment | Cvietusa 2012 (N = 1393) reported that ATCS Plus, compared with control, probably improves time to first inhaled corticosteroid refill and probably slightly improves the proportion of days with medication on hand in children (moderate certaintye). Stacy 2009 (N = 947) reported that ATCS Plus probably slightly improves statin adherence at 6 months, compared with a single IVR call (moderate certaintyf). |
| Behavioural outcome: adherence to laboratory tests ATCS Plus or IVR versus no intervention or usual care | Results suggest that ATCS Plus probably has little or no effect on adherence to testing, while IVR probably improves test completion. | 15,218 (3 studies) | See comment | ATCS Plus versus no intervention Derose 2009 (N = 13,057) found that ATCS Plus probably has little or no effect on adherence to testing (completion of all 3 recommended laboratory tests for diabetes patients) at 12 weeks (moderate certaintyg). Simon 2010b (N = 1200) found that these interventions probably have little or no effect on retinopathy examination rates or tests for glycaemia, hyperlipidaemia or nephropathy in diabetic patients at 12 months (moderate certaintyh). IVR versus usual care Feldstein 2006 (N = 961) found that IVR probably improves patients' completion of all recommended laboratory tests at 25 days follow‐up (moderate certaintyi). |
| Behavioural outcome: adherence to medication or composite outcome (medication adherence and rate of adverse events) ATCS Plus versus usual care | Results indicate that ATCS Plus probably improves medication adherence and may slightly improve a composite measure. | 35,816 (4 studies) | See comment | 2 studies (Derose 2013 (N = 5216) and Vollmer 2014 (N = 21,752)) reported that ATCS Plus probably improves adherence to statins to some extent. Vollmer 2011 (N = 8517) found that ATCS Plus probably slightly improves adherence to inhaled corticosteroids (moderate certaintyj). Sherrard 2009 (N = 331) found that ATCS Plus may slightly improve a composite measure of medication adherence and adverse events at 6 months follow‐up (low certaintyc,k). |
| Behavioural outcome: adherence to medication or laboratory tests IVR versus control | Results suggest that IVR probably improves slightly medication adherence. | 4,238,362 (4 studies) | See comment | Adams 2014 (N = 475) found that IVR may slightly improve comprehensiveness of screening and counselling (low certaintyc,l). Bender 2010 (N = 50) reported that IVR may improve adherence to anti‐asthmatic medications at 2.5 months follow‐up (low certaintyc,e). Leirer 1991 (N = 16) reported that IVR may slightly reduce medication non‐adherence (low certaintym). Mu 2013 (N = 4,237,821) found that IVR probably slightly improves medication refill rates at 1 month (moderate certaintyn). |
| Behavioural outcome: adherence to medication IVR versus usual care | Results indicate that IVR probably slightly improves some measures of medication adherence. | 56,140 (8 studies) | See comment | 2 studies (Boland 2014 (N = 70); Friedman 1996 (N = 267)) reported that IVR probably slightly improves adherence to glaucoma and anti‐hypertensive medications at 3 and 6 months respectively (moderate certainty).o 2 further studies (Glanz 2012 (N = 312); Migneault 2012 (N = 337)) reported that IVR has probably little or no effect on medication adherence at 8 and 12 months, respectively (moderate certainty).p 2 studies (Green 2011 (N = 8306); Reynolds 2011 (N = 30,610)) assessed adherence via refill rates, reporting that IVR probably slightly improves medication refill rates at 2 weeks (moderate certainty).q 2 further studies reported medication adherence assessed by medication possession ratio (MPR) at different time points. Patel 2007 (N = 15,051) found that IVR probably slightly improves MPR at 3 to 6 months, while Bender 2014 (N = 1187) reported that IVR probably improves MPR at 24 months (both studies of moderate certaintyr). |
| Behavioural outcome: adherence to medication Unidirectional ATCS versus control | Results suggest that unidirectional ATCS may have little effect, or improve medication adherence to a small degree. | 107 (2 studies) | See comment | 2 studies (Lim 2013 (N = 80); Ownby 2012 (N = 27)) reported that the intervention may have little effect or slightly improve medication adherence (low certaintys). |
| Clinical outcome: blood pressure Multimodal/complex, ATCS Plus, IVR versus usual care | Results suggest that ATCS Plus probably slightly reduces blood pressure, while multimodal/complex or IVR interventions probably have little or no effect on blood pressure. | 22,597 (3 studies) | See comment | Multimodal/complex intervention versus usual care Ho 2014 (N = 241) reported that multimodal intervention probably has little or no effect on achieving reduced blood pressure targets (moderate certaintyc). ATCS Plus versus usual care Vollmer 2014 (N = 21,752) reported that ATCS Plus probably slightly reduces systolic blood pressure (moderate certaintyt). IVR versus usual care Migneault 2012 (N = 337) reported that IVR probably has little or no effect on systolic or diastolic blood pressure (moderate certaintyc), while Friedman 1996 (N = 267) found that IVR may have little or no effect on systolic blood pressure but may slightly decrease diastolic blood pressure (low certaintyc,f). |
| Adverse outcome: unintended adverse events attributable to the intervention Multimodal/complex intervention, ATCS Plus, IVR, unidirectional versus various controls | No studies reported adverse events. | |||
| ATCS Plus: automated telephone communication systems with additional functions; CI: confidence interval; HR: hazard ratio; IVR: interactive voice response; MPR: medication possession ratio; OR: odds ratio; RR: risk ratio; SD: standard deviation | ||||
| GRADE Working Group grades of evidence | ||||
| aMultimodal intervention included ATCS Plus, medication reconciliation and tailoring, patient education and collaborative care in Ho 2014; and education, nurse‐delivered call and IVR in Stuart 2003. | ||||
| ATCS versus control on alcohol consumption | |||
| Patient or population: participants addicted to alcohol Settings: various settings Intervention: ATCS (ATCS Plus, IVR) Comparison: no intervention, usual care, advice/education or packaged CBT | |||
| Outcomes | Effect of interventiona | No of participants | Quality of the evidence |
| Behavioural outcomes: number of drinks per drinking day ATCS Plus, IVR versus usual care, (various) controls at median follow‐up of 2 months | ATCS Plus versus usual care Rose 2015 (N = 158) reported that ATCS Plus may have little or no effect on the number of drinks per drinking day at 2 months (low certaintyb,c). ATCS Plus versus control (advice/education) Hasin 2013 (N = 254) found that ATCS Plus may reduce the number of drinks per drinking day in the last 30 days at 2 months (low certaintyb,c), but it may have little effect at 12 months. IVR versus control (information) Rubin 2012 (N = 47) reported that IVR may slightly reduce the number of drinks per drinking day at 6 months (low certaintyc,e). | 459 (3 studies) | ⊕⊕⊝⊝ |
| Behavioural outcomes: drinking days, heavy drinking days, or total number of drinks consumed ATCS Plus, IVR versus (various) controls | ATCS Plus versus no intervention Mundt 2006 (N = 60) found that ATCS Plus may have little or no effect on drinking days, heavy drinking days, or total number of drinks consumed (low certaintyc,f). ATCS Plus versus control (packaged CBT) Litt 2009 (N = 110) found that ATCS Plus may have little or no effect on the number of heavy drinking days at 12 weeks posttreatment (low certaintyc,g). IVR versus control (information) Rubin 2012 (N = 47) reported that IVR may slightly reduce the number of heavy drinking days per month at 6 months (low certaintyc,e). | 217 (3 studies) | ⊕⊕⊝⊝ |
| Behavioural outcomes: proportion of days abstinent, other alcohol consumption indices, 12 weeks ATCS Plus versus control (packaged CBT) | ATCS Plus may slightly reduce the proportion of days abstinent but have little or no effect on coping or drinking problems or continuity of abstinence (Litt 2009). | 110 (1 study) | ⊕⊕⊝⊝ |
| Behavioural outcomes: weekly alcohol consumption, 6 months ATCS Plus versus usual care | ATCS Plus may have little or no effect on weekly alcohol consumption (Helzer 2008). | 338 (1 study) | ⊕⊕⊝⊝ |
| Behavioural outcomes: AUDIT score, 6 weeks IVR versus control (no intervention) | IVR probably improve slightly AUDIT scores (Andersson 2012). | 1423 (1 study) | ⊕⊕⊕⊝ |
| Behavioural outcomes: other alcohol consumption indices, 4 weeks IVR versus control (no intervention) | IVR may have little or no effect on drinking habits, alcohol craving, or PTSD symptoms (Simpson 2005). | 98 (1 study) | ⊕⊕⊝⊝ |
| Adverse outcome: unintended adverse events attributable to the intervention ATCS Plus, IVR versus various controls | No studies reported adverse events. | ||
| ATCS Plus: automated telephone communication systems with additional functions; AUDIT: Alcohol Use Disorders Identification Test; CBT: cognitive behavioural therapy; IVR: interactive voice response; PTSD: post‐traumatic stress disorder. | |||
| GRADE Working Group grades of evidence | |||
| aThe findings presented in this table are based on a narrative summary and synthesis of results that were not amenable to statistical analysis; please see Effects of interventions for detailed findings. | |||
| ATCS versus control on severity of cancer symptoms | ||||
| Patient or population: cancer patients Settings: various settings Intervention: ATCS (multimodal/complex intervention, ATCS Plus, IVR) Comparison: usual care, control (other ATCS, nurse‐delivered calls) | ||||
| Outcomes | Effects of interventiona | No of participants | Quality of the evidence | Comments |
| Clinical outcomes: symptoms (severity or burden) ATCS Plus versus usual care (via ATCS) or control, 4‐12 weeks | Results suggest that ATCS Plus may have little or no effect on symptom severity, distress or burden. | 701 (4 studies) | See comment | Cleeland 2011 (N = 79) found that ATCS Plus may slightly reduce symptom threshold events and cumulative distribution of symptom threshold events; and it may have little or no effect on mean symptom severity between discharge and 4 week follow‐up (low certaintyb,c). Mooney 2014 (N = 250) found that ATCS Plus probably has little or no effect on symptom severity scores at 6 week follow‐up (moderate certaintyc). Spoelstra 2013 (N = 119) found that ATCS Plus may have little or no effect on symptom severity at 10 week follow‐up (low certaintyc,d). Yount 2014 (N = 253) reported that ATCS Plus may have little or no effect on symptom burden at 12 weeks (low certaintyc,e). |
| Clinical outcomes: symptom severity, 10 weeks IVR versus nurse delivered calls | Results suggest that IVR may have little or no effect on symptom severity. | 437 (1 study) | ⊕⊕⊝⊝ | — |
| Clinical outcomes: pain Multimodal/complex interventiong versus usual care | Results indicate that multimodal intervention probably reduces pain at 3 months and probably slightly reduces pain at 12 months. | 405 (1 study) | ⊕⊕⊕⊝ | — |
| Clinical outcomes: depression Multimodal/complex interventiong versus usual care | Results indicate that multimodal intervention probably slightly reduces depression at 3 and 12 months. | 405 (1 study) | ⊕⊕⊕⊝ | — |
| Clinical outcomes:distress, 6 weeks ATCS Plus versus usual care (via IVR) | Results indicate that ATCS Plus probably has little or no effect on distress. | 250 (1 study) | ⊕⊕⊕⊝ | — |
| Behavioural outcome: medication adherence ATCS Plus versus usual care | Results indicate that ATCS Plus may have little or no effect on medication non‐adherence. | 119 (1 study) | ⊕⊕⊝⊝ | — |
| Adverse outcome: unintended adverse events attributable to the intervention Multimodal/complex intervention, ATCS Plus, IVR versus various controls | No studies reported adverse events. | |||
| ATCS: automated telephone communication systems; ATCS Plus: automated telephone communication systems with additional functions; IVR: interactive voice response. | ||||
| GRADE Working Group grades of evidence | ||||
| aThe findings presented in this table are based on a narrative summary and synthesis of results that were not amenable to statistical analysis; please see Effects of interventions for detailed findings. | ||||
| ATCS versus usual care for managing diabetes mellitus | ||||||
| Patient or population: patients with diabetes mellitus Comparison: usual care | ||||||
| Outcomes | Illustrative comparative risks* (95% CI) | Relative effect | No of Participants | Quality of the evidence | Commentsa | |
| Assumed risk | Corresponding risk | |||||
| Usual care | ATCS | |||||
| Clinical outcome: glycated haemoglobin or blood glucose ATCS Plus, IVR versus usual care at median follow‐up of 6 months | The mean glycated haemoglobin in the control groups was 8.41% | The mean glycated haemoglobin in the intervention groups was | Not estimable | 1216 | ⊕⊕⊝⊝ | ATCS Plus versus usual care 1 further study, Katalenich 2015 (N = 98), found that ATCS Plus may have little or no effect on median glycated haemoglobin levels compared with usual care at 6 months follow‐up (low certaintyc). IVR versus usual care 1 additional study, Homko 2012 (N = 80), found that IVR may have little or no effect on fasting blood glucose levels in pregnancy or infant birth weight at 26 months (low certaintyc). |
| Behavioural outcome: self‐monitoring of diabetic foot (various scales) ATCS Plus versus usual care at 12 months follow‐up | The mean self‐monitoring of diabetic foot in the control groups was 4.5 (range from 0 to 7, with higher scores indicating better foot care) | The mean self‐monitoring of diabetic foot in the intervention groups was | Not estimable | 498 | ⊕⊕⊕⊝ | — |
| Behavioural outcome: self‐monitoring of blood glucose ATCS Plus, IVR versus usual care, 6‐12 months | See comment | See comment | Not estimable | See comment | See comment | ATCS Plus versus usual care Lorig 2008 (N = 417) found that ATCS Plus may have little no effect on self‐monitoring of blood glucose at 6 months (low certainty evidencef). At 12 months, 2 studies (Piette 2001 (N = 272); Schillinger 2009 (N = 339)) reported that ATCS Plus probably slightly improves self‐monitoring of blood glucose (moderate certaintye). IVR versus usual care Graziano 2009 (N = 112) found that IVR probably slightly increases the mean change in frequency of self‐monitoring of blood glucose (moderate certainty evidenceg). |
| Behavioural outcome: medication adherence or use ATCS Plus versus usual care, 6‐12 months | See comment | See comment | Not estimable | 370 (2 studies) | See comment | Katalenich 2015 (N = 98) reported that ATCS Plus may have little or no effect on adherence rates at 6 months (low certaintyc), and Piette 2001 (N = 272) found that ATCS Plus has probably little or no effect on medication use at 12 months (moderate certaintyg. |
| Behavioural outcome: physical activity, diet, weight monitoring ATCS Plus versus usual care, 6‐12 months | See comment | See comment | Not estimable | 1028 (3 studies) | See comment | Lorig 2008 (N = 417) found that ATCS Plus may have little or no effect on aerobic exercise at 6 months (low certaintyf). Schillinger 2009 (N = 339) found that ATCS Plus may slightly improve diet and exercise and moderate intensity physical activity levels, but it may have little or no effect on vigorous intensity physical activity levels at 12 months (low certaintyc). Piette 2001 (N = 272) reported that ATCS Plus probably has little or no effect on weight monitoring (moderate certaintyg). |
| Adverse outcome: unintended adverse events attributable to the intervention ATCS Plus, IVR versus usual care | No studies were found that reported adverse events. | |||||
| The corresponding risk (and its 95% confidence interval) is based on the assumed risk in the comparison group and the relative effect of the intervention (and its 95% CI). ATCS Plus: automated telephone communication systems with additional functions; CI: confidence interval; HRQoL: health‐related quality of life; IVR: interactive voice response; SMD: standardised mean difference. | ||||||
| GRADE Working Group grades of evidence | ||||||
| aAdditional results are based on a narrative summary and synthesis of results that were not amenable to statistical analysis; please see Effects of interventions for detailed findings. | ||||||
| ATCS versus usual care for patients with heart failure | ||||||
| Patient or population: patients with heart failure Comparison: usual care or usual community care | ||||||
| Outcomes | Illustrative comparative risks* (95% CI) | Relative effect | No of participants | Quality of the evidence | Commentsa | |
| Assumed risk | Corresponding risk | |||||
| Usual care or usual community care | ATCS | |||||
| Clinical outcome: cardiac mortality ATCS Plus, IVR versus usual care or usual community care at median follow‐up of 11.5 months | Study populationb | RR 0.60 | 215 | ⊕⊝⊝⊝ | — | |
| 95 per 1000 | 57 per 1000 | |||||
| Moderatec | ||||||
| 96 per 1000 | 58 per 1000 | |||||
| Clinical outcome: all‐cause mortality ATCS Plus versus usual care or usual community care at median follow‐up of 11 months | Study populationb | RR 1 (0.79 to 1.28) | 2165 | ⊕⊕⊕⊝ | — | |
| 106 per 1000 | 106 per 1000 | |||||
| Moderatec | ||||||
| 106 per 1000 | 106 per 1000 | |||||
| Clinical outcome: heart failure hospitalisation ATCS Plus, IVR versus usual care or usual community care at median follow‐up of 11.5 months | See comment | See comment | Not estimable | 2329 (4 studies) | See comment | ATCS Plus versus usual care or usual community care Chaudhry 2010 (N = 1653) found that the intervention had little or no effect on hospitalisation for heart failure (high certainty). Krum 2013 (N = 405) also reported that there was probably little or no effect of the intervention for this same outcome (moderate certaintyg), while Capomolla 2004 (N = 133) reported that ATCS Plus may decrease hospitalisation rates for heart failure (low certaintyh). IVR versus usual care Kurtz 2011 (N = 138) reported that IVR intervention has uncertain effects on hospitalisation for heart failure (very low certaintyi). |
| Clinical outcome: all‐cause hospitalisation ATCS Plus versus usual care or usual community care | See comment | See comment | Not estimable | 2191 participants (3 studies) | See comment | ATCS Plus versus usual care Capomolla 2004 (N = 133) found that ATCS Plus may reduce all‐cause hospitalisation (for chronic heart failure, cardiac cause and other cause; low certaintyh), and Krum 2013 (N = 405) similarly reported that the intervention probably slightly decreased all‐cause hospitalisation (moderate certaintyg).fChaudhry 2010 (N = 1653) found that ATCS Plus has little or no effect on readmission for any reason (high certainty). |
| Clinical outcome: global health (well‐being) rating (7‐item questionnaire) ATCS Plus versus usual care 12 months | See comment | See comment | Not estimable | 405 participants (1 study) | ⊕⊕⊕⊝ | Krum 2013 (N = 405) reported that ATCS Plus probably increases slightly the proportion of patients with improved global health questionnaire ratings at 12 months. |
| Clinical outcome: emergency room and other health service use outcomes ATCS Plus versus usual care or usual community care | See comment | See comment | Not estimable | 1786 participants (2 studies) | See comment | Emergency room use Capomolla 2004 (N = 133) found that ATCS Plus may reduce emergency room use at (median) 11 months (low certaintyh). Other service use Chaudhry 2010 (N = 1653) found that ATCS Plus had little or no effect on number of days in hospital or number of hospitalisations (readmissions)(high certainty). |
| Adverse outcome: unintended adverse events attributable to the intervention ATCS Plus, IVR versus usual care | See comment | See comment | See comment | 1791 (2 studies) | See comment | ATCS Plus versus usual care Chaudhry 2010 (N = 1653) reported that no adverse events had occurred during the study (high certainty). IVR versus usual care Kurtz 2011 (N = 138) classified adverse events as cardiac mortality plus rehospitalisation for heart failure, reporting uncertain effects upon this composite outcome (very low certaintyi). |
| *The basis for the assumed risk (e.g. the median control group risk across studies) is provided in footnotes. The corresponding risk (and its 95% confidence interval) is based on the assumed risk in the comparison group and the relative effect of the intervention (and its 95% CI). ATCS Plus: automated telephone communication systems with additional functions; CI: confidence interval; CI: confidence interval; RR: risk ratio. | ||||||
| GRADE Working Group grades of evidence | ||||||
| aAdditional results are based on a narrative summary and synthesis of results that were not amenable to statistical analysis; please see Effects of interventions for detailed findings. | ||||||
| ATCS versus usual care for management of hypertension | |||||
| Patient or population: patients with hypertension Comparison: usual care, with and without education | |||||
| Outcomes | Illustrative comparative risks* (95% CI) | No of Participants | Quality of the evidence | Commentsa | |
| Assumed risk | Corresponding risk | ||||
| Usual care | ATCS | ||||
| Clinical outcome: systolic blood pressure (automated sphygmomanometer or electronic pressure monitor) ATCS Plus or IVR versus usual care at median follow‐up of 6 weeks | The mean systolic blood pressure in the control group was 141.1 mmHg | The mean systolic blood pressure in the intervention groups was (2.12 to 1.66 lower) | 65,256 | ⊕⊕⊕⊝ | 1 additional study (Dedier 2014) (N = 253) reported that compared with usual care plus education, IVR may have little or no effect on systolic blood pressure at 3 months (low certaintyc). |
| Clinical outcome: diastolic blood pressure (automated sphygmomanometer and electronic cuff) ATCS Plus, unidirectional versus usual care at median follow‐up of 14 weeks | The mean diastolic blood pressure in the control group was 81.2 mmHg | The mean diastolic blood pressure in the intervention groups was 0.02 mmHg higher (2.62 lower to 2.66 higher) | 65,056 | ⊕⊕⊝⊝ | — |
| Clinical outcome: blood pressure control, 26 weeks Multimodal/complex interventionf versus usual care | See comment | See comment | 166 (1 study) | ⊕⊕⊕⊝ | Bove 2013 (N = 241) found that a multimodal/complex intervention probably has little or no effect on blood pressure control. |
| Clinical outcome: Health statush, depressioni, 6 weeks ATCS Plus versus enhanced usual care (plus information) | See comment | See comment | 200 (1 study) | ⊕⊕⊝⊝ | Piette 2012 (N = 200) found that ATCS Plus may slightly improve health status and may decrease depressive symptoms. |
| Behavioural outcome: medication use Multimodal/complexk, ATCS Plus versus usual care or enhanced usual care (plus information) | See comment | See comment | 483 (2 studies) | ⊕⊕⊝⊝ | Multimodal/complex versus usual care Magid 2011 (N = 283) found that multimodal/complex intervention may have little or no effect on medication adherence assessed by Medication Possession Ratio or proportion adherent (low certaintyl). ATCS Plus versus enhanced usual care Piette 2012 (N = 200) found that ATCS Plus may reduce the number of medication‐related problemsm (low certaintyj). |
| Behavioural outcome: physical activity levels, 12 weeks IVR versus enhanced usual care | See comment | See comment | 253 (1 study) | ⊕⊕⊝⊝ | IVR versus enhanced usual care Dedier 2014 (N = 253) reported that IVR may slightly increase physical activity levels. |
| Adverse outcome: unintended adverse events attributable to the intervention Multimodal/complex intervention, ATCS Plus, IVR, unidirectional ATCS versus various controls | No studies reported adverse events. | ||||
| ATCS Plus: automated telephone communication systems with additional functions; CI: confidence interval; IVR: interactive voice response; MD: mean difference; SD: standard deviation. | |||||
| GRADE Working Group grades of evidence | |||||
| aAdditional results are based on a narrative summary and synthesis of results that were not amenable to statistical analysis; please see Effects of interventions for detailed findings. | |||||
| ATCS versus control for smoking cessation | ||||||
| Patient or population: patients with tobacco dependence Comparison: usual care, control (no calls, 'placebo' (inactive) ATCS, self‐help intervention, stage‐matched manuals) | ||||||
| Outcomes | Illustrative comparative risks* (95% CI) | Relative effect | No of participants | Quality of the evidence | Commentsa | |
| Assumed risk | Corresponding risk | |||||
| Control | ATCS | |||||
| Behavioural outcome: smoking abstinence Multimodal/complex intervention, ATCS Plus, IVR versus (various) controls or usual care at median follow‐up of 12 months | Study populationb | RR 1.2 | 2915 | ⊕⊕⊝⊝ | ATCS Plus versus usual care 1 further study, Reid 2011 (N = 440), reported that ATCS Plus may improve smoking abstinence rates at 26 weeks, and this may be maintained at 52 weeks (low certainty evidencef). | |
| 201 per 1000 | 241 per 1000 | |||||
| Moderatec | ||||||
| 241 per 1000 | 289 per 1000 | |||||
| Behavioural outcome: medication use Multimodal/complex, ATCS Plus versus control (inactive IVR or self‐help booklet) | See comment | See comment | See comment | 1127 (2 studies) | ⊕⊕⊕⊝ Moderateg | Multimodal/complex intervention versus control (self‐help booklet) Brendryen 2008 (N = 396) found that a multimodal/complex intervention probably has little or no effect on adherence to NRT (moderate certainty evidence). ATCS Plus versus control (inactive IVR) Regan 2011 (N = 731) found that ATCS Plus probably has little or no effect on medication use (moderate certainty evidence). |
| Behavioural outcome: support programme enrolment ATCS Plus versus control (inactive IVR) | See comment | See comment | See comment | 521 (1 study) | ⊕⊕⊝⊝ | Carlini 2012 found that ATCS Plus may improve re‐enrolment into a quit line support programme. |
| Adverse outcome: unintended adverse events attributable to the intervention Multimodal/complex intervention, ATCS Plus, IVR versus various controls | No studies were found that reported adverse events. | |||||
| *The basis for the assumed risk (e.g. the median control group risk across studies) is provided in footnotes. The corresponding risk (and its 95% confidence interval) is based on the assumed risk in the comparison group and the relative effect of the intervention (and its 95% CI). ATCS Plus: automated telephone communication systems with additional functions; CI: confidence interval; IVR: interactive voice response; NRT: nicotine replacement therapy; OR: odds ratio; RR: risk ratio; | ||||||
| GRADE Working Group grades of evidence | ||||||
| aAdditional results are based on a narrative summary and synthesis of results that were not amenable to statistical analysis; please see Effects of interventions for detailed findings. | ||||||
| Dichotomous outcomes | ||||||||||
| Primary outcome | Study ID | Timing of outcome assessment (months) | Intervention group | Comparator group | Between group difference | Notes | ||||
| Observed (n) | Total (N) | Observed (n) | Total (N) | P value | Effect estimate (OR/RR/HR) | 95% CI | ||||
| IMMUNISATIONS | ||||||||||
| Immunisation uptake | 24 | 107 | 189 | 87 | 186 | — | 1.21 | 0.99 to 1.47 | — | |
| * | 270 | 314 | 273 | 429 | — | — | — | — | ||
| 3 | 146 | 5599 | 46 | 6383 | < 0.001 | 3.69 | 2.64 to 5.15 | Cluster RCT unadjusted for clustering. Approximate sample size calculations gave the following adjusted values: intervention 20/791; control 6/902; see Appendix 14 for calculations | ||
| 4 | 89 | 167 | 70 | 162 | 0.11 | — | 29.0 to 43.8 | CIs for % values and for IVR alone; P value from Chi2 | ||
| 1 | 1684 | 4636 | 955 | 3366 | < 0.01 | 1.28 | 1.20 to 1.37 | — | ||
| 13 | 305 | 763 | 259 | 763 | < 0.05 | — | — | — | ||
| 2 | 3 | 26 | 3 | 24 | — | — | — | — | ||
| 1 | 46 | 112 | 41 | 110 | — | 1.07 | 0.78 to 1.46 | — | ||
| 18 | 928 | 1496 | 873 | 1510 | 0.02 | — | — | — | ||
| 12 | 748 | 1423 | 651 | 1296 | < 0.05 | 1.3 | 1.0 to 1.7 | — | ||
| SCREENING | ||||||||||
| Screening rate | 6 | 191 | 225 | 90 | 225 | < 0.001 | — | — | — | |
| 6 | 801 | 8005 | 234 | 3005 | 0.0012 | 1.32 | 1.14 to 1.52 | |||
| 3 | — | 45,303 | — | 30,229 | — | — | 1.28 to 1.42a 0.11 to 0.17b | aWomen aged 50‐69 years bWomen aged 20‐49 years | ||
| 10 to 14 | 960 | 1355 | 574 | 847 | 0.014 | 1.32 | 1.06 to 1.64 | — | ||
| 12 | 55a 47b | 134a 163b | 23a 16b | 137a 160b | — | 3.44a 3.70b | 1.91 to 6.19a 1.93 to 7.09b | aBreast cancer screening; bColorectal cancer screening | ||
| 12 | 36a 24b | 158a 157b | 28a 19b | 157a 156b | > 0.05 | 1.4a 1.3b | 0.8 to 2.4a 0.7 to 2.5b | aBreast cancer screening; bColorectal cancer screening (both crude estimates) | ||
| 12 | 30a 43b | 101a 114b | 15a 21b | 90a 126b | 0.034a 0.0002b | 1.96a 3.22b | 0.87 to 4.39a 1.65 to 6.30b | aBreast cancer screening; bColorectal cancer screening | ||
| 12 | 385 | 1565 | 290 | 1558 | < 0.001 | — | — | |||
| 6 | 662 | 2943 | 474 | 2962 | < 0.001 | 1.31 | 1.10 to 1.56 | — | ||
| 9 | 19a 33b | 90a 198b | 17a 27b | 88a 199b | — | — | — | aBreast cancer screening; bColorectal cancer screening | ||
| 12 | 3192 | 10,432 | 3194 | 10,506 | 0.76 | 1.01 | 0.94 to 1.07 | In the adjusted model | ||
| 10 | 144 | 997 | 97 | 976 | 0.006 | 1.52 | 1.13 to 2.05 | In the adjusted model | ||
| APPOINTMENT REMINDERS | ||||||||||
| Reducing non‐attendance rates | 1 | 144 | 277 | 78 | 240 | < 0.05 | 1.60 | 1.29 to 1.98 | — | |
| 1.5 | 333a 169b | 794a 411b | 324a 164b | 790a 409b | > 0.05 | — | −6 to 5a −8 to 7b | aColonoscopy bFlexible sigmoidoscopy | ||
| 2 | 347 | 700 | 322 | 670 | > 0.05 | — | — | — | ||
| 4 | 2662 | 3219 | 2576 | 3350 | < 0.001 | 1.52 | 1.34 to 1.71 | — | ||
| 1.5 | 473 | 500 | 453 | 500 | < 0.001 | 3.41 | 1.87 to 6.20 | — | ||
| 6 | 257 | 407 | 235 | 456 | < 0.01 | 1.50 | — | — | ||
| 3 days | 652 | 701 | 617 | 701 | < 0.05 | 1.71 | — | — | ||
| ADHERENCE | ||||||||||
| Adherence to medications/laboratory tests | 2.5 | 16 | 25 | 12 | 25 | 0.003 | — | — | — | |
| 3 | 453 | 2199 | 298 | 1550 | 0.31 | 1.09 | 0.92 to 1.28 | At 8 weeks differences were not significant (P = 0.23) | ||
| 25 days | 177 | 267 | 53 | 237 | < 0.001 | 4.1 | 3.0 to 5.6 | — | ||
| 6 | 24 | 133 | 16 | 134 | 0.03 | — | — | — | ||
| 12 | 47 | 157 | 42 | 155 | > 0.05 | — | — | — | ||
| 2 weeks | 1180 | 4124 | 958 | 4182 | < 0.001 | — | — | — | ||
| 12 | 109 | 122 | 88 | 119 | 0.003 | — | — | — | ||
| 5 | 29 | 38 | 34 | 42 | 0.233 | — | — | After the mid‐study visit | ||
| 12 | — | 169 | — | 168 | 0.19 | — | — | — | ||
| 1 | 1096975 | 4153634 | 18395 | 84187 | < 0.001 | — | — | — | ||
| 3 to 6 | 3362 | 6833 | 1865 | 4172 | — | — | — | |||
| 2 weeks | 4318 | 15,356 | 3309 | 15,254 | < 0.001 | — | — | — | ||
| 6 | 70 | 137 | 55 | 143 | 0.041 | 0.60 | 0.37 to 0.96 | Primary composite outcome of adherence and adverse effects (emergency room visit and hospitalisation) | ||
| 12 | — | 600 | — | 600 | — | 0.93 | 0.71 to 1.22 | — | ||
| 6 | 178 | 253 | 148 | 244 | < 0.05 | 1.54 | 1.13 to 2.10 | — | ||
| 18 | — | 3171 | — | 3260 | 0.002 | — | 0.01 to 0.03 | P value and CIs for Δ change | ||
| 12 | — | 7247 | — | 7255 | 0.022 | — | 0.011 to 0.034 | P value and CIs for Δ change | ||
| HEART FAILURE | ||||||||||
| Heart failure hospitalisation | 10 ± 6 (median 11) | 17 | 67 | 58 | 66 | < 0.05 | — | — | — | |
| 12 | 4 | 32 | 17 | 50 | < 0.05 | — | — | This was a cluster outcome: "cardiovascular deaths and hospitalisations‐ which ever event occurred first" | ||
| All‐cause mortality | 10 ± 6 (median 11 ) | 5 | 67 | 7 | 66 | > 0.05 | — | — | — | |
| 6 | 92 | 826 | 94 | 827 | 0.86 | 0.97 | 0.73 to 1.30 | Death or readmission | ||
| 12 | 17 | 170 | 16 | 209 | 0.439 | 1.36 | 0.63 to 2.93 | — | ||
| Cardiac mortality | 10 ± 6 (median 11) | 2 | 67 | 6 | 66 | > 0.05 | — | — | — | |
| 12 | 3 | 32 | 5 | 50 | > 0.05 | — | — | Cluster outcome: "cardiovascular deaths and hospitalisations‐ which ever event occurred first" | ||
| SMOKING | ||||||||||
| Smoking abstinence | 12 | 74 | 197 | 48 | 199 | 0.02 | 1.91 | 1.12 to 3.26 | — | |
| 9 | 20 | 120 | 25 | 111 | — | — | — | — | ||
| 12 | 12 | 23 | 14 | 21 | 0.33 | — | — | — | ||
| 3 | 105 | 361 | 95 | 364 | 1.13 | 0.90 to 1.41 | — | |||
| 12 | 23 | 50 | 17 | 49 | 0.25 | 1.60 | 0.71 to 3.60 | — | ||
| 6 | 51 | 198 | 30 | 199 | 0.009 | 1.71 | 1.14 to 2.56 | — | ||
| 30 | 75 | 500 | 65 | 523 | — | — | — | For 6 month prolonged abstinence | ||
| Continous outcomes | ||||||||||
| Primary outcome | study ID | Timing of outcome assessment (months) | Intervention group | Comparator group | Between‐group difference | Notes | ||||
| Mean | Standard deviation of change (SD) or SD | Mean | Standard deviation of change (SD) or SD | Change | Confidence intervals | P values | ||||
| ALCOHOL CONSUMPTION | ||||||||||
| Drinks per drinking day | 2 | 3.5 | 1.8 | 4.7 | 3.2 | 1.38 | 1.12 to 1.70 | < 0.01 | CIs are for the effect size | |
| 2 | 4 | 0.4 | 4.3 | 0.4 | — | — | 0.45 | — | ||
| CANCER | ||||||||||
| Symptom severity | 1 | — | — | — | — | — | — | — | Effect size: intervention = 0.75; control = 0.68 | |
| 1.5 | 5.76 to 7.36 (range) | — | 5.55 to 7.44 (range) | — | 0.06 | — | 0.58 | — | ||
| 2.5 | 20.73 | — | 20.80 | — | — | — | > 0.05 | Effect size: intervention = 0.59; control = 0.56 | ||
| 2.5 | 11.6 | — | 11.0 | — | — | — | 0.02 | — | ||
| DIABETES | ||||||||||
| Glycated haemoglobin (%) | 3 | 7.87 | 1.09 | 7.82 | 1.14 | — | — | 0.89 | — | |
| 6 | 8.10 | 7.90 | — | — | — | > 0.05 | Median values | |||
| 3 | 9.1 | 1.9 | 8.6 | 1.3 | — | — | 0.41 | — | ||
| 12 | 9.0 | 2 | 9.9 | 2.2 | — | — | 0.02 | — | ||
| 6 | 7.0 | 1.4 | 7.3 | 1.5 | — | — | 0.04 | — | ||
| 12 | 8.1 | 1.15 | 8.2 | 1.18 | — | — | 0.3 | — | ||
| 12 | 8.7 | 1.9 | 9.0 | 2.2 | 0.1 | 0.5 to 0.4 | 0.8 | — | ||
| 6 | 7.9 | 1.2 | 8.7 | 1.8 | 0.91 | 0.86 to 0.93 | 0.002 | — | ||
| Serum blood glucose (mg/dL) | 12 | 180 | 9 | 172 | 10 | — | — | 0.6 | — | |
| 26 | 107.4 | 12.9 | 109.7 | 16.5 | — | — | 0.44 | — | ||
| Self‐monitoring of blood glucose | 3 | 1.9 | 1.07 | 1.3 | 0.75 | — | — | < 0.001 | — | |
| 6 | 0.05 | 0.387 | 0.08 | 0.365 | — | — | 0.457 | — | ||
| 12 | 4.6 | 0.1 | 4.4 | 0.1 | — | — | 0.05 | — | ||
| 12 | 4.3 | 2.6 | 3.3 | 2.9 | 0.8 | 0.1 to 1.5 | 0.03 | — | ||
| Self‐monitoring of diabetic foot | 12 | 4.6 | 0.1 | 4.4 | 0.1 | — | — | — | — | |
| 12 | 5.1 | 1.4 | 4.6 | 1.7 | 0.6 | 0.2 to1.0 | 0.002 | — | ||
| HYPERTENSION | ||||||||||
| Systolic Blood Pressure (mm Hg) | 3 | 136.4 | 83.5 | 138.9 | 81.5 | — | — | > 0.05 | — | |
| 6 | 123.8 | 14.2 | 128.6 | 19.4 | — | — | > 0.05 | — | ||
| 6 | 158 | * | 160.2 | * | −1.8 | — | 0.20 | — | ||
| 1 | 141.2 | 15.1 | 143.1 | 14.6 | — | < 0.001 | — | |||
| 6 | 137.4 | 19.4 | 136.7 | 17.0 | −0.7 | — | 0.006 | — | ||
| 6 weeks | 142.5 | 2.3 | 143.6 | 2.4 | −4.2 | −9.1 to 0.7 | 0.09 | — | ||
| Diastolic Blood Pressure (mm Hg) | 6 | 80.9 | — | 83.2 | — | — | — | 0.02 | — | |
| 6 | 74.6 | 8.5 | 79.5 | 14.0 | — | — | > 0.05 | — | ||
| 1 | 80.3 | 12.6 | 81.3 | 12.5 | — | — | < 0.001 | — | ||
| 6 | 82.9 | 12.9 | 81.1 | 11.7 | −2.3 | −4.9 to −0.2 | 0.07 | — | ||
| OBSTRUCTIVE SLEEP APNOEA SYNDROME (OSAS) | ||||||||||
| Continuous positive airway pressure (CPAP) use | 2 | 4.4 | — | 2.9 | — | — | — | 0.076 | — | |
| 12 | — | — | — | — | — | 1.18 to 2.48 | 0.004 | — | ||
| WEIGHT MANAGEMENT | ||||||||||
| BMI in adults | 18 | 36.54 | 2.01 | 36.84 | 1.90 | −0.35 | −0.75 to 0.06 | — | — | |
| 18 | 29.8 | 1.90 | 30.3 | 1.93 | −0.6 | −1.2 to −0.1 | 0.03 | — | ||
| 6 | 33.7 | 5.2 | 37.2 | 8.7 | — | — | 0.06 | — | ||
| BMI‐z scores in children | 12 | 1.95 | 0.04 | 1.98 | 0.03 | — | — | > 0.05 | — | |
| 3 | 1.9 | 0.28 | 1.9 | 0.3 | −0.03 | — | 0.48 | — | ||
| Analyses limited to primary outcomes from at least 2 studies from the same category. | ||||||||||
| Study ID | Study typea | Study subtypeb | Country | Sample size | Mean age (years unless stated otherwise) | Male (%) | Female (%) | Ethnicityc | Duration of condition | Comorbidities, medication | Incentives for participation | Incentives |
| P | Alcohol misuse | USA | 187 | 45 | 63 | 37 | White ‐ 54% Other ‐ 46% | — | — | Yes | Visa gift cards or checks (USD 50 per in‐person interview, USD 15 per phone interview). IG participants received USD 0.50 minimum for each daily call and USD 1.00 after seven consecutive calls | |
| P | I | USA | 1138 | — | — | — | — | — | — | — | — | |
| P | I | USA | 11,982 | 72 | — | — | — | — | — | — | — | |
| P | I | USA | 1227 | 2‐3 months | — | — | — | — | — | — | — | |
| P | I | USA | 3050 | 9 monthsd | 49 | 51 | Black ‐ 76% Hispanic ‐ 14% White ‐ 7% Other – 3% | — | — | — | — | |
| P | I | USA | 752 | 20 months | — | — | — | — | — | — | — | |
| P | I | USA | 8002 | — | 51 | 49 | Black ‐ 50% White ‐ 45% Other – 5% | — | — | — | — | |
| P | I | USA | 50 | 24 | 0 | 100 | Black ‐ 86% White ‐ 14% | — | — | Yes | USD 35 per month to help pay for cell phone service or a free, unlimited minutes cell phone until 6 weeks postpartum | |
| P | I | USA | 229 | 9 months | 52 | 48 | Black ‐ 90% Other – 7% Hispanic ‐ 3% | — | — | — | — | |
| P | I | USA | 3006 | — | 51 | 49 | Other – 41% Black ‐ 35% White ‐ 17% Hispanic ‐ 7% | — | — | — | — | |
| P | I | USA | 4115 | 14 | 50 | 50 | — | — | — | — | — | |
| P | Physical activity | USA | 71 | 57 | 0 | 100 | White ‐ 93% Other ‐ 7% | — | — | — | — | |
| P | Physical activity | USA | 181 | 69 | 99 | 1 | — | — | Mean (SD) number of comorbidities IG: 3.8 (1.5) CG: 3.9 (1.4) | Yes | USD 15 for completing each | |
| P | Physical activity | USA | 85 | 67 | 24 | 76 | Other ‐ 70% Black ‐ 30% | — | Mean co‐morbidities: 3 | — | — | |
| P | Physical activity | USA | 218 | 61 | 31 | 69 | White ‐ 90% Other ‐ 10% | — | — | — | — | |
| P | Physical activity | USA | 398 | 78 | 100 | 0 | White ‐ 77% Black ‐ 23% | — | Mean (SD) number of diseases IG: 5.2 (2.5) CG: 5.5 (2.7) | — | — | |
| P | Physical activity | USA | 302 | 67 | 97 | 3 | White ‐ 70% | — | Mean (SD) number of comorbidities IG: 4.2 (2.4) CG: 3.9 (2.4) | — | — | |
| P | Physical activity | USA | 298 | 46 | 28 | 72 | White ‐ 45% Black ‐ 45% Other ‐ 10% | — | — | — | — | |
| P | Physical activity | USA | 103 | 71 | 69 | 31 | — | — | Depression (unclear %) | — | — | |
| P | Screening | USA | 450 | 60 | 28 | 72 | Hispanic 87% Other‐ 13% | — | ≥ 1 long‐term conditions ‐ 68% | No | — | |
| P | Screening | USA | 11,010 | 61 | 54 | 46 | White ‐ 86% Other ‐ 14% | — | — | — | — | |
| P | Screening | Australia | 75,532 | — | 0 | 100 | — | — | — | — | — | |
| P | Screening | USA | 3547 | — | 0 | 100 | White ‐ 88% Black ‐ 11% Asian or Other ‐ 1% | — | — | — | — | |
| P | Screening | USA | 47,097 | 58 | 47 | 53 | — | — | — | — | — | |
| P | Screening | USA | 469 | — | 56 (for colorectal cancer) | 44 (for colorectal cancer) | White ‐ 61% Black ‐ 28% Latinos ‐ 5% Asian ‐ 5% | — | — | — | — | |
| P | Screening | USA | 1008 | — | 45 | 55 | White ‐ 48% Black ‐ 37% Other ‐ 15% | — | — | No | — | |
| P | Screening | USA | 366 | — | — | — | White ‐ 50% Black ‐ 41% Other (including Hispanic) ‐ 9% | — | — | — | — | |
| P | Screening | USA | 4685 | 57 | 0 | 100 | — | — | Anticonvulsants ‐ 6% Corticosteroids ‐ 4% COPD (unclear %) Oophorectomy ‐ 3% | — | — | |
| P | Screening | USA | 6000 | 60 | 50 | 50 | White ‐ 93% Other ‐ 7% | — | Obesity ‐ 40% | — | — | |
| P | Screening | USA | 685 | 58 | 38 | 62 | Non‐Hispanic white ‐ 78% Black ‐ 13% Other ‐ 9% | — | — | — | — | |
| P | Screening | USA | 20,936 | 57 | 47 | 53 | White ‐ 86% Other ‐ 9% Black ‐ 5% | — | — | — | — | |
| P | Screening | USA | 1973 | 69 | 8 | 92 | — | — | Use of oral glucocorticoids ‐ 22% Fractures ‐ 12% | — | — | |
| P | Stress management | USA | 100 (caregiver) | 63 (caregiver) | 22 (caregiver) | 78 (caregiver) | Black ‐ 64% Hispanic ‐ 21% White ‐ 15% Other ‐ 1% | — | — | — | — | |
| P | Substance use | USA | 33 | 46 | 76 | 24 | White ‐ 64% White ‐ 15% Hispanic ‐ 21% | — | HIV medication ‐ 64% Hepatitis A, B, or C ‐ 49% | Yes | USD 20 gift certificates for each assessment | |
| P | Weight management | USA | 365 | 55 | 31 | 69 | Black ‐ 71% Hispanic ‐ 13% White ‐ 4% Other ‐ 2% | — | Cholesterol medication ‐ 36% Diabetes medication ‐ 30% Mean BMI ‐ 37 kg/m2 | Yes | USD 50 reimbursement at the first 3 follow‐up visits and USD 75 at 24 months | |
| P | Weight management | USA | 194 | 35 | 0 | 100 | Black ‐ 100% | — | Hypertension ‐ 36% Metabolic syndrome ‐ 31% Depression ‐ 22% Diabetes mellitus ‐ 7% | Yes | Reimbursements of USD 50 each at baseline and at all follow‐up study visits | |
| P | Weight management | USA | 77 | 59 | 29 | 71 | White ‐ 68% Hispanic ‐ 18% Other ‐ 7% Black ‐ 4% Asian ‐ 3% | — | — | — | — | |
| P | Weight management | USA | 220 | 11 | 54 | 46 | White‐ 63% Hispanic ‐ 26% Other ‐ 11% | — | — | — | — | |
| P | Weight management | Greece | 122 | 44 | 12 | 88 | — | — | Hypertension ‐ 13% Diabetes mellitus ‐ 2% | — | — | |
| P | Weight management | USA | 140 | — | — | — | — | — | — | — | — | |
| P | Weight management | USA | 50 (child) | 10 (child) 40 (parent) | 58 (child) 4 (parent) | 42 (child) 96 (parent) | Black ‐ 72% Other ‐ 22% White ‐ 6% (parent) | — | BMI (child) ‐ 25.7 kg/m2 BMI (parent) ‐ 34 kg/m2 | Yes | For completing assessments (USD 40 parents; USD 10 child) | |
| E | Appointment reminder | USA | 517 | — | — | — | — | — | — | — | — | |
| E | Appointment reminder | USA | 3610 | 63 | 95 | 5 | White ‐ 83% Other ‐ 16% Hispanic ‐ 1% | — | — | — | — | |
| E | Appointment reminder | USA | 2304 | 29 | — | 100 | Hispanic ‐ 66% Black ‐ 19% White ‐ 13% Other ‐ 2% | — | — | — | — | |
| E | Appointment reminder | USA | 12,092 | 56 | 43 | 57 | — | — | — | — | — | |
| E | Appointment reminder | UK | 1000 | — | 33 | 67 | — | — | — | — | — | |
| E | Appointment reminder | USA | 2008 | 19d | 54 | 46 | Spanish‐speaking ‐ 39% Vietnamese‐speaking ‐ 28% English‐speaking ‐14% Other – 13% Tagalog‐speaking Filipino – 6% | — | — | — | — | |
| E | Appointment reminder | USA | 701 | < 12e | 45 | 55 | English‐speaking ‐ 59% Spanish‐speaking ‐ 29% Vietnamese‐speaking ‐ 3% Other – 9% | — | — | — | — | |
| M | Illicit drugs addiction | USA | 36 | 41 | 58 | 42 | White ‐ 58% Black ‐ 28% Other – 14% | On methadone treatment mean = 21.7 | — | Yes | USD 20 per week for completing weekly assessments and providing a urine sample | |
| M | Alcohol consumption | Sweden | 1423 | — | — | — | — | — | — | — | — | |
| M | Alcohol consumption | USA | 254 | 46 | 78 | 22 | Black ‐ 49% Hispanic ‐ 45% Other – 6% | 12.8y | HIV/AIDS (unclear %) | Yes | USD 20; USD 40 at last 2 post‐treatment follow‐ups | |
| M | Alcohol consumption | USA | 338 | 46 | 64 | 36 | White ‐ 97% | Currently dependent ‐ 67% | — | Yes | USD 30 for the | |
| M | Alcohol consumption | USA | 110 | 49 | 58 | 42 | White ‐ 86% Black ‐9%, Hispanic‐3% Other‐2% | Mean of 1.2 (SD 2.4) | — | Yes | The possible total incentive was USD 50.00 per week | |
| M | Alcohol consumption | USA | 60 | 42 | 55 | 45 | White ‐ 95% Black ‐5% | 52.3 heavy drinking days within past 3 months | — | Yes | Patients were paid USD 75 for the 30‐day follow‐up, USD 125 for the 90‐day follow‐up, and USD 200 for the 180‐day follow‐up | |
| M | Alcohol consumption | USA | 158 | 49 | 53 | 47 | — | Regular alcohol use mean = 17.94 years | — | Yes | USD 25 for each interview | |
| M | Alcohol consumption | USA | 47 | 57 | 60 | 40 | Caucasian ‐ 83% African‐American ‐ 13% | — | — | — | — | |
| M | Alcohol consumption | USA | 98 | 46 | 91 | 9 | White ‐ 45% Black ‐ 40% Native American ‐ 7% Other ‐ 6% Hispanic ‐ 2% | — | — | Yes | USD 25.00 each for the baseline and for the follow‐up assessments | |
| M | Asthma | USA | 6948 | 52 | 35 | 65 | White ‐ 92% Other ‐ 8% | — | Beta agonist ‐ 55% Oral steroids ‐ 46% COPD ‐ 33% | — | — | |
| M | Asthma | Australia | 121 | 7 | 53 | 47 | — | — | — | — | — | |
| M | Cancer | USA | 79 | 60 | 53 | 47 | White ‐ 85% Black ‐ 15% | — | — | — | — | |
| M | Cancer | USA | 405 | 59 | 32 | 68 | White ‐ 80% Black‐ 18% Other ‐ 2% | — | Depression ‐ 76% Pain ‐ 68% | — | — | |
| M | Cancer | USA | 250 | 55 | 24 | 76 | White/Caucasian ‐ 91% Other ‐ 9% | — | — | — | — | |
| M | Cancer | USA | 239 | 58 | 50 | 50 | White ‐ 89% Black‐ 6% Hispanic ‐ 4% Other 1% | Mean (SD) time since cancer diagnosis‐ IG: 36 months (35) CG: 26 months (32) | Mean (SD) symptoms (out of 13) IG: 3.4 (2.2) CG: 4.0 (2.4) | — | — | |
| M | Cancer | USA | 437 | 57 | 25 | 75 | — | — | Mean comorbidities: 2 | — | — | |
| M | Cancer | USA | 119 | 60 | 31 | 69 | White ‐ 76% Asian ‐ 17 % Black ‐ 7% | — | Capecitabine ‐ 35% Erlotinib ‐ 24% Lapatinib ‐ 9% Imatinibf ‐ 8% Temozolomide ‐ 6% Sunitinib ‐ 5% | — | — | |
| M | Cancer | USA | 253 | 61 | 49 | 51 | White ‐ 58% Black ‐ 36% Other ‐ 6% | — | Planned single chemotherapy ‐ 9% Planned combination chemotherapy ‐ 90% | — | — | |
| M | Chronic pain | USA | 250 | 55 | 83 | 17 | White ‐ 77 % | ≤ 5 years = 29% 6‐10 years = 19% > 10 years = 52% | Major depression‐ 24% Post‐traumatic stress disorder‐ 17% | — | — | |
| M | Chronic pain | USA | 55 | 46 | 14 | 86 | White ‐ 96% Other ‐ 4% | — | — | — | — | |
| M | COPD | UK | 79 | 69 | 74 | 26 | — | — | SABA ‐ 75% LAMA ‐ 43% LABA/ICS ‐ 43% ICS ‐ 33% SAMA ‐ 32% Oral steroids ‐ 25% LABA ‐ 18% | — | — | |
| M | Adherence | USA | 475 | 5 (child) 35 (parent) | 52 (child) 7 (parent) | 48 (child) 93 (parent) | Black ‐ 67% (child) 47% (parent); Other – 33% (child) 53% (parent) | — | — | Yes | Gift cards | |
| M | Adherence | USA | 50 | 42 | 36 | 64 | White ‐ 58% Black ‐ 20% Hispanic ‐ 18% Asian ‐ 4% | — | — | Yes | USD 25 for each completed visit | |
| M | Adherence | USA | 1187 | — | — | — | — | — | — | — | — | |
| M | Adherence | USA | 70 | 66 | 49 | 51 | African American ‐ 58% European ‐ 32% Asian ‐ 6% Hispanic ‐ 3% Middle Eastern ‐ 1% | Median 5 years in IG; 4.5 years in CG | Bimatoprost ‐ 11.5% Travoprost ‐ 17.5% Latanoprost ‐ 71.5% Bilateral medication ‐ 70% | — | — | |
| M | Adherence | USA | 1393 | — | — | — | — | — | — | — | — | |
| M | Adherence | USA | 13,057 | 51 | 54 | 46 | Other ‐ 48 % White ‐ 23% Hispanic ‐ 14% Black ‐ 10% Asian ‐ 5% | — | — | — | — | |
| M | Adherence | USA | 5216 | 56 | 49 | 51 | Hispanic ‐ 30% White ‐ 28% Unknown ‐ 23% Black ‐ 10% Asian and Pacific Islander ‐ 7.1% Other ‐ 1.7% Native American‐ 0.2% | — | Mean low‐density lipoproteins = 146 mg/dL | — | — | |
| M | Adherence | USA | 961 | 59 | 47 | 53 | — | — | Statins ‐ 32% Depression ‐ 11% | — | — | |
| M | Adherence | USA | 267 | 77 | 23 | 77 | Other ‐ 89 % Black: 11% | — | Other – 81% Heart disease ‐ 32% Diabetes mellitus ‐ 18% Stroke ‐ 7% | — | — | |
| M | Adherence | USA | 312 | 63 | 62 | 38 | Black ‐ 91% White ‐ 9% | — | — | Yes | USD 25 gift card | |
| M | Adherence | USA | 8306 | — | — | — | — | — | — | — | — | |
| M | Adherence | USA | 241 | 64 | 98 | 2 | White ‐ 78% | — | Hypertension ‐ 91% Hyperlipidaemia ‐ 85% Diabetes mellitus ‐ 45% Chronic kidney disease ‐ 23% Chronic lung disease ‐ 20% Prior heart failure ‐ 12% Peripheral arterial disease ‐ 10% Cerebrovascular disease ‐ 7% | — | — | |
| M | Adherence | USA | 16 | 71 | 31 | 69 | — | — | — | Yes | USD 25 for participating | |
| M | Adherence | USA | 80 | 66 | 51 | 49 | White ‐ 62% African‐American ‐ 10% Hispanic/Latino ‐ 9% Asian ‐ 9% East Indian ‐ 6% | Mean IG: 25.79 months; CG: 22.1 months | Number of medical problems: IG: 3.43 CG: 3.32 | — | — | |
| M | Adherence | USA | 337 | 57 | 30 | 70 | Black ‐ 100% | — | BMI ‐ 34.4 kg/m2 Diabetes ‐ 38% Stroke ‐ 7.5% | — | — | |
| M | Adherence | USA | 4,237,821 | 56 | 38.5 | 61.5 | — | — | Correspondence with the author: "All participants were on maintenance medications" | — | — | |
| M | Adherence | USA | 27 | 80 | — | — | — | — | Participants had cognitive (memory) impairment and were on donepezil, rivastigmine, or galantamine | — | — | |
| M | Adherence | USA | 15,051 | 57 | 53 | 47 | — | — | — | — | — | |
| M | Adherence | USA | 30,610 | — | — | — | — | — | — | — | — | |
| M | Adherence | Canada | 331 | 63 | — | — | — | — | — | — | — | |
| M | Adherence | USA | 1200 | 51 | 62 | 38 | Other ‐ 95% Black ‐ 5% | — | Insulin ‐ 19.4% (participants) | — | — | |
| M | Adherence | USA | 497 | 54 | 38 | 62 | — | — | Lipitor – 54% Zocor – 16% Other statin – 16% | — | — | |
| M | Adherence | USA | 647 | — | — | — | — | — | — | — | — | |
| M | Adherence | USA | 8517 | 54 | 34 | 66 | White ‐ 50% Other – 26% Asian ‐ 11% Mixed – 7% Native Hawaiian/Pacific Islander ‐ 4% Black ‐ 2% American Indian/Alaskan Native – 1% | — | COPD ‐ 33% | — | — | |
| M | Adherence | USA | 21,752 | 64 | 53 | 47 | White ‐ 47% Asian ‐ 17% Black ‐15% Native Hawaiian/Pacific Islander ‐ 11% Black ‐ 2% American Indian/Alaskan Native – 1% | — | Diabetes mellitus ‐ 78% CVD ‐ 36% Statin only ‐ 40% ACEI/ARB only ‐ 25% Statin and ACEI/ARB ‐ 35% low‐density lipoproteins among statin users (mean) = 93.4 mg/dL | — | — | |
| M | Diabetes mellitus | USA | 119 | 62 | 55 | 45 | White ‐ 77% Other – 23% | — | — | Yes | USD 25 | |
| M | Diabetes mellitus | USA | 80 | 30 | 0 | 100 | White ‐ 41% Black ‐ 34% Hispanic ‐ 18% Asians or others ‐ 7% | — | BMI ‐ 34.1 kg/m2 | — | — | |
| M | Diabetes mellitus | USA | 98 | 59 | 40 | 60 | Black ‐ 65% White ‐ 30% Other ‐ 3% Hispanic ‐ 1% Asian ‐ 1% | — | Other antidiabetic medications + insulin ‐ 80% Basal‐bolus regimen ‐ 40% Long‐acting insulin only ‐ 33% Mixed insulin only ‐ 17% Short‐acting insulin only ‐ 10% | — | — | |
| M | Diabetes mellitus | USA | 75 | 52 | 59 | 41 | Hispanic ‐ 100% | — | — | Yes | USD 10 for initial visit and USD 20 incentive card at the follow‐up | |
| M | Diabetes mellitus | USA | 100 | — | — | — | — | — | Psychiatric illness ‐ 46% Had been hospitalised over the past year ‐ 28% | — | — | |
| M | Diabetes mellitus | USA | 417 | 53 | 38 | 62 | Hispanic ‐ 100% | — | — | — | — | |
| M | Diabetes mellitus | USA | 248 | 55 | 41 | 59 | Hispanic ‐ 50% White ‐ 29% Other – 21% | — | BMI ‐ 33.7 kg/m2 Mean comorbidities: 1 | — | — | |
| M | Diabetes mellitus | USA | 272 | 61 | 97 | 3 | White ‐ 60% Black ‐ 18% Hispanic ‐ 12% Other ‐ 10% | — | BMI ‐ 31 kg/m2 Mean comorbidities: 2 | — | — | |
| M | Diabetes mellitus | USA | 339 | 56 | 43 | 57 | Hispanic ‐ 47% Asian ‐ 22% Black ‐ 20% White ‐ 8% Other ‐ 2% | — | BMI: 31 kg/m2 | Yes | USD 15 and USD 25 for the baseline and 1‐year follow‐up visits, respectively | |
| M | Diabetes mellitus | Australia | 120 | 57 | 63 | 37 | — | — | Low depression – 73% Intermediate depression – 23% High depression – 4% Low anxiety – 89% Intermediate anxiety – 8% High anxiety – 3% BMI ‐ 33 kg/m2 Insulin – 43% | — | — | |
| M | Heart failure | Italy | 133 | 57 | 88 | 12 | — | — | Diuretics ‐ 89% ACE inhibitors ‐ 84% Carvedilol ‐ 50% Nitrates ‐ 40% Digitalis ‐ 33% K + saver ‐ 21% | — | — | |
| M | Heart failure | USA | 1653 | 61d | 58 | 42 | White ‐ 49% Black ‐ 39% Other – 12% (inclusive of Hispanic or Latino – 3%) | — | Beta‐blocker – 79% Loop diuretic – 78% Hypertension ‐ 77% ACE inhibitor or ARB – 70% Coronary artery disease ‐ 50% Diabetes mellitus ‐ 47% Chronic kidney disease ‐ 46% Aldosterone‐receptor antagonist – 33% Digoxin – 25% COPD ‐ 21% | No | — | |
| M | Heart failure | Australia | 405 | 73 | 63 | 37 | — | — | Diuretics ‐ 80% Heart failure specific beta‐blockers ‐ 61% Systolic heart failure ‐ 60% ACE inhibitors ‐ 57.5% Diabetes mellitus ‐ 30.5% Aldosterone antagonist ‐ 26% ARB ‐ 25% Diastolic heart Internal cardio defibrillator ‐ 4.5% | — | — | |
| M | Heart failure | France | 138 | 68 | 79 | 21 | — | — | Loop diuretic – 92% ACE/AT2– 79% Beta‐blocker – 79% Spironolactone – 29% Digoxin – 9% (mean values) | — | — | |
| M | HIV | India | 631 | — | 57 | 43 | Asian ‐100% | — | Zidovudine‐based antiretroviral treatment – 44% Tenofovir‐based antiretroviral treatment – 44% Stavudine‐based antiretroviral treatment – 12% | Yes | Mobile phone plus wage compensation | |
| M | Hypercholestorolaemia | USA | 115 | 48 | 25 | 75 | White ‐ 87% Other – 13% | — | — | — | — | |
| M | Hypercholesterolaemia | USA | 123 | 57 | 25 | 75 | Black ‐ 77% Other – 23% | — | Mean BMI ‐ 31 kg/m2 | — | — | |
| M | Hypertension | USA | 241 | 60 | 21 | 79 | Black ‐ 81% White‐ 15% Hispanic ‐ 3% Other ‐ 1% | — | Hyperlipidaemia ‐ 46% Diabetes ‐ 32% | — | — | |
| M | Hypertension | USA | 253 | 58 | 27 | 73 | Black ‐ 100% | — | — | — | — | |
| M | Hypertension | USA | 64,773 | 61 | 46 | 54 | White ‐ 41%, Hispanic ‐ 25% Black ‐ 17% Other – 9% Asian ‐ 8% | — | Cardiovascular disease ‐ 38% Diabetes mellitus ‐ 27% Chronic kidney disease ‐ 10% | — | — | |
| M | Hypertension | USA | 283 | 66 | 65 | 35 | White ‐ 65% Other – 18% Hispanic ‐ 17% | — | Diabetes mellitus or chronic kidney disease – 55% | Yes | Clinically validated electronic blood pressure cuffs were provided at no cost to those who did not own one | |
| M | Hypertension | Honduras; Mexico | 200 | 58 | 33 | 67 | — | — | Blood pressure medication – 83% Diabetes mellitus ‐ 23% BMI ‐ 30.7 kg/m2 | — | — | |
| M | Mental health | USA | 164 | 39 | 24 | 76 | White ‐ 56% Black ‐ 32% Other – 12% | — | — | — | — | |
| M | Mental health | USA | 218 | 39 | 58 | 42 | White ‐ 93% Other – 7% | — | Social phobia ‐ 9%, Generalised anxiety disorder ‐8% Simple phobia – 6% Major depression – 2% Dysthymia – 2% | — | — | |
| M | Mental health | USA | 73 | 54 | 18 | 82 | Other – 74% Hispanic – 26% | — | — | — | — | |
| M | OSAS | USA | 30 | 46 | — | — | — | — | BMI ‐ 38 kg/m2 | — | — | |
| M | OSAS | USA | 250 | 55d | 82 | 18 | — | — | BMI ‐ 35.1 kg/m2 | — | — | |
| M | Smoking | Norway | 396 | 36 | 47 | 53 | — | — | — | Yes | All participants in both groups received a sample packet of nicotine replacement therapy products. | |
| M | Smoking | USA | 521 | 36 | 36 | 64 | White ‐ 81% Black ‐ 6% Other – 5% Hispanic/Latino ‐ 4% Native American – 3% Asian ‐ 1% | — | ≥ 1 long‐term conditions ‐ 47% | No | — | |
| M | Smoking | USA | 332 | 30 | 0 | 100 | White ‐ 61% Black ‐ 16% Hispanic ‐ 15% Other – 8% | — | — | — | — | |
| M | Smoking | Canada | 44 | 53 | 67 | 33 | — | Mean cigarettes/d: intervention ‐ 18.5 control ‐ 17.3 | — | — | — | |
| M | Smoking | Taiwan | 116 | 20 | 92 | 8 | Asian ‐ 100% | — | — | Yes | Equivalent of USD 6 | |
| M | Smoking | USA | 731 | 52 | 56 | 44 | — | — | — | — | — | |
| M | Smoking | Canada | 100 | 54 | 68 | 32 | — | — | Acute coronary syndrome ‐ 83% | — | — | |
| M | Smoking | Canada | 440 | — | — | — | — | — | — | — | — | |
| M | Smoking | USA | 397 | 53 | 48 | 52 | White ‐ 81% Hispanic ‐ 6% Black ‐ 4% Other/unknown ‐ 4% Native American ‐ 3% Asian/Pacific Islander ‐2.5% | Mean cigarettes/d: IG = 17.1 CG = 16.3 | Depressive symptoms (mean) IG = 9.3 CG = 10.3 | Yes | USD 50 for a saliva sample | |
| M | Smoking | USA | 2054 | 51 | 77 | 23 | White ‐ 89%, Black ‐ 5%, Other ‐ 4% Native American ‐ 2% | Mean cigarettes/d IG = 23.85 CG = 25.18 | — | — | — | |
| M | Spinal cord dysfunction | USA | 142 | 48 | 61 | 39 | White ‐ 80% (inclusive of Hispanic or Latino – 7%) Black ‐ 11% Other ‐ 9% | 11.7 y | Depression – 39% Pressure ulcers ‐ 7% | — | — | |
| aStudy type: P: prevention; M: management; E: either. cPlease note that for reporting of participants' ethnicity, the terms used by authors of the included studies have been used in each case and are cited directly from each of the included studies. | ||||||||||||
| Study ID | ATCSa | Contentb | Theoryc | BCTsd | Received instructions? | Callere | Telephone keypadf | Toll free | Study duration | Call durationg | Frequencyh | Intensity i | Speaker | Security arrangementj |
| IVR | AF | — | 1 | — | P | Other | — | 25 months | 29.3 min | — | — | Synthetic speech | — | |
| ATCS Plus | AF,SF | MI | 9, 25, 40 | Yes | E | Yes | Yes | 2 months | 1‐3 min | Daily | — | — | — | |
| IVR | AF | — | 25 | — | — | — | — | 1.5 months | — | — | < 500 words | — | — | |
| Unidirectional¹ | AF | TCD | 1, 42 | No | H | — | — | 6 months | — | 2 | 92 words | — | — | |
| IVR | AF | HBM | 20, 21, 42 | — | H | Yes | Yes | 2.5 months | < 5 min | 2 | — | — | — | |
| IVR | AF | — | 20,21 | — | — | — | — | 24 months | — | — | — | — | — | |
| ATCS Plus | AF, CF | SCT, TRA, TTM | 3, 9, 12, 13, 17, 20, 21, 25, 33, 39, 40, 42 | — | — | — | — | 24 months | — | — | — | — | — | |
| ATCS Plus¹ | AF, CF | SCT, TRA, TTM, MI | 3, 9, 12, 13, 17, 20, 21, 25, 33, 39, 40, 42 | — | H | — | — | 12 months | 2–4 min | Weekly | — | — | — | |
| IVR | AF | — | 29,42 | — | H | Yes | — | 3 months | — | Daily | 51 words | — | Reminder information was sent securely to Memotext¹ | |
| ATCS Plus¹ | AF, CF, SF | — | 9,10,42 | Yes | P | Yes¹ | Yes | 6 months | — | Biweekly | — | — | Password and log‐in | |
| ATCS Plus¹ | AF, SF | CBT, SCT, MI, SRT, SCL, RP | 3,12, 20,27, 34, 39 | Yes | P | Yes | — | 24 months | — | Twice daily then biweekly¹ for 6 weeks | — | Personal pronouns and active voice | — | |
| ATCS Plus | AF, CF | — | 20, 42 | Yes | P | Yes | Yes | 12 months | — | Daily | — | — | PIN² | |
| ATCS Plus | AF, CF | — | 3 | — | H | Yes | Yes | 4 months | — | — | — | — | — | |
| ATCS Plus | AF, CF | — | 20, 42 | Yes | P | Yes | Yes | 6 months | — | Daily | — | — | — | |
| ATCS Plus | AF, SF | — | 21 | Yes | H | Yes | — | 1 month | 4 weeks | Biweekly | — | — | — | |
| IVR | AF | — | 1,42 | — | H | — | — | 12 months | 5 min¹ | 1 | — | — | — | |
| ATCS Plus | AF, CF | — | 3, 27, 39 | Yes | H | Yes | — | 6 months | — | — | — | — | — | |
| ATCS Plus | AF, CF | — | 29,42 | — | H | Other | — | 12 months | — | ≤ 3 | — | — | — | |
| ATCS Plus | AF, CF | TTM, SCT, PST | 3,10 | Yes | E | — | — | 3 months | 15‐30 s² | Twice daily | — | — | — | |
| IVR | AF | TTM, SCT | 1,9 | — | H | — | — | 3 months | 10 min | Weekly | — | Pre‐recorded human speech | — | |
| IVR | AF | HBM¹ | 27, 42 | — | H | Yes | — | 24 months | 69 s | Average ‐ 3 | 224 words | Female voice | Verification³ | |
| IVR | AF | — | 3, 18, 20, 40, 42 | Yes | P | Yes | — | 2 months | — | 3‐day call², weekly | — | — | Password protected⁴ | |
| ATCS Plus | AF, SF | — | 40, 42 | — | H | Yes | Yes | 6 months | 40 s | 1 | 100 words | — | PIN⁵ | |
| ATCS Plus | AF, SF | — | 40, 42 | — | H | — | Yes | 3 months | 40 s | 1 | — | — | — | |
| Unidirectional | AF | — | 40 | No | H | — | — | 1 months | — | 1 | — | — | — | |
| Unidirectional | AF | — | 42 | No | H | — | — | 36 months | — | 1³ | — | — | — | |
| Unidirectional¹ | AF | TTM | 9,10,40 | — | H | — | — | 10 months | — | — | Approx 30 words | Nurse | — | |
| IVR | AF | — | 42 | — | H | — | — | 2 weeks | — | 1‐2 attempts | — | — | — | |
| IVR | AF | TTM | 20, 39 | Yes | P | Yes | Yes | 34 weeks | 5 min | — | — | Professional | Password protected⁴, PIN² | |
| IVR | AF | — | 3, 9 | Yes | — | — | — | 3 months | 1‐10 min³ | Weekly | — | — | — | |
| ATCS Plus | AF, CF | GM | 2, 3, 9, 15, 20 | — | E | — | — | 12 months | — | 10 | — | — | — | |
| IVR | AF | — | 3, 6, 20, 30, 39, 42 | Yes | E | Yes | Yes | 6 months | 30‐90 min² | Monthly | — | Female voice actor | Password protected⁴ | |
| IVR | AF | — | 39, 42 | — | — | — | — | 25 days | — | — | — | — | PIN⁶ | |
| ATCS Plus¹ | AF, CF | — | 20,42 | — | H | — | — | 26 weeks | — | Up to 4 | — | — | — | |
| Unidirectional | AF | — | 29,30 | — | H | — | — | 12 months | — | 2 | — | — | — | |
| Unidirectional | AF | — | 40,42 | No | H | — | — | — | — | — | — | — | — | |
| IVR | AF | SCT | 21, 32, 35, 39 | — | E | Yes | Yes | 6 months | 4 min | Weekly | — | — | Password protected⁴ | |
| IVR | AF | — | 3,16 | — | E | Other | — | 9 months | — | 12 | — | — | — | |
| IVR | AF | — | 1, 10, 20, 21, | Yes | — | — | — | 6 months | 15 min | Weekly | — | — | — | |
| IVR | AF | HBM | 3, 7, 20, 21, 42 | — | H | — | — | 12 months | > 1 min | Daily | — | Trained actor | PIN⁷ | |
| IVR | AF | — | 16 | — | H | Yes | — | — | — | — | — | — | — | |
| ATCS Plus | AF, SF | BT | 34 | — | E | Yes | — | 3 months | 8.6 min¹ | 12 | — | — | — | |
| ATCS Plus | AF, CF | HBM, SMP | 3, 7, 27, 30, 40 | — | H | — | — | 6W | — | 1 | — | — | — | |
| ATCS Plus | AF, CF, SF | — | 21, 40, 42 | Yes | H | — | — | 4 months | — | Daily, 4⁴ | — | — | — | |
| Unidirectional | AF | — | 20,42 | — | H | — | — | 1 month | — | — | 80 words | — | — | |
| ATCS Plus | AF, CF, SF | MI | 9,12 | Yes | P | — | Yes | 12 months | 60 days | Daily | 1‐3 min | — | — | |
| ATCS Plus | AF,CF | — | 20,34 | Yes | P | Yes | Yes | 6 months | 2 min | Daily | — | — | — | |
| ATCS Plus¹ | AF, CF | — | 20,42 | — | H | — | — | 25 weeks | 25 s | Up to 4 | — | — | — | |
| Unidirectional | AF | — | 16 | — | H | — | — | 3 months | 1 min | Monthly | 2 30‐s scripts | — | — | |
| ATCS Plus | AF, CF | — | 16 | — | H | — | — | 3 months | 4‐5 min | 1 | — | — | — | |
| ATCS Plus¹ | AF, CF | — | 20,42 | — | H | — | — | 12 months | — | Monthly⁵ | — | — | — | |
| IVR | AF | — | 21 | Yes | P | Yes | Yes | 26 months | — | Weekly | 45 s of speaking | — | PIN² | |
| IVR | AF | TTM, SCT | 4,20,21 | Yes | H | — | — | 6 months | 4.12 min | Weekly | 12.4 calls¹ | Digitised | — | |
| IVR | AF | — | 20, 39, 42 | — | E | Yes | — | 6 months | — | Daily | — | — | — | |
| ATCS Plus | AF, CF | SCT | 20, 39, 42 | — | E | Yes | — | 6 months | 2‐3 min | Biweekly | — | — | — | |
| IVR | AF | TTM | 7, 9, 20, 39 | Yes | P | Yes | — | 3 months | — | Weekly | — | — | Password protected⁴ | |
| ATCS Plus | AF,CF, SF | — | 16,21,30 | — | E | — | — | 6 months | — | Daily | — | — | — | |
| ATCS Plus | AF, SF | — | 20 | Yes | H | Yes | — | 3 months | — | 2.2/week | 26 calls¹ | Female voice | — | |
| ATCS Plus | AF, CF | — | 20,29,30 | — | H | — | — | 12 months | ≤ 10 min | Weekly | — | — | — | |
| IVR | AF | SCT, TTM | 3, 9, 20, 39 | Yes | H | Yes | — | 12 months | 10‐15 min | Weekly⁶ | — | — | — | |
| ATCS Plus¹ | AF, CF | TCM | 39 | — | E | — | — | 12 months | — | Biweekly, weekly, bimonthly, monthly⁷ | — | — | — | |
| ATCS Plus¹ | AF, CF | — | 21,39 | — | H | — | — | 12 months | — | Weekly⁸ | — | — | — | |
| ATCS Plus | AF, CF, SF | — | 20,21,42 | — | E | Yes | — | 12 months | — | Monthly | 18 questions | — | — | |
| IVR | AF | — | 39 | No | P | Yes | — | 24 months | 48 s¹ | Weekly | — | — | — | |
| ATCS Plus | AF, SF | — | 40, 42 | — | H | — | — | 24 months | — | — | — | — | — | |
| IVR | AF | — | 20,42 | Yes | H | Yes | — | 2 weeks | — | — | 3 segments | Personalised voice messages | — | |
| IVR | AF | — | 42 | — | H | — | — | 4 months | 96.8 s | — | — | — | — | |
| Unidirectional | AF | — | 42 | — | H | — | — | 5 months | — | Monthly | — | — | — | |
| Unidirectional | AF | — | 42 | — | H | — | — | 5 months | — | 2/d⁹ | — | — | — | |
| ATCS Plus | AF,SF | CBT | 3,20,34,38 | — | H | Yes | — | 12 weeks | 2.5 min | 8/d¹⁰ | — | — | — | |
| ATCS Plus | AF, CF | — | 21 | — | — | — | — | 15 months | 90 s | Monthly | — | — | — | |
| ATCS Plus¹ | AF, CF | — | 20, 21, 25, 42 | Yes | P | Yes | — | 6 months | 5‐10 min | Weekly | — | — | — | |
| ATCS Plus | AF, SF | PT, PM | 3, 13, 25, 39, 42 | Yes | P | Yes | Yes | 18 months | 18 min | — | 22 h/d² | Professional radio announcer | Password protected⁴ | |
| Unidirectional | AF | — | 40 | No | H | — | — | 2 months | — | — | — | — | — | |
| IVR | AF | — | 20, 21, 25, 34, 42 | — | H | Other | — | 24 months | 3‐5 min | Biweekly | — | — | — | |
| IVR | AF | SCT, TTM, MI | 25, 39 | Yes | — | Yes | Yes | 8 months | — | Weekly | — | African – American voice professionals | — | |
| ATCS Plus | AF, SF, CF | — | 21 | — | P | Yes | Yes | 1.5 months | 5.18 min¹ | Daily | — | — | Personalised password | |
| ATCS Plus | AF, SF | CBT | 17,34,38 | Yes | H | Yes | — | 1 month | 9.3 min¹ | Daily | — | — | — | |
| Unidirectional¹ | AF | SCT, TTM | 9, 10, 20, 25, 39 | — | H | — | — | 12 months | — | Monthly | Approx 60 words | Primary care provider | — | |
| Unidirectional¹ | AF | SCT, TTM | 9, 10, 20, 25, 39 | — | H | — | — | 12 months | — | Monthly | Approx 60 words | Primary care provider | — | |
| IVR | AF | — | 27, 42 | — | H | Yes | Yes | 6 months | 1 min | 3 | — | — | — | |
| IVR | AF | — | 25, 39 | — | H | — | — | 1 month | — | — | — | — | Correspondence with the author: "Upon answering a call, patients are required to authenticate with their date of birth." | |
| ATCS Plus | AF, CF, SF | CBT | 4,20,34,38 | Yes | E | — | Yes | 6 months | 9.2 min | Daily | — | — | Valid ID number and a personally | |
| Unidirectional | AF | — | 29 | Yes | H | — | — | 2 months | — | At least every 3 days | Every hour for 2 consecutive hours | Community health worker | — | |
| IVR | AF | CBT | 3, 16, 20, 22, 25, 39, 42 | Yes | P | — | Yes | 4 months | 3‐16 min | Daily | — | Experienced therapist | — | |
| Unidirectional | AF | — | 42 | — | H | — | — | 24 months | — | Daily | — | First author | — | |
| IVR | AF | — | 40 | — | H | — | — | 4 months | — | — | — | — | — | |
| IVR | AF | — | 39, 42 | — | — | — | — | 6 months | — | 3 | — | — | — | |
| ATCS Plus | AF, SF | CBT, TTM, MI | 9, 0, 12, 20, 21 | — | H | Yes | — | 2 months | 18.9 min^^ | Biweekly weeks 1‐3, weekly weeks 4‐6, no call week 7, weekly week 8‐9 | 8.61²,³ | — | — | |
| IVR | AF | — | 29, 30 | — | H | — | — | 3.5 months | — | up to 5 times | — | — | — | |
| ATCS Plus | AF, CF | SCT | 3, 18, 21, 25, 39 | No | E | Yes | Yes | 24 months | 1‐8 min² | Biweekly¹¹ | — | Human voice | PIN² | |
| ATCS Plus | AF, CF | SCT | 3, 18, 21, 25, 39 | — | H | Yes | — | 12 months | 1‐8 min² | Biweekly¹¹ | — | — | — | |
| ATCS Plus | AF, CF | — | 13, 20, 21, 39 | Yes | — | Yes | Yes | 1.5 months | ≤ 9 min | Weekly | — | Native speaker | — | |
| ATCS Plus | AF, SF | DMT, SCT, TTM | 3, 19, 20, 32 | Yes | P | Yes | — | 6 months | 10 min | Weekly (first 3 months), and at least biweekly thereafter | — | Digitised | — | |
| Unidirectional | AF | — | 39, 40 | No | H | — | — | — | — | — | — | Receptionist | — | |
| ATCS Plus | AF, CF | — | 20, 42 | — | H | — | — | 3 months | — | — | — | — | — | |
| ATCS Plus | AF, CF | — | 3, 9, 13, 39, 40, 42 | — | H | — | — | 12 months | 1‐20 min⁵ | 3 | — | — | — | |
| ATCS Plus | AF, CF | — | 20, 42 | — | — | — | — | 12 months | — | 8 | — | — | — | |
| IVR | AF | — | 42 | — | P | — | — | — | — | — | — | — | — | |
| ATCS Plus | AF, CF, SF | — | 13, 34 | — | H | — | Yes | 6 months | — | 5 times¹² | — | — | — | |
| ATCS Plus | AF, CF, SF | CBT | 4, 20, 34, 38 | Yes | P | — | — | 4 months | — | Daily | — | — | — | |
| IVR | AF | MI | 9, 12 | — | H | Other | — | 6 months | — | ≤ 26 calls over 13 weeks | — | — | — | |
| ATCS Plus | AF, CF | CCM, SCT | 1, 3, 9, 10, 13, 20, 21, 35, 39 | — | E | Yes | Yes | 12 months | 6‐12 min | Weekly | — | — | — | |
| ATCS Plus | AF, CF | — | 27, 39, 42 | — | H | — | — | 6 months | — | 11 | — | — | Password protected⁴ | |
| IVR¹ | AF | TPB | 16,20 | — | H | — | — | 24 months | — | Weekly | — | — | — | |
| IVR | AF | — | 17, 20, 42 | — | H | Other | — | 6 weeks | — | 3 calls 6 weeks apart | 12 questions; 397 words | Digitally | — | |
| IVR | AF | — | 17, 20, 30, 39, 40 | — | H | Yes | — | 2 months | — | Weekly¹³ | — | Female voice | — | |
| IVR | AF | GMDBC, Others² | 3, 27, 39 | Yes | E | — | — | 3 months | 2‐6 min | — | — | — | Verification | |
| ATCS Plus | AF, CF | — | 30, 42 | No | H | No | — | 12 months | — | 3¹⁴ | — | Human voice | — | |
| IVR | AF | — | 20 | Yes | P_H | Yes | Yes | 1 months | — | Daily | — | — | — | |
| ATCS Plus¹ | AF, CF | — | 16 | — | H | — | Yes | — | — | — | — | Female voice | — | |
| IVR | AF | SCT, MI | 3, 12, 17, 20, 25, 39, 40, 42 | — | E | Yes | — | 12 months | — | Weekly then monthly¹⁵ | — | — | Password protected⁴ | |
| IVR | AF | SCT | 3, 12, 17, 20, 25, 39, 40, 42 | Yes | E | Yes | — | 12 months | — | Weekly then monthly¹⁵ | — | — | Password protected⁴ | |
| ATCS Plus | AF, CF | CBT | 2, 20 | Yes | H | Yes | — | 2 months | — | Weekly | — | — | — | |
| ATCS Plus | AF, SF | HBM, CCM, SCT, TTM, MI, SRT, RL | 2, 3, 20, 32, 39 | — | H | — | Yes | 6 months | — | 3 | — | — | — | |
| Unidirectional | AF | — | 42 | — | H | — | — | 1 month | — | 1³ | — | Human voice | — | |
| IVR¹ | AF | — | 9, 10, 42 | Yes | P | Yes | — | 3 months | — | Daily/2 weeks; weekly/10 weeks | 25 calls | Female voice | — | |
| Unidirectional | AF | — | 42 | — | H | — | — | 18 months | — | Weekly | — | — | — | |
| Unidirectional | AF | — | 42 | — | H | — | — | 12 months | — | — | — | — | — | |
| Unidirectional | AF | HBM | 7*, 39, 40, 42 | No | H | — | — | — | — | 1¹⁶ | — | Female using native languages | — | |
| Unidirectional | AF | HBM | 39, 40, 42 | No | H | — | — | — | — | 1¹⁶ | — | Female using native languages | — | |
| IVR | AF | BET | 9, 20, 25, 34 | Yes | — | — | — | 6 months | ≤ 5 min | Daily | — | — | PIN⁶ | |
| ATCS Plus | AF,SF | — | 10 | — | — | — | — | 3 months | — | 3/week | — | — | — | |
| IVR¹ | AF | TTM | 4, 13, 20, 34, 38 | — | E | Yes | — | 6 months | 15‐20 min | Weekly¹⁷ | — | — | — | |
| ATCS Plus | AF, CF | — | 39 | — | H | Other | — | 10 months | < 10 min | 3¹⁸ | — | — | — | |
| ATCS Plus | AF, CF | — | 20, 42 | — | H | Other | Yes | 18 months | 2‐3 min | — | — | — | — | |
| ATCS Plus | AF, CF, SF | — | 20, 42 | Yes | H | Other | Yes | 12 months | 2‐3 min | Monthly | — | — | — | |
| IVR | AF | — | 3, 21, 39 | Yes | P | Yes | Yes | 6 months | 5‐20 min | Weekly | — | — | PIN⁶ | |
| IVR | AF | SCT | 2, 9, 10 | No | P | Other | — | 3 months | — | Biweekly | — | Synthetic speech | — | |
| IVR | AF | — | 21, 40 | — | H | Yes | — | 6 months | — | Biweekly | — | — | — | |
| ATCS Plus | AF, SF | — | 21, 40 | — | P | Yes | — | 3 months | — | Weekly | — | — | PIN | |
| Unidirectional | AF | SCT | 4,13 | — | — | — | — | — | — | — | — | — | — | |
| a ATCS ¹For more detailed evaluation of multimodal/complex interventions, please refer to Table 4. b Content delivery: AF: automated functions; CF: communicative functions; SF: supplementary functions. d Behaviour change techniques: 1 ‐ action planning; 2 ‐ agree behavioural contract; 3 ‐ barrier identification/problem solving; 4 ‐ emotional control training; 5 ‐ environmental restructuring; 6 ‐ facilitate social comparison; 7 ‐ fear arousal; 8 ‐ general communication skills training; 9 ‐ goal setting (behaviour); 10 ‐ goal setting (outcome); 11 ‐ model/demonstrate the behaviour; 12 ‐ motivational interviewing; 13 ‐ plan social support/social change; 14 ‐ prompt anticipated regret; 15 ‐ prompt identification as a role model/position advocate; 16 ‐ prompt practice; 17 ‐ prompt review of behavioural goals; 18 ‐ prompt review of outcome goals; 19 ‐ prompt self talk; 20 ‐ prompt self‐monitoring of behaviour; 21 ‐ prompt self‐monitoring of behavioural outcome; 22 ‐ prompt use of imagery; 23 ‐ prompting focus on past success; 24 ‐ prompting generalisation of a target behaviour; 25 ‐ provide feedback on performance; 26 ‐ provide information about other's approval; 27 ‐ provide information on consequences of behaviour in general; 28 ‐ provide information on consequences of behaviour to the individual; 29 ‐ provide information on where and when to perform the behaviour; 30 ‐ provide instruction on how to the perform the behaviour; 31 ‐ provide normative information about others' behaviour; 32 ‐ provide rewards contingent on effort or progress towards behaviour; 33 ‐ provide rewards contingent on successful behaviour; 34 ‐ relapse prevention/coping planning; 35 ‐ set graded tasks; 36 ‐ shaping; 37 ‐ stimulate anticipation of future rewards; 38 ‐ stress management; 39 ‐ tailoring; 40 ‐ teach to use prompts/cues; 41 ‐ time management; 42 ‐ use of follow up prompts. e Caller: E ‐ either participant or healthcare provider/researcher; H ‐ healthcare provider/researcher; P ‐ participant; P_H ‐ If P fails to call then H calls. f Telephone keypad for response: the calls were made using speech recognition (or speech‐enabled) technology; ¹‐ both data entry via Web screen or voice or telephone keypad. g Duration of calls h Frequency i Intensity j Security arrangement | ||||||||||||||
| Assessment levels and criteria for each dimension | Study | Assessment of the intervention (a‐d)/description of the intervention/justification | Control (or usual care) |
| Core dimension 1: active components included in the intervention compared with the control | |||
| a. More than 1 component and delivered as a bundle b. More than 1 component c. 1 component | (a.) A mailed reminder letter, a free faecal immunochemical test, an automated telephone and text message reminding them that they were due for screening and that a faecal immunochemical test was being mailed to them, an automated telephone and text reminder 2 weeks later for those who did not return the faecal immunochemical test, and personal telephone outreach by a colorectal cancer screening navigator after 3 months | (b.) Usual care included computerised reminders, | |
| (a.) Behaviour change goals, self‐monitoring via IVR phone calls, tailored skills training materials, monthly interpersonal counselling calls, and a 12‐month gym membership. | (b.) Control group received + newsletters that covered general wellness topics but did not discuss weight, nutrition, or physical activity | ||
| (a.) Internet‐ and telephone‐based telemedicine system + automatically generated emails or telephone calls as reminders + sphygmomanometer, a weighting scale (if needed), a pedometer and instructions on their use | (c.) Control group received usual care | ||
| (a.) Email, webpages, IVR and short message service (SMS) + craving helpline | (c.) Control group received self‐help (booklet) | ||
| (a.) 10 personal phone calls from the nurse interspersed randomly with 10 automated phone calls + clinic‐based activity counselling | (b.) Clinic‐based activity counselling + no calls | ||
| (b.) Clinician prompt, patient prompts, patient outreach consisting of 2 personalised letters which also include testing kits for colorectal cancer and up to 4 ATCS calls over 26 weeks | (c.) The clinician was responsible for discussing cancer screening with the patients and for initiating any referral or for handing out faecal occult blood testing cards over 12 months | ||
| (b.) Letters, ATCS calls, a point‐of‐care prompt and mailing of a home colorectal cancer testing kit; and medical record reviews at week 12 | (c.) Usual care received blinded chart review | ||
| (b.) Medication reconciliation and tailoring, patient education (provided through automated voice messages and pharmacist telephone calls when requested by the patient), collaborative care between pharmacists and providers (primary care providers or cardiologists), and voice messaging reminders (educational and medication refill reminder calls). | (c.) Usual care received standard hospital discharge instructions e.g., numbers to call, follow‐up appointments, diet and exercise advice, a discharge medication list, and educational information about cardiac medications | ||
| (a.) Symptom monitoring by a nurse + automated monitoring either via IVR or by Internet + medications (analgesics, antidepressants) | (c.) Usual care from oncologist | ||
| (a.) Symptom monitoring, either via IVR or by Internet + nurse care + stepped care with analgesics | (c.) Usual care from primary care physician | ||
| (b.) Patient education, home blood pressure monitoring, home blood pressure measurement reporting to an ATCS, and clinical pharmacist management of hypertension with physician oversight + usual care | (c.) The control group received usual care | ||
| (b.) Baseline in‐person and biweekly then monthly telephone counselling by a lifestyle counsellor, one‐time clinical endorsement of physical activity and monthly automated telephone messaging by primary care provider, and quarterly tailored mailings of progress in physical activity. | (c.) Patients in the control group received usual care | ||
| (b.) 1 in‐person baseline counselling session, regular telephone counselling, physician endorsement in clinic with monthly ATCS calls encouragement, and tailored mailed materials, plus a consult to a Veterans Affairs (VA) weight management program. | (b.) Patients in the control group received usual care + MOVE | ||
| (b.) An IVR call once a week + a weekly non‐interactive neutral pictorial message sent out as a reminder 4 days after the IVR call + usual care | (b.) Usual care included up to 3 counselling sessions + antiretroviral treatment | ||
| (b.) Education and reminders delivered to primary care physicians + mailings and ATCS | (c.) The control group received no education | ||
| (b.) Treatment team education and patient self‐care education, nurse telephone call and IVR program | (c.) Treatment team education and patient self‐care education | ||
| (a.) Automated counselling plus nicotine replacement therapy, manuals, and expert system (TEL + EXP + NRT + MAN) | (c.) The control group received stage (of change) matched manuals | ||
| Core dimension 2: behaviours or actions of intervention recipients or participants to which the intervention is directed | |||
| a. Single target b. Dual target c. Multitarget d. Variesa | (a.) Single target: colorectal cancer screening | (a.) Single target: colorectal cancer screening | |
| (a.) Single target: weight management | (a.) Single target: weight management | ||
| (c.) Single target: diet, exercise, smoking and blood pressure control | (a.) Single target: blood pressure control | ||
| (a.) Single target: smoking abstinence | (a.) Single target: smoking abstinence | ||
| (c.) Multiple target: physical activity; BMI; mobility; quality of life | (c.) Multiple target: physical activity; BMI; mobility; quality of life | ||
| (b.) Dual target: breast cancer and colorectal cancer screening | (b.) Dual target: breast cancer and colorectal cancer screening | ||
| (b.) Dual target: breast cancer and colorectal cancer screening | (b.) Dual target: breast cancer and colorectal cancer screening | ||
| (c.) Medication adherence, blood pressure, blood lipid levels | (c.) Medication adherence, blood pressure, blood lipid levels | ||
| (b.) Dual target: pain and depression management | (b.) Dual target: pain and depression management | ||
| (a.) Single target: musculoskeletal pain management | (a.) Single target: musculoskeletal pain management | ||
| (b.) Dual target: blood pressure monitoring and blood pressure measuring | (b.) Dual target: blood pressure monitoring and blood pressure measuring | ||
| (c.) Multitarget: improving gait speed, self‐reported physical activity, function and disability | (c.) Multitarget: improving gait speed, self‐reported physical activity, function and disability | ||
| (c.) Multitarget: improving blood sugar indices, anthropometric measures, and self‐reported physical activity, health‐related quality of life, and physical function | (c.) Multitarget: improving blood sugar indices, anthropometric measures, and self‐reported physical activity, health‐related quality of life, and physical function | ||
| (a.) Single target: antiretroviral treatment medication adherence | (a.) Single target: antiretroviral treatment medication adherence | ||
| (a.) Single target: osteoporosis screening | (d.) Varies | ||
| (a.) Single target: antidepressant medication adherence | (a.) Single target: antidepressant medication adherence | ||
| (a.) Single target: smoking abstinence | (a.) Single target: smoking abstinence | ||
| Core dimension 3: organisational levels and categories targeted by the intervention | |||
| a. Multilevel b. Multicategory c. Single category | (c.) Intervention directed only at single category of individuals within the individual level: patients past due for colorectal cancer screening | (c.) Intervention directed only at single category of individuals within the individual level: patients past due colorectal cancer screening | |
| (c.) Intervention directed only at single category of individuals within the individual level: obese females of Black ethnic origin | (c.) Obese females of black ethnic origin | ||
| (c.) Intervention directed only at single category of individuals within the individual level: subjects with elevated blood pressure | (c.) Intervention directed only at single category of individuals within the individual level: subjects with elevated blood pressure | ||
| (c.) Intervention directed only at single category of individuals within the individual level: tobacco smokers | (c.) Tobacco smokers | ||
| (c.) Sedentary primary care patients | (c.) Sedentary primary care patients | ||
| (c.) Intervention directed only at single category of individuals within the individual level: patients past due recommended screening | (c.) Patients past due recommended screening | ||
| (c.) Intervention directed only at single category of individuals within the individual level: patients past due recommended screening | (c.) Patients past due recommended screening | ||
| (c.) Intervention directed only at single category of individuals within the individual level: patients after hospitalisation for acute coronary syndrome | (c.) Intervention directed only at single category of individuals within the individual level: patients after hospitalisation for acute coronary syndrome | ||
| (c.) Intervention directed only at single category of individuals within the individual level: cancer patients with depression and pain | (c.) Cancer patients with depression and pain | ||
| (c.) Intervention directed only at single category of individuals within the individual level: patients with musculoskeletal pain | (c.) Patients with musculoskeletal pain | ||
| (c.) Intervention directed only at single category of individuals within the individual level: patients with hypertension | (c.) Patients with hypertension | ||
| (c.) Intervention directed only at single category of individuals within the individual level: sedentary (otherwise healthy) older adults | (c.) Intervention directed only at single category of individuals within the individual level: sedentary (otherwise healthy) older adults | ||
| (c.) Intervention directed only at single category of individuals within the individual level: older adults at risk of diabetes mellitus | (c.) Intervention directed only at single category of individuals within the individual level: older adults at risk of diabetes mellitus | ||
| (c.) Intervention directed only at single category of individuals within the individual level: patients with HIV | (c.) Intervention directed only at single category of individuals within the individual level: patients with HIV | ||
| (b.) Intervention directed at 2 or more categories of individuals within the individual level: primary care physicians and their patients at‐risk of osteoporosis | (b.) Control intervention directed at 2 or more categories of individuals within the individual level: primary care physicians and their patients at‐risk of osteoporosis | ||
| (c.) Intervention directed only at single category of individuals within the individual level: patients with depression | (c.) Intervention directed only at single category of individuals within the individual level: patients with depression | ||
| (c.) Intervention directed only at single category of individuals within the individual level: tobacco smokers | (c.) Tobacco smokers | ||
| Core dimension 4: the degree of tailoring intended or flexibility permitted across sites or individuals in intervention implementation/application | |||
| a. Fully tailored/flexible b. Moderately tailored/flexible c. Inflexible d. Variesa | (b.) Moderately tailored/flexible: a mailed reminder letter, a free faecal immunochemical test, an automated telephone and text message reminder, an automated telephone and text reminder 2 weeks later (inflexible); personal telephone outreach (flexible) | (b.) Moderately tailored/flexible: computerised reminders, standing orders to give patients home faecal immunochemical test (inflexible); clinician feedback on colorectal cancer screening rates (flexible) | |
| (b.) Moderately tailored/flexible: self‐monitoring via IVR phone calls (inflexible); behaviour change goals, tailored skills training materials, monthly interpersonal counselling calls, and a 12‐month gym membership (flexible) | (c.) Newsletters sent were inflexible | ||
| (c.) Telemedicine system, reminders, sphygmomanometer, weighting scale and pedometer have all been standardised | (d.) Varies across interventions included in the review | ||
| (c.) E‐mail, web‐pages, IVR and SMS inflexible; quote: "Early in the morning, the user receives an e‐mail with instructions to open the day's web page. Each day for 6 weeks, the client opens a web page that is unique to that particular programme day." | (c.) Quote: "The booklet contains general cessation information, a 48‐day quit calendar, a 10‐day quit log, the telephone number of the national quit‐line and links to relevant and open on‐line tobacco cessation | ||
| (b.) Moderately tailored/flexible: nurse used a semi‐standardised protocol. | (d.) Varies across interventions included in the review | ||
| (c.) Clinician prompt, patient prompts, patient outreach all have been highly standardised | (b.) Discussions with patients were moderately tailored/flexible | ||
| (c.) Letters, ATCS calls, point‐of‐care prompts and blinded chart reviews all have been highly standardised | (c.) Blinded chart reviews have been highly standardised | ||
| (b.) Moderately tailored/flexible: medication reconciliation and tailoring, patient education, collaborative care between pharmacists and providers (flexible); and voice messaging reminders (inflexible) | (b.) Usual care was moderately tailored/flexible | ||
| (c.) Nurse care (using evidence‐based guidelines) and IVR monitoring and medications (all not flexible) | (d.) Varies across interventions included in the review | ||
| (c.) Symptom monitoring, either via IVR or by Internet, nurse care and stepped care with analgesics (not flexible) | (d.) Varies across interventions included in the review | ||
| (b.) Patient education, home blood pressure monitoring, home blood pressure measurement reporting to an ATCS (not flexible); and clinical pharmacist management of hypertension with physician oversight (flexible) | (d.) Varies across interventions included in the review | ||
| (b.) Moderately tailored/flexible: quote: "Providers were encouraged to modify the script to suit their personal style." | (d.) Varies across interventions included in the review | ||
| (b.) Moderately tailored/flexible: baseline counselling, regular telephone counselling, physician endorsement in clinic with monthly ATCS calls encouragement, and tailored mailed materials, plus a consult to a Veterans Affairs (VA) weight management programme | (d.) Varies across interventions included in the review | ||
| (c.) An IVR call once a week + a weekly non‐interactive neutral pictorial message sent out as a reminder 4 days after the IVR call + usual care (inflexible) | (c.) Usual care counselling sessions + antiretroviral treatment (inflexible) | ||
| (b.) An advance letter, an ATCS call, and the opportunity to schedule a bone mineral density test (not flexible); specially trained pharmacists educated physicians (flexible). | (d.) Varies across interventions included in the review | ||
| (b.) Moderately tailored/flexible: treatment team education and patient self‐care education, nurse telephone call and IVR programme | (b.) Moderately tailored/flexible: treatment team education and patient self‐care education, nurse telephone call | ||
| (b.) Automated counselling plus nicotine replacement therapy, manuals, and expert system were all moderately tailored/flexible | (c.) Stage‐based self‐help manuals were inflexible | ||
| Core dimension 5: the level of skill required by those delivering the intervention | |||
| a. High level skills b. Intermediate level skills c. Basic skills d. Variesa | (b.) Intermediate level skills required in setting up the IVR phone calls and text reminders, providing outreach calls | (b.) Intermediate level skills required in providing feedback on colorectal cancer screening rates | |
| (b.) Intermediate level skills required in delivering behaviour change goals, setting up the IVR phone calls, producing tailored skills materials and monthly interpersonal counselling calls | (c.) No specialised skills required in writing the newsletter | ||
| (b.) Intermediate level skills required in reviewing patients' reports (physicians), motivating patients (nurses), setting up the reminder calls, emails | (c.) No specialised skills required in providing usual care | ||
| (a.) Creating/writing emails, web‐pages, IVR and SMS requires high level skills | (c.) No specialised skills required in writing the booklet | ||
| (b.) Intermediate level skills required in prerecording automated telephone messages | (d.) Varies across interventions included in the review | ||
| (b.) Intermediate level skills required in e.g. prerecording automated telephone reminders | (c.) No specialised skills required in discussing breast cancer/colorectal cancer screening | ||
| (b.) Intermediate level skills required in e.g. prerecording automated telephone reminders | (c.) No specialised skills required in reviewing charts | ||
| (b.) Intermediate level skills required in e.g. educating patients and/or prerecording telephone reminders | (c.) No specialised skills required in providing usual care | ||
| (b.) Intermediate level skills required from nurses to manage pain and depression | (b.) Intermediate level skills required from nurses to manage pain and depression | ||
| (b.) Intermediate level skills required from nurses to manage musculoskeletal pain | (c.) Basic skills required from primary care physicians | ||
| (b.) Intermediate level skills required from pharmacists and physicians to manage hypertension | (d.) Varies | ||
| (b.) Intermediate level skills required from primary care providers in e.g., recording automated messages, counselling and consulting patients | (c.) Basc level skills required from primary care providers | ||
| (b.) Intermediate level skills required from primary care providers in recording automated messages, counselling and consulting patients | (b.) Intermediate level skills required from primary care providers in providing MOVE | ||
| (b.) Intermediate level skills required in setting up the IVR phone calls + pictorial messages | (c.) Basic skills required | ||
| (a.) Extensive specialised skills required: "The visits were conducted by specially trained pharmacists . . . These pharmacists also underwent a 1‐ day training program focused on osteoporosis and conducted by 2 of the study authors. This program included lectures on the epidemiology, diagnosis, and treatment of osteoporosis. Also, it reviewed principles of academic detailing and the specific goals of this intervention." | (d.) Varies | ||
| (b.) Intermediate level skills required in e.g., prerecording IVR calls | (c.) Basic skills required in delivering education and nurse calls | ||
| (b.) Intermediate level skills required in recording automated messages, providing feedback reports | (c.) Basic skills required | ||
| Core dimension 6: the level of skill required for the targeted behaviour when entering the study by those receiving the intervention in order to meet the intervention's objectives | |||
| a. High level skills b. Intermediate level skills c. Basic skills d. Variesa | (c.) No specialised skills required | (c.) No specialised skills required | |
| (c.) No specialised skills required | (c.) No specialised skills required | ||
| (b.) Intermediate level skills required. Quote: "subjects were trained on use of a computer and the Internet and were introduced to the Web site at the research centre. Telemedicine subjects received instructions on use of an optional telephone communication system". They also received instructions on the use of sphygmomanometer, weighting scale and pedometer | (c.) No specialised skills required | ||
| (b.) Access to the Internet, email and a cell phone on a daily basis was required | (c.) No specialised skills required | ||
| (c.) No specialised skills required | (c.) No specialised skills required | ||
| (c.) No specialised skills required | (c.) No specialised skills required | ||
| (c.) No specialised skills required | (c.) No specialised skills required | ||
| (c.) No specialised skills required | (c.) No specialised skills required | ||
| (c.) No specialised skills required | (c.) No specialised skills required | ||
| (c.) No specialised skills required | (c.) No specialised skills required | ||
| (b.) Patients were instructed about use of the ATCS, and trained on using an electronic blood pressure cuff | (d.) Varies across interventions included in the review | ||
| (d.) Varies across interventions included in the review | (c.) No specialised skills required | ||
| (d.) Varies across interventions included in the review | (c.) No specialised skills required | ||
| (c.) No specialised skills required | (c.) No specialised skills required | ||
| (c.) No specialised skills required | (c.) No specialised skills required | ||
| (c.) No specialised skills required | (c.) No specialised skills required | ||
| (c.) No specialised skills required | (c.) No specialised skills required | ||
| Core dimension 7: the degree of interaction between intervention components/the independence/interdependence of intervention components | |||
| a. High level interaction d. Variesa e. Unclear or unable to assess | (a.) High level interaction; quote: "The majority of faecal occult blood testing completions were accomplished with | (d.) Varies across interventions included in the review | |
| (b.) Moderate level of interaction; quote: "comprised 5 mutually reinforcing components" | (e.) Unclear or unable to assess in individuals receiving usual care | ||
| (b.) Moderate level of interaction of the intervention components: the automated calls and emails and the use of sphygmomanometer to measure blood pressure, weighting scale and pedometer to promote physical activity | (e.) Unclear or unable to assess in patients receiving usual care | ||
| (a.) High level interaction; quote: "further research is necessary to detect the active intervention | (c.) Independent | ||
| (a.) High level interaction; a synergistic effect has been observed | (e.) Unclear or unable to assess in patients receiving no calls | ||
| (a.) High level interaction; quote: "combined interventions are superior to simpler interventions such as reminders" | (c.) Independent | ||
| (a.) There is substantial interaction or inter‐dependency between ATCS calls, a point‐of‐care prompt and mailing of a home colorectal cancer testing kits | (c.) Independent | ||
| (b.) Moderate level of interaction: the intervention components are considered to be mutually reinforcing | (e.) Unclear or unable to assess in patients receiving usual care | ||
| (a.) High level interaction; triggered telephone calls occurred when ATCS monitoring indicated inadequate symptom improvement, non‐adherence to medication, adverse effects, suicidal ideation | (e.) Unclear or unable to assess in patients receiving usual care | ||
| (a.) High level interaction; IVR and nurse calls prompted adjustments in type or dose of analgesics delivered | (e.) Unclear or unable to assess in patients receiving usual care | ||
| (a.) There was a high level interaction between the intervention components: Quote: "This difference was likely due to greater therapy intensification (number and intensity of hypertension medications) in the intervention group" | (e.) Unclear or unable to assess in patients receiving usual care | ||
| (b.) Moderate level of interaction: personal and automatic calls are considered to be mutually reinforcing | (e.) Unclear or unable to assess in patients receiving usual care | ||
| (b.) Moderate level of interaction: personal and automatic calls are considered to be mutually reinforcing | (e.) Unclear or unable to assess in patients receiving usual care | ||
| (c.) The IVR calls and pictorial messages were independent of each other | (e.) Unclear or unable to assess in patients receiving usual care | ||
| (e.) Unable to assess the degree of interaction between physician education and ATCS calls | (e.) Unclear or unable to assess in patients receiving no intervention | ||
| (e.) Unable to assess the degree of interaction between education, nurse calls and IVR calls | (d.) Varies across interventions included in the review | ||
| (c.) Automated calls, nicotine replacement therapy, manuals, and expert system were independent of each other | (e.) Unclear or unable to assess in patients receiving stage‐matched manuals only | ||
| Core dimension 8: the interaction between the intervention and the context or setting | |||
| a. Highly context dependent d. Variesa e. Unclear or unable to assess | (d.) Varies across interventions included in the review | (d.) Varies across interventions included in the review | |
| (e.) Unable to assess the level of interaction between the intervention and the context | (e.) Unable to assess the level of interaction between the intervention and the context | ||
| (e.) Unable to assess the level of interaction between the intervention and the context | (d.) Varies across interventions included in the review | ||
| (e.) Unable to assess the level of interaction between the intervention and the context | (e.) Unable to assess the level of interaction between the intervention and the context | ||
| (e.) Unable to assess the level of interaction between the intervention and the context | (e.) Unable to assess the level of interaction between the intervention and the context | ||
| (d.) Varies across interventions included in the review | (d.) Varies across interventions included in the review | ||
| (d.) Varies across interventions included in the review | (d.) Varies across interventions included in the review | ||
| (d.) Varies across interventions included in the review | (d.) Varies across interventions included in the review | ||
| (e.) Unable to assess the level of interaction between the intervention and the context | (d.) Varies across interventions included in the review | ||
| (e.) Unable to assess the level of interaction between the intervention and the context | (d.) Varies across interventions included in the review | ||
| (d.) Varies across interventions included in the review | (d.) Varies across interventions included in the review | ||
| (d.) Varies across interventions included in the review | (d.) Varies across interventions included in the review | ||
| (d.) Varies across interventions included in the review | (d.) Varies across interventions included in the review | ||
| (e.) Unable to assess the level of interaction between the intervention and the context | (e.) Unable to assess the level of interaction between the intervention and the context | ||
| (e.) Unable to assess the level of interaction between the intervention and the context | (d.) Varies across interventions included in the review | ||
| (e.) Unable to assess the level of interaction between the intervention and the context | (d.) Varies across interventions included in the review | ||
| (e.) Unable to assess the level of interaction between the intervention and the context | (e.) Unable to assess the level of interaction between the intervention and the context | ||
| Core dimension 9: the degree to which the effects of an intervention are modified by factors relating to recipient, provider, or implementation factors | |||
| a. Highly dependent on individual‐level factors d. Variesa e. Unclear or unable to assess | (d.) Varies across interventions included in the review | (e.) Unclear or unable to assess | |
| (b.) Moderately dependent on individual‐level factor, i.e. registered dietitians or personalized progress reports | (e.) Unclear or unable to assess | ||
| (d.) Varies across interventions included in the review | (e.) Unclear or unable to assess | ||
| (c.) Largely independent of individual‐level factors | (c.) Largely independent of individual‐level factors | ||
| (d.) Varies across interventions included in the review | (d.) Varies across interventions included in the review | ||
| (d.) Varies across interventions included in the review | (e.) Unclear or unable to assess | ||
| (d.) Varies across interventions included in the review | (c.) The effects of the blinded chart reviews are not modified substantially by recipient or provider factors | ||
| (d.) Varies across interventions included in the review | (d.) Varies across interventions included in the review | ||
| (b.) Moderately dependent on individual‐level factor, i.e. nurse and pain‐psychiatrist specialist interaction | (e.) Unclear or unable to assess | ||
| (b.) Moderately dependent on individual‐level factor, i.e. nurse management | (e.) Unclear or unable to assess | ||
| (b.) Moderately dependent on individual‐level factor, i.e. clinical pharmacist management with physician oversight | (e.) Unclear or unable to assess | ||
| (e.) Unclear or unable to assess | (e.) Unclear or unable to assess | ||
| (e.) Unclear or unable to assess | (e.) Unclear or unable to assess | ||
| (e.) Unclear or unable to assess | (e.) Unclear or unable to assess | ||
| (b.) The effects of the intervention are modified by one of recipient or factors, e.g. pharmacists' knowledge | (e.) Unclear or unable to assess | ||
| (e.) Unclear or unable to assess | (e.) Unclear or unable to assess | ||
| (e.) Unclear or unable to assess | (e.) Unclear or unable to assess | ||
| Core dimension 10: the length of the causal pathway between the intervention and the outcome it is intended to affect | |||
| a. Pathway variable, long d. Variesa e. Unclear or unable to assess | (d.) Varies across interventions included in the review | (e.) Unclear or unable to assess | |
| (c.) Pathway linear, short. Quote: "The high rates of IVR call engagement and their correlation with greater weight losses" | (e.) Unclear or unable to assess | ||
| (d.) Varies across interventions included in the review | (e.) Unclear or unable to assess | ||
| (d.) Varies across interventions included in the review | (e.) Unclear or unable to assess | ||
| (d.) Varies across interventions included in the review | (e.) Unclear or unable to assess | ||
| (d.) Varies across interventions included in the review | (e.) Unclear or unable to assess | ||
| (d.) Varies across interventions included in the review | (e.) Unclear or unable to assess | ||
| (d.) Varies across interventions included in the review | (e.) Unclear or unable to assess | ||
| (d.) Varies across interventions included in the review | (e.) Unclear or unable to assess | ||
| (d.) Varies across interventions included in the review | (e.) Unclear or unable to assess | ||
| (d.) Varies across interventions included in the review | (e.) Unclear or unable to assess | ||
| (d.) Varies across interventions included in the review | (e.) Unclear or unable to assess | ||
| (d.) Varies across interventions included in the review | (e.) Unclear or unable to assess | ||
| (d.) Varies across interventions included in the review | (e.) Unclear or unable to assess | ||
| (d.) Varies across interventions included in the review | (e.) Unclear or unable to assess | ||
| (d.) Varies across interventions included in the review | (e.) Unclear or unable to assess | ||
| aVaries across interventions to be considered for/included in the review. | |||
| Study ID | Typea | Subtype | Participant age (years) | Sex | Ethnicityb | Primary outcome measures | Effectc |
| P | Alcohol misuse | 41‐70 | > 50% M | W | Drinking practices Spending on alcohol | 2 2 (median effect = 2) | |
| P | Immunisation | — | — | — | Immunisation status Cost‐effectiveness | 1 1 (median effect = 1) | |
| P | Immunisation | ≥ 71 | — | — | Herpes zoster immunisations | 1 | |
| P | Immunisation | 0‐21 | — | — | Immunisation status | 2 | |
| P | Immunisation | 0‐21 | M = F (± 3%) | W,B,H | Completion by the age of 24 months of the 4‐3‐1‐3 immunisations series | 2 | |
| P | Immunisation | 0‐21 | — | — | Immunisation status | 2 | |
| P | Immunisation | — | M = F (± 3%) | W,B | Immunisation status | 1 | |
| P | Immunisation | 22‐40 | > 50% F | W,B | Immunisation rate | 2 | |
| P | Immunisation | 0‐21 | M = F (± 3%) | B,H | Immunisation status | 2 | |
| P | Immunisation | 0‐21 | M = F (± 3%) | W,B,H | Immunisation status | 2 | |
| P | Immunisation | 0‐21 | M = F (± 3%) | — | Immunisation status Preventive visit rate | 1 1 | |
| P | Physical activity | 41‐70 | > 50% F | W | 1‐mile walk after the intervention | 5 | |
| P | Physical activity | 41‐70 | > 50% M | — | Self‐reported (diary) walking adherence | 1 | |
| P | Physical activity | 41‐70 | > 50% F | B | Minutes walked per week | 1 | |
| P | Physical activity | 41‐70 | > 50% F | W | Minutes of moderate to vigorous physical activity | 1 | |
| P | Physical activity | ≥ 71 | > 50% M | W,B | Gait speed (usual and rapid) Self‐reported physical activity Function and disability | 2, 1 1 2 (median effect = 2) | |
| P | Physical activity | 41‐70 | > 50% M | W | Homeostasis model assessment of insulin resistance | 2 | |
| P | Physical activity | 41‐70 | > 50% F | W,B | Energy expenditure in moderate‐intensity‐physical activity % meeting recommendations for moderate‐intensity‐physical activity Motivational readiness for physical activity | 2 2 2 (median effect = 2) | |
| P | Physical activity | ≥ 71 | > 50% M | — | Muscle strength Balance Walk distance Mood | 1 1 2 1 (median effect = 1) | |
| P | Screening | 41‐70 | > 50% F | H | Colorectal cancer screening adherence (faecal occult blood testing) | 1 | |
| P | Screening | 41‐70 | > 50% M | W | Receipt of any recommended colorectal cancer screening | 1 | |
| P | Screening | — | > 50% F | — | Screening rate | 2 | |
| P | Screening | — | > 50% F | W,B,A | Mammography adherence | 1 | |
| P | Screening | 41‐70 | M = F (± 3%) | — | Receipt of colorectal cancer screening after 3 months | — | |
| P | Screening | — | > 50% F | W,B,H,A | Chart documentation of breast cancer screening, colorectal cancer screening, or both | 1 | |
| P | Screening | — | > 50% F | W,B | Breast cancer and colorectal cancer screening | 2 | |
| P | Screening | — | > 50% F | W,B,H | Documentation of breast cancer screening, colorectal cancer screening, or both | 1 | |
| P | Screening | 41‐70 | > 50% F | — | Bone mineral density screening after 12 months | 1 | |
| P | Screening | 41‐70 | M = F (± 3%) | W | Completion of faecal occult blood testing at 6 months | 1 | |
| P | Screening | 41‐70 | > 50% F | W,B | Completed mammogram or colorectal cancer screening within 36 weeks of randomisation | 2 | |
| P | Screening | 41‐70 | M = F (± 3%) | W | Colorectal cancer screening | 2 | |
| P | Screening | 41‐70 | > 50% F | — | Bone mineral density testing and/or filling a prescription for a bone active medication | 1 | |
| P | Stress management among caregivers | 41‐70 | > 50% F | W,B | Caregiver's appraisal of the bothersome nature of caregiving Anxiety Depression | 2 2 2 (median effect = 2) | |
| P | Substance use | 41‐70 | > 50% M | W,H | Days using primary drug | 2 | |
| P | Weight management | 41‐70 | > 50% F | B,H | Change in body weight and BMI | 1 | |
| P | Weight management | 22‐40 | > 50% F | B | Change in body weight and BMI | 1 | |
| P | Weight management | 41‐70 | > 50% F | W,B,H,A | Physical activity Dietary habits Weight loss | 2 2 2 (median effect = 2) | |
| P | Weight management | 0‐21 | > 50% M | W,H | BMI z‐score Physical activity and sedentary behaviour Dietary habits Eating disorder symptoms | 2 2 2 2 (median effect = 2) | |
| P | Weight management | 41‐70 | > 50% F | — | Body weight BMI Systolic blood pressure Diastolic blood pressure Plasma glucose Serum triglycerides Serum serum high‐density lipoprotein‐cholesterol Total serum cholesterol SF‐36 EQ‐5D Obesity Assessment Survey | 1 2 2 2 2 1 1 2 2 2 2 (median effect = 2) | |
| P | Weight management | — | — | — | Weight change | 2 | |
| P | Weight management | 0‐21 | > 50% M | W,B | BMI Calorie intake Fat intake Fruit intake Vegetable intake Television‐viewing time | 2 2 2 2 2 2 (median effect = 2) | |
| E | Appointment reminder | — | — | — | Appointment adherence | 1 | |
| E | Appointment reminder | 41‐70 | > 50% M | W | Appointment non‐attendance Preparation non‐adherence | 2 2 (median effect = 2) | |
| E | Appointment reminder | 22‐40 | > 50% F | W,B,H | Attendance rate | 2 | |
| E | Appointment reminder | — | M = F (± 3%) | — | Appointment adherence | 1 | |
| E | Appointment reminder | — | — | — | Appointment adherence | 2 | |
| E | Appointment reminder | 0‐21 | > 50% M | H | Appointment adherence | 1 | |
| E | Appointment reminder | 0‐21 | > 50% F | W,H | Appointment adherence (3‐day interval) | 1 | |
| M | Illicit drugs addiction | 41‐70 | > 50% M | W,B | Patient interest Perceived efficacy Ease of use Treatment satisfaction Retention rate Drug consumption Methadone counselling Coping | 5 5 5 4 4 2 2 2 (median effect = 4) | |
| M | Alcohol consumption | — | — | — | AUDIT score | 1 | |
| M | Alcohol consumption | 41‐70 | > 50% M | B,H | Number of drinks per drinking day | 1 | |
| M | Alcohol consumption | 41‐70 | > 50% M | W | Weekly alcohol consumption | 3 | |
| M | Alcohol consumption | 41‐70 | > 50% M | W,B,H | Proportion of days abstinent Proportion of heavy drinking days Continuous abstinence Drinking problems Coping problems | 1 2 2 2 2 (median effect = 2) | |
| M | Alcohol consumption | 41‐70 | > 50% M | W,B | Self‐reported drinking patterns Blood alcohol content Work and social adjustment scale Obsessive–compulsive drinking scale SF‐36 health survey Drinker inventory of consequences | 2 2 2 2 2 2 (median effect = 2) | |
| M | Alcohol consumption | 41‐70 | M = F (± 3%) | — | Alcohol consumption | 2 | |
| M | Alcohol consumption | 41‐70 | > 50% M | W,B | Number of heavy drinking days per month % days abstinent per month Drinks per drinking day | 2 2 2 (median effect = 2) | |
| M | Alcohol consumption | 41‐70 | > 50% M | W,B | Drinking habits Alcohol craving Post‐traumatic stress disorder symptoms | 2 2 2 (median effect = 2) | |
| M | Asthma | 41‐70 | > 50% F | W | Healthcare utilisation Medication use QoL | 2 2 2 (median effect = 2) | |
| M | Asthma | 0‐21 | M = F (± 3%) | — | Healthcare utilisation | 4 | |
| M | Cancer | 41‐70 | > 50% M | W | Number of symptom threshold events Cumulative distribution of symptom threshold events Differences in mean symptom severity between discharge and follow‐up | 1 2 2 (median effect = 2) | |
| M | Cancer | 41‐70 | > 50% F | W,B | Depression severity Pain severity | 1 1 (median effect = 1) | |
| M | Cancer | 41‐70 | > 50% F | W | Symptom presence, severity, and distress data | 2 | |
| M | Cancer | 41‐70 | M = F (± 3%) | W,B,H | Prevalence of unmet needs | 2 | |
| M | Cancer | 41‐70 | > 50% F | — | Symptom severity | 2 | |
| M | Cancer | 41‐70 | > 50% F | W,B,A | Adherence to medications Symptom severity | 2 1 (median effect = 2) | |
| M | Cancer | 41‐70 | M = F (± 3%) | W,B,H | Symptom burden | 2 | |
| M | Chronic Pain | 41‐70 | > 50% F | W | Pain Function/disability Coping | 1 1 1 (median effect = 1) | |
| M | Chronic Pain | 41‐70 | > 50% M | W | Pain intensity | 1 | |
| M | Chronic obstructive pulmonary disease | 41‐70 | > 50% M | — | Frequency of exacerbations Proportion of patients experiencing 1 or more exacerbations | 2 2 (median effect = 2) | |
| M | Adherence | 0‐21 | > 50% M | B | Comprehensiveness of screening and counselling | 1 | |
| M | Adherence | 41‐70 | > 50% F | W,B,H,A | Medication adherence | 1 | |
| M | Adherence | 0‐21 | — | — | Medication adherence | 1 | |
| M | Adherence | 41‐70 | M = F (± 3%) | W,B,H,A | Medication adherence | 1 | |
| M | Adherence | 0‐21 | — | — | Medication adherence | 1 | |
| M | Adherence | 41‐70 | > 50% M | W,B,H,A | Adherence (completion of all 3 recommended laboratory tests) | 2 | |
| M | Adherence | 41‐70 | M = F (± 3%) | W,B,H,A | Medication adherence | 1 | |
| M | Adherence | 41‐70 | M = F (± 3%) | — | Completion of all recommended laboratory tests | 1 | |
| M | Adherence | ≥ 71 | > 50% F | B | Medication adherence Systolic blood pressure Diastolic blood pressure | 1 2 1 (median effect = 1) | |
| M | Adherence | 41‐70 | > 50% M | W,B | Medication adherence Refill adherence Appointment adherence | 2 2 2 (median effect = 2) | |
| M | Adherence | — | — | — | Medication refill rate | 1 | |
| M | Adherence | 41‐70 | > 50% M | W | Medication adherence | 1 | |
| M | Adherence | ≥ 71 | > 50% F | — | Medication non‐adherence Cognitive assessment | 1 2 (median effect = 2) | |
| M | Adherence | 41‐70 | M = F (± 3%) | W,B,H,A | Adherence rate Therapeutic coverage | 2 2 (median effect = 2) | |
| M | Adherence | 41‐70 | > 50% F | B | Medication adherence Diet Moderate or greater intensity physical activity | 2 1 4 (median effect = 2) | |
| M | Adherence | — | — | — | Medication adherence | 1 | |
| M | Adherence | ≥ 71 | — | — | Medication adherence | 1 | |
| M | Adherence | 41‐70 | M = F (± 3%) | — | HRQLAdherence to statins | 1 | |
| M | Adherence | — | — | — | Medication adherence (refill rate) | 1 | |
| M | Adherence | 41‐70 | — | — | Adherence and adverse events | 1 | |
| M | Adherence | 41‐70 | > 50% M | B | Retinopathy examination | 4 | |
| M | Adherence | 41‐70 | > 50% F | — | 6‐month point prevalence | 1 | |
| M | Adherence | — | — | — | Adherence to medications | 2 | |
| M | Adherence | 41‐70 | > 50% F | W,B,A | Medication adherence | 1 | |
| M | Adherence | 41‐70 | M = F (± 3%) | W,B,A | Medication adherence | 1 | |
| M | Diabetes mellitus | 41‐70 | > 50% M | W | Glycated haemoglobin | 2 | |
| M | Diabetes mellitus | 41‐70 | > 50% F | W,B,H | Maternal blood glucose level Infant birth weight | 2 2 (median effect = 2) | |
| M | Diabetes mellitus | 41‐70 | > 50% F | W,B,H,A | Glycated haemoglobin Medication adherence Quality of life Cost‐effectiveness | 2 2 2 1 (median effect = 2) | |
| M | Diabetes mellitus | 41‐70 | > 50% M | H | Glycated haemoglobin | 4 | |
| M | Diabetes mellitus | — | — | — | Glycated haemoglobin | 1 | |
| M | Diabetes mellitus | 41‐70 | > 50% F | H | Glycated haemoglobin Health distress Global health Hypoglycaemia Hyperglycaemia Activity limitation Fatigue Physical activity levels Communication with physician Glucose monitoring Self‐efficacy Healthcare utilisation | 4 4 4 2 4 4 4 2 4 1 4 2 (median effect = 4) | |
| M | Diabetes mellitus | 41‐70 | > 50% F | W,H | Depression Days cut down on activities because of illness Diabetes‐specific health‐related quality of life Satisfaction with care (English speakers only) General health‐related quality of life (English speakers only) | 1 2 1 1 2 6 1 1 (median effect = 1) | |
| M | Diabetes mellitus | 41‐70 | > 50% M | W,B,H | Glucose monitoring Foot inspection Weight monitoring Medication adherence Glycated haemoglobin Serum glucose levels Diabetic symptoms (all) Hyperglycaemic symptoms Hypoglycaemic symptoms Vascular symptoms Other symptoms Satisfaction with care (summary score) | 1 1 2 4 2 2 1 2 2 2 1 1 (median effect = 2) | |
| M | Diabetes mellitus | 41‐70 | > 50% F | W,B,H,A | Change in self management behaviour (self‐monitoring of blood glucose and self‐monitoring of diabetic foot) | 1 | |
| M | Diabetes mellitus | 41‐70 | > 50% M | — | Glycated haemoglobin Health‐related quality of life (mental) Health‐related quality of life (physical) | 1 1 2 (median effect = 1) | |
| M | Heart failure | 41‐70 | > 50% M | — | All‐cause mortality Re‐hospitalisation Emergency room use (composite outcome) | 1 | |
| M | Heart failure | 41‐70 | > 50% M | W,B | Readmission for any reason or death from any cause | 4 | |
| M | Heart failure | ≥ 71 | > 50% M | — | Packer clinical composite score: death, hospital admission for heart failure, withdrawal from study due to worsening heart failure, 7‐point global health assessment questionnaire | 2 | |
| M | Heart failure | 41‐70 | > 50% M | — | Cardiovascular deaths and hospitalisations (outcomes in isolation included cardiovascular deaths, hospitalisations for heart failure, and time to primary endpoint) | 1 | |
| M | HIV | — | > 50% M | A | Time to virological failure (viral load > 400 copies/mL on 2 consecutive measurements) | 2 | |
| M | Hypercholestorolemia | 41‐70 | > 50% F | W | Total cholesterol reduction | 2 | |
| M | Hypercholesterolemia | 41‐70 | > 50% F | B | Total cholesterol reduction | 2 | |
| M | Hypertension | 41‐70 | > 50% F | W,B,H | Blood pressure control at 6 months | 2 | |
| M | Hypertension | 41‐70 | > 50% F | H | Change in minutes of moderate or greater physical activity Change in systolic blood pressure | 1 2 (median effect = 2) | |
| M | Hypertension | — | — | — | Blood pressure | 1 | |
| M | Hypertension | 41‐70 | > 50% M | W,H | Proportion to achieve guideline‐recommended blood pressure goals Systolic blood pressure Diastolic blood pressure | 2 1 2 (median effect = 2) | |
| M | Hypertension | 41‐70 | > 50% F | — | Systolic blood pressure | 2 | |
| M | Mental health | 22‐40 | > 50% F | W,B | Quality of life (physical scale score and mental scale score) Depression Stress levels Total well‐being | 2, 2 2 2 2 (median effect = 2) | |
| M | Mental health | 22‐40 | > 50% M | W | Yale‐Brown obsessive compulsive scale (YBOCS) score | 1 | |
| M | Mental health | — | — | — | Emotional health Physical health Stress | 1 1 1 (median effect = 1) | |
| M | Obstructive sleep apnoea syndrome | 41‐70 | — | — | Continuous positive airway pressure use | 2 | |
| M | Obstructive sleep apnoea syndrome | 41‐70 | > 50% M | — | Continuous positive airway pressure use | 1 | |
| M | Smoking | 22‐40 | M = F (± 3%) | — | Repeated point abstinence | 1 | |
| M | Smoking | 22‐40 | > 50% F | W,B,H,A | Re‐enrollment into quit line support | 1 | |
| M | Smoking | 22‐40 | > 50% F | W,B | Smoking abstinence | 2 | |
| M | Smoking | 41‐70 | > 50% M | — | Self‐reported abstinence Biochemically confirmed smoking abstinence | 2 4 (median effect = 3) | |
| M | Smoking | 0‐21 | > 50% M | A | Stage of change Self‐efficacy Decisional balance | 5 5 5 (median effect = 5) | |
| M | Smoking | 41‐70 | > 50% M | — | Smoking abstinence | 4 | |
| M | Smoking | 41‐70 | > 50% M | — | Smoking abstinence | 2 | |
| M | Smoking | — | — | — | Smoking abstinence | 2 | |
| M | Smoking | 41‐70 | M = F (± 3%) | W,B,H,A | Biochemically confirmed tobacco abstinence at 6 months | 1 | |
| M | Smoking | 41‐70 | > 50% M | W,B,A | 24‐h point prevalence 7‐d point prevalence 6‐month prolonged abstinence | 2 2 2 (median effect = 2) | |
| M | Spinal cord dysfunction | 41‐70 | > 50% M | W,B,H | Prevalence of pressure ulcers Depression severity Healthcare utilisation | 2 1 2 (median effect = 2) | |
| aStudy type: E: either prevention or management; M: management of long‐term condition; P: prevention. | |||||||
| Outcome or subgroup title | No. of studies | No. of participants | Statistical method | Effect size |
| 1 Immunisation in children Show forest plot | 5 | 10454 | Risk Ratio (M‐H, Random, 95% CI) | 1.25 [1.18, 1.32] |
| 2 Immunisation in adolescents Show forest plot | 2 | 5725 | Risk Ratio (M‐H, Random, 95% CI) | 1.06 [1.02, 1.11] |
| 3 Immunisation in adults Show forest plot | 2 | 1743 | Risk Ratio (M‐H, Random, 95% CI) | 2.18 [0.53, 9.02] |
| Outcome or subgroup title | No. of studies | No. of participants | Statistical method | Effect size |
| 1 Breast cancer screening Show forest plot | 4 | Risk Ratio (M‐H, Random, 95% CI) | Subtotals only | |
| 1.1 Multimodal/complex interventions | 2 | 462 | Risk Ratio (M‐H, Random, 95% CI) | 2.17 [1.55, 3.04] |
| 1.2 IVR | 2 | 2599 | Risk Ratio (M‐H, Random, 95% CI) | 1.05 [0.99, 1.11] |
| 2 Colorectal cancer screening Show forest plot | 7 | Risk Ratio (M‐H, Random, 95% CI) | Subtotals only | |
| 2.1 Multimodal/complex intervention | 3 | 1013 | Risk Ratio (M‐H, Random, 95% CI) | 2.19 [1.88, 2.55] |
| 2.2 IVR (shorter follow‐up) | 2 | 16915 | Risk Ratio (M‐H, Random, 95% CI) | 1.36 [1.25, 1.48] |
| 2.3 IVR (longer follow‐up) | 2 | 21335 | Risk Ratio (M‐H, Random, 95% CI) | 1.01 [0.97, 1.05] |
| Outcome or subgroup title | No. of studies | No. of participants | Statistical method | Effect size |
| 1 BMI adults Show forest plot | 3 | 672 | Mean Difference (IV, Random, 95% CI) | ‐0.64 [‐1.38, 0.11] |
| Outcome or subgroup title | No. of studies | No. of participants | Statistical method | Effect size |
| 1 Glycated haemoglobin Show forest plot | 7 | 1216 | Mean Difference (IV, Random, 95% CI) | ‐0.26 [‐0.50, ‐0.01] |
| 2 Self‐monitoring of diabetic foot Show forest plot | 2 | 498 | Std. Mean Difference (IV, Random, 95% CI) | 0.24 [0.06, 0.42] |
| Outcome or subgroup title | No. of studies | No. of participants | Statistical method | Effect size |
| 1 Cardiac mortality Show forest plot | 2 | 215 | Risk Ratio (M‐H, Random, 95% CI) | 0.60 [0.21, 1.67] |
| 2 All‐cause mortality Show forest plot | 3 | 2165 | Risk Ratio (M‐H, Random, 95% CI) | 1.00 [0.79, 1.28] |
| Outcome or subgroup title | No. of studies | No. of participants | Statistical method | Effect size |
| 1 Systolic blood pressure Show forest plot | 3 | 65256 | Mean Difference (IV, Random, 95% CI) | ‐1.89 [‐2.12, ‐1.66] |
| 2 Diastolic blood pressure Show forest plot | 2 | 65056 | Mean Difference (IV, Random, 95% CI) | 0.02 [‐2.62, 2.66] |
| Outcome or subgroup title | No. of studies | No. of participants | Statistical method | Effect size |
| 1 Smoking abstinence Show forest plot | 7 | 2915 | Risk Ratio (M‐H, Random, 95% CI) | 1.20 [0.98, 1.46] |