Sistemas de comunicación telefónica automatizados para la prevención de la salud y el tratamiento de enfermedades crónicas
Información
- DOI:
- https://doi.org/10.1002/14651858.CD009921.pub2Copiar DOI

- Base de datos:
-
- Cochrane Database of Systematic Reviews
- Versión publicada:
-
- 14 diciembre 2016see what's new
- Tipo:
-
- Intervention
- Etapa:
-
- Review
- Grupo Editorial Cochrane:
-
Grupo Cochrane de Consumidores y comunicación
- Copyright:
-
- Copyright © 2016 The Cochrane Collaboration. Published by John Wiley & Sons, Ltd.
Cifras del artículo
Altmetric:
Citado por:
Autores
Contributions of authors
-
Pawel Posadzki: revised the protocol, re‐ran the searches, screened, extracted and analysed and synthesised data, wrote and revised the drafts.
-
Nikolaos Mastellos: screened studies, extracted data, and revised the drafts.
-
Rebecca Ryan: managed the project, assessed methodological quality, revised the drafts.
-
Laura H Gunn: revised the drafts, and contributed to the statistical methods sections.
-
Lambert M Felix: revised the protocol, contributed to the design of the conceptual framework, and refined the data extraction form.
-
Yannis Pappas: revised the drafts.
-
Marie‐Pierre Gagnon: revised the drafts.
-
Steven A Julious: provided statistical expertise.
-
Brian Oldenburg: provided content expertise, revised the drafts.
-
Josip Car: conceived the idea for the review, managed the project, and revised the drafts.
All authors contributed to the writing or editing of the review.
Sources of support
Internal sources
-
No sources of support supplied
External sources
-
The NW London NIHR Collaboration for Leadership in Applied Health Research & Care (CLAHRC), the Imperial NIHR Biomedical Research Centre, and the Imperial Centre for Patient Safety and Service Quality (CPSSQ), UK.
The Department of Primary Care & Public Health at Imperial College London is grateful for support from the NW London NIHR Collaboration for Leadership in Applied Health Research & Care (CLAHRC), the Imperial NIHR Biomedical Research Centre, and the Imperial Centre for Patient Safety and Service Quality (CPSSQ). The views expressed in this publication are those of the authors and not necessarily those of the NIHR, BRC or CPSSQ.
Declarations of interest
-
Pawel Posadzki: none known.
-
Nikolaos Mastellos: none known.
-
Rebecca Ryan: This work was completed by RR as part of her role as editor with CCCG, funded by a Cochrane Infrastructure Grant provided by the National Health and Medical Research Council (NHMRC).
-
Laura H Gunn: none known.
-
Lambert M Felix: none known.
-
Yannis Pappas: none known.
-
Marie‐Pierre Gagnon: none known.
-
Steven A Julious:none known.
-
Liming Xiang: none known.
-
Brian Oldenburg: none known.
-
Josip Car: none known.
Acknowledgements
We would like to thank Igor Wei, John Kis‐Rigo, and Caroline Pang Soo Ling for their invaluable support with devising the search strategy for this review. We also acknowledge the referees and the editors for their valuable comments and suggestions. We are grateful to Dr Monika Semwal for initially validating the data extraction form and to Dr Ram Bajpai for his statistical and methodological inputs. We also thank Dr Simon Lewin for his generous role in validating the iCAT_SR tool, Professors Azeem Majeed from Diabetes Research Network and Rifat Atun for their contributions, Dr Nami Minorikawa for writing the initial protocol and designing the initial data extraction form, and Dr Lucinda Cash‐Gibson for revising the protocol and refining the data extraction form.
Version history
| Published | Title | Stage | Authors | Version |
| 2016 Dec 14 | Automated telephone communication systems for preventive healthcare and management of long‐term conditions | Review | Pawel Posadzki, Nikolaos Mastellos, Rebecca Ryan, Laura H Gunn, Lambert M Felix, Yannis Pappas, Marie‐Pierre Gagnon, Steven A Julious, Liming Xiang, Brian Oldenburg, Josip Car | |
| 2012 Jul 11 | Automated telephone communication systems for preventive healthcare and management of long‐term conditions | Protocol | Lucinda Cash‐Gibson, Lambert M Felix, Nami Minorikawa, Yannis Pappas, Laura H Gunn, Azeem Majeed, Rifat Atun, Josip Car | |
Differences between protocol and review
-
Objectives: we added a third secondary objective since publishing the protocol: to explore "the behaviour change techniques and theoretical models underpinning the ATCS interventions" to better understand any plausible mechanisms of action that underpin the interventions.
-
Methods: at protocol stage, the exclusions listed in Types of interventions included studies that "were exclusively for the purpose of electronic history‐taking or risk assessment with no health promotion or interactive elements". We have been modified this to "were exclusively for the purpose of electronic history‐taking or data collection or risk assessment with no health promotion or interactive elements"
-
We removed the following exclusion stated at protocol stage: "Studies that evaluate the groups that receive similar ATCS components but the interventions differ only by the advanced communicative functions (such as access to an advisor) or supplementary functions (such as email and short messaging service)", because it contradicted the extended inclusion criteria (please see point immediately below).
-
In Types of interventions, the protocol stated: "We will also include comparisons of one type of ATCS against another". We have altered this to: "We also included studies that compared ATCS interventions (e.g. unidirectional ATCS versus ATCS versus ATCS Plus) to compare the effects of different intervention designs on preventive healthcare or management of long‐term conditions."
-
In Types of outcome measures, the protocol stated: "To select only one of multiple outcomes, we used the following approach . . . Select the primary outcome which was identified by the publication authors (we took into consideration the possibility of selective outcome reporting bias; we attempted to compare the primary outcomes stated in the protocol with the ones listed in the review, to assist our judgement of this; when no primary outcome was identified, we selected the one specified in the sample size calculation; where there was no sample size calculation, we ranked the effect estimates and selected the median effect estimate." We have altered this to, "For each study we selected all relevant primary outcomes related to human physiology or health behaviour, as these are likely to be most meaningful to clinicians, consumers, the general public, administrators and policymakers." We followed a similar approach for selection of secondary outcomes, with the following text inserted: "For each study, we selected all relevant secondary outcomes as these were also meaningful for the various stakeholders."
-
The Information Specialist modified the search strategy for MEDLINE.
-
Unit of analysis issues: the protocol stated: "the comparator arm will be split equally between each treatment arm"; we changed this to: "we compared the relevant ATCS arm with the least active control arm", i.e. from studies with multiple intervention arms only one arm was included without splitting the comparison group.
-
Unit of analysis issues: we had planned to impute estimates of the ICC using external sources; however, we managed to calculate the ICC using the Fleiss‐Cuzick estimator for binary data in Hess 2013 study.
-
We incorporated an additional outcome. quality of life, under Secondary outcomes, Patient‐centred outcomes to add outcomes from medical care that are important to patients.
-
We also incorporated another secondary process outcome, cost‐effectiveness, to add a further layer of information relating to the description and evaluation of resource use associated with ATCS interventions, which might be used in a decision‐making process.
-
Dealing with missing data: we planned to contact the authors or impute the standard deviations from other similar studies; however, we managed to calculate the standard deviations from other statistics, such as 95% confidence intervals, standard errors, or P values.
Keywords
MeSH
Medical Subject Headings (MeSH) Keywords
- Chronic Disease [*therapy];
- Exercise;
- Health Behavior;
- Health Communication [*methods];
- Immunization [statistics & numerical data];
- Patient Compliance;
- *Preventive Health Services;
- *Primary Prevention;
- Randomized Controlled Trials as Topic;
- Reminder Systems;
- *Speech Recognition Software;
- *Telephone;
Medical Subject Headings Check Words
Adolescent; Adult; Child; Humans;
PICO

Primary preventive healthcare

Influencing factors and preventive strategies in type 2 diabetes

Conceptual framework of ATCS in preventive healthcare
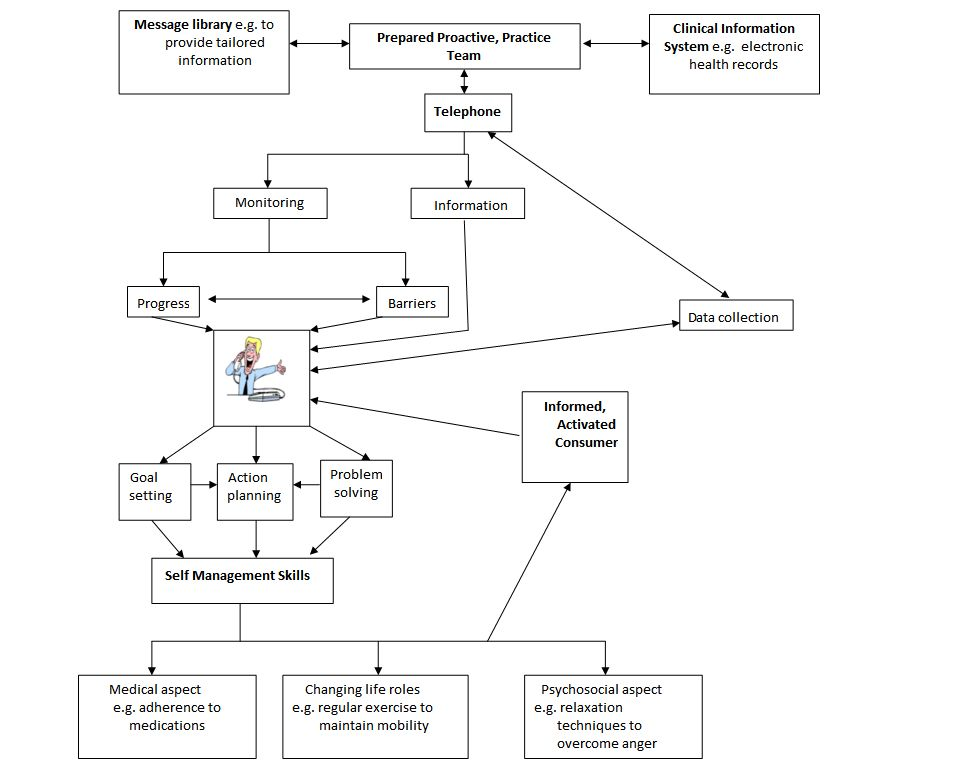
Conceptual framework of ATCS in the management of long‐term conditions

Management of long‐term conditions
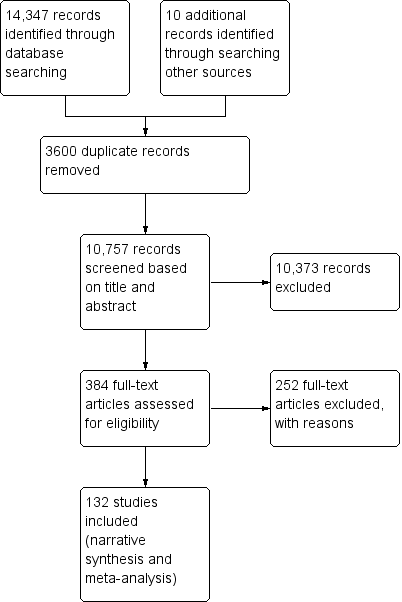
Study flow diagram

Subgroups for preventive health and/or management of long term conditions in this review
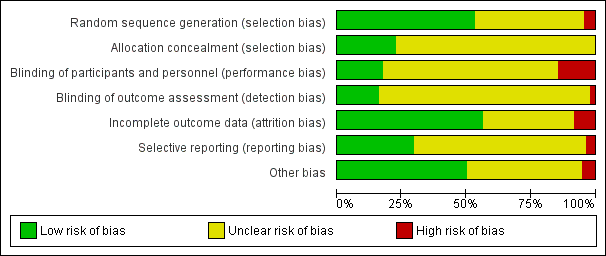
Risk of bias graph: review authors' judgements about each risk of bias item presented as percentages across all included studies.

Risk of bias summary: review authors' judgements about each risk of bias item for each included study.
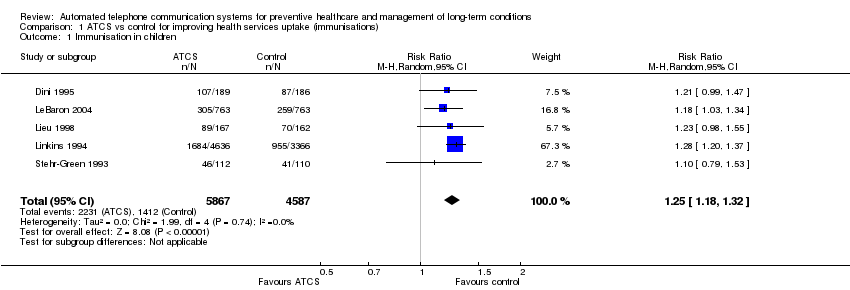
Comparison 1 ATCS vs control for improving health services uptake (immunisations), Outcome 1 Immunisation in children.

Comparison 1 ATCS vs control for improving health services uptake (immunisations), Outcome 2 Immunisation in adolescents.

Comparison 1 ATCS vs control for improving health services uptake (immunisations), Outcome 3 Immunisation in adults.

Comparison 2 ATCS vs control for improving health services uptake (screening rates), Outcome 1 Breast cancer screening.
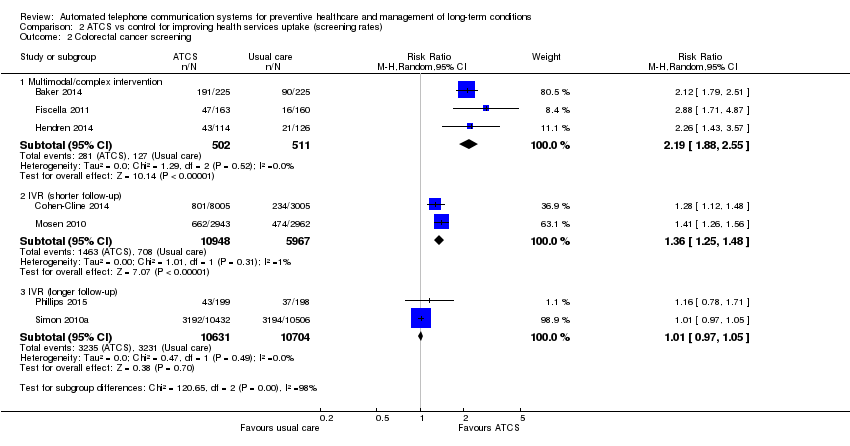
Comparison 2 ATCS vs control for improving health services uptake (screening rates), Outcome 2 Colorectal cancer screening.
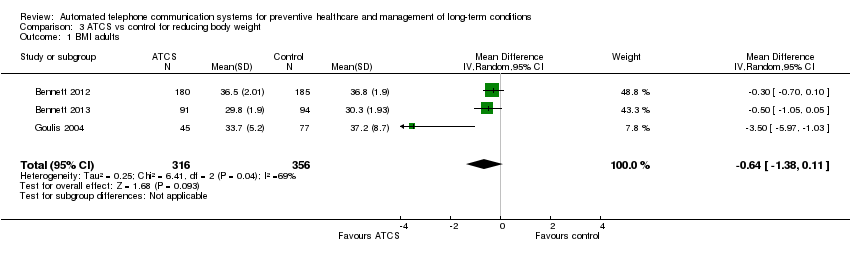
Comparison 3 ATCS vs control for reducing body weight, Outcome 1 BMI adults.
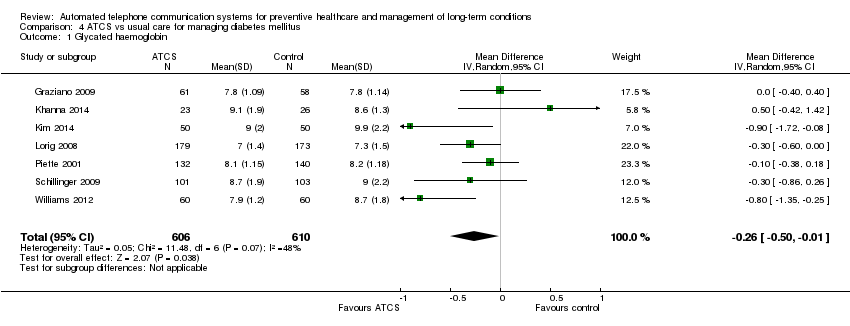
Comparison 4 ATCS vs usual care for managing diabetes mellitus, Outcome 1 Glycated haemoglobin.

Comparison 4 ATCS vs usual care for managing diabetes mellitus, Outcome 2 Self‐monitoring of diabetic foot.

Comparison 5 ATCS vs usual care for reducing healthcare utilisation in patients with heart failure, Outcome 1 Cardiac mortality.
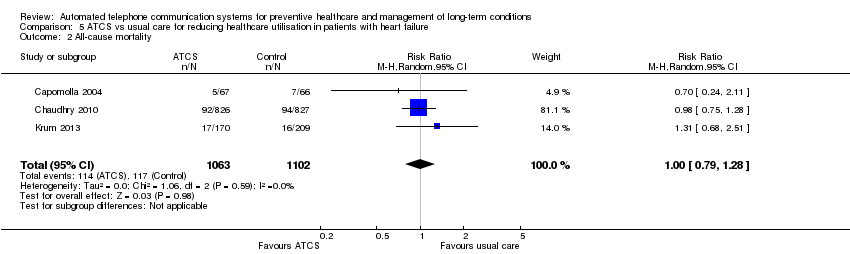
Comparison 5 ATCS vs usual care for reducing healthcare utilisation in patients with heart failure, Outcome 2 All‐cause mortality.

Comparison 6 ATCS vs usual primary care and education or usual care for managing hypertension, Outcome 1 Systolic blood pressure.

Comparison 6 ATCS vs usual primary care and education or usual care for managing hypertension, Outcome 2 Diastolic blood pressure.
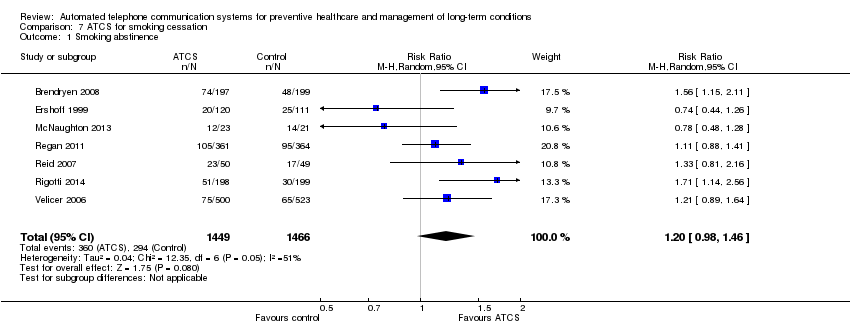
Comparison 7 ATCS for smoking cessation, Outcome 1 Smoking abstinence.
| ATCS versus control on immunisation rates | ||||||
| Patient or population: participants at risk of under‐immunisation (children, adolescents and adults) Comparison: no intervention, usual care or health information (letter) | ||||||
| Outcomes | Illustrative comparative risks* (95% CI) | Relative effect | No of participants | Quality of the evidence | Comments | |
| Assumed risk | Corresponding risk | |||||
| Control | ATCS | |||||
| Behavioural outcome: immunisation rate ATCS Plus, IVR, unidirectional versus no calls, letters, usual care at median follow‐up of 4 months | Study populationa: children Comparator: no intervention | RR 1.25 (1.18 to 1.32) | 10,454 | ⊕⊕⊕⊝ | Franzini 2000 (N = 1138) reported that compared with controls (no calls), unidirectional ATCS (autodialer) may increase immunisation rates in children (86% versus 64%, low certainty).d | |
| 308 per 1000 | 385 per 1000 | |||||
| Moderateb | ||||||
| 373 per 1000 | 466 per 1000 | |||||
| Behavioural outcome: immunisation rate Unidirectional ATCS versus usual care at median follow‐up of 15 months | Study populationa: adolescents Comparator: usual care | RR 1.06 | 5725 | ⊕⊕⊕⊝ | Szilagyi 2013 (N = 4115) also reported that unidirectional ATCS probably slightly improves the uptake of preventive care visits, compared with usual care (63% ATCS versus 59% usual care; moderate certainty evidencef). | |
| 543 per 1000 | 576 per 1000 | |||||
| Moderateb | ||||||
| 540 per 1000 | 572 per 1000 | |||||
| Behavioural outcome: immunisation rate Unidirectional ATCS versus no calls or health information at median follow‐up of 2.5 months | Study populationa: adults Comparator: no calls or health information | RR 2.18 (0.53 to 9.02) | 1743 | ⊕⊝⊝⊝ | — | |
| 10 per 1000 | 21 per 1000 | |||||
| Moderateb | ||||||
| 66 per 1000 | 144 per 1000 | |||||
| Adverse outcome: unintended adverse events attributable to the intervention ATCS+, IVR, unidirectional versus various controls | No studies reported adverse events. | |||||
| *The basis for the assumed risk (e.g. the median control group risk across studies) is provided in footnotes. The corresponding risk (and its 95% confidence interval) is based on the assumed risk in the comparison group and the relative effect of the intervention (and its 95% CI). ATCS Plus: automated telephone communication systems with additional functions; ATCS: automated telephone communication systems; CI: confidence interval; IVR: interactive voice response; RR: risk ratio; unidirectional ATCS enable non‐interactive voice communication and use one‐way transmission of information or reminders. | ||||||
| GRADE Working Group grades of evidence | ||||||
| aThe assumed risk represents the mean control group risk across studies (calculated by GRADEPro). | ||||||
| ATCS versus control on physical activity levels | |||
| Patient or population: participants at risk of developing long‐term conditions Settings: various settings Intervention: ATCS (multimodal/complex intervention, ATCS+, IVR) Comparison: no intervention, usual care, or IVR | |||
| Outcomes | Effect of intervention a | No of participants | Quality of the evidence |
| Behavioural outcome: physical activity Multimodal/complex interventionb versus no calls | The intervention may slightly improve the frequency of walks. | 181 (1 study) | ⊕⊕⊝⊝ Lowc |
| Behavioural outcome: physical activity, 12 months Multimodal/complex interventiond versus usual care | The intervention probably has mixed effects on gait speeds, little effect on functional outcomes (moderate certaintye) and may slightly increase physical activity levels (low certaintyf). | 700 (2 studies) | — |
| Behavioural outcome: physical activity ATCS Plus versus IVR control | 2 studies reported that ATCS Plus intervention may have little or no effect on different indices of physical activity. | 369 (2 studies) | ⊕⊕⊝⊝ Lowc |
| Behavioural outcome: physical activity IVR versus usual care, control or health education | 3 studies reported that IVR interventions may slightly improve several indices of physical activity (muscle strength, balance, moderate to vigorous physical activity) but may have little or no effect on others (physical activity levels, walking distance). | 216 (3 studies) | ⊕⊕⊝⊝ Lowg |
| Clinical outcome: metabolic markers, 12 months Multimodal/complex interventiond versus usual care | The intervention may have little or no effect on glycated haemoglobin, fasting insulin and glucose levels. | 302 (1 study) | ⊕⊕⊝⊝ Lowf |
| Clinical outcome: body weight measures Multimodal/complex interventiond ATCS Plus versus usual care or control | ATCS Plus intervention may have little or no effect on BMI, weight, waist or waist‐hip ratio, compared with control (71 participants; low certainty evidencec). Multimodal/complex intervention may have little or no effect on BMI, waist circumference or physical function, compared with usual care (302 participants; low certainty evidencef). | 373 (2 studies) | ⊕⊕⊝⊝ Low |
| Adverse outcome: unintended adverse events attributable to the intervention Multimodal/complex intervention, ATCS Plus, IVR versus various controls | No studies reported adverse events. | — | — |
| GRADE Working Group grades of evidence | |||
| ATCS: automated telephone communication systems; ATCS Plus: automated telephone communication systems with additional functions; IVR: interactive voice response. | |||
| aThe findings presented are based on a narrative summary and synthesis of results that were not amenable to statistical analysis; please see Effects of interventions for detailed findings. | |||
| ATCS versus control on screening rates | ||||||
| Patient or population: participants at risk for breast, colorectal or cervical cancer; or osteoporosis Settings: primary, secondary and tertiary care Intervention: ATCS (multimodal/complex intervention, ATCS Plus, IVR, unidirectional) Comparison: usual care, enhanced usual care or no intervention | ||||||
| Outcomes | Illustrative comparative risks* (95% CI) | Relative effect | No of participants | Quality of the evidence | Comments | |
| Assumed risk | Corresponding risk | |||||
| Usual care or enhanced usual care or no intervention | ATCS | |||||
| Behavioural outcome: breast cancer screening Multimodal/complex intervention versus usual care at 12 months follow‐up | Study populationa | RR 2.17 | 462 | ⊕⊕⊕⊕ | — | |
| 167 per 1000 | 363 per 1000 | |||||
| Moderateb | ||||||
| 167 per 1000 | 363 per 1000 | |||||
| Behavioural outcome: breast cancer screening IVR versus enhanced usual care at median follow‐up of 12 months | Study populationa | RR 1.05 | 2599 | ⊕⊕⊕⊝ | Unidirectional ATCS versus letter 1 further study (Fortuna 2014) (N = 1008) found that unidirectional ATCS (plus letter) probably has little or no effect on breast cancer screening rates at 12 months, adjusted OR 1.3 (95% CI 0.7 to 2.4; moderate certaintyd). | |
| 585 per 1000 | 614 per 1000 | |||||
| Moderateb | ||||||
| 432 per 1000 | 454 per 1000 | |||||
| Behavioural outcome: colorectal cancer screening Multimodal/complex intervention versus usual care at median follow‐up of 12 months | Study populationa | RR 2.19 | 1013 | ⊕⊕⊕⊕ | — | |
| 249 per 1000 | 545 per 1000 | |||||
| Moderateb | ||||||
| 167 per 1000 | 366 per 1000 | |||||
| Behavioural outcome: colorectal cancer screening IVR versus usual care at 6‐month follow‐up | Study populationa | RR 1.36 | 16915 | ⊕⊕⊕⊝ | IVR versus control 1 other study (Durant 2014) (N = 47,097) reported that IVR probably increases screening, with 1773 participants from the IVR group and 100 from the no‐call control group completing colorectal cancer screening within 3 months (moderate certaintyf). IVR versus usual care 1 study (Mosen 2010) (N = 6000) also reported that IVR probably increases completion of any colorectal cancer screening (moderate certaintyg). | |
| 119 per 1000 | 161 per 1000 | |||||
| Moderateb | ||||||
| 119 per 1000 | 162 per 1000 | |||||
| Behavioural outcome: colorectal cancer screening IVR, unidirectional ATCS versus usual care or letter at longer (9‐12 months) follow‐up | Study populationa | RR 1.01 | 21,335 | ⊕⊕⊕⊝ | IVR versus usual care 1 study (Simon 2010a) (N = 20,000) also reported that IVR probably increases slightly colorectal cancer screening via colonoscopy (moderate certaintyi). Unidirectional ATCS versus letter 1 further study (Fortuna 2014) (N = 1008) at 12 months found that unidirectional ATCS (plus letter) has probably little or no effect on colorectal cancer screening rates at 12 months (15.3% versus 12.2%; adjusted OR 1.2; 95% CI 0.6 to 2.4; moderate certaintyd). | |
| 302 per 1000 | 305 per 1000 | |||||
| Moderateb | ||||||
| 245 per 1000 | 247 per 1000 | |||||
| Behavioural outcome: cervical cancer screening ATCS Plus versus control (no calls) at 3 month follow‐up | See comment | See comment | Not estimable | 75,532 (1 study) | ⊕⊕⊕⊝ | Corkrey 2005 found that ATCS Plus intervention probably slightly improves cervical cancer screening rates at 3 months. |
| Adverse outcome: unintended adverse events attributable to the intervention Multimodal/complex intervention, ATCS Plus, IVR, unidirectional versus various controls | No studies reported adverse events. | |||||
| *The basis for the assumed risk (e.g. the median control group risk across studies) is provided in footnotes. The corresponding risk (and its 95% confidence interval) is based on the assumed risk in the comparison group and the relative effect of the intervention (and its 95% CI). | ||||||
| GRADE Working Group grades of evidence | ||||||
| aThe assumed risk represents the mean control group risk across studies (calculated by GRADEPro). | ||||||
| ATCS versus control for body weight | ||||||
| Patient or population: overweight or obese individuals (both children and adults) Comparison: usual care, no intervention or control | ||||||
| Outcomes | Illustrative comparative risks* (95% CI) | Relative effect | No of participants | Quality of the evidence | Commentsa | |
| Assumed risk | Corresponding risk | |||||
| Controls | ATCS | |||||
| Clinical and behavioural outcome: BMI score in adults Multimodal/complex intervention, ATCS Plus or IVR versus usual care at median follow‐up of 18 months | The mean BMI in the control groups was 34.7 kg/m2 | The mean BMI of adults in the intervention groups was 0.64 kg/m2lower | Not estimable | 672 | ⊕⊕⊝⊝ | ATCS Plus versus control Vance 2011 (N = 140) found that ATCS Plus may reduce slightly BMI (low certainty evidencec). |
| Clinical and behavioural outcome: body weight in adults, 12 weeks | See comment | See comment | Not estimable | See comment | See comment | ATCS Plus versus control Vance 2011 (N = 140) found that ATCS Plus may reduce slightly body weight and waist circumference (low certainty evidencec). IVR versus control Estabrooks 2008 (N = 77) reported that IVR may have little or no effect on body weight (percent lost or change in) (low certainty evidenced). |
| Clinical and behavioural outcome: body weight in adults, at median follow‐up of 18 months | See comment | See comment | Not estimable | See comment | See comment | ATCS (multimodal/complex intervention, ATCS Plus, IVR) versus usual care Bennett 2012 (N = 365) found that ATCS Plus probably slightly reduces body weight at 18 months (moderate certainty evidence).eBennett 2013 (N = 194) found that multimodal/complex intervention may reduce body weight at 18 months (low certainty evidence).f IVR versus usual care Goulis 2004 (N = 122) found that IVR probably reduces slightly body weight but probably has little or no effect on obesity assessment scores at 6 months (moderate certainty evidence).f |
| Clinical and behavioural outcome: blood pressure, blood glucose, cholesterol levels | See comment | See comment | Not estimable | See comment | See comment | ATCS (ATCS Plus, IVR) versus usual care/control Bennett 2012 (N = 365) found that ATCS Plus probably has little or no effect on systolic or diastolic blood pressure at 18 months (moderate certainty evidencee). ATCS Plus versus control Vance 2011 found that ATCS Plus may slightly improve slightly systolic blood pressure and blood glucose levels at 12 weeks (low certainty evidencec). IVR versus usual care Goulis 2004 (N = 122) found that IVR probably has little or no effect on systolic or diastolic blood pressure, plasma glucose levels, or high‐density lipoprotein cholesterol, but it probably slightly reduces total cholesterol and triglyceride levels at 6 months (moderate certainty evidence).e |
| Clinical outcome: BMI z‐score in children at median follow‐up of 7.5 months | See comment | See comment | Not estimable | See comment | ⊕⊕⊕⊝ | ATCS Plus versus control Estabrooks 2009 (N = 220) found that ATCS Plus has probably little or no effect on BMI z‐scores in children at 12 months. IVR versus control Wright 2013 (N = 100) found that IVR has probably little or no effect on BMI z‐scores in children at 3 months. |
| Behavioural outcome: physical activity, dietary habits in children at median follow‐up of 7.5 months | See comment | See comment | Not estimable | See comment | ⊕⊕⊕⊝ | ATCS Plus versus control Estabrooks 2009 (N = 220) found that ATCS Plus has probably little or no effect on self‐reported physical activity, sedentary behaviours or dietary habits at 12 months. IVR versus control (no calls) Wright 2013 (N = 100) found that IVR has probably little or no effect on total caloric intake, fruit intake, or sedentary behaviours at 3 months. |
| Adverse outcome: unintended adverse events attributable to the intervention IVR versus usual care | See comment | See comment | See comment | 559 (2 studies) | See comment | Bennett 2012 (N = 365) reported 1 serious musculoskeletal injury in the intervention group and 3 events (1 cardiovascular and 2 cases of gallbladder disease) in the usual care group (moderate certainty evidence).e,g Bennett 2013 (N = 194) reported 6 serious adverse events in the intervention arm, including gynaecological surgery in 2 participants and knee replacement, breast abscess, musculoskeletal injury, and cancer diagnosis in 1 participant each; all participants except the one with the cancer diagnosis required hospitalisation (low certainty evidence).f,g |
| *The corresponding risk (and its 95% confidence interval) is based on the assumed risk in the comparison group and the relative effect of the intervention (and its 95% CI). ATCS: automated telephone communication systems; ATCS Plus: automated telephone communication systems with additional functions; BMI: body Mass Index; CI: confidence interval; IVR: interactive voice response; SMD: Standardised mean difference. | ||||||
| GRADE Working Group grades of evidence | ||||||
| aAdditional findings presented are based on a narrative summary and synthesis of results that were not amenable to statistical analysis; please see Effects of interventions for detailed findings. | ||||||
| ATCS versus control as appointment reminders (reducing non‐attendance rates) | |||
| Patient or population: patients/healthcare consumers Comparison: no intervention (calls) or nurse‐delivered calls | |||
| Outcomes | Effect of interventiona | No of participants (studies) | Quality of the evidence |
| Health behaviour: attendance rates, 6 weeks ATCS Plus versus nurse‐delivered calls | ATCS Plus calls delivered 3 or 7 days prior to flexible sigmoidoscopy or/and colonoscopy examinations probably have little or no effect on appointment non‐attendance or preparation non‐adherence. | 3610 (1 study) | ⊕⊕⊕⊝ |
| Health behaviour: attendance rates, 4 months IVR versus no calls | IVR improves attendance rates: OR 1.52 (95% CI 1.34 to 1.71). | 12,092 (1 study) | ⊕⊕⊕⊕ High |
| Health behaviour: return tuberculin test rate, 3 days Unidirectional ATCS versus no calls | Unidirectional ATCS may improve test return rates. | 701 (1 study) | ⊕⊕⊝⊝ |
| Health behaviour: attendance rates, 1 month Unidirectional ATCS versus no calls | Undirectional ATCS may improve attendance rates RR 1.60 (95% CI 1.29 to 1.98). | 517 (1 study) | ⊕⊕⊝⊝ |
| Health behaviour: attendance rates, 6‐8 weeks Unidirectional ATCS versus no calls | 2 studies reported conflicting results: Reekie 1998 (N = 1000) reported that unidirectional ATCS probably decrease non‐attendance rates at 6 weeks; while Maxwell 2001 (N = 2304) reported the interventions probably have little or no effect at 2 months. | 3304 (2 studies) | ⊕⊕⊕⊝ |
| Health behaviour: attendance rates, 6 months Unidirectional ATCS versus no calls | Unidirectional ATCS may improve attendance: OR 1.50 (P < 0.01). | 2008 (1 study) | ⊕⊕⊝⊝ |
| Adverse outcome: unintended adverse events attributable to the intervention ATCS Plus, IVR, unidirectional ATCS versus various controls | No studies reported adverse events. | ||
| ATCS: automated telephone communication systems; ATCS Plus: automated telephone communication systems with additional functions; CI: confidence interval; IVR: interactive voice response; OR: odds ratio; RR: risk ratio. | |||
| GRADE Working Group grades of evidence | |||
| aThe findings presented are based on a narrative summary and synthesis of results, many of which were not amenable to statistical analysis; please see Effects of interventions for detailed findings. | |||
| ATCS versus control for adherence to medication or laboratory tests | ||||
| Patient or population: patients with various conditions or at risk of low adherence to medication or laboratory tests Settings: various settings Intervention: ATCS (multimodal/complex intervention, ATCS Plus, IVR, unidirectional ATCS) Comparison: usual care, no calls, controls (other ATCS) | ||||
| Outcomes | Effect of interventionsa | No of participants | Quality of the evidence | Comments |
| Behavioural outcome: adherence to medication Multimodal/complex interventionsb versus usual care or control | The effects of multimodal/complex interventions are inconclusive. | 888 (2 studies) | See comment | Ho 2014 (N = 241) reported that the multimodal/complex intervention probably improves adherence to cardioprotective medications at 12 months (moderate certaintyc). Stuart 2003 (N = 647) found uncertain effects of the intervention on adherence to antidepressant medications (very low certaintyc,d). |
| Behavioural outcome: adherence to medication ATCS Plus versus control or single IVR call | Results suggest that ATCS Plus probably slightly improve measures of adherence. | 2340 (2 studies) | See comment | Cvietusa 2012 (N = 1393) reported that ATCS Plus, compared with control, probably improves time to first inhaled corticosteroid refill and probably slightly improves the proportion of days with medication on hand in children (moderate certaintye). Stacy 2009 (N = 947) reported that ATCS Plus probably slightly improves statin adherence at 6 months, compared with a single IVR call (moderate certaintyf). |
| Behavioural outcome: adherence to laboratory tests ATCS Plus or IVR versus no intervention or usual care | Results suggest that ATCS Plus probably has little or no effect on adherence to testing, while IVR probably improves test completion. | 15,218 (3 studies) | See comment | ATCS Plus versus no intervention Derose 2009 (N = 13,057) found that ATCS Plus probably has little or no effect on adherence to testing (completion of all 3 recommended laboratory tests for diabetes patients) at 12 weeks (moderate certaintyg). Simon 2010b (N = 1200) found that these interventions probably have little or no effect on retinopathy examination rates or tests for glycaemia, hyperlipidaemia or nephropathy in diabetic patients at 12 months (moderate certaintyh). IVR versus usual care Feldstein 2006 (N = 961) found that IVR probably improves patients' completion of all recommended laboratory tests at 25 days follow‐up (moderate certaintyi). |
| Behavioural outcome: adherence to medication or composite outcome (medication adherence and rate of adverse events) ATCS Plus versus usual care | Results indicate that ATCS Plus probably improves medication adherence and may slightly improve a composite measure. | 35,816 (4 studies) | See comment | 2 studies (Derose 2013 (N = 5216) and Vollmer 2014 (N = 21,752)) reported that ATCS Plus probably improves adherence to statins to some extent. Vollmer 2011 (N = 8517) found that ATCS Plus probably slightly improves adherence to inhaled corticosteroids (moderate certaintyj). Sherrard 2009 (N = 331) found that ATCS Plus may slightly improve a composite measure of medication adherence and adverse events at 6 months follow‐up (low certaintyc,k). |
| Behavioural outcome: adherence to medication or laboratory tests IVR versus control | Results suggest that IVR probably improves slightly medication adherence. | 4,238,362 (4 studies) | See comment | Adams 2014 (N = 475) found that IVR may slightly improve comprehensiveness of screening and counselling (low certaintyc,l). Bender 2010 (N = 50) reported that IVR may improve adherence to anti‐asthmatic medications at 2.5 months follow‐up (low certaintyc,e). Leirer 1991 (N = 16) reported that IVR may slightly reduce medication non‐adherence (low certaintym). Mu 2013 (N = 4,237,821) found that IVR probably slightly improves medication refill rates at 1 month (moderate certaintyn). |
| Behavioural outcome: adherence to medication IVR versus usual care | Results indicate that IVR probably slightly improves some measures of medication adherence. | 56,140 (8 studies) | See comment | 2 studies (Boland 2014 (N = 70); Friedman 1996 (N = 267)) reported that IVR probably slightly improves adherence to glaucoma and anti‐hypertensive medications at 3 and 6 months respectively (moderate certainty).o 2 further studies (Glanz 2012 (N = 312); Migneault 2012 (N = 337)) reported that IVR has probably little or no effect on medication adherence at 8 and 12 months, respectively (moderate certainty).p 2 studies (Green 2011 (N = 8306); Reynolds 2011 (N = 30,610)) assessed adherence via refill rates, reporting that IVR probably slightly improves medication refill rates at 2 weeks (moderate certainty).q 2 further studies reported medication adherence assessed by medication possession ratio (MPR) at different time points. Patel 2007 (N = 15,051) found that IVR probably slightly improves MPR at 3 to 6 months, while Bender 2014 (N = 1187) reported that IVR probably improves MPR at 24 months (both studies of moderate certaintyr). |
| Behavioural outcome: adherence to medication Unidirectional ATCS versus control | Results suggest that unidirectional ATCS may have little effect, or improve medication adherence to a small degree. | 107 (2 studies) | See comment | 2 studies (Lim 2013 (N = 80); Ownby 2012 (N = 27)) reported that the intervention may have little effect or slightly improve medication adherence (low certaintys). |
| Clinical outcome: blood pressure Multimodal/complex, ATCS Plus, IVR versus usual care | Results suggest that ATCS Plus probably slightly reduces blood pressure, while multimodal/complex or IVR interventions probably have little or no effect on blood pressure. | 22,597 (3 studies) | See comment | Multimodal/complex intervention versus usual care Ho 2014 (N = 241) reported that multimodal intervention probably has little or no effect on achieving reduced blood pressure targets (moderate certaintyc). ATCS Plus versus usual care Vollmer 2014 (N = 21,752) reported that ATCS Plus probably slightly reduces systolic blood pressure (moderate certaintyt). IVR versus usual care Migneault 2012 (N = 337) reported that IVR probably has little or no effect on systolic or diastolic blood pressure (moderate certaintyc), while Friedman 1996 (N = 267) found that IVR may have little or no effect on systolic blood pressure but may slightly decrease diastolic blood pressure (low certaintyc,f). |
| Adverse outcome: unintended adverse events attributable to the intervention Multimodal/complex intervention, ATCS Plus, IVR, unidirectional versus various controls | No studies reported adverse events. | |||
| ATCS Plus: automated telephone communication systems with additional functions; CI: confidence interval; HR: hazard ratio; IVR: interactive voice response; MPR: medication possession ratio; OR: odds ratio; RR: risk ratio; SD: standard deviation | ||||
| GRADE Working Group grades of evidence | ||||
| aMultimodal intervention included ATCS Plus, medication reconciliation and tailoring, patient education and collaborative care in Ho 2014; and education, nurse‐delivered call and IVR in Stuart 2003. | ||||
| ATCS versus control on alcohol consumption | |||
| Patient or population: participants addicted to alcohol Settings: various settings Intervention: ATCS (ATCS Plus, IVR) Comparison: no intervention, usual care, advice/education or packaged CBT | |||
| Outcomes | Effect of interventiona | No of participants | Quality of the evidence |
| Behavioural outcomes: number of drinks per drinking day ATCS Plus, IVR versus usual care, (various) controls at median follow‐up of 2 months | ATCS Plus versus usual care Rose 2015 (N = 158) reported that ATCS Plus may have little or no effect on the number of drinks per drinking day at 2 months (low certaintyb,c). ATCS Plus versus control (advice/education) Hasin 2013 (N = 254) found that ATCS Plus may reduce the number of drinks per drinking day in the last 30 days at 2 months (low certaintyb,c), but it may have little effect at 12 months. IVR versus control (information) Rubin 2012 (N = 47) reported that IVR may slightly reduce the number of drinks per drinking day at 6 months (low certaintyc,e). | 459 (3 studies) | ⊕⊕⊝⊝ |
| Behavioural outcomes: drinking days, heavy drinking days, or total number of drinks consumed ATCS Plus, IVR versus (various) controls | ATCS Plus versus no intervention Mundt 2006 (N = 60) found that ATCS Plus may have little or no effect on drinking days, heavy drinking days, or total number of drinks consumed (low certaintyc,f). ATCS Plus versus control (packaged CBT) Litt 2009 (N = 110) found that ATCS Plus may have little or no effect on the number of heavy drinking days at 12 weeks posttreatment (low certaintyc,g). IVR versus control (information) Rubin 2012 (N = 47) reported that IVR may slightly reduce the number of heavy drinking days per month at 6 months (low certaintyc,e). | 217 (3 studies) | ⊕⊕⊝⊝ |
| Behavioural outcomes: proportion of days abstinent, other alcohol consumption indices, 12 weeks ATCS Plus versus control (packaged CBT) | ATCS Plus may slightly reduce the proportion of days abstinent but have little or no effect on coping or drinking problems or continuity of abstinence (Litt 2009). | 110 (1 study) | ⊕⊕⊝⊝ |
| Behavioural outcomes: weekly alcohol consumption, 6 months ATCS Plus versus usual care | ATCS Plus may have little or no effect on weekly alcohol consumption (Helzer 2008). | 338 (1 study) | ⊕⊕⊝⊝ |
| Behavioural outcomes: AUDIT score, 6 weeks IVR versus control (no intervention) | IVR probably improve slightly AUDIT scores (Andersson 2012). | 1423 (1 study) | ⊕⊕⊕⊝ |
| Behavioural outcomes: other alcohol consumption indices, 4 weeks IVR versus control (no intervention) | IVR may have little or no effect on drinking habits, alcohol craving, or PTSD symptoms (Simpson 2005). | 98 (1 study) | ⊕⊕⊝⊝ |
| Adverse outcome: unintended adverse events attributable to the intervention ATCS Plus, IVR versus various controls | No studies reported adverse events. | ||
| ATCS Plus: automated telephone communication systems with additional functions; AUDIT: Alcohol Use Disorders Identification Test; CBT: cognitive behavioural therapy; IVR: interactive voice response; PTSD: post‐traumatic stress disorder. | |||
| GRADE Working Group grades of evidence | |||
| aThe findings presented in this table are based on a narrative summary and synthesis of results that were not amenable to statistical analysis; please see Effects of interventions for detailed findings. | |||
| ATCS versus control on severity of cancer symptoms | ||||
| Patient or population: cancer patients Settings: various settings Intervention: ATCS (multimodal/complex intervention, ATCS Plus, IVR) Comparison: usual care, control (other ATCS, nurse‐delivered calls) | ||||
| Outcomes | Effects of interventiona | No of participants | Quality of the evidence | Comments |
| Clinical outcomes: symptoms (severity or burden) ATCS Plus versus usual care (via ATCS) or control, 4‐12 weeks | Results suggest that ATCS Plus may have little or no effect on symptom severity, distress or burden. | 701 (4 studies) | See comment | Cleeland 2011 (N = 79) found that ATCS Plus may slightly reduce symptom threshold events and cumulative distribution of symptom threshold events; and it may have little or no effect on mean symptom severity between discharge and 4 week follow‐up (low certaintyb,c). Mooney 2014 (N = 250) found that ATCS Plus probably has little or no effect on symptom severity scores at 6 week follow‐up (moderate certaintyc). Spoelstra 2013 (N = 119) found that ATCS Plus may have little or no effect on symptom severity at 10 week follow‐up (low certaintyc,d). Yount 2014 (N = 253) reported that ATCS Plus may have little or no effect on symptom burden at 12 weeks (low certaintyc,e). |
| Clinical outcomes: symptom severity, 10 weeks IVR versus nurse delivered calls | Results suggest that IVR may have little or no effect on symptom severity. | 437 (1 study) | ⊕⊕⊝⊝ | — |
| Clinical outcomes: pain Multimodal/complex interventiong versus usual care | Results indicate that multimodal intervention probably reduces pain at 3 months and probably slightly reduces pain at 12 months. | 405 (1 study) | ⊕⊕⊕⊝ | — |
| Clinical outcomes: depression Multimodal/complex interventiong versus usual care | Results indicate that multimodal intervention probably slightly reduces depression at 3 and 12 months. | 405 (1 study) | ⊕⊕⊕⊝ | — |
| Clinical outcomes:distress, 6 weeks ATCS Plus versus usual care (via IVR) | Results indicate that ATCS Plus probably has little or no effect on distress. | 250 (1 study) | ⊕⊕⊕⊝ | — |
| Behavioural outcome: medication adherence ATCS Plus versus usual care | Results indicate that ATCS Plus may have little or no effect on medication non‐adherence. | 119 (1 study) | ⊕⊕⊝⊝ | — |
| Adverse outcome: unintended adverse events attributable to the intervention Multimodal/complex intervention, ATCS Plus, IVR versus various controls | No studies reported adverse events. | |||
| ATCS: automated telephone communication systems; ATCS Plus: automated telephone communication systems with additional functions; IVR: interactive voice response. | ||||
| GRADE Working Group grades of evidence | ||||
| aThe findings presented in this table are based on a narrative summary and synthesis of results that were not amenable to statistical analysis; please see Effects of interventions for detailed findings. | ||||
| ATCS versus usual care for managing diabetes mellitus | ||||||
| Patient or population: patients with diabetes mellitus Comparison: usual care | ||||||
| Outcomes | Illustrative comparative risks* (95% CI) | Relative effect | No of Participants | Quality of the evidence | Commentsa | |
| Assumed risk | Corresponding risk | |||||
| Usual care | ATCS | |||||
| Clinical outcome: glycated haemoglobin or blood glucose ATCS Plus, IVR versus usual care at median follow‐up of 6 months | The mean glycated haemoglobin in the control groups was 8.41% | The mean glycated haemoglobin in the intervention groups was | Not estimable | 1216 | ⊕⊕⊝⊝ | ATCS Plus versus usual care 1 further study, Katalenich 2015 (N = 98), found that ATCS Plus may have little or no effect on median glycated haemoglobin levels compared with usual care at 6 months follow‐up (low certaintyc). IVR versus usual care 1 additional study, Homko 2012 (N = 80), found that IVR may have little or no effect on fasting blood glucose levels in pregnancy or infant birth weight at 26 months (low certaintyc). |
| Behavioural outcome: self‐monitoring of diabetic foot (various scales) ATCS Plus versus usual care at 12 months follow‐up | The mean self‐monitoring of diabetic foot in the control groups was 4.5 (range from 0 to 7, with higher scores indicating better foot care) | The mean self‐monitoring of diabetic foot in the intervention groups was | Not estimable | 498 | ⊕⊕⊕⊝ | — |
| Behavioural outcome: self‐monitoring of blood glucose ATCS Plus, IVR versus usual care, 6‐12 months | See comment | See comment | Not estimable | See comment | See comment | ATCS Plus versus usual care Lorig 2008 (N = 417) found that ATCS Plus may have little no effect on self‐monitoring of blood glucose at 6 months (low certainty evidencef). At 12 months, 2 studies (Piette 2001 (N = 272); Schillinger 2009 (N = 339)) reported that ATCS Plus probably slightly improves self‐monitoring of blood glucose (moderate certaintye). IVR versus usual care Graziano 2009 (N = 112) found that IVR probably slightly increases the mean change in frequency of self‐monitoring of blood glucose (moderate certainty evidenceg). |
| Behavioural outcome: medication adherence or use ATCS Plus versus usual care, 6‐12 months | See comment | See comment | Not estimable | 370 (2 studies) | See comment | Katalenich 2015 (N = 98) reported that ATCS Plus may have little or no effect on adherence rates at 6 months (low certaintyc), and Piette 2001 (N = 272) found that ATCS Plus has probably little or no effect on medication use at 12 months (moderate certaintyg. |
| Behavioural outcome: physical activity, diet, weight monitoring ATCS Plus versus usual care, 6‐12 months | See comment | See comment | Not estimable | 1028 (3 studies) | See comment | Lorig 2008 (N = 417) found that ATCS Plus may have little or no effect on aerobic exercise at 6 months (low certaintyf). Schillinger 2009 (N = 339) found that ATCS Plus may slightly improve diet and exercise and moderate intensity physical activity levels, but it may have little or no effect on vigorous intensity physical activity levels at 12 months (low certaintyc). Piette 2001 (N = 272) reported that ATCS Plus probably has little or no effect on weight monitoring (moderate certaintyg). |
| Adverse outcome: unintended adverse events attributable to the intervention ATCS Plus, IVR versus usual care | No studies were found that reported adverse events. | |||||
| The corresponding risk (and its 95% confidence interval) is based on the assumed risk in the comparison group and the relative effect of the intervention (and its 95% CI). ATCS Plus: automated telephone communication systems with additional functions; CI: confidence interval; HRQoL: health‐related quality of life; IVR: interactive voice response; SMD: standardised mean difference. | ||||||
| GRADE Working Group grades of evidence | ||||||
| aAdditional results are based on a narrative summary and synthesis of results that were not amenable to statistical analysis; please see Effects of interventions for detailed findings. | ||||||
| ATCS versus usual care for patients with heart failure | ||||||
| Patient or population: patients with heart failure Comparison: usual care or usual community care | ||||||
| Outcomes | Illustrative comparative risks* (95% CI) | Relative effect | No of participants | Quality of the evidence | Commentsa | |
| Assumed risk | Corresponding risk | |||||
| Usual care or usual community care | ATCS | |||||
| Clinical outcome: cardiac mortality ATCS Plus, IVR versus usual care or usual community care at median follow‐up of 11.5 months | Study populationb | RR 0.60 | 215 | ⊕⊝⊝⊝ | — | |
| 95 per 1000 | 57 per 1000 | |||||
| Moderatec | ||||||
| 96 per 1000 | 58 per 1000 | |||||
| Clinical outcome: all‐cause mortality ATCS Plus versus usual care or usual community care at median follow‐up of 11 months | Study populationb | RR 1 (0.79 to 1.28) | 2165 | ⊕⊕⊕⊝ | — | |
| 106 per 1000 | 106 per 1000 | |||||
| Moderatec | ||||||
| 106 per 1000 | 106 per 1000 | |||||
| Clinical outcome: heart failure hospitalisation ATCS Plus, IVR versus usual care or usual community care at median follow‐up of 11.5 months | See comment | See comment | Not estimable | 2329 (4 studies) | See comment | ATCS Plus versus usual care or usual community care Chaudhry 2010 (N = 1653) found that the intervention had little or no effect on hospitalisation for heart failure (high certainty). Krum 2013 (N = 405) also reported that there was probably little or no effect of the intervention for this same outcome (moderate certaintyg), while Capomolla 2004 (N = 133) reported that ATCS Plus may decrease hospitalisation rates for heart failure (low certaintyh). IVR versus usual care Kurtz 2011 (N = 138) reported that IVR intervention has uncertain effects on hospitalisation for heart failure (very low certaintyi). |
| Clinical outcome: all‐cause hospitalisation ATCS Plus versus usual care or usual community care | See comment | See comment | Not estimable | 2191 participants (3 studies) | See comment | ATCS Plus versus usual care Capomolla 2004 (N = 133) found that ATCS Plus may reduce all‐cause hospitalisation (for chronic heart failure, cardiac cause and other cause; low certaintyh), and Krum 2013 (N = 405) similarly reported that the intervention probably slightly decreased all‐cause hospitalisation (moderate certaintyg).fChaudhry 2010 (N = 1653) found that ATCS Plus has little or no effect on readmission for any reason (high certainty). |
| Clinical outcome: global health (well‐being) rating (7‐item questionnaire) ATCS Plus versus usual care 12 months | See comment | See comment | Not estimable | 405 participants (1 study) | ⊕⊕⊕⊝ | Krum 2013 (N = 405) reported that ATCS Plus probably increases slightly the proportion of patients with improved global health questionnaire ratings at 12 months. |
| Clinical outcome: emergency room and other health service use outcomes ATCS Plus versus usual care or usual community care | See comment | See comment | Not estimable | 1786 participants (2 studies) | See comment | Emergency room use Capomolla 2004 (N = 133) found that ATCS Plus may reduce emergency room use at (median) 11 months (low certaintyh). Other service use Chaudhry 2010 (N = 1653) found that ATCS Plus had little or no effect on number of days in hospital or number of hospitalisations (readmissions)(high certainty). |
| Adverse outcome: unintended adverse events attributable to the intervention ATCS Plus, IVR versus usual care | See comment | See comment | See comment | 1791 (2 studies) | See comment | ATCS Plus versus usual care Chaudhry 2010 (N = 1653) reported that no adverse events had occurred during the study (high certainty). IVR versus usual care Kurtz 2011 (N = 138) classified adverse events as cardiac mortality plus rehospitalisation for heart failure, reporting uncertain effects upon this composite outcome (very low certaintyi). |
| *The basis for the assumed risk (e.g. the median control group risk across studies) is provided in footnotes. The corresponding risk (and its 95% confidence interval) is based on the assumed risk in the comparison group and the relative effect of the intervention (and its 95% CI). ATCS Plus: automated telephone communication systems with additional functions; CI: confidence interval; CI: confidence interval; RR: risk ratio. | ||||||
| GRADE Working Group grades of evidence | ||||||
| aAdditional results are based on a narrative summary and synthesis of results that were not amenable to statistical analysis; please see Effects of interventions for detailed findings. | ||||||
| ATCS versus usual care for management of hypertension | |||||
| Patient or population: patients with hypertension Comparison: usual care, with and without education | |||||
| Outcomes | Illustrative comparative risks* (95% CI) | No of Participants | Quality of the evidence | Commentsa | |
| Assumed risk | Corresponding risk | ||||
| Usual care | ATCS | ||||
| Clinical outcome: systolic blood pressure (automated sphygmomanometer or electronic pressure monitor) ATCS Plus or IVR versus usual care at median follow‐up of 6 weeks | The mean systolic blood pressure in the control group was 141.1 mmHg | The mean systolic blood pressure in the intervention groups was (2.12 to 1.66 lower) | 65,256 | ⊕⊕⊕⊝ | 1 additional study (Dedier 2014) (N = 253) reported that compared with usual care plus education, IVR may have little or no effect on systolic blood pressure at 3 months (low certaintyc). |
| Clinical outcome: diastolic blood pressure (automated sphygmomanometer and electronic cuff) ATCS Plus, unidirectional versus usual care at median follow‐up of 14 weeks | The mean diastolic blood pressure in the control group was 81.2 mmHg | The mean diastolic blood pressure in the intervention groups was 0.02 mmHg higher (2.62 lower to 2.66 higher) | 65,056 | ⊕⊕⊝⊝ | — |
| Clinical outcome: blood pressure control, 26 weeks Multimodal/complex interventionf versus usual care | See comment | See comment | 166 (1 study) | ⊕⊕⊕⊝ | Bove 2013 (N = 241) found that a multimodal/complex intervention probably has little or no effect on blood pressure control. |
| Clinical outcome: Health statush, depressioni, 6 weeks ATCS Plus versus enhanced usual care (plus information) | See comment | See comment | 200 (1 study) | ⊕⊕⊝⊝ | Piette 2012 (N = 200) found that ATCS Plus may slightly improve health status and may decrease depressive symptoms. |
| Behavioural outcome: medication use Multimodal/complexk, ATCS Plus versus usual care or enhanced usual care (plus information) | See comment | See comment | 483 (2 studies) | ⊕⊕⊝⊝ | Multimodal/complex versus usual care Magid 2011 (N = 283) found that multimodal/complex intervention may have little or no effect on medication adherence assessed by Medication Possession Ratio or proportion adherent (low certaintyl). ATCS Plus versus enhanced usual care Piette 2012 (N = 200) found that ATCS Plus may reduce the number of medication‐related problemsm (low certaintyj). |
| Behavioural outcome: physical activity levels, 12 weeks IVR versus enhanced usual care | See comment | See comment | 253 (1 study) | ⊕⊕⊝⊝ | IVR versus enhanced usual care Dedier 2014 (N = 253) reported that IVR may slightly increase physical activity levels. |
| Adverse outcome: unintended adverse events attributable to the intervention Multimodal/complex intervention, ATCS Plus, IVR, unidirectional ATCS versus various controls | No studies reported adverse events. | ||||
| ATCS Plus: automated telephone communication systems with additional functions; CI: confidence interval; IVR: interactive voice response; MD: mean difference; SD: standard deviation. | |||||
| GRADE Working Group grades of evidence | |||||
| aAdditional results are based on a narrative summary and synthesis of results that were not amenable to statistical analysis; please see Effects of interventions for detailed findings. | |||||
| ATCS versus control for smoking cessation | ||||||
| Patient or population: patients with tobacco dependence Comparison: usual care, control (no calls, 'placebo' (inactive) ATCS, self‐help intervention, stage‐matched manuals) | ||||||
| Outcomes | Illustrative comparative risks* (95% CI) | Relative effect | No of participants | Quality of the evidence | Commentsa | |
| Assumed risk | Corresponding risk | |||||
| Control | ATCS | |||||
| Behavioural outcome: smoking abstinence Multimodal/complex intervention, ATCS Plus, IVR versus (various) controls or usual care at median follow‐up of 12 months | Study populationb | RR 1.2 | 2915 | ⊕⊕⊝⊝ | ATCS Plus versus usual care 1 further study, Reid 2011 (N = 440), reported that ATCS Plus may improve smoking abstinence rates at 26 weeks, and this may be maintained at 52 weeks (low certainty evidencef). | |
| 201 per 1000 | 241 per 1000 | |||||
| Moderatec | ||||||
| 241 per 1000 | 289 per 1000 | |||||
| Behavioural outcome: medication use Multimodal/complex, ATCS Plus versus control (inactive IVR or self‐help booklet) | See comment | See comment | See comment | 1127 (2 studies) | ⊕⊕⊕⊝ Moderateg | Multimodal/complex intervention versus control (self‐help booklet) Brendryen 2008 (N = 396) found that a multimodal/complex intervention probably has little or no effect on adherence to NRT (moderate certainty evidence). ATCS Plus versus control (inactive IVR) Regan 2011 (N = 731) found that ATCS Plus probably has little or no effect on medication use (moderate certainty evidence). |
| Behavioural outcome: support programme enrolment ATCS Plus versus control (inactive IVR) | See comment | See comment | See comment | 521 (1 study) | ⊕⊕⊝⊝ | Carlini 2012 found that ATCS Plus may improve re‐enrolment into a quit line support programme. |
| Adverse outcome: unintended adverse events attributable to the intervention Multimodal/complex intervention, ATCS Plus, IVR versus various controls | No studies were found that reported adverse events. | |||||
| *The basis for the assumed risk (e.g. the median control group risk across studies) is provided in footnotes. The corresponding risk (and its 95% confidence interval) is based on the assumed risk in the comparison group and the relative effect of the intervention (and its 95% CI). ATCS Plus: automated telephone communication systems with additional functions; CI: confidence interval; IVR: interactive voice response; NRT: nicotine replacement therapy; OR: odds ratio; RR: risk ratio; | ||||||
| GRADE Working Group grades of evidence | ||||||
| aAdditional results are based on a narrative summary and synthesis of results that were not amenable to statistical analysis; please see Effects of interventions for detailed findings. | ||||||
| Dichotomous outcomes | ||||||||||
| Primary outcome | Study ID | Timing of outcome assessment (months) | Intervention group | Comparator group | Between group difference | Notes | ||||
| Observed (n) | Total (N) | Observed (n) | Total (N) | P value | Effect estimate (OR/RR/HR) | 95% CI | ||||
| IMMUNISATIONS | ||||||||||
| Immunisation uptake | 24 | 107 | 189 | 87 | 186 | — | 1.21 | 0.99 to 1.47 | — | |
| * | 270 | 314 | 273 | 429 | — | — | — | — | ||
| 3 | 146 | 5599 | 46 | 6383 | < 0.001 | 3.69 | 2.64 to 5.15 | Cluster RCT unadjusted for clustering. Approximate sample size calculations gave the following adjusted values: intervention 20/791; control 6/902; see Appendix 14 for calculations | ||
| 4 | 89 | 167 | 70 | 162 | 0.11 | — | 29.0 to 43.8 | CIs for % values and for IVR alone; P value from Chi2 | ||
| 1 | 1684 | 4636 | 955 | 3366 | < 0.01 | 1.28 | 1.20 to 1.37 | — | ||
| 13 | 305 | 763 | 259 | 763 | < 0.05 | — | — | — | ||
| 2 | 3 | 26 | 3 | 24 | — | — | — | — | ||
| 1 | 46 | 112 | 41 | 110 | — | 1.07 | 0.78 to 1.46 | — | ||
| 18 | 928 | 1496 | 873 | 1510 | 0.02 | — | — | — | ||
| 12 | 748 | 1423 | 651 | 1296 | < 0.05 | 1.3 | 1.0 to 1.7 | — | ||
| SCREENING | ||||||||||
| Screening rate | 6 | 191 | 225 | 90 | 225 | < 0.001 | — | — | — | |
| 6 | 801 | 8005 | 234 | 3005 | 0.0012 | 1.32 | 1.14 to 1.52 | |||
| 3 | — | 45,303 | — | 30,229 | — | — | 1.28 to 1.42a 0.11 to 0.17b | aWomen aged 50‐69 years bWomen aged 20‐49 years | ||
| 10 to 14 | 960 | 1355 | 574 | 847 | 0.014 | 1.32 | 1.06 to 1.64 | — | ||
| 12 | 55a 47b | 134a 163b | 23a 16b | 137a 160b | — | 3.44a 3.70b | 1.91 to 6.19a 1.93 to 7.09b | aBreast cancer screening; bColorectal cancer screening | ||
| 12 | 36a 24b | 158a 157b | 28a 19b | 157a 156b | > 0.05 | 1.4a 1.3b | 0.8 to 2.4a 0.7 to 2.5b | aBreast cancer screening; bColorectal cancer screening (both crude estimates) | ||
| 12 | 30a 43b | 101a 114b | 15a 21b | 90a 126b | 0.034a 0.0002b | 1.96a 3.22b | 0.87 to 4.39a 1.65 to 6.30b | aBreast cancer screening; bColorectal cancer screening | ||
| 12 | 385 | 1565 | 290 | 1558 | < 0.001 | — | — | |||
| 6 | 662 | 2943 | 474 | 2962 | < 0.001 | 1.31 | 1.10 to 1.56 | — | ||
| 9 | 19a 33b | 90a 198b | 17a 27b | 88a 199b | — | — | — | aBreast cancer screening; bColorectal cancer screening | ||
| 12 | 3192 | 10,432 | 3194 | 10,506 | 0.76 | 1.01 | 0.94 to 1.07 | In the adjusted model | ||
| 10 | 144 | 997 | 97 | 976 | 0.006 | 1.52 | 1.13 to 2.05 | In the adjusted model | ||
| APPOINTMENT REMINDERS | ||||||||||
| Reducing non‐attendance rates | 1 | 144 | 277 | 78 | 240 | < 0.05 | 1.60 | 1.29 to 1.98 | — | |
| 1.5 | 333a 169b | 794a 411b | 324a 164b | 790a 409b | > 0.05 | — | −6 to 5a −8 to 7b | aColonoscopy bFlexible sigmoidoscopy | ||
| 2 | 347 | 700 | 322 | 670 | > 0.05 | — | — | — | ||
| 4 | 2662 | 3219 | 2576 | 3350 | < 0.001 | 1.52 | 1.34 to 1.71 | — | ||
| 1.5 | 473 | 500 | 453 | 500 | < 0.001 | 3.41 | 1.87 to 6.20 | — | ||
| 6 | 257 | 407 | 235 | 456 | < 0.01 | 1.50 | — | — | ||
| 3 days | 652 | 701 | 617 | 701 | < 0.05 | 1.71 | — | — | ||
| ADHERENCE | ||||||||||
| Adherence to medications/laboratory tests | 2.5 | 16 | 25 | 12 | 25 | 0.003 | — | — | — | |
| 3 | 453 | 2199 | 298 | 1550 | 0.31 | 1.09 | 0.92 to 1.28 | At 8 weeks differences were not significant (P = 0.23) | ||
| 25 days | 177 | 267 | 53 | 237 | < 0.001 | 4.1 | 3.0 to 5.6 | — | ||
| 6 | 24 | 133 | 16 | 134 | 0.03 | — | — | — | ||
| 12 | 47 | 157 | 42 | 155 | > 0.05 | — | — | — | ||
| 2 weeks | 1180 | 4124 | 958 | 4182 | < 0.001 | — | — | — | ||
| 12 | 109 | 122 | 88 | 119 | 0.003 | — | — | — | ||
| 5 | 29 | 38 | 34 | 42 | 0.233 | — | — | After the mid‐study visit | ||
| 12 | — | 169 | — | 168 | 0.19 | — | — | — | ||
| 1 | 1096975 | 4153634 | 18395 | 84187 | < 0.001 | — | — | — | ||
| 3 to 6 | 3362 | 6833 | 1865 | 4172 | — | — | — | |||
| 2 weeks | 4318 | 15,356 | 3309 | 15,254 | < 0.001 | — | — | — | ||
| 6 | 70 | 137 | 55 | 143 | 0.041 | 0.60 | 0.37 to 0.96 | Primary composite outcome of adherence and adverse effects (emergency room visit and hospitalisation) | ||
| 12 | — | 600 | — | 600 | — | 0.93 | 0.71 to 1.22 | — | ||
| 6 | 178 | 253 | 148 | 244 | < 0.05 | 1.54 | 1.13 to 2.10 | — | ||
| 18 | — | 3171 | — | 3260 | 0.002 | — | 0.01 to 0.03 | P value and CIs for Δ change | ||
| 12 | — | 7247 | — | 7255 | 0.022 | — | 0.011 to 0.034 | P value and CIs for Δ change | ||
| HEART FAILURE | ||||||||||
| Heart failure hospitalisation | 10 ± 6 (median 11) | 17 | 67 | 58 | 66 | < 0.05 | — | — | — | |
| 12 | 4 | 32 | 17 | 50 | < 0.05 | — | — | This was a cluster outcome: "cardiovascular deaths and hospitalisations‐ which ever event occurred first" | ||
| All‐cause mortality | 10 ± 6 (median 11 ) | 5 | 67 | 7 | 66 | > 0.05 | — | — | — | |
| 6 | 92 | 826 | 94 | 827 | 0.86 | 0.97 | 0.73 to 1.30 | Death or readmission | ||
| 12 | 17 | 170 | 16 | 209 | 0.439 | 1.36 | 0.63 to 2.93 | — | ||
| Cardiac mortality | 10 ± 6 (median 11) | 2 | 67 | 6 | 66 | > 0.05 | — | — | — | |
| 12 | 3 | 32 | 5 | 50 | > 0.05 | — | — | Cluster outcome: "cardiovascular deaths and hospitalisations‐ which ever event occurred first" | ||
| SMOKING | ||||||||||
| Smoking abstinence | 12 | 74 | 197 | 48 | 199 | 0.02 | 1.91 | 1.12 to 3.26 | — | |
| 9 | 20 | 120 | 25 | 111 | — | — | — | — | ||
| 12 | 12 | 23 | 14 | 21 | 0.33 | — | — | — | ||
| 3 | 105 | 361 | 95 | 364 | 1.13 | 0.90 to 1.41 | — | |||
| 12 | 23 | 50 | 17 | 49 | 0.25 | 1.60 | 0.71 to 3.60 | — | ||
| 6 | 51 | 198 | 30 | 199 | 0.009 | 1.71 | 1.14 to 2.56 | — | ||
| 30 | 75 | 500 | 65 | 523 | — | — | — | For 6 month prolonged abstinence | ||
| Continous outcomes | ||||||||||
| Primary outcome | study ID | Timing of outcome assessment (months) | Intervention group | Comparator group | Between‐group difference | Notes | ||||
| Mean | Standard deviation of change (SD) or SD | Mean | Standard deviation of change (SD) or SD | Change | Confidence intervals | P values | ||||
| ALCOHOL CONSUMPTION | ||||||||||
| Drinks per drinking day | 2 | 3.5 | 1.8 | 4.7 | 3.2 | 1.38 | 1.12 to 1.70 | < 0.01 | CIs are for the effect size | |
| 2 | 4 | 0.4 | 4.3 | 0.4 | — | — | 0.45 | — | ||
| CANCER | ||||||||||
| Symptom severity | 1 | — | — | — | — | — | — | — | Effect size: intervention = 0.75; control = 0.68 | |
| 1.5 | 5.76 to 7.36 (range) | — | 5.55 to 7.44 (range) | — | 0.06 | — | 0.58 | — | ||
| 2.5 | 20.73 | — | 20.80 | — | — | — | > 0.05 | Effect size: intervention = 0.59; control = 0.56 | ||
| 2.5 | 11.6 | — | 11.0 | — | — | — | 0.02 | — | ||
| DIABETES | ||||||||||
| Glycated haemoglobin (%) | 3 | 7.87 | 1.09 | 7.82 | 1.14 | — | — | 0.89 | — | |
| 6 | 8.10 | 7.90 | — | — | — | > 0.05 | Median values | |||
| 3 | 9.1 | 1.9 | 8.6 | 1.3 | — | — | 0.41 | — | ||
| 12 | 9.0 | 2 | 9.9 | 2.2 | — | — | 0.02 | — | ||
| 6 | 7.0 | 1.4 | 7.3 | 1.5 | — | — | 0.04 | — | ||
| 12 | 8.1 | 1.15 | 8.2 | 1.18 | — | — | 0.3 | — | ||
| 12 | 8.7 | 1.9 | 9.0 | 2.2 | 0.1 | 0.5 to 0.4 | 0.8 | — | ||
| 6 | 7.9 | 1.2 | 8.7 | 1.8 | 0.91 | 0.86 to 0.93 | 0.002 | — | ||
| Serum blood glucose (mg/dL) | 12 | 180 | 9 | 172 | 10 | — | — | 0.6 | — | |
| 26 | 107.4 | 12.9 | 109.7 | 16.5 | — | — | 0.44 | — | ||
| Self‐monitoring of blood glucose | 3 | 1.9 | 1.07 | 1.3 | 0.75 | — | — | < 0.001 | — | |
| 6 | 0.05 | 0.387 | 0.08 | 0.365 | — | — | 0.457 | — | ||
| 12 | 4.6 | 0.1 | 4.4 | 0.1 | — | — | 0.05 | — | ||
| 12 | 4.3 | 2.6 | 3.3 | 2.9 | 0.8 | 0.1 to 1.5 | 0.03 | — | ||
| Self‐monitoring of diabetic foot | 12 | 4.6 | 0.1 | 4.4 | 0.1 | — | — | — | — | |
| 12 | 5.1 | 1.4 | 4.6 | 1.7 | 0.6 | 0.2 to1.0 | 0.002 | — | ||
| HYPERTENSION | ||||||||||
| Systolic Blood Pressure (mm Hg) | 3 | 136.4 | 83.5 | 138.9 | 81.5 | — | — | > 0.05 | — | |
| 6 | 123.8 | 14.2 | 128.6 | 19.4 | — | — | > 0.05 | — | ||
| 6 | 158 | * | 160.2 | * | −1.8 | — | 0.20 | — | ||
| 1 | 141.2 | 15.1 | 143.1 | 14.6 | — | < 0.001 | — | |||
| 6 | 137.4 | 19.4 | 136.7 | 17.0 | −0.7 | — | 0.006 | — | ||
| 6 weeks | 142.5 | 2.3 | 143.6 | 2.4 | −4.2 | −9.1 to 0.7 | 0.09 | — | ||
| Diastolic Blood Pressure (mm Hg) | 6 | 80.9 | — | 83.2 | — | — | — | 0.02 | — | |
| 6 | 74.6 | 8.5 | 79.5 | 14.0 | — | — | > 0.05 | — | ||
| 1 | 80.3 | 12.6 | 81.3 | 12.5 | — | — | < 0.001 | — | ||
| 6 | 82.9 | 12.9 | 81.1 | 11.7 | −2.3 | −4.9 to −0.2 | 0.07 | — | ||
| OBSTRUCTIVE SLEEP APNOEA SYNDROME (OSAS) | ||||||||||
| Continuous positive airway pressure (CPAP) use | 2 | 4.4 | — | 2.9 | — | — | — | 0.076 | — | |
| 12 | — | — | — | — | — | 1.18 to 2.48 | 0.004 | — | ||
| WEIGHT MANAGEMENT | ||||||||||
| BMI in adults | 18 | 36.54 | 2.01 | 36.84 | 1.90 | −0.35 | −0.75 to 0.06 | — | — | |
| 18 | 29.8 | 1.90 | 30.3 | 1.93 | −0.6 | −1.2 to −0.1 | 0.03 | — | ||
| 6 | 33.7 | 5.2 | 37.2 | 8.7 | — | — | 0.06 | — | ||
| BMI‐z scores in children | 12 | 1.95 | 0.04 | 1.98 | 0.03 | — | — | > 0.05 | — | |
| 3 | 1.9 | 0.28 | 1.9 | 0.3 | −0.03 | — | 0.48 | — | ||
| Analyses limited to primary outcomes from at least 2 studies from the same category. | ||||||||||
| Study ID | Study typea | Study subtypeb | Country | Sample size | Mean age (years unless stated otherwise) | Male (%) | Female (%) | Ethnicityc | Duration of condition | Comorbidities, medication | Incentives for participation | Incentives |
| P | Alcohol misuse | USA | 187 | 45 | 63 | 37 | White ‐ 54% Other ‐ 46% | — | — | Yes | Visa gift cards or checks (USD 50 per in‐person interview, USD 15 per phone interview). IG participants received USD 0.50 minimum for each daily call and USD 1.00 after seven consecutive calls | |
| P | I | USA | 1138 | — | — | — | — | — | — | — | — | |
| P | I | USA | 11,982 | 72 | — | — | — | — | — | — | — | |
| P | I | USA | 1227 | 2‐3 months | — | — | — | — | — | — | — | |
| P | I | USA | 3050 | 9 monthsd | 49 | 51 | Black ‐ 76% Hispanic ‐ 14% White ‐ 7% Other – 3% | — | — | — | — | |
| P | I | USA | 752 | 20 months | — | — | — | — | — | — | — | |
| P | I | USA | 8002 | — | 51 | 49 | Black ‐ 50% White ‐ 45% Other – 5% | — | — | — | — | |
| P | I | USA | 50 | 24 | 0 | 100 | Black ‐ 86% White ‐ 14% | — | — | Yes | USD 35 per month to help pay for cell phone service or a free, unlimited minutes cell phone until 6 weeks postpartum | |
| P | I | USA | 229 | 9 months | 52 | 48 | Black ‐ 90% Other – 7% Hispanic ‐ 3% | — | — | — | — | |
| P | I | USA | 3006 | — | 51 | 49 | Other – 41% Black ‐ 35% White ‐ 17% Hispanic ‐ 7% | — | — | — | — | |
| P | I | USA | 4115 | 14 | 50 | 50 | — | — | — | — | — | |
| P | Physical activity | USA | 71 | 57 | 0 | 100 | White ‐ 93% Other ‐ 7% | — | — | — | — | |
| P | Physical activity | USA | 181 | 69 | 99 | 1 | — | — | Mean (SD) number of comorbidities IG: 3.8 (1.5) CG: 3.9 (1.4) | Yes | USD 15 for completing each | |
| P | Physical activity | USA | 85 | 67 | 24 | 76 | Other ‐ 70% Black ‐ 30% | — | Mean co‐morbidities: 3 | — | — | |
| P | Physical activity | USA | 218 | 61 | 31 | 69 | White ‐ 90% Other ‐ 10% | — | — | — | — | |
| P | Physical activity | USA | 398 | 78 | 100 | 0 | White ‐ 77% Black ‐ 23% | — | Mean (SD) number of diseases IG: 5.2 (2.5) CG: 5.5 (2.7) | — | — | |
| P | Physical activity | USA | 302 | 67 | 97 | 3 | White ‐ 70% | — | Mean (SD) number of comorbidities IG: 4.2 (2.4) CG: 3.9 (2.4) | — | — | |
| P | Physical activity | USA | 298 | 46 | 28 | 72 | White ‐ 45% Black ‐ 45% Other ‐ 10% | — | — | — | — | |
| P | Physical activity | USA | 103 | 71 | 69 | 31 | — | — | Depression (unclear %) | — | — | |
| P | Screening | USA | 450 | 60 | 28 | 72 | Hispanic 87% Other‐ 13% | — | ≥ 1 long‐term conditions ‐ 68% | No | — | |
| P | Screening | USA | 11,010 | 61 | 54 | 46 | White ‐ 86% Other ‐ 14% | — | — | — | — | |
| P | Screening | Australia | 75,532 | — | 0 | 100 | — | — | — | — | — | |
| P | Screening | USA | 3547 | — | 0 | 100 | White ‐ 88% Black ‐ 11% Asian or Other ‐ 1% | — | — | — | — | |
| P | Screening | USA | 47,097 | 58 | 47 | 53 | — | — | — | — | — | |
| P | Screening | USA | 469 | — | 56 (for colorectal cancer) | 44 (for colorectal cancer) | White ‐ 61% Black ‐ 28% Latinos ‐ 5% Asian ‐ 5% | — | — | — | — | |
| P | Screening | USA | 1008 | — | 45 | 55 | White ‐ 48% Black ‐ 37% Other ‐ 15% | — | — | No | — | |
| P | Screening | USA | 366 | — | — | — | White ‐ 50% Black ‐ 41% Other (including Hispanic) ‐ 9% | — | — | — | — | |
| P | Screening | USA | 4685 | 57 | 0 | 100 | — | — | Anticonvulsants ‐ 6% Corticosteroids ‐ 4% COPD (unclear %) Oophorectomy ‐ 3% | — | — | |
| P | Screening | USA | 6000 | 60 | 50 | 50 | White ‐ 93% Other ‐ 7% | — | Obesity ‐ 40% | — | — | |
| P | Screening | USA | 685 | 58 | 38 | 62 | Non‐Hispanic white ‐ 78% Black ‐ 13% Other ‐ 9% | — | — | — | — | |
| P | Screening | USA | 20,936 | 57 | 47 | 53 | White ‐ 86% Other ‐ 9% Black ‐ 5% | — | — | — | — | |
| P | Screening | USA | 1973 | 69 | 8 | 92 | — | — | Use of oral glucocorticoids ‐ 22% Fractures ‐ 12% | — | — | |
| P | Stress management | USA | 100 (caregiver) | 63 (caregiver) | 22 (caregiver) | 78 (caregiver) | Black ‐ 64% Hispanic ‐ 21% White ‐ 15% Other ‐ 1% | — | — | — | — | |
| P | Substance use | USA | 33 | 46 | 76 | 24 | White ‐ 64% White ‐ 15% Hispanic ‐ 21% | — | HIV medication ‐ 64% Hepatitis A, B, or C ‐ 49% | Yes | USD 20 gift certificates for each assessment | |
| P | Weight management | USA | 365 | 55 | 31 | 69 | Black ‐ 71% Hispanic ‐ 13% White ‐ 4% Other ‐ 2% | — | Cholesterol medication ‐ 36% Diabetes medication ‐ 30% Mean BMI ‐ 37 kg/m2 | Yes | USD 50 reimbursement at the first 3 follow‐up visits and USD 75 at 24 months | |
| P | Weight management | USA | 194 | 35 | 0 | 100 | Black ‐ 100% | — | Hypertension ‐ 36% Metabolic syndrome ‐ 31% Depression ‐ 22% Diabetes mellitus ‐ 7% | Yes | Reimbursements of USD 50 each at baseline and at all follow‐up study visits | |
| P | Weight management | USA | 77 | 59 | 29 | 71 | White ‐ 68% Hispanic ‐ 18% Other ‐ 7% Black ‐ 4% Asian ‐ 3% | — | — | — | — | |
| P | Weight management | USA | 220 | 11 | 54 | 46 | White‐ 63% Hispanic ‐ 26% Other ‐ 11% | — | — | — | — | |
| P | Weight management | Greece | 122 | 44 | 12 | 88 | — | — | Hypertension ‐ 13% Diabetes mellitus ‐ 2% | — | — | |
| P | Weight management | USA | 140 | — | — | — | — | — | — | — | — | |
| P | Weight management | USA | 50 (child) | 10 (child) 40 (parent) | 58 (child) 4 (parent) | 42 (child) 96 (parent) | Black ‐ 72% Other ‐ 22% White ‐ 6% (parent) | — | BMI (child) ‐ 25.7 kg/m2 BMI (parent) ‐ 34 kg/m2 | Yes | For completing assessments (USD 40 parents; USD 10 child) | |
| E | Appointment reminder | USA | 517 | — | — | — | — | — | — | — | — | |
| E | Appointment reminder | USA | 3610 | 63 | 95 | 5 | White ‐ 83% Other ‐ 16% Hispanic ‐ 1% | — | — | — | — | |
| E | Appointment reminder | USA | 2304 | 29 | — | 100 | Hispanic ‐ 66% Black ‐ 19% White ‐ 13% Other ‐ 2% | — | — | — | — | |
| E | Appointment reminder | USA | 12,092 | 56 | 43 | 57 | — | — | — | — | — | |
| E | Appointment reminder | UK | 1000 | — | 33 | 67 | — | — | — | — | — | |
| E | Appointment reminder | USA | 2008 | 19d | 54 | 46 | Spanish‐speaking ‐ 39% Vietnamese‐speaking ‐ 28% English‐speaking ‐14% Other – 13% Tagalog‐speaking Filipino – 6% | — | — | — | — | |
| E | Appointment reminder | USA | 701 | < 12e | 45 | 55 | English‐speaking ‐ 59% Spanish‐speaking ‐ 29% Vietnamese‐speaking ‐ 3% Other – 9% | — | — | — | — | |
| M | Illicit drugs addiction | USA | 36 | 41 | 58 | 42 | White ‐ 58% Black ‐ 28% Other – 14% | On methadone treatment mean = 21.7 | — | Yes | USD 20 per week for completing weekly assessments and providing a urine sample | |
| M | Alcohol consumption | Sweden | 1423 | — | — | — | — | — | — | — | — | |
| M | Alcohol consumption | USA | 254 | 46 | 78 | 22 | Black ‐ 49% Hispanic ‐ 45% Other – 6% | 12.8y | HIV/AIDS (unclear %) | Yes | USD 20; USD 40 at last 2 post‐treatment follow‐ups | |
| M | Alcohol consumption | USA | 338 | 46 | 64 | 36 | White ‐ 97% | Currently dependent ‐ 67% | — | Yes | USD 30 for the | |
| M | Alcohol consumption | USA | 110 | 49 | 58 | 42 | White ‐ 86% Black ‐9%, Hispanic‐3% Other‐2% | Mean of 1.2 (SD 2.4) | — | Yes | The possible total incentive was USD 50.00 per week | |
| M | Alcohol consumption | USA | 60 | 42 | 55 | 45 | White ‐ 95% Black ‐5% | 52.3 heavy drinking days within past 3 months | — | Yes | Patients were paid USD 75 for the 30‐day follow‐up, USD 125 for the 90‐day follow‐up, and USD 200 for the 180‐day follow‐up | |
| M | Alcohol consumption | USA | 158 | 49 | 53 | 47 | — | Regular alcohol use mean = 17.94 years | — | Yes | USD 25 for each interview | |
| M | Alcohol consumption | USA | 47 | 57 | 60 | 40 | Caucasian ‐ 83% African‐American ‐ 13% | — | — | — | — | |
| M | Alcohol consumption | USA | 98 | 46 | 91 | 9 | White ‐ 45% Black ‐ 40% Native American ‐ 7% Other ‐ 6% Hispanic ‐ 2% | — | — | Yes | USD 25.00 each for the baseline and for the follow‐up assessments | |
| M | Asthma | USA | 6948 | 52 | 35 | 65 | White ‐ 92% Other ‐ 8% | — | Beta agonist ‐ 55% Oral steroids ‐ 46% COPD ‐ 33% | — | — | |
| M | Asthma | Australia | 121 | 7 | 53 | 47 | — | — | — | — | — | |
| M | Cancer | USA | 79 | 60 | 53 | 47 | White ‐ 85% Black ‐ 15% | — | — | — | — | |
| M | Cancer | USA | 405 | 59 | 32 | 68 | White ‐ 80% Black‐ 18% Other ‐ 2% | — | Depression ‐ 76% Pain ‐ 68% | — | — | |
| M | Cancer | USA | 250 | 55 | 24 | 76 | White/Caucasian ‐ 91% Other ‐ 9% | — | — | — | — | |
| M | Cancer | USA | 239 | 58 | 50 | 50 | White ‐ 89% Black‐ 6% Hispanic ‐ 4% Other 1% | Mean (SD) time since cancer diagnosis‐ IG: 36 months (35) CG: 26 months (32) | Mean (SD) symptoms (out of 13) IG: 3.4 (2.2) CG: 4.0 (2.4) | — | — | |
| M | Cancer | USA | 437 | 57 | 25 | 75 | — | — | Mean comorbidities: 2 | — | — | |
| M | Cancer | USA | 119 | 60 | 31 | 69 | White ‐ 76% Asian ‐ 17 % Black ‐ 7% | — | Capecitabine ‐ 35% Erlotinib ‐ 24% Lapatinib ‐ 9% Imatinibf ‐ 8% Temozolomide ‐ 6% Sunitinib ‐ 5% | — | — | |
| M | Cancer | USA | 253 | 61 | 49 | 51 | White ‐ 58% Black ‐ 36% Other ‐ 6% | — | Planned single chemotherapy ‐ 9% Planned combination chemotherapy ‐ 90% | — | — | |
| M | Chronic pain | USA | 250 | 55 | 83 | 17 | White ‐ 77 % | ≤ 5 years = 29% 6‐10 years = 19% > 10 years = 52% | Major depression‐ 24% Post‐traumatic stress disorder‐ 17% | — | — | |
| M | Chronic pain | USA | 55 | 46 | 14 | 86 | White ‐ 96% Other ‐ 4% | — | — | — | — | |
| M | COPD | UK | 79 | 69 | 74 | 26 | — | — | SABA ‐ 75% LAMA ‐ 43% LABA/ICS ‐ 43% ICS ‐ 33% SAMA ‐ 32% Oral steroids ‐ 25% LABA ‐ 18% | — | — | |
| M | Adherence | USA | 475 | 5 (child) 35 (parent) | 52 (child) 7 (parent) | 48 (child) 93 (parent) | Black ‐ 67% (child) 47% (parent); Other – 33% (child) 53% (parent) | — | — | Yes | Gift cards | |
| M | Adherence | USA | 50 | 42 | 36 | 64 | White ‐ 58% Black ‐ 20% Hispanic ‐ 18% Asian ‐ 4% | — | — | Yes | USD 25 for each completed visit | |
| M | Adherence | USA | 1187 | — | — | — | — | — | — | — | — | |
| M | Adherence | USA | 70 | 66 | 49 | 51 | African American ‐ 58% European ‐ 32% Asian ‐ 6% Hispanic ‐ 3% Middle Eastern ‐ 1% | Median 5 years in IG; 4.5 years in CG | Bimatoprost ‐ 11.5% Travoprost ‐ 17.5% Latanoprost ‐ 71.5% Bilateral medication ‐ 70% | — | — | |
| M | Adherence | USA | 1393 | — | — | — | — | — | — | — | — | |
| M | Adherence | USA | 13,057 | 51 | 54 | 46 | Other ‐ 48 % White ‐ 23% Hispanic ‐ 14% Black ‐ 10% Asian ‐ 5% | — | — | — | — | |
| M | Adherence | USA | 5216 | 56 | 49 | 51 | Hispanic ‐ 30% White ‐ 28% Unknown ‐ 23% Black ‐ 10% Asian and Pacific Islander ‐ 7.1% Other ‐ 1.7% Native American‐ 0.2% | — | Mean low‐density lipoproteins = 146 mg/dL | — | — | |
| M | Adherence | USA | 961 | 59 | 47 | 53 | — | — | Statins ‐ 32% Depression ‐ 11% | — | — | |
| M | Adherence | USA | 267 | 77 | 23 | 77 | Other ‐ 89 % Black: 11% | — | Other – 81% Heart disease ‐ 32% Diabetes mellitus ‐ 18% Stroke ‐ 7% | — | — | |
| M | Adherence | USA | 312 | 63 | 62 | 38 | Black ‐ 91% White ‐ 9% | — | — | Yes | USD 25 gift card | |
| M | Adherence | USA | 8306 | — | — | — | — | — | — | — | — | |
| M | Adherence | USA | 241 | 64 | 98 | 2 | White ‐ 78% | — | Hypertension ‐ 91% Hyperlipidaemia ‐ 85% Diabetes mellitus ‐ 45% Chronic kidney disease ‐ 23% Chronic lung disease ‐ 20% Prior heart failure ‐ 12% Peripheral arterial disease ‐ 10% Cerebrovascular disease ‐ 7% | — | — | |
| M | Adherence | USA | 16 | 71 | 31 | 69 | — | — | — | Yes | USD 25 for participating | |
| M | Adherence | USA | 80 | 66 | 51 | 49 | White ‐ 62% African‐American ‐ 10% Hispanic/Latino ‐ 9% Asian ‐ 9% East Indian ‐ 6% | Mean IG: 25.79 months; CG: 22.1 months | Number of medical problems: IG: 3.43 CG: 3.32 | — | — | |
| M | Adherence | USA | 337 | 57 | 30 | 70 | Black ‐ 100% | — | BMI ‐ 34.4 kg/m2 Diabetes ‐ 38% Stroke ‐ 7.5% | — | — | |
| M | Adherence | USA | 4,237,821 | 56 | 38.5 | 61.5 | — | — | Correspondence with the author: "All participants were on maintenance medications" | — | — | |
| M | Adherence | USA | 27 | 80 | — | — | — | — | Participants had cognitive (memory) impairment and were on donepezil, rivastigmine, or galantamine | — | — | |
| M | Adherence | USA | 15,051 | 57 | 53 | 47 | — | — | — | — | — | |
| M | Adherence | USA | 30,610 | — | — | — | — | — | — | — | — | |
| M | Adherence | Canada | 331 | 63 | — | — | — | — | — | — | — | |
| M | Adherence | USA | 1200 | 51 | 62 | 38 | Other ‐ 95% Black ‐ 5% | — | Insulin ‐ 19.4% (participants) | — | — | |
| M | Adherence | USA | 497 | 54 | 38 | 62 | — | — | Lipitor – 54% Zocor – 16% Other statin – 16% | — | — | |
| M | Adherence | USA | 647 | — | — | — | — | — | — | — | — | |
| M | Adherence | USA | 8517 | 54 | 34 | 66 | White ‐ 50% Other – 26% Asian ‐ 11% Mixed – 7% Native Hawaiian/Pacific Islander ‐ 4% Black ‐ 2% American Indian/Alaskan Native – 1% | — | COPD ‐ 33% | — | — | |
| M | Adherence | USA | 21,752 | 64 | 53 | 47 | White ‐ 47% Asian ‐ 17% Black ‐15% Native Hawaiian/Pacific Islander ‐ 11% Black ‐ 2% American Indian/Alaskan Native – 1% | — | Diabetes mellitus ‐ 78% CVD ‐ 36% Statin only ‐ 40% ACEI/ARB only ‐ 25% Statin and ACEI/ARB ‐ 35% low‐density lipoproteins among statin users (mean) = 93.4 mg/dL | — | — | |
| M | Diabetes mellitus | USA | 119 | 62 | 55 | 45 | White ‐ 77% Other – 23% | — | — | Yes | USD 25 | |
| M | Diabetes mellitus | USA | 80 | 30 | 0 | 100 | White ‐ 41% Black ‐ 34% Hispanic ‐ 18% Asians or others ‐ 7% | — | BMI ‐ 34.1 kg/m2 | — | — | |
| M | Diabetes mellitus | USA | 98 | 59 | 40 | 60 | Black ‐ 65% White ‐ 30% Other ‐ 3% Hispanic ‐ 1% Asian ‐ 1% | — | Other antidiabetic medications + insulin ‐ 80% Basal‐bolus regimen ‐ 40% Long‐acting insulin only ‐ 33% Mixed insulin only ‐ 17% Short‐acting insulin only ‐ 10% | — | — | |
| M | Diabetes mellitus | USA | 75 | 52 | 59 | 41 | Hispanic ‐ 100% | — | — | Yes | USD 10 for initial visit and USD 20 incentive card at the follow‐up | |
| M | Diabetes mellitus | USA | 100 | — | — | — | — | — | Psychiatric illness ‐ 46% Had been hospitalised over the past year ‐ 28% | — | — | |
| M | Diabetes mellitus | USA | 417 | 53 | 38 | 62 | Hispanic ‐ 100% | — | — | — | — | |
| M | Diabetes mellitus | USA | 248 | 55 | 41 | 59 | Hispanic ‐ 50% White ‐ 29% Other – 21% | — | BMI ‐ 33.7 kg/m2 Mean comorbidities: 1 | — | — | |
| M | Diabetes mellitus | USA | 272 | 61 | 97 | 3 | White ‐ 60% Black ‐ 18% Hispanic ‐ 12% Other ‐ 10% | — | BMI ‐ 31 kg/m2 Mean comorbidities: 2 | — | — | |
| M | Diabetes mellitus | USA | 339 | 56 | 43 | 57 | Hispanic ‐ 47% Asian ‐ 22% Black ‐ 20% White ‐ 8% Other ‐ 2% | — | BMI: 31 kg/m2 | Yes | USD 15 and USD 25 for the baseline and 1‐year follow‐up visits, respectively | |
| M | Diabetes mellitus | Australia | 120 | 57 | 63 | 37 | — | — | Low depression – 73% Intermediate depression – 23% High depression – 4% Low anxiety – 89% Intermediate anxiety – 8% High anxiety – 3% BMI ‐ 33 kg/m2 Insulin – 43% | — | — | |
| M | Heart failure | Italy | 133 | 57 | 88 | 12 | — | — | Diuretics ‐ 89% ACE inhibitors ‐ 84% Carvedilol ‐ 50% Nitrates ‐ 40% Digitalis ‐ 33% K + saver ‐ 21% | — | — | |
| M | Heart failure | USA | 1653 | 61d | 58 | 42 | White ‐ 49% Black ‐ 39% Other – 12% (inclusive of Hispanic or Latino – 3%) | — | Beta‐blocker – 79% Loop diuretic – 78% Hypertension ‐ 77% ACE inhibitor or ARB – 70% Coronary artery disease ‐ 50% Diabetes mellitus ‐ 47% Chronic kidney disease ‐ 46% Aldosterone‐receptor antagonist – 33% Digoxin – 25% COPD ‐ 21% | No | — | |
| M | Heart failure | Australia | 405 | 73 | 63 | 37 | — | — | Diuretics ‐ 80% Heart failure specific beta‐blockers ‐ 61% Systolic heart failure ‐ 60% ACE inhibitors ‐ 57.5% Diabetes mellitus ‐ 30.5% Aldosterone antagonist ‐ 26% ARB ‐ 25% Diastolic heart Internal cardio defibrillator ‐ 4.5% | — | — | |
| M | Heart failure | France | 138 | 68 | 79 | 21 | — | — | Loop diuretic – 92% ACE/AT2– 79% Beta‐blocker – 79% Spironolactone – 29% Digoxin – 9% (mean values) | — | — | |
| M | HIV | India | 631 | — | 57 | 43 | Asian ‐100% | — | Zidovudine‐based antiretroviral treatment – 44% Tenofovir‐based antiretroviral treatment – 44% Stavudine‐based antiretroviral treatment – 12% | Yes | Mobile phone plus wage compensation | |
| M | Hypercholestorolaemia | USA | 115 | 48 | 25 | 75 | White ‐ 87% Other – 13% | — | — | — | — | |
| M | Hypercholesterolaemia | USA | 123 | 57 | 25 | 75 | Black ‐ 77% Other – 23% | — | Mean BMI ‐ 31 kg/m2 | — | — | |
| M | Hypertension | USA | 241 | 60 | 21 | 79 | Black ‐ 81% White‐ 15% Hispanic ‐ 3% Other ‐ 1% | — | Hyperlipidaemia ‐ 46% Diabetes ‐ 32% | — | — | |
| M | Hypertension | USA | 253 | 58 | 27 | 73 | Black ‐ 100% | — | — | — | — | |
| M | Hypertension | USA | 64,773 | 61 | 46 | 54 | White ‐ 41%, Hispanic ‐ 25% Black ‐ 17% Other – 9% Asian ‐ 8% | — | Cardiovascular disease ‐ 38% Diabetes mellitus ‐ 27% Chronic kidney disease ‐ 10% | — | — | |
| M | Hypertension | USA | 283 | 66 | 65 | 35 | White ‐ 65% Other – 18% Hispanic ‐ 17% | — | Diabetes mellitus or chronic kidney disease – 55% | Yes | Clinically validated electronic blood pressure cuffs were provided at no cost to those who did not own one | |
| M | Hypertension | Honduras; Mexico | 200 | 58 | 33 | 67 | — | — | Blood pressure medication – 83% Diabetes mellitus ‐ 23% BMI ‐ 30.7 kg/m2 | — | — | |
| M | Mental health | USA | 164 | 39 | 24 | 76 | White ‐ 56% Black ‐ 32% Other – 12% | — | — | — | — | |
| M | Mental health | USA | 218 | 39 | 58 | 42 | White ‐ 93% Other – 7% | — | Social phobia ‐ 9%, Generalised anxiety disorder ‐8% Simple phobia – 6% Major depression – 2% Dysthymia – 2% | — | — | |
| M | Mental health | USA | 73 | 54 | 18 | 82 | Other – 74% Hispanic – 26% | — | — | — | — | |
| M | OSAS | USA | 30 | 46 | — | — | — | — | BMI ‐ 38 kg/m2 | — | — | |
| M | OSAS | USA | 250 | 55d | 82 | 18 | — | — | BMI ‐ 35.1 kg/m2 | — | — | |
| M | Smoking | Norway | 396 | 36 | 47 | 53 | — | — | — | Yes | All participants in both groups received a sample packet of nicotine replacement therapy products. | |
| M | Smoking | USA | 521 | 36 | 36 | 64 | White ‐ 81% Black ‐ 6% Other – 5% Hispanic/Latino ‐ 4% Native American – 3% Asian ‐ 1% | — | ≥ 1 long‐term conditions ‐ 47% | No | — | |
| M | Smoking | USA | 332 | 30 | 0 | 100 | White ‐ 61% Black ‐ 16% Hispanic ‐ 15% Other – 8% | — | — | — | — | |
| M | Smoking | Canada | 44 | 53 | 67 | 33 | — | Mean cigarettes/d: intervention ‐ 18.5 control ‐ 17.3 | — | — | — | |
| M | Smoking | Taiwan | 116 | 20 | 92 | 8 | Asian ‐ 100% | — | — | Yes | Equivalent of USD 6 | |
| M | Smoking | USA | 731 | 52 | 56 | 44 | — | — | — | — | — | |
| M | Smoking | Canada | 100 | 54 | 68 | 32 | — | — | Acute coronary syndrome ‐ 83% | — | — | |
| M | Smoking | Canada | 440 | — | — | — | — | — | — | — | — | |
| M | Smoking | USA | 397 | 53 | 48 | 52 | White ‐ 81% Hispanic ‐ 6% Black ‐ 4% Other/unknown ‐ 4% Native American ‐ 3% Asian/Pacific Islander ‐2.5% | Mean cigarettes/d: IG = 17.1 CG = 16.3 | Depressive symptoms (mean) IG = 9.3 CG = 10.3 | Yes | USD 50 for a saliva sample | |
| M | Smoking | USA | 2054 | 51 | 77 | 23 | White ‐ 89%, Black ‐ 5%, Other ‐ 4% Native American ‐ 2% | Mean cigarettes/d IG = 23.85 CG = 25.18 | — | — | — | |
| M | Spinal cord dysfunction | USA | 142 | 48 | 61 | 39 | White ‐ 80% (inclusive of Hispanic or Latino – 7%) Black ‐ 11% Other ‐ 9% | 11.7 y | Depression – 39% Pressure ulcers ‐ 7% | — | — | |
| aStudy type: P: prevention; M: management; E: either. cPlease note that for reporting of participants' ethnicity, the terms used by authors of the included studies have been used in each case and are cited directly from each of the included studies. | ||||||||||||
| Study ID | ATCSa | Contentb | Theoryc | BCTsd | Received instructions? | Callere | Telephone keypadf | Toll free | Study duration | Call durationg | Frequencyh | Intensity i | Speaker | Security arrangementj |
| IVR | AF | — | 1 | — | P | Other | — | 25 months | 29.3 min | — | — | Synthetic speech | — | |
| ATCS Plus | AF,SF | MI | 9, 25, 40 | Yes | E | Yes | Yes | 2 months | 1‐3 min | Daily | — | — | — | |
| IVR | AF | — | 25 | — | — | — | — | 1.5 months | — | — | < 500 words | — | — | |
| Unidirectional¹ | AF | TCD | 1, 42 | No | H | — | — | 6 months | — | 2 | 92 words | — | — | |
| IVR | AF | HBM | 20, 21, 42 | — | H | Yes | Yes | 2.5 months | < 5 min | 2 | — | — | — | |
| IVR | AF | — | 20,21 | — | — | — | — | 24 months | — | — | — | — | — | |
| ATCS Plus | AF, CF | SCT, TRA, TTM | 3, 9, 12, 13, 17, 20, 21, 25, 33, 39, 40, 42 | — | — | — | — | 24 months | — | — | — | — | — | |
| ATCS Plus¹ | AF, CF | SCT, TRA, TTM, MI | 3, 9, 12, 13, 17, 20, 21, 25, 33, 39, 40, 42 | — | H | — | — | 12 months | 2–4 min | Weekly | — | — | — | |
| IVR | AF | — | 29,42 | — | H | Yes | — | 3 months | — | Daily | 51 words | — | Reminder information was sent securely to Memotext¹ | |
| ATCS Plus¹ | AF, CF, SF | — | 9,10,42 | Yes | P | Yes¹ | Yes | 6 months | — | Biweekly | — | — | Password and log‐in | |
| ATCS Plus¹ | AF, SF | CBT, SCT, MI, SRT, SCL, RP | 3,12, 20,27, 34, 39 | Yes | P | Yes | — | 24 months | — | Twice daily then biweekly¹ for 6 weeks | — | Personal pronouns and active voice | — | |
| ATCS Plus | AF, CF | — | 20, 42 | Yes | P | Yes | Yes | 12 months | — | Daily | — | — | PIN² | |
| ATCS Plus | AF, CF | — | 3 | — | H | Yes | Yes | 4 months | — | — | — | — | — | |
| ATCS Plus | AF, CF | — | 20, 42 | Yes | P | Yes | Yes | 6 months | — | Daily | — | — | — | |
| ATCS Plus | AF, SF | — | 21 | Yes | H | Yes | — | 1 month | 4 weeks | Biweekly | — | — | — | |
| IVR | AF | — | 1,42 | — | H | — | — | 12 months | 5 min¹ | 1 | — | — | — | |
| ATCS Plus | AF, CF | — | 3, 27, 39 | Yes | H | Yes | — | 6 months | — | — | — | — | — | |
| ATCS Plus | AF, CF | — | 29,42 | — | H | Other | — | 12 months | — | ≤ 3 | — | — | — | |
| ATCS Plus | AF, CF | TTM, SCT, PST | 3,10 | Yes | E | — | — | 3 months | 15‐30 s² | Twice daily | — | — | — | |
| IVR | AF | TTM, SCT | 1,9 | — | H | — | — | 3 months | 10 min | Weekly | — | Pre‐recorded human speech | — | |
| IVR | AF | HBM¹ | 27, 42 | — | H | Yes | — | 24 months | 69 s | Average ‐ 3 | 224 words | Female voice | Verification³ | |
| IVR | AF | — | 3, 18, 20, 40, 42 | Yes | P | Yes | — | 2 months | — | 3‐day call², weekly | — | — | Password protected⁴ | |
| ATCS Plus | AF, SF | — | 40, 42 | — | H | Yes | Yes | 6 months | 40 s | 1 | 100 words | — | PIN⁵ | |
| ATCS Plus | AF, SF | — | 40, 42 | — | H | — | Yes | 3 months | 40 s | 1 | — | — | — | |
| Unidirectional | AF | — | 40 | No | H | — | — | 1 months | — | 1 | — | — | — | |
| Unidirectional | AF | — | 42 | No | H | — | — | 36 months | — | 1³ | — | — | — | |
| Unidirectional¹ | AF | TTM | 9,10,40 | — | H | — | — | 10 months | — | — | Approx 30 words | Nurse | — | |
| IVR | AF | — | 42 | — | H | — | — | 2 weeks | — | 1‐2 attempts | — | — | — | |
| IVR | AF | TTM | 20, 39 | Yes | P | Yes | Yes | 34 weeks | 5 min | — | — | Professional | Password protected⁴, PIN² | |
| IVR | AF | — | 3, 9 | Yes | — | — | — | 3 months | 1‐10 min³ | Weekly | — | — | — | |
| ATCS Plus | AF, CF | GM | 2, 3, 9, 15, 20 | — | E | — | — | 12 months | — | 10 | — | — | — | |
| IVR | AF | — | 3, 6, 20, 30, 39, 42 | Yes | E | Yes | Yes | 6 months | 30‐90 min² | Monthly | — | Female voice actor | Password protected⁴ | |
| IVR | AF | — | 39, 42 | — | — | — | — | 25 days | — | — | — | — | PIN⁶ | |
| ATCS Plus¹ | AF, CF | — | 20,42 | — | H | — | — | 26 weeks | — | Up to 4 | — | — | — | |
| Unidirectional | AF | — | 29,30 | — | H | — | — | 12 months | — | 2 | — | — | — | |
| Unidirectional | AF | — | 40,42 | No | H | — | — | — | — | — | — | — | — | |
| IVR | AF | SCT | 21, 32, 35, 39 | — | E | Yes | Yes | 6 months | 4 min | Weekly | — | — | Password protected⁴ | |
| IVR | AF | — | 3,16 | — | E | Other | — | 9 months | — | 12 | — | — | — | |
| IVR | AF | — | 1, 10, 20, 21, | Yes | — | — | — | 6 months | 15 min | Weekly | — | — | — | |
| IVR | AF | HBM | 3, 7, 20, 21, 42 | — | H | — | — | 12 months | > 1 min | Daily | — | Trained actor | PIN⁷ | |
| IVR | AF | — | 16 | — | H | Yes | — | — | — | — | — | — | — | |
| ATCS Plus | AF, SF | BT | 34 | — | E | Yes | — | 3 months | 8.6 min¹ | 12 | — | — | — | |
| ATCS Plus | AF, CF | HBM, SMP | 3, 7, 27, 30, 40 | — | H | — | — | 6W | — | 1 | — | — | — | |
| ATCS Plus | AF, CF, SF | — | 21, 40, 42 | Yes | H | — | — | 4 months | — | Daily, 4⁴ | — | — | — | |
| Unidirectional | AF | — | 20,42 | — | H | — | — | 1 month | — | — | 80 words | — | — | |
| ATCS Plus | AF, CF, SF | MI | 9,12 | Yes | P | — | Yes | 12 months | 60 days | Daily | 1‐3 min | — | — | |
| ATCS Plus | AF,CF | — | 20,34 | Yes | P | Yes | Yes | 6 months | 2 min | Daily | — | — | — | |
| ATCS Plus¹ | AF, CF | — | 20,42 | — | H | — | — | 25 weeks | 25 s | Up to 4 | — | — | — | |
| Unidirectional | AF | — | 16 | — | H | — | — | 3 months | 1 min | Monthly | 2 30‐s scripts | — | — | |
| ATCS Plus | AF, CF | — | 16 | — | H | — | — | 3 months | 4‐5 min | 1 | — | — | — | |
| ATCS Plus¹ | AF, CF | — | 20,42 | — | H | — | — | 12 months | — | Monthly⁵ | — | — | — | |
| IVR | AF | — | 21 | Yes | P | Yes | Yes | 26 months | — | Weekly | 45 s of speaking | — | PIN² | |
| IVR | AF | TTM, SCT | 4,20,21 | Yes | H | — | — | 6 months | 4.12 min | Weekly | 12.4 calls¹ | Digitised | — | |
| IVR | AF | — | 20, 39, 42 | — | E | Yes | — | 6 months | — | Daily | — | — | — | |
| ATCS Plus | AF, CF | SCT | 20, 39, 42 | — | E | Yes | — | 6 months | 2‐3 min | Biweekly | — | — | — | |
| IVR | AF | TTM | 7, 9, 20, 39 | Yes | P | Yes | — | 3 months | — | Weekly | — | — | Password protected⁴ | |
| ATCS Plus | AF,CF, SF | — | 16,21,30 | — | E | — | — | 6 months | — | Daily | — | — | — | |
| ATCS Plus | AF, SF | — | 20 | Yes | H | Yes | — | 3 months | — | 2.2/week | 26 calls¹ | Female voice | — | |
| ATCS Plus | AF, CF | — | 20,29,30 | — | H | — | — | 12 months | ≤ 10 min | Weekly | — | — | — | |
| IVR | AF | SCT, TTM | 3, 9, 20, 39 | Yes | H | Yes | — | 12 months | 10‐15 min | Weekly⁶ | — | — | — | |
| ATCS Plus¹ | AF, CF | TCM | 39 | — | E | — | — | 12 months | — | Biweekly, weekly, bimonthly, monthly⁷ | — | — | — | |
| ATCS Plus¹ | AF, CF | — | 21,39 | — | H | — | — | 12 months | — | Weekly⁸ | — | — | — | |
| ATCS Plus | AF, CF, SF | — | 20,21,42 | — | E | Yes | — | 12 months | — | Monthly | 18 questions | — | — | |
| IVR | AF | — | 39 | No | P | Yes | — | 24 months | 48 s¹ | Weekly | — | — | — | |
| ATCS Plus | AF, SF | — | 40, 42 | — | H | — | — | 24 months | — | — | — | — | — | |
| IVR | AF | — | 20,42 | Yes | H | Yes | — | 2 weeks | — | — | 3 segments | Personalised voice messages | — | |
| IVR | AF | — | 42 | — | H | — | — | 4 months | 96.8 s | — | — | — | — | |
| Unidirectional | AF | — | 42 | — | H | — | — | 5 months | — | Monthly | — | — | — | |
| Unidirectional | AF | — | 42 | — | H | — | — | 5 months | — | 2/d⁹ | — | — | — | |
| ATCS Plus | AF,SF | CBT | 3,20,34,38 | — | H | Yes | — | 12 weeks | 2.5 min | 8/d¹⁰ | — | — | — | |
| ATCS Plus | AF, CF | — | 21 | — | — | — | — | 15 months | 90 s | Monthly | — | — | — | |
| ATCS Plus¹ | AF, CF | — | 20, 21, 25, 42 | Yes | P | Yes | — | 6 months | 5‐10 min | Weekly | — | — | — | |
| ATCS Plus | AF, SF | PT, PM | 3, 13, 25, 39, 42 | Yes | P | Yes | Yes | 18 months | 18 min | — | 22 h/d² | Professional radio announcer | Password protected⁴ | |
| Unidirectional | AF | — | 40 | No | H | — | — | 2 months | — | — | — | — | — | |
| IVR | AF | — | 20, 21, 25, 34, 42 | — | H | Other | — | 24 months | 3‐5 min | Biweekly | — | — | — | |
| IVR | AF | SCT, TTM, MI | 25, 39 | Yes | — | Yes | Yes | 8 months | — | Weekly | — | African – American voice professionals | — | |
| ATCS Plus | AF, SF, CF | — | 21 | — | P | Yes | Yes | 1.5 months | 5.18 min¹ | Daily | — | — | Personalised password | |
| ATCS Plus | AF, SF | CBT | 17,34,38 | Yes | H | Yes | — | 1 month | 9.3 min¹ | Daily | — | — | — | |
| Unidirectional¹ | AF | SCT, TTM | 9, 10, 20, 25, 39 | — | H | — | — | 12 months | — | Monthly | Approx 60 words | Primary care provider | — | |
| Unidirectional¹ | AF | SCT, TTM | 9, 10, 20, 25, 39 | — | H | — | — | 12 months | — | Monthly | Approx 60 words | Primary care provider | — | |
| IVR | AF | — | 27, 42 | — | H | Yes | Yes | 6 months | 1 min | 3 | — | — | — | |
| IVR | AF | — | 25, 39 | — | H | — | — | 1 month | — | — | — | — | Correspondence with the author: "Upon answering a call, patients are required to authenticate with their date of birth." | |
| ATCS Plus | AF, CF, SF | CBT | 4,20,34,38 | Yes | E | — | Yes | 6 months | 9.2 min | Daily | — | — | Valid ID number and a personally | |
| Unidirectional | AF | — | 29 | Yes | H | — | — | 2 months | — | At least every 3 days | Every hour for 2 consecutive hours | Community health worker | — | |
| IVR | AF | CBT | 3, 16, 20, 22, 25, 39, 42 | Yes | P | — | Yes | 4 months | 3‐16 min | Daily | — | Experienced therapist | — | |
| Unidirectional | AF | — | 42 | — | H | — | — | 24 months | — | Daily | — | First author | — | |
| IVR | AF | — | 40 | — | H | — | — | 4 months | — | — | — | — | — | |
| IVR | AF | — | 39, 42 | — | — | — | — | 6 months | — | 3 | — | — | — | |
| ATCS Plus | AF, SF | CBT, TTM, MI | 9, 0, 12, 20, 21 | — | H | Yes | — | 2 months | 18.9 min^^ | Biweekly weeks 1‐3, weekly weeks 4‐6, no call week 7, weekly week 8‐9 | 8.61²,³ | — | — | |
| IVR | AF | — | 29, 30 | — | H | — | — | 3.5 months | — | up to 5 times | — | — | — | |
| ATCS Plus | AF, CF | SCT | 3, 18, 21, 25, 39 | No | E | Yes | Yes | 24 months | 1‐8 min² | Biweekly¹¹ | — | Human voice | PIN² | |
| ATCS Plus | AF, CF | SCT | 3, 18, 21, 25, 39 | — | H | Yes | — | 12 months | 1‐8 min² | Biweekly¹¹ | — | — | — | |
| ATCS Plus | AF, CF | — | 13, 20, 21, 39 | Yes | — | Yes | Yes | 1.5 months | ≤ 9 min | Weekly | — | Native speaker | — | |
| ATCS Plus | AF, SF | DMT, SCT, TTM | 3, 19, 20, 32 | Yes | P | Yes | — | 6 months | 10 min | Weekly (first 3 months), and at least biweekly thereafter | — | Digitised | — | |
| Unidirectional | AF | — | 39, 40 | No | H | — | — | — | — | — | — | Receptionist | — | |
| ATCS Plus | AF, CF | — | 20, 42 | — | H | — | — | 3 months | — | — | — | — | — | |
| ATCS Plus | AF, CF | — | 3, 9, 13, 39, 40, 42 | — | H | — | — | 12 months | 1‐20 min⁵ | 3 | — | — | — | |
| ATCS Plus | AF, CF | — | 20, 42 | — | — | — | — | 12 months | — | 8 | — | — | — | |
| IVR | AF | — | 42 | — | P | — | — | — | — | — | — | — | — | |
| ATCS Plus | AF, CF, SF | — | 13, 34 | — | H | — | Yes | 6 months | — | 5 times¹² | — | — | — | |
| ATCS Plus | AF, CF, SF | CBT | 4, 20, 34, 38 | Yes | P | — | — | 4 months | — | Daily | — | — | — | |
| IVR | AF | MI | 9, 12 | — | H | Other | — | 6 months | — | ≤ 26 calls over 13 weeks | — | — | — | |
| ATCS Plus | AF, CF | CCM, SCT | 1, 3, 9, 10, 13, 20, 21, 35, 39 | — | E | Yes | Yes | 12 months | 6‐12 min | Weekly | — | — | — | |
| ATCS Plus | AF, CF | — | 27, 39, 42 | — | H | — | — | 6 months | — | 11 | — | — | Password protected⁴ | |
| IVR¹ | AF | TPB | 16,20 | — | H | — | — | 24 months | — | Weekly | — | — | — | |
| IVR | AF | — | 17, 20, 42 | — | H | Other | — | 6 weeks | — | 3 calls 6 weeks apart | 12 questions; 397 words | Digitally | — | |
| IVR | AF | — | 17, 20, 30, 39, 40 | — | H | Yes | — | 2 months | — | Weekly¹³ | — | Female voice | — | |
| IVR | AF | GMDBC, Others² | 3, 27, 39 | Yes | E | — | — | 3 months | 2‐6 min | — | — | — | Verification | |
| ATCS Plus | AF, CF | — | 30, 42 | No | H | No | — | 12 months | — | 3¹⁴ | — | Human voice | — | |
| IVR | AF | — | 20 | Yes | P_H | Yes | Yes | 1 months | — | Daily | — | — | — | |
| ATCS Plus¹ | AF, CF | — | 16 | — | H | — | Yes | — | — | — | — | Female voice | — | |
| IVR | AF | SCT, MI | 3, 12, 17, 20, 25, 39, 40, 42 | — | E | Yes | — | 12 months | — | Weekly then monthly¹⁵ | — | — | Password protected⁴ | |
| IVR | AF | SCT | 3, 12, 17, 20, 25, 39, 40, 42 | Yes | E | Yes | — | 12 months | — | Weekly then monthly¹⁵ | — | — | Password protected⁴ | |
| ATCS Plus | AF, CF | CBT | 2, 20 | Yes | H | Yes | — | 2 months | — | Weekly | — | — | — | |
| ATCS Plus | AF, SF | HBM, CCM, SCT, TTM, MI, SRT, RL | 2, 3, 20, 32, 39 | — | H | — | Yes | 6 months | — | 3 | — | — | — | |
| Unidirectional | AF | — | 42 | — | H | — | — | 1 month | — | 1³ | — | Human voice | — | |
| IVR¹ | AF | — | 9, 10, 42 | Yes | P | Yes | — | 3 months | — | Daily/2 weeks; weekly/10 weeks | 25 calls | Female voice | — | |
| Unidirectional | AF | — | 42 | — | H | — | — | 18 months | — | Weekly | — | — | — | |
| Unidirectional | AF | — | 42 | — | H | — | — | 12 months | — | — | — | — | — | |
| Unidirectional | AF | HBM | 7*, 39, 40, 42 | No | H | — | — | — | — | 1¹⁶ | — | Female using native languages | — | |
| Unidirectional | AF | HBM | 39, 40, 42 | No | H | — | — | — | — | 1¹⁶ | — | Female using native languages | — | |
| IVR | AF | BET | 9, 20, 25, 34 | Yes | — | — | — | 6 months | ≤ 5 min | Daily | — | — | PIN⁶ | |
| ATCS Plus | AF,SF | — | 10 | — | — | — | — | 3 months | — | 3/week | — | — | — | |
| IVR¹ | AF | TTM | 4, 13, 20, 34, 38 | — | E | Yes | — | 6 months | 15‐20 min | Weekly¹⁷ | — | — | — | |
| ATCS Plus | AF, CF | — | 39 | — | H | Other | — | 10 months | < 10 min | 3¹⁸ | — | — | — | |
| ATCS Plus | AF, CF | — | 20, 42 | — | H | Other | Yes | 18 months | 2‐3 min | — | — | — | — | |
| ATCS Plus | AF, CF, SF | — | 20, 42 | Yes | H | Other | Yes | 12 months | 2‐3 min | Monthly | — | — | — | |
| IVR | AF | — | 3, 21, 39 | Yes | P | Yes | Yes | 6 months | 5‐20 min | Weekly | — | — | PIN⁶ | |
| IVR | AF | SCT | 2, 9, 10 | No | P | Other | — | 3 months | — | Biweekly | — | Synthetic speech | — | |
| IVR | AF | — | 21, 40 | — | H | Yes | — | 6 months | — | Biweekly | — | — | — | |
| ATCS Plus | AF, SF | — | 21, 40 | — | P | Yes | — | 3 months | — | Weekly | — | — | PIN | |
| Unidirectional | AF | SCT | 4,13 | — | — | — | — | — | — | — | — | — | — | |
| a ATCS ¹For more detailed evaluation of multimodal/complex interventions, please refer to Table 4. b Content delivery: AF: automated functions; CF: communicative functions; SF: supplementary functions. d Behaviour change techniques: 1 ‐ action planning; 2 ‐ agree behavioural contract; 3 ‐ barrier identification/problem solving; 4 ‐ emotional control training; 5 ‐ environmental restructuring; 6 ‐ facilitate social comparison; 7 ‐ fear arousal; 8 ‐ general communication skills training; 9 ‐ goal setting (behaviour); 10 ‐ goal setting (outcome); 11 ‐ model/demonstrate the behaviour; 12 ‐ motivational interviewing; 13 ‐ plan social support/social change; 14 ‐ prompt anticipated regret; 15 ‐ prompt identification as a role model/position advocate; 16 ‐ prompt practice; 17 ‐ prompt review of behavioural goals; 18 ‐ prompt review of outcome goals; 19 ‐ prompt self talk; 20 ‐ prompt self‐monitoring of behaviour; 21 ‐ prompt self‐monitoring of behavioural outcome; 22 ‐ prompt use of imagery; 23 ‐ prompting focus on past success; 24 ‐ prompting generalisation of a target behaviour; 25 ‐ provide feedback on performance; 26 ‐ provide information about other's approval; 27 ‐ provide information on consequences of behaviour in general; 28 ‐ provide information on consequences of behaviour to the individual; 29 ‐ provide information on where and when to perform the behaviour; 30 ‐ provide instruction on how to the perform the behaviour; 31 ‐ provide normative information about others' behaviour; 32 ‐ provide rewards contingent on effort or progress towards behaviour; 33 ‐ provide rewards contingent on successful behaviour; 34 ‐ relapse prevention/coping planning; 35 ‐ set graded tasks; 36 ‐ shaping; 37 ‐ stimulate anticipation of future rewards; 38 ‐ stress management; 39 ‐ tailoring; 40 ‐ teach to use prompts/cues; 41 ‐ time management; 42 ‐ use of follow up prompts. e Caller: E ‐ either participant or healthcare provider/researcher; H ‐ healthcare provider/researcher; P ‐ participant; P_H ‐ If P fails to call then H calls. f Telephone keypad for response: the calls were made using speech recognition (or speech‐enabled) technology; ¹‐ both data entry via Web screen or voice or telephone keypad. g Duration of calls h Frequency i Intensity j Security arrangement | ||||||||||||||
| Assessment levels and criteria for each dimension | Study | Assessment of the intervention (a‐d)/description of the intervention/justification | Control (or usual care) |
| Core dimension 1: active components included in the intervention compared with the control | |||
| a. More than 1 component and delivered as a bundle b. More than 1 component c. 1 component | (a.) A mailed reminder letter, a free faecal immunochemical test, an automated telephone and text message reminding them that they were due for screening and that a faecal immunochemical test was being mailed to them, an automated telephone and text reminder 2 weeks later for those who did not return the faecal immunochemical test, and personal telephone outreach by a colorectal cancer screening navigator after 3 months | (b.) Usual care included computerised reminders, | |
| (a.) Behaviour change goals, self‐monitoring via IVR phone calls, tailored skills training materials, monthly interpersonal counselling calls, and a 12‐month gym membership. | (b.) Control group received + newsletters that covered general wellness topics but did not discuss weight, nutrition, or physical activity | ||
| (a.) Internet‐ and telephone‐based telemedicine system + automatically generated emails or telephone calls as reminders + sphygmomanometer, a weighting scale (if needed), a pedometer and instructions on their use | (c.) Control group received usual care | ||
| (a.) Email, webpages, IVR and short message service (SMS) + craving helpline | (c.) Control group received self‐help (booklet) | ||
| (a.) 10 personal phone calls from the nurse interspersed randomly with 10 automated phone calls + clinic‐based activity counselling | (b.) Clinic‐based activity counselling + no calls | ||
| (b.) Clinician prompt, patient prompts, patient outreach consisting of 2 personalised letters which also include testing kits for colorectal cancer and up to 4 ATCS calls over 26 weeks | (c.) The clinician was responsible for discussing cancer screening with the patients and for initiating any referral or for handing out faecal occult blood testing cards over 12 months | ||
| (b.) Letters, ATCS calls, a point‐of‐care prompt and mailing of a home colorectal cancer testing kit; and medical record reviews at week 12 | (c.) Usual care received blinded chart review | ||
| (b.) Medication reconciliation and tailoring, patient education (provided through automated voice messages and pharmacist telephone calls when requested by the patient), collaborative care between pharmacists and providers (primary care providers or cardiologists), and voice messaging reminders (educational and medication refill reminder calls). | (c.) Usual care received standard hospital discharge instructions e.g., numbers to call, follow‐up appointments, diet and exercise advice, a discharge medication list, and educational information about cardiac medications | ||
| (a.) Symptom monitoring by a nurse + automated monitoring either via IVR or by Internet + medications (analgesics, antidepressants) | (c.) Usual care from oncologist | ||
| (a.) Symptom monitoring, either via IVR or by Internet + nurse care + stepped care with analgesics | (c.) Usual care from primary care physician | ||
| (b.) Patient education, home blood pressure monitoring, home blood pressure measurement reporting to an ATCS, and clinical pharmacist management of hypertension with physician oversight + usual care | (c.) The control group received usual care | ||
| (b.) Baseline in‐person and biweekly then monthly telephone counselling by a lifestyle counsellor, one‐time clinical endorsement of physical activity and monthly automated telephone messaging by primary care provider, and quarterly tailored mailings of progress in physical activity. | (c.) Patients in the control group received usual care | ||
| (b.) 1 in‐person baseline counselling session, regular telephone counselling, physician endorsement in clinic with monthly ATCS calls encouragement, and tailored mailed materials, plus a consult to a Veterans Affairs (VA) weight management program. | (b.) Patients in the control group received usual care + MOVE | ||
| (b.) An IVR call once a week + a weekly non‐interactive neutral pictorial message sent out as a reminder 4 days after the IVR call + usual care | (b.) Usual care included up to 3 counselling sessions + antiretroviral treatment | ||
| (b.) Education and reminders delivered to primary care physicians + mailings and ATCS | (c.) The control group received no education | ||
| (b.) Treatment team education and patient self‐care education, nurse telephone call and IVR program | (c.) Treatment team education and patient self‐care education | ||
| (a.) Automated counselling plus nicotine replacement therapy, manuals, and expert system (TEL + EXP + NRT + MAN) | (c.) The control group received stage (of change) matched manuals | ||
| Core dimension 2: behaviours or actions of intervention recipients or participants to which the intervention is directed | |||
| a. Single target b. Dual target c. Multitarget d. Variesa | (a.) Single target: colorectal cancer screening | (a.) Single target: colorectal cancer screening | |
| (a.) Single target: weight management | (a.) Single target: weight management | ||
| (c.) Single target: diet, exercise, smoking and blood pressure control | (a.) Single target: blood pressure control | ||
| (a.) Single target: smoking abstinence | (a.) Single target: smoking abstinence | ||
| (c.) Multiple target: physical activity; BMI; mobility; quality of life | (c.) Multiple target: physical activity; BMI; mobility; quality of life | ||
| (b.) Dual target: breast cancer and colorectal cancer screening | (b.) Dual target: breast cancer and colorectal cancer screening | ||
| (b.) Dual target: breast cancer and colorectal cancer screening | (b.) Dual target: breast cancer and colorectal cancer screening | ||
| (c.) Medication adherence, blood pressure, blood lipid levels | (c.) Medication adherence, blood pressure, blood lipid levels | ||
| (b.) Dual target: pain and depression management | (b.) Dual target: pain and depression management | ||
| (a.) Single target: musculoskeletal pain management | (a.) Single target: musculoskeletal pain management | ||
| (b.) Dual target: blood pressure monitoring and blood pressure measuring | (b.) Dual target: blood pressure monitoring and blood pressure measuring | ||
| (c.) Multitarget: improving gait speed, self‐reported physical activity, function and disability | (c.) Multitarget: improving gait speed, self‐reported physical activity, function and disability | ||
| (c.) Multitarget: improving blood sugar indices, anthropometric measures, and self‐reported physical activity, health‐related quality of life, and physical function | (c.) Multitarget: improving blood sugar indices, anthropometric measures, and self‐reported physical activity, health‐related quality of life, and physical function | ||
| (a.) Single target: antiretroviral treatment medication adherence | (a.) Single target: antiretroviral treatment medication adherence | ||
| (a.) Single target: osteoporosis screening | (d.) Varies | ||
| (a.) Single target: antidepressant medication adherence | (a.) Single target: antidepressant medication adherence | ||
| (a.) Single target: smoking abstinence | (a.) Single target: smoking abstinence | ||
| Core dimension 3: organisational levels and categories targeted by the intervention | |||
| a. Multilevel b. Multicategory c. Single category | (c.) Intervention directed only at single category of individuals within the individual level: patients past due for colorectal cancer screening | (c.) Intervention directed only at single category of individuals within the individual level: patients past due colorectal cancer screening | |
| (c.) Intervention directed only at single category of individuals within the individual level: obese females of Black ethnic origin | (c.) Obese females of black ethnic origin | ||
| (c.) Intervention directed only at single category of individuals within the individual level: subjects with elevated blood pressure | (c.) Intervention directed only at single category of individuals within the individual level: subjects with elevated blood pressure | ||
| (c.) Intervention directed only at single category of individuals within the individual level: tobacco smokers | (c.) Tobacco smokers | ||
| (c.) Sedentary primary care patients | (c.) Sedentary primary care patients | ||
| (c.) Intervention directed only at single category of individuals within the individual level: patients past due recommended screening | (c.) Patients past due recommended screening | ||
| (c.) Intervention directed only at single category of individuals within the individual level: patients past due recommended screening | (c.) Patients past due recommended screening | ||
| (c.) Intervention directed only at single category of individuals within the individual level: patients after hospitalisation for acute coronary syndrome | (c.) Intervention directed only at single category of individuals within the individual level: patients after hospitalisation for acute coronary syndrome | ||
| (c.) Intervention directed only at single category of individuals within the individual level: cancer patients with depression and pain | (c.) Cancer patients with depression and pain | ||
| (c.) Intervention directed only at single category of individuals within the individual level: patients with musculoskeletal pain | (c.) Patients with musculoskeletal pain | ||
| (c.) Intervention directed only at single category of individuals within the individual level: patients with hypertension | (c.) Patients with hypertension | ||
| (c.) Intervention directed only at single category of individuals within the individual level: sedentary (otherwise healthy) older adults | (c.) Intervention directed only at single category of individuals within the individual level: sedentary (otherwise healthy) older adults | ||
| (c.) Intervention directed only at single category of individuals within the individual level: older adults at risk of diabetes mellitus | (c.) Intervention directed only at single category of individuals within the individual level: older adults at risk of diabetes mellitus | ||
| (c.) Intervention directed only at single category of individuals within the individual level: patients with HIV | (c.) Intervention directed only at single category of individuals within the individual level: patients with HIV | ||
| (b.) Intervention directed at 2 or more categories of individuals within the individual level: primary care physicians and their patients at‐risk of osteoporosis | (b.) Control intervention directed at 2 or more categories of individuals within the individual level: primary care physicians and their patients at‐risk of osteoporosis | ||
| (c.) Intervention directed only at single category of individuals within the individual level: patients with depression | (c.) Intervention directed only at single category of individuals within the individual level: patients with depression | ||
| (c.) Intervention directed only at single category of individuals within the individual level: tobacco smokers | (c.) Tobacco smokers | ||
| Core dimension 4: the degree of tailoring intended or flexibility permitted across sites or individuals in intervention implementation/application | |||
| a. Fully tailored/flexible b. Moderately tailored/flexible c. Inflexible d. Variesa | (b.) Moderately tailored/flexible: a mailed reminder letter, a free faecal immunochemical test, an automated telephone and text message reminder, an automated telephone and text reminder 2 weeks later (inflexible); personal telephone outreach (flexible) | (b.) Moderately tailored/flexible: computerised reminders, standing orders to give patients home faecal immunochemical test (inflexible); clinician feedback on colorectal cancer screening rates (flexible) | |
| (b.) Moderately tailored/flexible: self‐monitoring via IVR phone calls (inflexible); behaviour change goals, tailored skills training materials, monthly interpersonal counselling calls, and a 12‐month gym membership (flexible) | (c.) Newsletters sent were inflexible | ||
| (c.) Telemedicine system, reminders, sphygmomanometer, weighting scale and pedometer have all been standardised | (d.) Varies across interventions included in the review | ||
| (c.) E‐mail, web‐pages, IVR and SMS inflexible; quote: "Early in the morning, the user receives an e‐mail with instructions to open the day's web page. Each day for 6 weeks, the client opens a web page that is unique to that particular programme day." | (c.) Quote: "The booklet contains general cessation information, a 48‐day quit calendar, a 10‐day quit log, the telephone number of the national quit‐line and links to relevant and open on‐line tobacco cessation | ||
| (b.) Moderately tailored/flexible: nurse used a semi‐standardised protocol. | (d.) Varies across interventions included in the review | ||
| (c.) Clinician prompt, patient prompts, patient outreach all have been highly standardised | (b.) Discussions with patients were moderately tailored/flexible | ||
| (c.) Letters, ATCS calls, point‐of‐care prompts and blinded chart reviews all have been highly standardised | (c.) Blinded chart reviews have been highly standardised | ||
| (b.) Moderately tailored/flexible: medication reconciliation and tailoring, patient education, collaborative care between pharmacists and providers (flexible); and voice messaging reminders (inflexible) | (b.) Usual care was moderately tailored/flexible | ||
| (c.) Nurse care (using evidence‐based guidelines) and IVR monitoring and medications (all not flexible) | (d.) Varies across interventions included in the review | ||
| (c.) Symptom monitoring, either via IVR or by Internet, nurse care and stepped care with analgesics (not flexible) | (d.) Varies across interventions included in the review | ||
| (b.) Patient education, home blood pressure monitoring, home blood pressure measurement reporting to an ATCS (not flexible); and clinical pharmacist management of hypertension with physician oversight (flexible) | (d.) Varies across interventions included in the review | ||
| (b.) Moderately tailored/flexible: quote: "Providers were encouraged to modify the script to suit their personal style." | (d.) Varies across interventions included in the review | ||
| (b.) Moderately tailored/flexible: baseline counselling, regular telephone counselling, physician endorsement in clinic with monthly ATCS calls encouragement, and tailored mailed materials, plus a consult to a Veterans Affairs (VA) weight management programme | (d.) Varies across interventions included in the review | ||
| (c.) An IVR call once a week + a weekly non‐interactive neutral pictorial message sent out as a reminder 4 days after the IVR call + usual care (inflexible) | (c.) Usual care counselling sessions + antiretroviral treatment (inflexible) | ||
| (b.) An advance letter, an ATCS call, and the opportunity to schedule a bone mineral density test (not flexible); specially trained pharmacists educated physicians (flexible). | (d.) Varies across interventions included in the review | ||
| (b.) Moderately tailored/flexible: treatment team education and patient self‐care education, nurse telephone call and IVR programme | (b.) Moderately tailored/flexible: treatment team education and patient self‐care education, nurse telephone call | ||
| (b.) Automated counselling plus nicotine replacement therapy, manuals, and expert system were all moderately tailored/flexible | (c.) Stage‐based self‐help manuals were inflexible | ||
| Core dimension 5: the level of skill required by those delivering the intervention | |||
| a. High level skills b. Intermediate level skills c. Basic skills d. Variesa | (b.) Intermediate level skills required in setting up the IVR phone calls and text reminders, providing outreach calls | (b.) Intermediate level skills required in providing feedback on colorectal cancer screening rates | |
| (b.) Intermediate level skills required in delivering behaviour change goals, setting up the IVR phone calls, producing tailored skills materials and monthly interpersonal counselling calls | (c.) No specialised skills required in writing the newsletter | ||
| (b.) Intermediate level skills required in reviewing patients' reports (physicians), motivating patients (nurses), setting up the reminder calls, emails | (c.) No specialised skills required in providing usual care | ||
| (a.) Creating/writing emails, web‐pages, IVR and SMS requires high level skills | (c.) No specialised skills required in writing the booklet | ||
| (b.) Intermediate level skills required in prerecording automated telephone messages | (d.) Varies across interventions included in the review | ||
| (b.) Intermediate level skills required in e.g. prerecording automated telephone reminders | (c.) No specialised skills required in discussing breast cancer/colorectal cancer screening | ||
| (b.) Intermediate level skills required in e.g. prerecording automated telephone reminders | (c.) No specialised skills required in reviewing charts | ||
| (b.) Intermediate level skills required in e.g. educating patients and/or prerecording telephone reminders | (c.) No specialised skills required in providing usual care | ||
| (b.) Intermediate level skills required from nurses to manage pain and depression | (b.) Intermediate level skills required from nurses to manage pain and depression | ||
| (b.) Intermediate level skills required from nurses to manage musculoskeletal pain | (c.) Basic skills required from primary care physicians | ||
| (b.) Intermediate level skills required from pharmacists and physicians to manage hypertension | (d.) Varies | ||
| (b.) Intermediate level skills required from primary care providers in e.g., recording automated messages, counselling and consulting patients | (c.) Basc level skills required from primary care providers | ||
| (b.) Intermediate level skills required from primary care providers in recording automated messages, counselling and consulting patients | (b.) Intermediate level skills required from primary care providers in providing MOVE | ||
| (b.) Intermediate level skills required in setting up the IVR phone calls + pictorial messages | (c.) Basic skills required | ||
| (a.) Extensive specialised skills required: "The visits were conducted by specially trained pharmacists . . . These pharmacists also underwent a 1‐ day training program focused on osteoporosis and conducted by 2 of the study authors. This program included lectures on the epidemiology, diagnosis, and treatment of osteoporosis. Also, it reviewed principles of academic detailing and the specific goals of this intervention." | (d.) Varies | ||
| (b.) Intermediate level skills required in e.g., prerecording IVR calls | (c.) Basic skills required in delivering education and nurse calls | ||
| (b.) Intermediate level skills required in recording automated messages, providing feedback reports | (c.) Basic skills required | ||
| Core dimension 6: the level of skill required for the targeted behaviour when entering the study by those receiving the intervention in order to meet the intervention's objectives | |||
| a. High level skills b. Intermediate level skills c. Basic skills d. Variesa | (c.) No specialised skills required | (c.) No specialised skills required | |
| (c.) No specialised skills required | (c.) No specialised skills required | ||
| (b.) Intermediate level skills required. Quote: "subjects were trained on use of a computer and the Internet and were introduced to the Web site at the research centre. Telemedicine subjects received instructions on use of an optional telephone communication system". They also received instructions on the use of sphygmomanometer, weighting scale and pedometer | (c.) No specialised skills required | ||
| (b.) Access to the Internet, email and a cell phone on a daily basis was required | (c.) No specialised skills required | ||
| (c.) No specialised skills required | (c.) No specialised skills required | ||
| (c.) No specialised skills required | (c.) No specialised skills required | ||
| (c.) No specialised skills required | (c.) No specialised skills required | ||
| (c.) No specialised skills required | (c.) No specialised skills required | ||
| (c.) No specialised skills required | (c.) No specialised skills required | ||
| (c.) No specialised skills required | (c.) No specialised skills required | ||
| (b.) Patients were instructed about use of the ATCS, and trained on using an electronic blood pressure cuff | (d.) Varies across interventions included in the review | ||
| (d.) Varies across interventions included in the review | (c.) No specialised skills required | ||
| (d.) Varies across interventions included in the review | (c.) No specialised skills required | ||
| (c.) No specialised skills required | (c.) No specialised skills required | ||
| (c.) No specialised skills required | (c.) No specialised skills required | ||
| (c.) No specialised skills required | (c.) No specialised skills required | ||
| (c.) No specialised skills required | (c.) No specialised skills required | ||
| Core dimension 7: the degree of interaction between intervention components/the independence/interdependence of intervention components | |||
| a. High level interaction d. Variesa e. Unclear or unable to assess | (a.) High level interaction; quote: "The majority of faecal occult blood testing completions were accomplished with | (d.) Varies across interventions included in the review | |
| (b.) Moderate level of interaction; quote: "comprised 5 mutually reinforcing components" | (e.) Unclear or unable to assess in individuals receiving usual care | ||
| (b.) Moderate level of interaction of the intervention components: the automated calls and emails and the use of sphygmomanometer to measure blood pressure, weighting scale and pedometer to promote physical activity | (e.) Unclear or unable to assess in patients receiving usual care | ||
| (a.) High level interaction; quote: "further research is necessary to detect the active intervention | (c.) Independent | ||
| (a.) High level interaction; a synergistic effect has been observed | (e.) Unclear or unable to assess in patients receiving no calls | ||
| (a.) High level interaction; quote: "combined interventions are superior to simpler interventions such as reminders" | (c.) Independent | ||
| (a.) There is substantial interaction or inter‐dependency between ATCS calls, a point‐of‐care prompt and mailing of a home colorectal cancer testing kits | (c.) Independent | ||
| (b.) Moderate level of interaction: the intervention components are considered to be mutually reinforcing | (e.) Unclear or unable to assess in patients receiving usual care | ||
| (a.) High level interaction; triggered telephone calls occurred when ATCS monitoring indicated inadequate symptom improvement, non‐adherence to medication, adverse effects, suicidal ideation | (e.) Unclear or unable to assess in patients receiving usual care | ||
| (a.) High level interaction; IVR and nurse calls prompted adjustments in type or dose of analgesics delivered | (e.) Unclear or unable to assess in patients receiving usual care | ||
| (a.) There was a high level interaction between the intervention components: Quote: "This difference was likely due to greater therapy intensification (number and intensity of hypertension medications) in the intervention group" | (e.) Unclear or unable to assess in patients receiving usual care | ||
| (b.) Moderate level of interaction: personal and automatic calls are considered to be mutually reinforcing | (e.) Unclear or unable to assess in patients receiving usual care | ||
| (b.) Moderate level of interaction: personal and automatic calls are considered to be mutually reinforcing | (e.) Unclear or unable to assess in patients receiving usual care | ||
| (c.) The IVR calls and pictorial messages were independent of each other | (e.) Unclear or unable to assess in patients receiving usual care | ||
| (e.) Unable to assess the degree of interaction between physician education and ATCS calls | (e.) Unclear or unable to assess in patients receiving no intervention | ||
| (e.) Unable to assess the degree of interaction between education, nurse calls and IVR calls | (d.) Varies across interventions included in the review | ||
| (c.) Automated calls, nicotine replacement therapy, manuals, and expert system were independent of each other | (e.) Unclear or unable to assess in patients receiving stage‐matched manuals only | ||
| Core dimension 8: the interaction between the intervention and the context or setting | |||
| a. Highly context dependent d. Variesa e. Unclear or unable to assess | (d.) Varies across interventions included in the review | (d.) Varies across interventions included in the review | |
| (e.) Unable to assess the level of interaction between the intervention and the context | (e.) Unable to assess the level of interaction between the intervention and the context | ||
| (e.) Unable to assess the level of interaction between the intervention and the context | (d.) Varies across interventions included in the review | ||
| (e.) Unable to assess the level of interaction between the intervention and the context | (e.) Unable to assess the level of interaction between the intervention and the context | ||
| (e.) Unable to assess the level of interaction between the intervention and the context | (e.) Unable to assess the level of interaction between the intervention and the context | ||
| (d.) Varies across interventions included in the review | (d.) Varies across interventions included in the review | ||
| (d.) Varies across interventions included in the review | (d.) Varies across interventions included in the review | ||
| (d.) Varies across interventions included in the review | (d.) Varies across interventions included in the review | ||
| (e.) Unable to assess the level of interaction between the intervention and the context | (d.) Varies across interventions included in the review | ||
| (e.) Unable to assess the level of interaction between the intervention and the context | (d.) Varies across interventions included in the review | ||
| (d.) Varies across interventions included in the review | (d.) Varies across interventions included in the review | ||
| (d.) Varies across interventions included in the review | (d.) Varies across interventions included in the review | ||
| (d.) Varies across interventions included in the review | (d.) Varies across interventions included in the review | ||
| (e.) Unable to assess the level of interaction between the intervention and the context | (e.) Unable to assess the level of interaction between the intervention and the context | ||
| (e.) Unable to assess the level of interaction between the intervention and the context | (d.) Varies across interventions included in the review | ||
| (e.) Unable to assess the level of interaction between the intervention and the context | (d.) Varies across interventions included in the review | ||
| (e.) Unable to assess the level of interaction between the intervention and the context | (e.) Unable to assess the level of interaction between the intervention and the context | ||
| Core dimension 9: the degree to which the effects of an intervention are modified by factors relating to recipient, provider, or implementation factors | |||
| a. Highly dependent on individual‐level factors d. Variesa e. Unclear or unable to assess | (d.) Varies across interventions included in the review | (e.) Unclear or unable to assess | |
| (b.) Moderately dependent on individual‐level factor, i.e. registered dietitians or personalized progress reports | (e.) Unclear or unable to assess | ||
| (d.) Varies across interventions included in the review | (e.) Unclear or unable to assess | ||
| (c.) Largely independent of individual‐level factors | (c.) Largely independent of individual‐level factors | ||
| (d.) Varies across interventions included in the review | (d.) Varies across interventions included in the review | ||
| (d.) Varies across interventions included in the review | (e.) Unclear or unable to assess | ||
| (d.) Varies across interventions included in the review | (c.) The effects of the blinded chart reviews are not modified substantially by recipient or provider factors | ||
| (d.) Varies across interventions included in the review | (d.) Varies across interventions included in the review | ||
| (b.) Moderately dependent on individual‐level factor, i.e. nurse and pain‐psychiatrist specialist interaction | (e.) Unclear or unable to assess | ||
| (b.) Moderately dependent on individual‐level factor, i.e. nurse management | (e.) Unclear or unable to assess | ||
| (b.) Moderately dependent on individual‐level factor, i.e. clinical pharmacist management with physician oversight | (e.) Unclear or unable to assess | ||
| (e.) Unclear or unable to assess | (e.) Unclear or unable to assess | ||
| (e.) Unclear or unable to assess | (e.) Unclear or unable to assess | ||
| (e.) Unclear or unable to assess | (e.) Unclear or unable to assess | ||
| (b.) The effects of the intervention are modified by one of recipient or factors, e.g. pharmacists' knowledge | (e.) Unclear or unable to assess | ||
| (e.) Unclear or unable to assess | (e.) Unclear or unable to assess | ||
| (e.) Unclear or unable to assess | (e.) Unclear or unable to assess | ||
| Core dimension 10: the length of the causal pathway between the intervention and the outcome it is intended to affect | |||
| a. Pathway variable, long d. Variesa e. Unclear or unable to assess | (d.) Varies across interventions included in the review | (e.) Unclear or unable to assess | |
| (c.) Pathway linear, short. Quote: "The high rates of IVR call engagement and their correlation with greater weight losses" | (e.) Unclear or unable to assess | ||
| (d.) Varies across interventions included in the review | (e.) Unclear or unable to assess | ||
| (d.) Varies across interventions included in the review | (e.) Unclear or unable to assess | ||
| (d.) Varies across interventions included in the review | (e.) Unclear or unable to assess | ||
| (d.) Varies across interventions included in the review | (e.) Unclear or unable to assess | ||
| (d.) Varies across interventions included in the review | (e.) Unclear or unable to assess | ||
| (d.) Varies across interventions included in the review | (e.) Unclear or unable to assess | ||
| (d.) Varies across interventions included in the review | (e.) Unclear or unable to assess | ||
| (d.) Varies across interventions included in the review | (e.) Unclear or unable to assess | ||
| (d.) Varies across interventions included in the review | (e.) Unclear or unable to assess | ||
| (d.) Varies across interventions included in the review | (e.) Unclear or unable to assess | ||
| (d.) Varies across interventions included in the review | (e.) Unclear or unable to assess | ||
| (d.) Varies across interventions included in the review | (e.) Unclear or unable to assess | ||
| (d.) Varies across interventions included in the review | (e.) Unclear or unable to assess | ||
| (d.) Varies across interventions included in the review | (e.) Unclear or unable to assess | ||
| aVaries across interventions to be considered for/included in the review. | |||
| Study ID | Typea | Subtype | Participant age (years) | Sex | Ethnicityb | Primary outcome measures | Effectc |
| P | Alcohol misuse | 41‐70 | > 50% M | W | Drinking practices Spending on alcohol | 2 2 (median effect = 2) | |
| P | Immunisation | — | — | — | Immunisation status Cost‐effectiveness | 1 1 (median effect = 1) | |
| P | Immunisation | ≥ 71 | — | — | Herpes zoster immunisations | 1 | |
| P | Immunisation | 0‐21 | — | — | Immunisation status | 2 | |
| P | Immunisation | 0‐21 | M = F (± 3%) | W,B,H | Completion by the age of 24 months of the 4‐3‐1‐3 immunisations series | 2 | |
| P | Immunisation | 0‐21 | — | — | Immunisation status | 2 | |
| P | Immunisation | — | M = F (± 3%) | W,B | Immunisation status | 1 | |
| P | Immunisation | 22‐40 | > 50% F | W,B | Immunisation rate | 2 | |
| P | Immunisation | 0‐21 | M = F (± 3%) | B,H | Immunisation status | 2 | |
| P | Immunisation | 0‐21 | M = F (± 3%) | W,B,H | Immunisation status | 2 | |
| P | Immunisation | 0‐21 | M = F (± 3%) | — | Immunisation status Preventive visit rate | 1 1 | |
| P | Physical activity | 41‐70 | > 50% F | W | 1‐mile walk after the intervention | 5 | |
| P | Physical activity | 41‐70 | > 50% M | — | Self‐reported (diary) walking adherence | 1 | |
| P | Physical activity | 41‐70 | > 50% F | B | Minutes walked per week | 1 | |
| P | Physical activity | 41‐70 | > 50% F | W | Minutes of moderate to vigorous physical activity | 1 | |
| P | Physical activity | ≥ 71 | > 50% M | W,B | Gait speed (usual and rapid) Self‐reported physical activity Function and disability | 2, 1 1 2 (median effect = 2) | |
| P | Physical activity | 41‐70 | > 50% M | W | Homeostasis model assessment of insulin resistance | 2 | |
| P | Physical activity | 41‐70 | > 50% F | W,B | Energy expenditure in moderate‐intensity‐physical activity % meeting recommendations for moderate‐intensity‐physical activity Motivational readiness for physical activity | 2 2 2 (median effect = 2) | |
| P | Physical activity | ≥ 71 | > 50% M | — | Muscle strength Balance Walk distance Mood | 1 1 2 1 (median effect = 1) | |
| P | Screening | 41‐70 | > 50% F | H | Colorectal cancer screening adherence (faecal occult blood testing) | 1 | |
| P | Screening | 41‐70 | > 50% M | W | Receipt of any recommended colorectal cancer screening | 1 | |
| P | Screening | — | > 50% F | — | Screening rate | 2 | |
| P | Screening | — | > 50% F | W,B,A | Mammography adherence | 1 | |
| P | Screening | 41‐70 | M = F (± 3%) | — | Receipt of colorectal cancer screening after 3 months | — | |
| P | Screening | — | > 50% F | W,B,H,A | Chart documentation of breast cancer screening, colorectal cancer screening, or both | 1 | |
| P | Screening | — | > 50% F | W,B | Breast cancer and colorectal cancer screening | 2 | |
| P | Screening | — | > 50% F | W,B,H | Documentation of breast cancer screening, colorectal cancer screening, or both | 1 | |
| P | Screening | 41‐70 | > 50% F | — | Bone mineral density screening after 12 months | 1 | |
| P | Screening | 41‐70 | M = F (± 3%) | W | Completion of faecal occult blood testing at 6 months | 1 | |
| P | Screening | 41‐70 | > 50% F | W,B | Completed mammogram or colorectal cancer screening within 36 weeks of randomisation | 2 | |
| P | Screening | 41‐70 | M = F (± 3%) | W | Colorectal cancer screening | 2 | |
| P | Screening | 41‐70 | > 50% F | — | Bone mineral density testing and/or filling a prescription for a bone active medication | 1 | |
| P | Stress management among caregivers | 41‐70 | > 50% F | W,B | Caregiver's appraisal of the bothersome nature of caregiving Anxiety Depression | 2 2 2 (median effect = 2) | |
| P | Substance use | 41‐70 | > 50% M | W,H | Days using primary drug | 2 | |
| P | Weight management | 41‐70 | > 50% F | B,H | Change in body weight and BMI | 1 | |
| P | Weight management | 22‐40 | > 50% F | B | Change in body weight and BMI | 1 | |
| P | Weight management | 41‐70 | > 50% F | W,B,H,A | Physical activity Dietary habits Weight loss | 2 2 2 (median effect = 2) | |
| P | Weight management | 0‐21 | > 50% M | W,H | BMI z‐score Physical activity and sedentary behaviour Dietary habits Eating disorder symptoms | 2 2 2 2 (median effect = 2) | |
| P | Weight management | 41‐70 | > 50% F | — | Body weight BMI Systolic blood pressure Diastolic blood pressure Plasma glucose Serum triglycerides Serum serum high‐density lipoprotein‐cholesterol Total serum cholesterol SF‐36 EQ‐5D Obesity Assessment Survey | 1 2 2 2 2 1 1 2 2 2 2 (median effect = 2) | |
| P | Weight management | — | — | — | Weight change | 2 | |
| P | Weight management | 0‐21 | > 50% M | W,B | BMI Calorie intake Fat intake Fruit intake Vegetable intake Television‐viewing time | 2 2 2 2 2 2 (median effect = 2) | |
| E | Appointment reminder | — | — | — | Appointment adherence | 1 | |
| E | Appointment reminder | 41‐70 | > 50% M | W | Appointment non‐attendance Preparation non‐adherence | 2 2 (median effect = 2) | |
| E | Appointment reminder | 22‐40 | > 50% F | W,B,H | Attendance rate | 2 | |
| E | Appointment reminder | — | M = F (± 3%) | — | Appointment adherence | 1 | |
| E | Appointment reminder | — | — | — | Appointment adherence | 2 | |
| E | Appointment reminder | 0‐21 | > 50% M | H | Appointment adherence | 1 | |
| E | Appointment reminder | 0‐21 | > 50% F | W,H | Appointment adherence (3‐day interval) | 1 | |
| M | Illicit drugs addiction | 41‐70 | > 50% M | W,B | Patient interest Perceived efficacy Ease of use Treatment satisfaction Retention rate Drug consumption Methadone counselling Coping | 5 5 5 4 4 2 2 2 (median effect = 4) | |
| M | Alcohol consumption | — | — | — | AUDIT score | 1 | |
| M | Alcohol consumption | 41‐70 | > 50% M | B,H | Number of drinks per drinking day | 1 | |
| M | Alcohol consumption | 41‐70 | > 50% M | W | Weekly alcohol consumption | 3 | |
| M | Alcohol consumption | 41‐70 | > 50% M | W,B,H | Proportion of days abstinent Proportion of heavy drinking days Continuous abstinence Drinking problems Coping problems | 1 2 2 2 2 (median effect = 2) | |
| M | Alcohol consumption | 41‐70 | > 50% M | W,B | Self‐reported drinking patterns Blood alcohol content Work and social adjustment scale Obsessive–compulsive drinking scale SF‐36 health survey Drinker inventory of consequences | 2 2 2 2 2 2 (median effect = 2) | |
| M | Alcohol consumption | 41‐70 | M = F (± 3%) | — | Alcohol consumption | 2 | |
| M | Alcohol consumption | 41‐70 | > 50% M | W,B | Number of heavy drinking days per month % days abstinent per month Drinks per drinking day | 2 2 2 (median effect = 2) | |
| M | Alcohol consumption | 41‐70 | > 50% M | W,B | Drinking habits Alcohol craving Post‐traumatic stress disorder symptoms | 2 2 2 (median effect = 2) | |
| M | Asthma | 41‐70 | > 50% F | W | Healthcare utilisation Medication use QoL | 2 2 2 (median effect = 2) | |
| M | Asthma | 0‐21 | M = F (± 3%) | — | Healthcare utilisation | 4 | |
| M | Cancer | 41‐70 | > 50% M | W | Number of symptom threshold events Cumulative distribution of symptom threshold events Differences in mean symptom severity between discharge and follow‐up | 1 2 2 (median effect = 2) | |
| M | Cancer | 41‐70 | > 50% F | W,B | Depression severity Pain severity | 1 1 (median effect = 1) | |
| M | Cancer | 41‐70 | > 50% F | W | Symptom presence, severity, and distress data | 2 | |
| M | Cancer | 41‐70 | M = F (± 3%) | W,B,H | Prevalence of unmet needs | 2 | |
| M | Cancer | 41‐70 | > 50% F | — | Symptom severity | 2 | |
| M | Cancer | 41‐70 | > 50% F | W,B,A | Adherence to medications Symptom severity | 2 1 (median effect = 2) | |
| M | Cancer | 41‐70 | M = F (± 3%) | W,B,H | Symptom burden | 2 | |
| M | Chronic Pain | 41‐70 | > 50% F | W | Pain Function/disability Coping | 1 1 1 (median effect = 1) | |
| M | Chronic Pain | 41‐70 | > 50% M | W | Pain intensity | 1 | |
| M | Chronic obstructive pulmonary disease | 41‐70 | > 50% M | — | Frequency of exacerbations Proportion of patients experiencing 1 or more exacerbations | 2 2 (median effect = 2) | |
| M | Adherence | 0‐21 | > 50% M | B | Comprehensiveness of screening and counselling | 1 | |
| M | Adherence | 41‐70 | > 50% F | W,B,H,A | Medication adherence | 1 | |
| M | Adherence | 0‐21 | — | — | Medication adherence | 1 | |
| M | Adherence | 41‐70 | M = F (± 3%) | W,B,H,A | Medication adherence | 1 | |
| M | Adherence | 0‐21 | — | — | Medication adherence | 1 | |
| M | Adherence | 41‐70 | > 50% M | W,B,H,A | Adherence (completion of all 3 recommended laboratory tests) | 2 | |
| M | Adherence | 41‐70 | M = F (± 3%) | W,B,H,A | Medication adherence | 1 | |
| M | Adherence | 41‐70 | M = F (± 3%) | — | Completion of all recommended laboratory tests | 1 | |
| M | Adherence | ≥ 71 | > 50% F | B | Medication adherence Systolic blood pressure Diastolic blood pressure | 1 2 1 (median effect = 1) | |
| M | Adherence | 41‐70 | > 50% M | W,B | Medication adherence Refill adherence Appointment adherence | 2 2 2 (median effect = 2) | |
| M | Adherence | — | — | — | Medication refill rate | 1 | |
| M | Adherence | 41‐70 | > 50% M | W | Medication adherence | 1 | |
| M | Adherence | ≥ 71 | > 50% F | — | Medication non‐adherence Cognitive assessment | 1 2 (median effect = 2) | |
| M | Adherence | 41‐70 | M = F (± 3%) | W,B,H,A | Adherence rate Therapeutic coverage | 2 2 (median effect = 2) | |
| M | Adherence | 41‐70 | > 50% F | B | Medication adherence Diet Moderate or greater intensity physical activity | 2 1 4 (median effect = 2) | |
| M | Adherence | — | — | — | Medication adherence | 1 | |
| M | Adherence | ≥ 71 | — | — | Medication adherence | 1 | |
| M | Adherence | 41‐70 | M = F (± 3%) | — | HRQLAdherence to statins | 1 | |
| M | Adherence | — | — | — | Medication adherence (refill rate) | 1 | |
| M | Adherence | 41‐70 | — | — | Adherence and adverse events | 1 | |
| M | Adherence | 41‐70 | > 50% M | B | Retinopathy examination | 4 | |
| M | Adherence | 41‐70 | > 50% F | — | 6‐month point prevalence | 1 | |
| M | Adherence | — | — | — | Adherence to medications | 2 | |
| M | Adherence | 41‐70 | > 50% F | W,B,A | Medication adherence | 1 | |
| M | Adherence | 41‐70 | M = F (± 3%) | W,B,A | Medication adherence | 1 | |
| M | Diabetes mellitus | 41‐70 | > 50% M | W | Glycated haemoglobin | 2 | |
| M | Diabetes mellitus | 41‐70 | > 50% F | W,B,H | Maternal blood glucose level Infant birth weight | 2 2 (median effect = 2) | |
| M | Diabetes mellitus | 41‐70 | > 50% F | W,B,H,A | Glycated haemoglobin Medication adherence Quality of life Cost‐effectiveness | 2 2 2 1 (median effect = 2) | |
| M | Diabetes mellitus | 41‐70 | > 50% M | H | Glycated haemoglobin | 4 | |
| M | Diabetes mellitus | — | — | — | Glycated haemoglobin | 1 | |
| M | Diabetes mellitus | 41‐70 | > 50% F | H | Glycated haemoglobin Health distress Global health Hypoglycaemia Hyperglycaemia Activity limitation Fatigue Physical activity levels Communication with physician Glucose monitoring Self‐efficacy Healthcare utilisation | 4 4 4 2 4 4 4 2 4 1 4 2 (median effect = 4) | |
| M | Diabetes mellitus | 41‐70 | > 50% F | W,H | Depression Days cut down on activities because of illness Diabetes‐specific health‐related quality of life Satisfaction with care (English speakers only) General health‐related quality of life (English speakers only) | 1 2 1 1 2 6 1 1 (median effect = 1) | |
| M | Diabetes mellitus | 41‐70 | > 50% M | W,B,H | Glucose monitoring Foot inspection Weight monitoring Medication adherence Glycated haemoglobin Serum glucose levels Diabetic symptoms (all) Hyperglycaemic symptoms Hypoglycaemic symptoms Vascular symptoms Other symptoms Satisfaction with care (summary score) | 1 1 2 4 2 2 1 2 2 2 1 1 (median effect = 2) | |
| M | Diabetes mellitus | 41‐70 | > 50% F | W,B,H,A | Change in self management behaviour (self‐monitoring of blood glucose and self‐monitoring of diabetic foot) | 1 | |
| M | Diabetes mellitus | 41‐70 | > 50% M | — | Glycated haemoglobin Health‐related quality of life (mental) Health‐related quality of life (physical) | 1 1 2 (median effect = 1) | |
| M | Heart failure | 41‐70 | > 50% M | — | All‐cause mortality Re‐hospitalisation Emergency room use (composite outcome) | 1 | |
| M | Heart failure | 41‐70 | > 50% M | W,B | Readmission for any reason or death from any cause | 4 | |
| M | Heart failure | ≥ 71 | > 50% M | — | Packer clinical composite score: death, hospital admission for heart failure, withdrawal from study due to worsening heart failure, 7‐point global health assessment questionnaire | 2 | |
| M | Heart failure | 41‐70 | > 50% M | — | Cardiovascular deaths and hospitalisations (outcomes in isolation included cardiovascular deaths, hospitalisations for heart failure, and time to primary endpoint) | 1 | |
| M | HIV | — | > 50% M | A | Time to virological failure (viral load > 400 copies/mL on 2 consecutive measurements) | 2 | |
| M | Hypercholestorolemia | 41‐70 | > 50% F | W | Total cholesterol reduction | 2 | |
| M | Hypercholesterolemia | 41‐70 | > 50% F | B | Total cholesterol reduction | 2 | |
| M | Hypertension | 41‐70 | > 50% F | W,B,H | Blood pressure control at 6 months | 2 | |
| M | Hypertension | 41‐70 | > 50% F | H | Change in minutes of moderate or greater physical activity Change in systolic blood pressure | 1 2 (median effect = 2) | |
| M | Hypertension | — | — | — | Blood pressure | 1 | |
| M | Hypertension | 41‐70 | > 50% M | W,H | Proportion to achieve guideline‐recommended blood pressure goals Systolic blood pressure Diastolic blood pressure | 2 1 2 (median effect = 2) | |
| M | Hypertension | 41‐70 | > 50% F | — | Systolic blood pressure | 2 | |
| M | Mental health | 22‐40 | > 50% F | W,B | Quality of life (physical scale score and mental scale score) Depression Stress levels Total well‐being | 2, 2 2 2 2 (median effect = 2) | |
| M | Mental health | 22‐40 | > 50% M | W | Yale‐Brown obsessive compulsive scale (YBOCS) score | 1 | |
| M | Mental health | — | — | — | Emotional health Physical health Stress | 1 1 1 (median effect = 1) | |
| M | Obstructive sleep apnoea syndrome | 41‐70 | — | — | Continuous positive airway pressure use | 2 | |
| M | Obstructive sleep apnoea syndrome | 41‐70 | > 50% M | — | Continuous positive airway pressure use | 1 | |
| M | Smoking | 22‐40 | M = F (± 3%) | — | Repeated point abstinence | 1 | |
| M | Smoking | 22‐40 | > 50% F | W,B,H,A | Re‐enrollment into quit line support | 1 | |
| M | Smoking | 22‐40 | > 50% F | W,B | Smoking abstinence | 2 | |
| M | Smoking | 41‐70 | > 50% M | — | Self‐reported abstinence Biochemically confirmed smoking abstinence | 2 4 (median effect = 3) | |
| M | Smoking | 0‐21 | > 50% M | A | Stage of change Self‐efficacy Decisional balance | 5 5 5 (median effect = 5) | |
| M | Smoking | 41‐70 | > 50% M | — | Smoking abstinence | 4 | |
| M | Smoking | 41‐70 | > 50% M | — | Smoking abstinence | 2 | |
| M | Smoking | — | — | — | Smoking abstinence | 2 | |
| M | Smoking | 41‐70 | M = F (± 3%) | W,B,H,A | Biochemically confirmed tobacco abstinence at 6 months | 1 | |
| M | Smoking | 41‐70 | > 50% M | W,B,A | 24‐h point prevalence 7‐d point prevalence 6‐month prolonged abstinence | 2 2 2 (median effect = 2) | |
| M | Spinal cord dysfunction | 41‐70 | > 50% M | W,B,H | Prevalence of pressure ulcers Depression severity Healthcare utilisation | 2 1 2 (median effect = 2) | |
| aStudy type: E: either prevention or management; M: management of long‐term condition; P: prevention. | |||||||
| Outcome or subgroup title | No. of studies | No. of participants | Statistical method | Effect size |
| 1 Immunisation in children Show forest plot | 5 | 10454 | Risk Ratio (M‐H, Random, 95% CI) | 1.25 [1.18, 1.32] |
| 2 Immunisation in adolescents Show forest plot | 2 | 5725 | Risk Ratio (M‐H, Random, 95% CI) | 1.06 [1.02, 1.11] |
| 3 Immunisation in adults Show forest plot | 2 | 1743 | Risk Ratio (M‐H, Random, 95% CI) | 2.18 [0.53, 9.02] |
| Outcome or subgroup title | No. of studies | No. of participants | Statistical method | Effect size |
| 1 Breast cancer screening Show forest plot | 4 | Risk Ratio (M‐H, Random, 95% CI) | Subtotals only | |
| 1.1 Multimodal/complex interventions | 2 | 462 | Risk Ratio (M‐H, Random, 95% CI) | 2.17 [1.55, 3.04] |
| 1.2 IVR | 2 | 2599 | Risk Ratio (M‐H, Random, 95% CI) | 1.05 [0.99, 1.11] |
| 2 Colorectal cancer screening Show forest plot | 7 | Risk Ratio (M‐H, Random, 95% CI) | Subtotals only | |
| 2.1 Multimodal/complex intervention | 3 | 1013 | Risk Ratio (M‐H, Random, 95% CI) | 2.19 [1.88, 2.55] |
| 2.2 IVR (shorter follow‐up) | 2 | 16915 | Risk Ratio (M‐H, Random, 95% CI) | 1.36 [1.25, 1.48] |
| 2.3 IVR (longer follow‐up) | 2 | 21335 | Risk Ratio (M‐H, Random, 95% CI) | 1.01 [0.97, 1.05] |
| Outcome or subgroup title | No. of studies | No. of participants | Statistical method | Effect size |
| 1 BMI adults Show forest plot | 3 | 672 | Mean Difference (IV, Random, 95% CI) | ‐0.64 [‐1.38, 0.11] |
| Outcome or subgroup title | No. of studies | No. of participants | Statistical method | Effect size |
| 1 Glycated haemoglobin Show forest plot | 7 | 1216 | Mean Difference (IV, Random, 95% CI) | ‐0.26 [‐0.50, ‐0.01] |
| 2 Self‐monitoring of diabetic foot Show forest plot | 2 | 498 | Std. Mean Difference (IV, Random, 95% CI) | 0.24 [0.06, 0.42] |
| Outcome or subgroup title | No. of studies | No. of participants | Statistical method | Effect size |
| 1 Cardiac mortality Show forest plot | 2 | 215 | Risk Ratio (M‐H, Random, 95% CI) | 0.60 [0.21, 1.67] |
| 2 All‐cause mortality Show forest plot | 3 | 2165 | Risk Ratio (M‐H, Random, 95% CI) | 1.00 [0.79, 1.28] |
| Outcome or subgroup title | No. of studies | No. of participants | Statistical method | Effect size |
| 1 Systolic blood pressure Show forest plot | 3 | 65256 | Mean Difference (IV, Random, 95% CI) | ‐1.89 [‐2.12, ‐1.66] |
| 2 Diastolic blood pressure Show forest plot | 2 | 65056 | Mean Difference (IV, Random, 95% CI) | 0.02 [‐2.62, 2.66] |
| Outcome or subgroup title | No. of studies | No. of participants | Statistical method | Effect size |
| 1 Smoking abstinence Show forest plot | 7 | 2915 | Risk Ratio (M‐H, Random, 95% CI) | 1.20 [0.98, 1.46] |