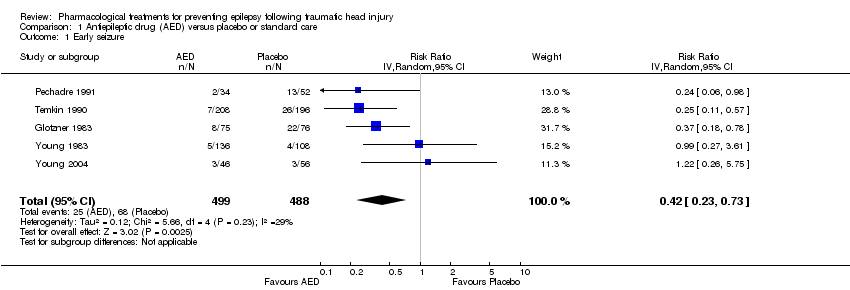
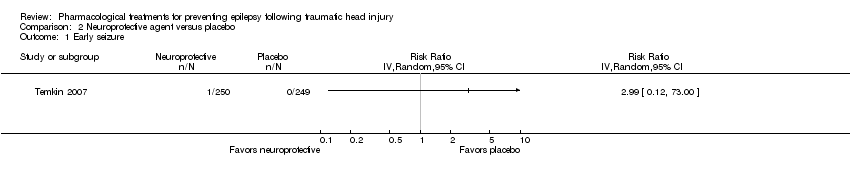
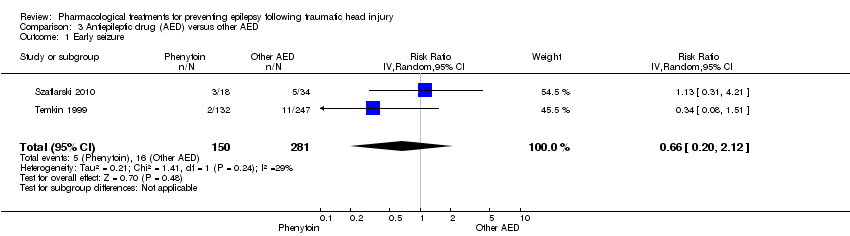
| 1 Early seizure Show forest plot | 5 | 987 | Risk Ratio (IV, Random, 95% CI) | 0.42 [0.23, 0.73] |
|
| 2 Late seizure Show forest plot | 6 | 1029 | Risk Ratio (IV, Random, 95% CI) | 0.91 [0.57, 1.46] |
|
| 3 All‐cause mortality Show forest plot | 5 | 1065 | Risk Ratio (IV, Random, 95% CI) | 1.08 [0.79, 1.46] |
|
| 4 Any serious event Show forest plot | 2 | 568 | Risk Ratio (IV, Random, 95% CI) | 1.63 [0.73, 3.66] |
|
| 5 Skin rash Show forest plot | 2 | 568 | Risk Ratio (IV, Random, 99% CI) | 1.65 [0.54, 5.04] |
|
| 6 Sensitivity analysis ‐ early seizure: age of population Show forest plot | 4 | 885 | Risk Ratio (IV, Random, 95% CI) | 0.36 [0.21, 0.60] |
|
| 7 Sensitivity analysis ‐ early seizure: study quality Show forest plot | 2 | 506 | Risk Ratio (IV, Random, 95% CI) | 0.48 [0.11, 2.18] |
|
| 8 Subgroup: late seizure: type of AED Show forest plot | 6 | 1029 | Risk Ratio (IV, Random, 95% CI) | 0.91 [0.57, 1.46] |
|
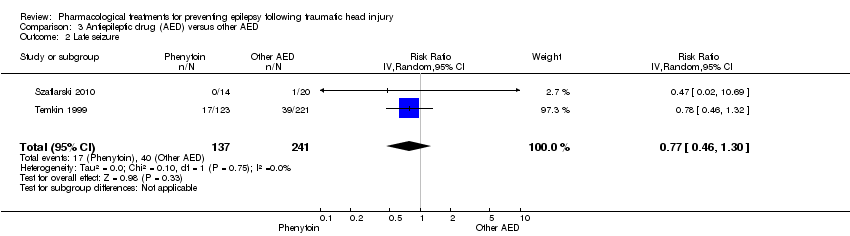
| 8.1 Late seizure ‐ phenytoin | 4 | 752 | Risk Ratio (IV, Random, 95% CI) | 0.83 [0.40, 1.70] |
| 8.2 Late seizure ‐ other AED | 2 | 277 | Risk Ratio (IV, Random, 95% CI) | 0.96 [0.46, 1.99] |
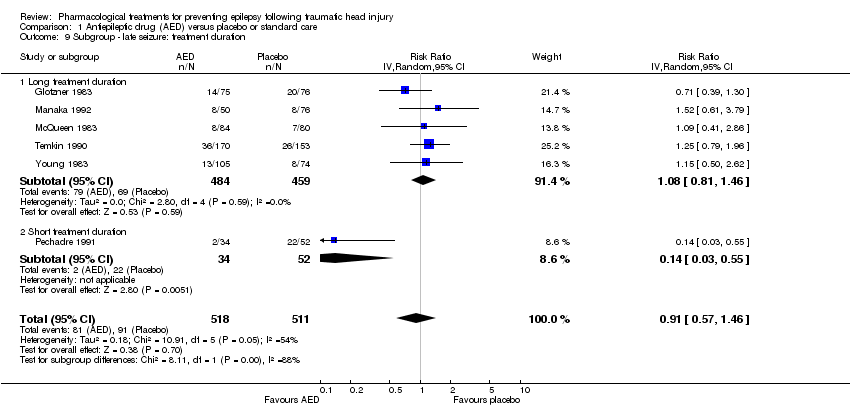
| 9 Subgroup ‐ late seizure: treatment duration Show forest plot | 6 | 1029 | Risk Ratio (IV, Random, 95% CI) | 0.91 [0.57, 1.46] |
|
| 9.1 Long treatment duration | 5 | 943 | Risk Ratio (IV, Random, 95% CI) | 1.08 [0.81, 1.46] |
| 9.2 Short treatment duration | 1 | 86 | Risk Ratio (IV, Random, 95% CI) | 0.14 [0.03, 0.55] |
| 10 Sensitivity analysis ‐ late seizure: age of population Show forest plot | 5 | 706 | Risk Ratio (IV, Random, 95% CI) | 0.81 [0.44, 1.48] |
|
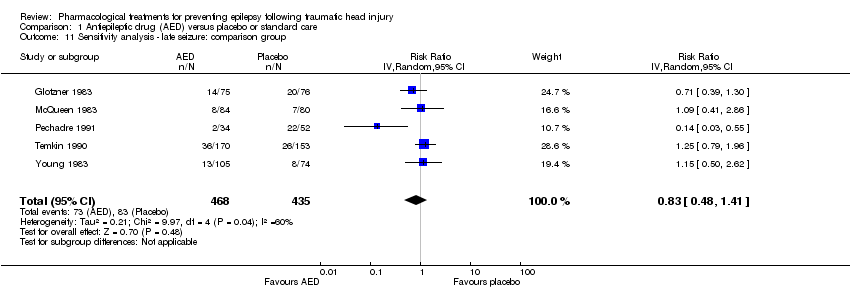
| 11 Sensitivity analysis ‐ late seizure: comparison group Show forest plot | 5 | 903 | Risk Ratio (IV, Random, 95% CI) | 0.83 [0.48, 1.41] |
|
| 12 Sensitivity analysis ‐ late seizure: study quality Show forest plot | 1 | 323 | Risk Ratio (IV, Fixed, 95% CI) | 1.25 [0.79, 1.96] |
|
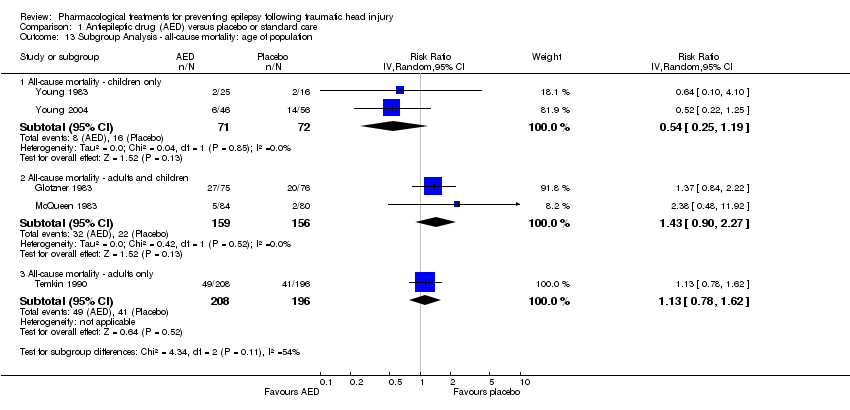
| 13 Subgroup Analysis ‐ all‐cause mortality: age of population Show forest plot | 5 | | Risk Ratio (IV, Random, 95% CI) | Subtotals only |
|
| 13.1 All‐cause mortality ‐ children only | 2 | 143 | Risk Ratio (IV, Random, 95% CI) | 0.54 [0.25, 1.19] |
| 13.2 All‐cause mortality ‐ adults and children | 2 | 315 | Risk Ratio (IV, Random, 95% CI) | 1.43 [0.90, 2.27] |
| 13.3 All‐cause mortality ‐ adults only | 1 | 404 | Risk Ratio (IV, Random, 95% CI) | 1.13 [0.78, 1.62] |
| 14 Subgroup analysis ‐ all‐cause mortality: treatment duration Show forest plot | 5 | | Risk Ratio (IV, Random, 95% CI) | Subtotals only |
|
| 14.1 All‐cause mortality ‐ short‐term treatment duration | 2 | 346 | Risk Ratio (IV, Random, 95% CI) | 0.69 [0.39, 1.24] |
| 14.2 All‐cause mortality ‐ long‐term treatment duration | 3 | 719 | Risk Ratio (IV, Random, 95% CI) | 1.24 [0.93, 1.65] |
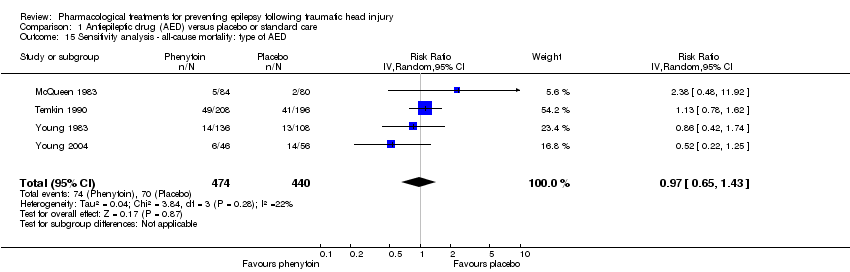
| 15 Sensitivity analysis ‐ all‐cause mortality: type of AED Show forest plot | 4 | 914 | Risk Ratio (IV, Random, 95% CI) | 0.97 [0.65, 1.43] |
|
| 16 Sensitivity analysis ‐ all‐cause mortality: study quality Show forest plot | 2 | 506 | Risk Ratio (IV, Fixed, 95% CI) | 1.00 [0.72, 1.41] |
|