Metilfenidato para niños y adolescentes con trastorno de déficit de atención e hiperactividad (TDAH)
Información
- DOI:
- https://doi.org/10.1002/14651858.CD009885.pub2Copiar DOI

- Base de datos:
-
- Cochrane Database of Systematic Reviews
- Versión publicada:
-
- 25 noviembre 2015see what's new
- Tipo:
-
- Intervention
- Etapa:
-
- Review
- Grupo Editorial Cochrane:
-
Grupo Cochrane de Problemas de desarrollo, psicosociales y de aprendizaje
- Copyright:
-
- Copyright © 2016 The Cochrane Collaboration. Published by John Wiley & Sons, Ltd.
Cifras del artículo
Altmetric:
Citado por:
Autores
Contributions of authors
OJS has overall responsibility for the review.
OJS, MS, SR, CGr, KBR, ES and CGl contributed to writing the protocol.
KBR developed the search strategy.
OJS, ER, HBK, TDN, MS, MH, SR, FLM, BF and KBR selected the studies.
OJS, ER, HBK, TDN, MS, MH, SR, CGr, FLM, CMM, DG, KBR, DG, MZ, RK and ES extracted data and evaluated bias.
OJS and CGl developed the analytical strategy.
OJS, ER, HBK, MH, FLM and CRMM entered data into RevMan.
OJS, ER, HBK, MH, FLM and CRMM conducted the statistical analysis.
All review authors participated in discussion and writing of the final review.
Sources of support
Internal sources
-
Psychiatric Research Unit, Region Zealand Psychiatry, Roskilde, Denmark.
Ole Jakob Storebø, Erica Ramstad, Helle B. Krogh, Trine Danvad Nilausen, Mathilde Holmskov, Frederik Løgstrup Magnusson, and Erik Simonsen worked on this review during office hours
-
Copenhagen Trial Unit, Centre for Clinical Intervention Research, Copenhagen University Hospital, Denmark.
Maria Skoog and Christian Gluud worked on this review during office hours
External sources
-
Region Zealand Research Foundation, Denmark.
This review is supported by a grant (DKR 532,901) from the Region Zealand Research Foundation
Declarations of interest
Ole Jakob Storebø ‐ none known.
Erica Ramstad ‐ none known.
Helle B. Krogh ‐ none known.
Trine Danvad Nilausen ‐ none known.
Maria Skoog ‐ none known.
Mathilde Holmskov ‐ none known.
Susanne Rosendal ‐ none known.
Camilla Groth ‐ received funds from the Lundbeck Foundation to finance part of her Ph.D in the paediatric field on Tourette Syndrome. CG confirms that none of these funds were used to work on this review.
Frederik Løgstrup Magnusson ‐ none known.
Carlos R Moreira‐Maia ‐ receives financial research support from the Conselho Nacional de Desenvolvimento Científico e Tecnológico (CNPq). CRMM has served as speaker for Novartis, has developed educational materials for Novartis, has received travel awards from the Health Technology Assessment Institute (IATS) and the Universidade Federal do Rio Grande do Sul (UFRGS), and has received travel and registration support to attend the 5th World Congress on ADHD from the World Federation of ADHD.
Donna Gillies ‐ is an Editor with the Cochrane Developmental, Psychosocial and Learning Problems Group.
Kirsten Buch Rasmussen ‐ none known.
Dorothy Gauci ‐ none known.
Morris Zwi ‐ sits on the Paediatric Medicines Expert Advisory Group at the Medicines and Healthcare Products Regulatory Agency, which considers applications regarding licensing of paediatric medicines. Payment for MZ's attendance at this meeting goes to his National Health Service (NHS) organisation.
Richard Kirubakaran ‐ is currently employed by Cochrane South Asia. His salary is funded by the Effective Healthcare Research Consortium (EHCRC) for the Department for International Development (DFID), UK.
Bente Forsbøl ‐ none known.
Erik Simonsen ‐ none known.
Christian Gluud ‐ none known.
Acknowledgements
We thank Janus Christian Jacobsen, Ph.D., at the Copenhagen Trial Unit, for elaborating the idea for this review.
We thank Trine Lacoppidan Kæstel, Research Librarian, at the Psychiatric Research Unit, Region Zealand, Denmark, for helping with searches and descriptions of measurement scales.
We thank Lise Aagaard, Ph.D. (pharm), at the University of Southern Denmark, for giving advice during production of this review.
We thank Jesper Pedersen, Ph.D., M.D., at the Department of Children and Youth Psychiatry, Region Zealand, Denmark, for supporting this project.
We thank Torben Bille, M.D., at the Pediatric Department, Holbaek Hospital, Copenhagen, Denmark, for helping to write the protocol and for selecting studies.
We thank Maria Gaardahl, Kim Boesen, Farhad Shokraneh and Rene Spijker for helping with translation of articles written in Japanese, Italian, Turkish, Farsi and Dutch.
We thank Nadia Pedersen, stud.scient.san.publ., at the Psychiatric Research Unit, Region Zealand, Denmark, for helping to finalise the review.
We thank Per Hove Thomsen, Ph.D., M.D., Department of Clinical Medicine ‐ Psychatric Hospital for Children and Adolescents, Aarhus University
We thank Dr. Martina Riegl, Senior Medical Assessor, at Medicines and Healthcare Products Regulatory Agency (MHRA), Special Populations Unit (Paediatrics), London, for helping with data extraction and assessment of risk of bias.
We thank Jacob Riis, User Experience Lead, at the Nordic Cochrane Centre, Copenhagen, Denmark, for helping with Review Manager issues.
We thank Rasmus Moustgaard, Senior Systems Architect, at the Nordic Cochrane Centre, Copenhagen, Denmark, for helping with Review Manager issues.
We are grateful to the many authors who kindly responded to our requests for further information on the trials in which they were involved.
Thanks also to the Psychiatric Research Unit, Region Zealand Psychiatry, Roskilde, Denmark; Region Zealand Research Foundation, Denmark; and the Copenhagen Trial Unit, Centre for Clinical Intervention Research, Copenhagen University Hospital, Copenhagen, Denmark, for funding and enabling the review.
We also wish to warmly thank Geraldine McDonald (Co‐ordinating Editor), Joanne Wilson (Managing Editor), Gemma O'Loughlin (Assistant Managing Editor) and Margaret Anderson (Trials Search Co‐ordinator) of the Cochrane Developmental, Psychosocial and Learning Problems Group for providing help and support.
Finally, we are grateful for the advice and support received from Toby Lasserson (Senior Editor), and David Tovey (Editor‐in‐chief) of the Cochrane Collaboration.
Version history
| Published | Title | Stage | Authors | Version |
| 2023 Mar 27 | Methylphenidate for children and adolescents with attention deficit hyperactivity disorder (ADHD) | Review | Ole Jakob Storebø, Maja Rosenberg Overby Storm, Johanne Pereira Ribeiro, Maria Skoog, Camilla Groth, Henriette E Callesen, Julie Perrine Schaug, Pernille Darling Rasmussen, Christel-Mie L Huus, Morris Zwi, Richard Kirubakaran, Erik Simonsen, Christian Gluud | |
| 2015 Nov 25 | Methylphenidate for children and adolescents with attention deficit hyperactivity disorder (ADHD) | Review | Ole Jakob Storebø, Erica Ramstad, Helle B. Krogh, Trine Danvad Nilausen, Maria Skoog, Mathilde Holmskov, Susanne Rosendal, Camilla Groth, Frederik L Magnusson, Carlos R Moreira‐Maia, Donna Gillies, Kirsten Buch Rasmussen, Dorothy Gauci, Morris Zwi, Richard Kirubakaran, Bente Forsbøl, Erik Simonsen, Christian Gluud | |
| 2012 May 16 | Methylphenidate for attention deficit hyperactivity disorder (ADHD) in children and adolescents | Protocol | Ole Jakob Storebø, Susanne Rosendal, Maria Skoog, Camilla Groth, Torben Bille, Kirsten Buch Rasmussen, Erik Simonsen, Christian Gluud | |
Differences between protocol and review
1. Methods section. Criteria for considering studies for this review. Types of studies.
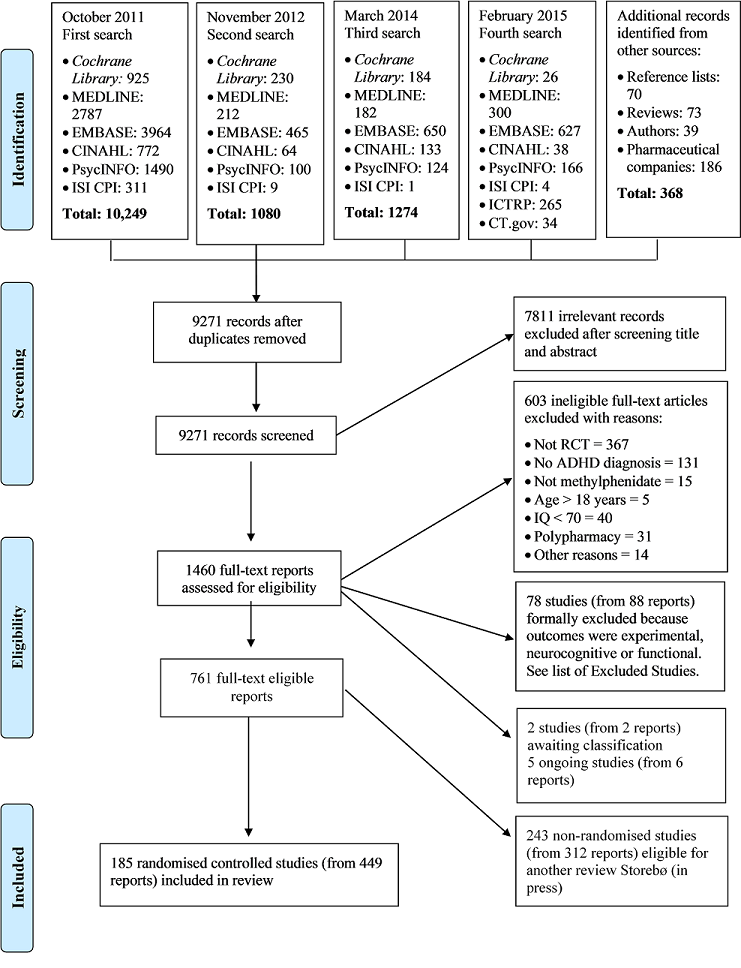
We decided to split the review into two systematic reviews. The present review deals with benefits and harms of methylphenidate as reported by RCTs. Another systematic review is being prepared that will assess the risk of harms based on the findings of non‐randomised studies.
2. Methods section. Criteria for considering studies for this review. Types of participants.
We decided to include trials in which at least 75% of participants were 18 years of age or younger, and the mean age of the trial population was 18 years of age or younger. We included two trials with such participants. The effects of methylphenidate intervention on any outcome did not change when these two trials were removed from the analysis.
We decided to include trials in which at least 75% of participants had a normal intellectual quotient (IQ > 70). We included three trials with such participants. The effects of methylphenidate intervention on any outcome did not change when these three trials were removed from the analysis.
3. Methods section. Criteria for considering studies for this review. Types of outcome measures.
Duration of studies. We changed the subdivision of duration from short term (≤ 6 months), medium term (6 to 12 months) and long term (> 12 months) to short term (≤ 6 months) and long term (> 6 months) because no trials had a duration of between 6 and 12 months. Only one trial (Jensen 1999 (MTA)) provided data on a duration longer than six months (14 months). This change regarding duration classification was included in analyses of ADHD symptoms and general behaviour.
4. Methods section. Search methods for identification of studies.
We did not search for dissertations in WorldCat, Networked Digital Library of Theses and Dissertations, OpenGrey, DART‐Europe E‐theses Portal and Theses Canada. We did not contact the medical authorities in the European Union for information about beneficial and adverse events. We did not ask for access to security updates and risk management plans of pharmaceutical companies.
5. Methods section. Data collection and analysis. Selection of studies and data extraction and management.
More review authors than stated in the protocol screened titles and abstracts, extracted data, entered data into RevMan and conducted statistical analyses in RevMan.
6. Methods section. Data collection and analysis. Assessment of risk of bias in included studies.
Vested interests. We did not evaluate what effects might have been seen if the study author had conducted previous trials addressing the same interventions.
7. Methods section. Data collection and analysis. Measures of treatment effect. Continuous data.
For the primary outcome of teacher‐rated ADHD symptoms, we recalculated the SMD as MD on the ADHD‐RS (DuPaul 1991a), to check whether our result exceeded the minimum clinically important difference (MCID; Zhang 2005) for this specific rating scale. This was not stated in the protocol.
For the secondary outcome of quality of life, we recalculated the SMD as MD on the CHQ (Landgraf 1998), to check whether our results exceeded the MCID (Rentz 2005) for this specific rating scale. This was not stated in the protocol.
8. Methods section. Dealing with missing data.
We tried to obtain missing data by contacting the authors of the trials that were included in this review. When we were not able to obtain missing data, we conducted analyses using available (incomplete) data. We had intended to assess the impact of missing data by applying intention‐to‐treat as well as 'best‐case scenario' and 'worst‐case scenario' analyses. We could not use 'best‐case scenario' and 'worst‐case scenario' analyses in our assessment of benefits as there were no dichotomous outcomes. We decided not to use 'best‐case scenario' and 'worst‐case scenario' analyses in our assessment of adverse events, because we evaluated these analyses to be imprecise due to the high number of trials not reporting adverse events, and due to the high number of dropouts in the trials reporting adverse events. Moreover, we were unable to conduct intention‐to‐treat analyses for continuous outcomes due to lack of data for imputing means.
9. Methods section. Data collection and analysis. Assessment of reporting bias.
We did not compare results extracted from published journal reports versus results obtained from other sources (including correspondences) as a direct test for publication bias.
10. Methods section. Subgroup analysis and investigation of heterogeneity. Post hoc subgroup analyses.
-
Types of scales (e.g. Conners' Teacher Rating Scale (CTRS; Conners 1998a) versus Strengths and Weaknesses of ADHD Symptoms and Normal Behavior (SWAN) Scale (Swanson 2006).
-
Dose of methylphenidate (low dose (≤ 20 mg/d or ≤ 0.6 mg/kg/d) versus moderate/high dose (> 20 mg/d or > 0.6 mg/kg/d)).
-
Duration of treatment (short‐term trials (≤ six months) versus long‐term trials (> six months)).
-
Trial design (parallel‐group trials versus cross‐over trials (first period data and endpoint data)).
-
Medication status before randomisation (medication naive (> 80% of included participants were medication naive) versus not medication naive (< 20% of included participants were medication naive)).
-
Risk of bias (trials with low risk of bias versus trials with high risk of bias).
-
Cohort selection bias (trials with cohort selection bias of all participants versus trials without cohort selection bias)
11. Methods section. Data collection and analysis. Heterogeneity‐adjusted required information size and Trial Sequential Analysis.
We performed a Trial Sequential Analysis on the total number of serious adverse events and on the total number of non‐serious adverse events only, as they were the only outcomes with dichotomous data with a substantial number of outcomes. Trial Sequential Analysis can be conducted on individual types of adverse events, but for this, the accrued information would represent a minute fraction of the required information size (RIS). We were not able to conduct a Trial Sequential Analysis for teacher‐, independent assessor‐ or parent‐rated outcomes, as the programme can be used only for MDs, not for SMDs.
Keywords
MeSH
Medical Subject Headings (MeSH) Keywords
Medical Subject Headings Check Words
Adolescent; Child; Female; Humans; Male;
PICO
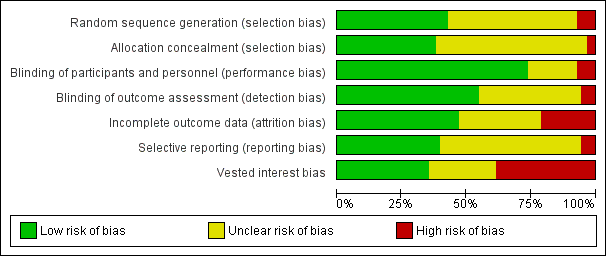
Risk of bias graph: review authors' judgements about each risk of bias item presented as percentages across all included studies.

Risk of bias summary: review authors' judgements about each risk of bias item for each included trial.
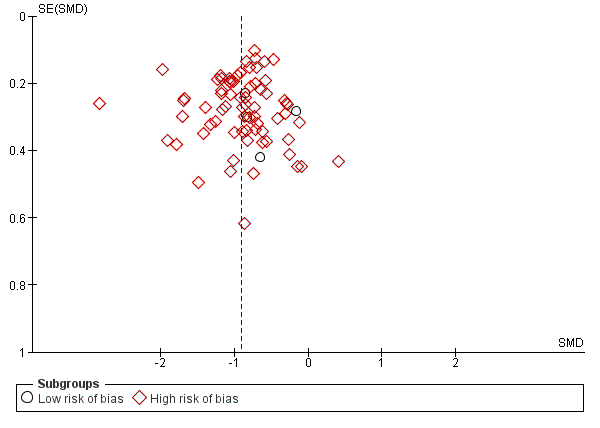
Funnel plot of comparison: 1. Teacher‐rated ADHD symptoms, outcome: 1.8 All data at low and high risk of bias (parallel‐group and cross‐over trials).

Trial Sequential Analysis: serious adverse events.
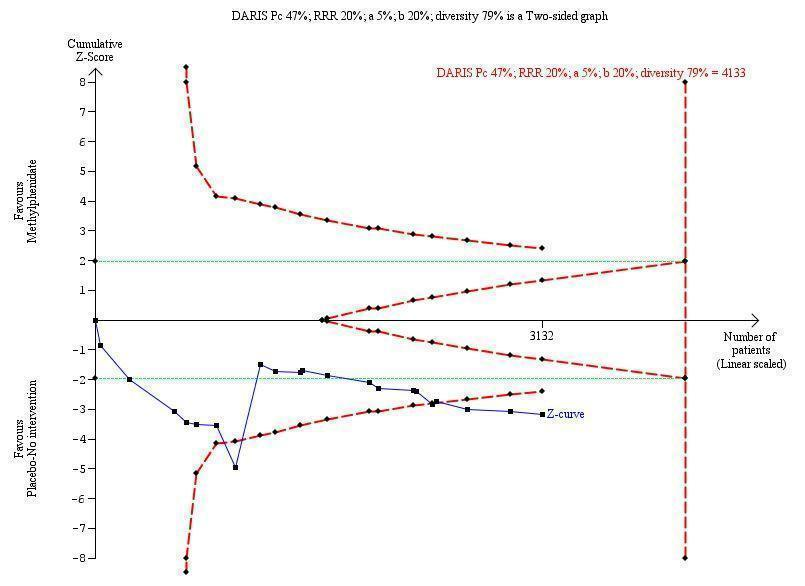
Trial Sequential Analysis: non‐serious adverse events.

Comparison 1 Teacher‐rated ADHD symptoms, Outcome 1 All parallel‐group trials and first‐period cross‐over trials.
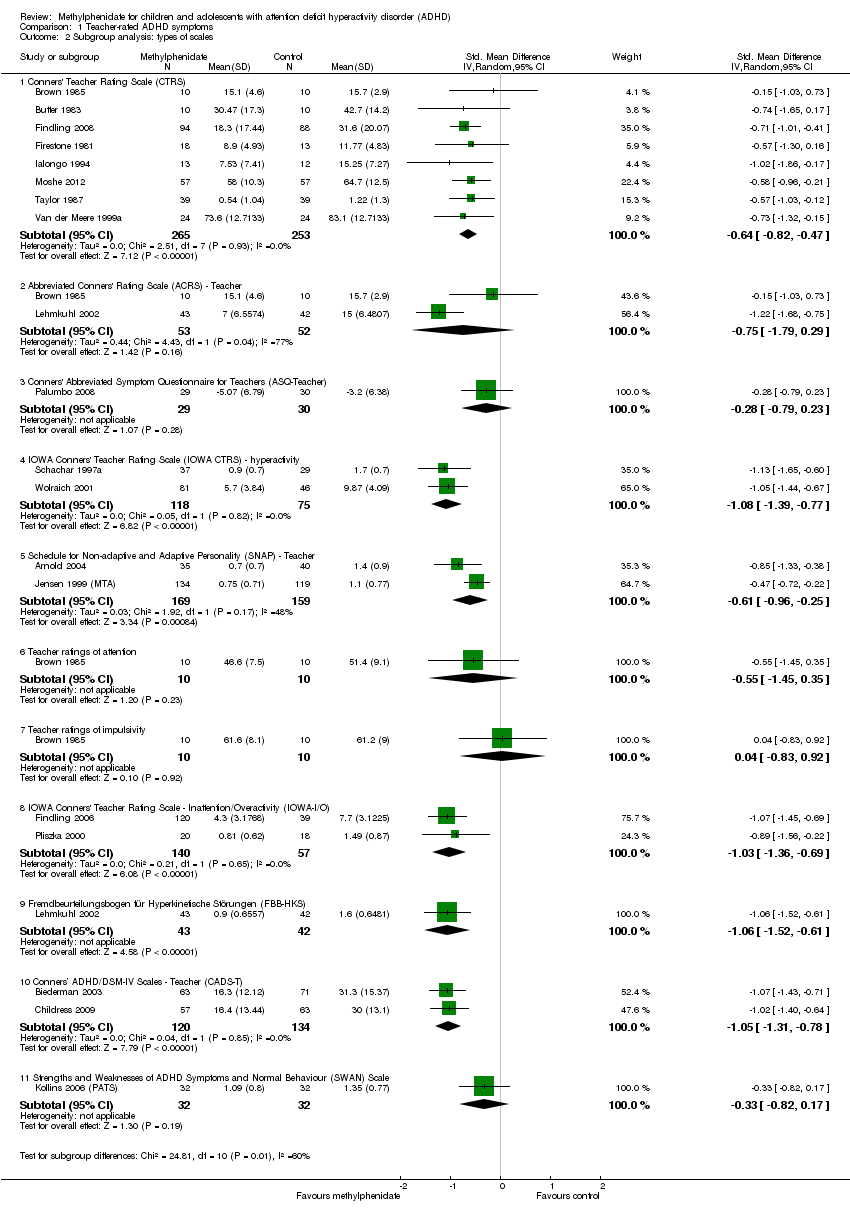
Comparison 1 Teacher‐rated ADHD symptoms, Outcome 2 Subgroup analysis: types of scales.

Comparison 1 Teacher‐rated ADHD symptoms, Outcome 3 Medication status: medication naive versus not medication naive.

Comparison 1 Teacher‐rated ADHD symptoms, Outcome 4 Subgroup analysis: duration of treatment.

Comparison 1 Teacher‐rated ADHD symptoms, Outcome 5 Subgroup analysis: dose.
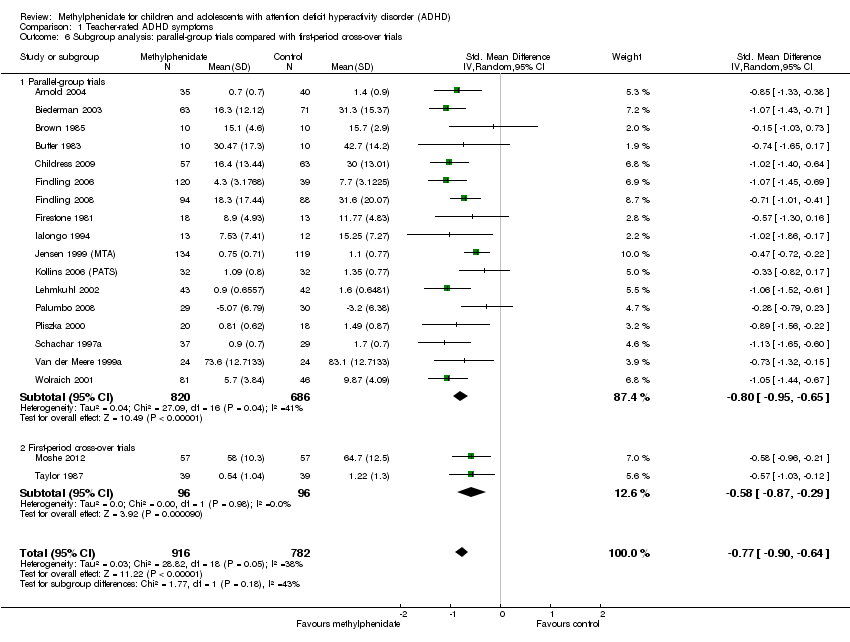
Comparison 1 Teacher‐rated ADHD symptoms, Outcome 6 Subgroup analysis: parallel‐group trials compared with first‐period cross‐over trials.

Comparison 1 Teacher‐rated ADHD symptoms, Outcome 7 Subgroup analysis: trials with cohort selection bias of all participants compared with trials without cohort selection bias of all participants.

Comparison 1 Teacher‐rated ADHD symptoms, Outcome 8 ADHD symptoms, cross‐over trial (endpoint data).

Comparison 1 Teacher‐rated ADHD symptoms, Outcome 9 ADHD symptoms, cross‐over trials (endpoint data), subgroup analysis: dose.
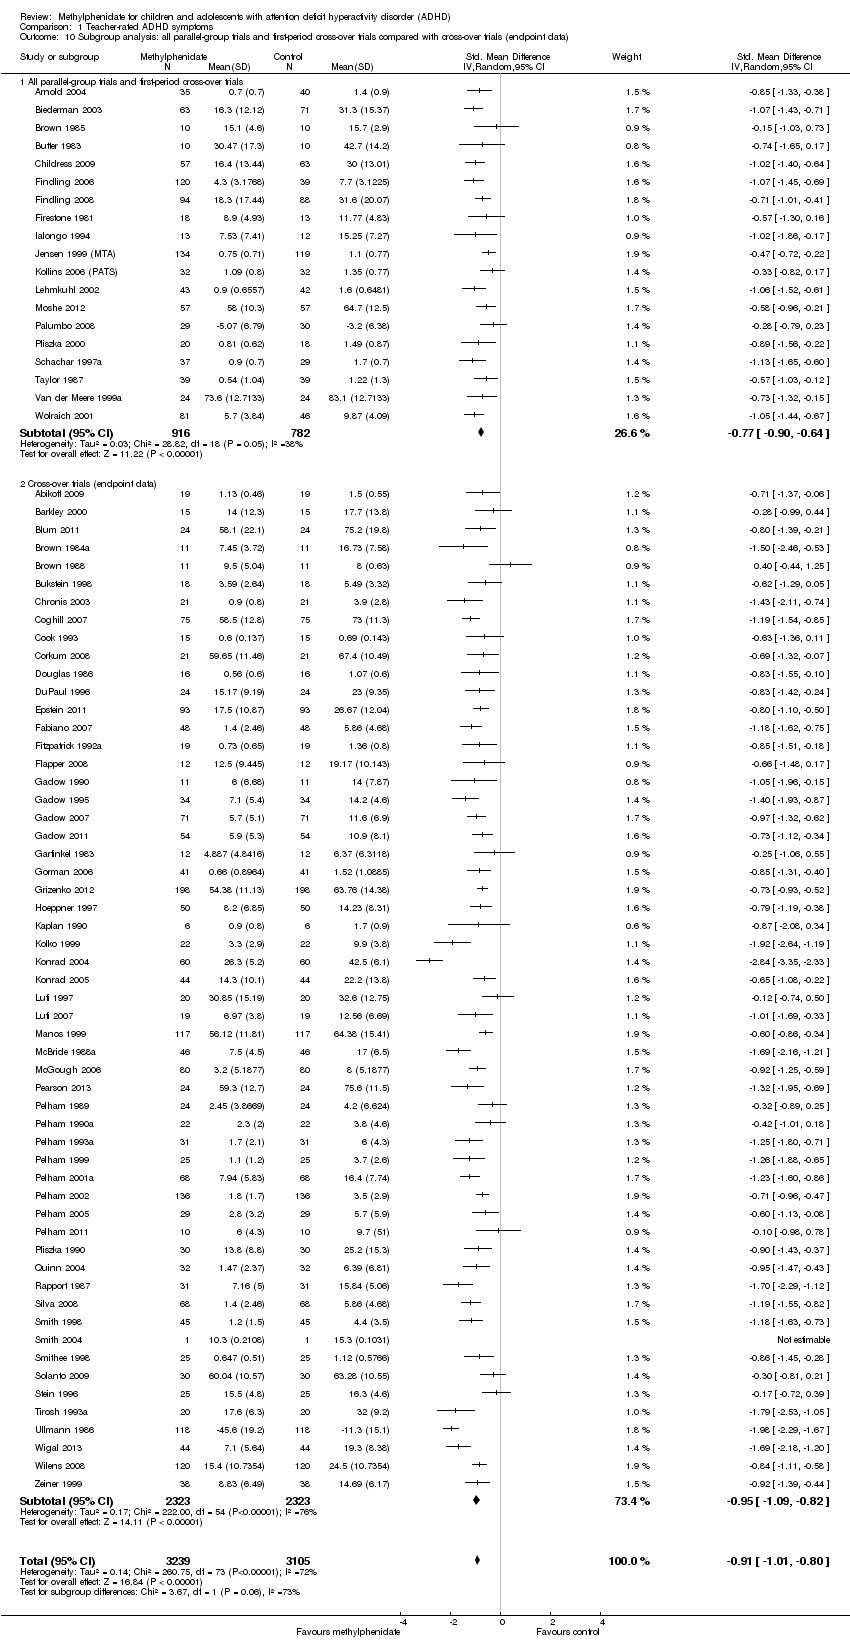
Comparison 1 Teacher‐rated ADHD symptoms, Outcome 10 Subgroup analysis: all parallel‐group trials and first‐period cross‐over trials compared with cross‐over trials (endpoint data).

Comparison 1 Teacher‐rated ADHD symptoms, Outcome 11 All parallel‐group trials and cross‐over trials: risk of bias.

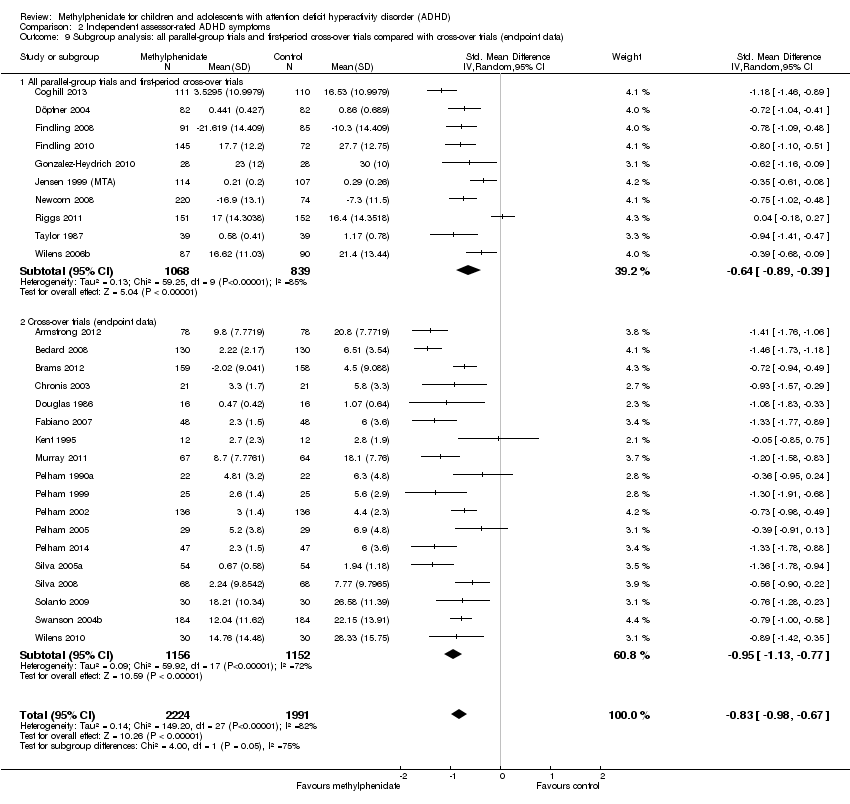
Comparison 2 Independent assessor‐rated ADHD symptoms, Outcome 1 All parallel‐group trials and first‐period cross‐over trials.

Comparison 2 Independent assessor‐rated ADHD symptoms, Outcome 2 Subgroup analysis: types of scales.
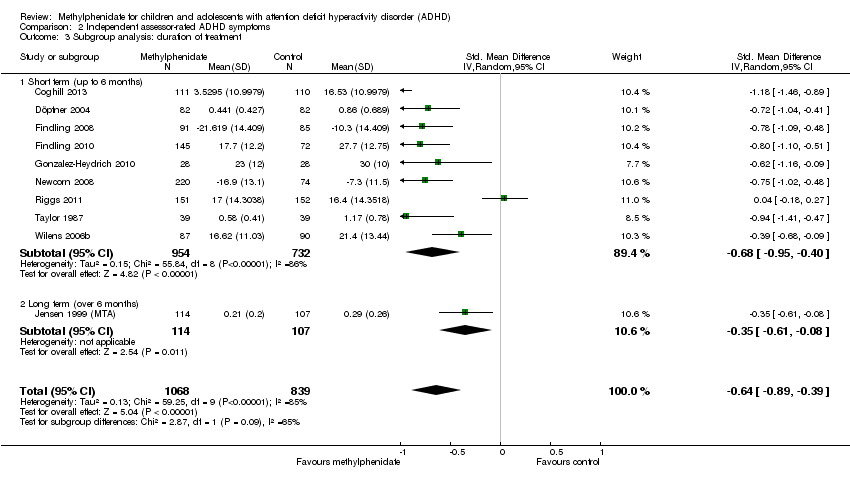
Comparison 2 Independent assessor‐rated ADHD symptoms, Outcome 3 Subgroup analysis: duration of treatment.
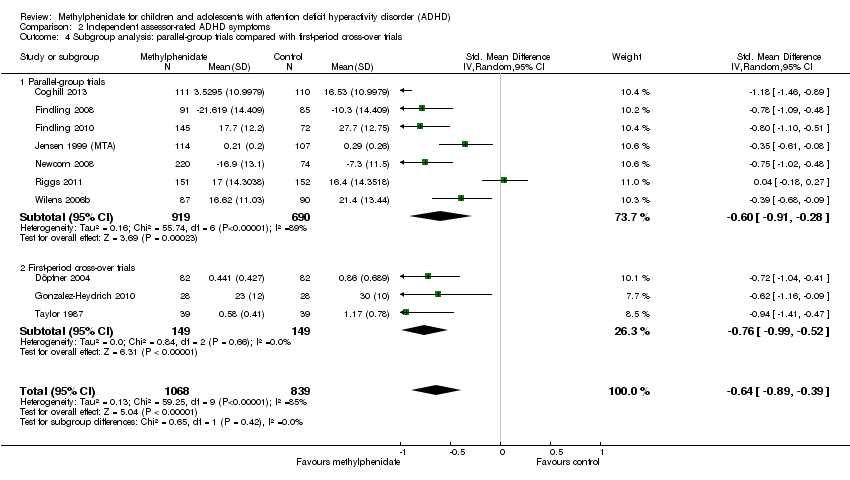
Comparison 2 Independent assessor‐rated ADHD symptoms, Outcome 4 Subgroup analysis: parallel‐group trials compared with first‐period cross‐over trials.
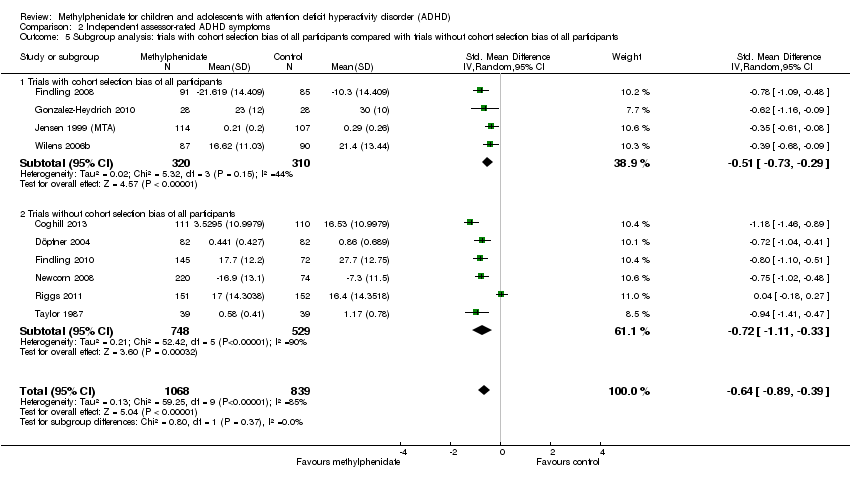
Comparison 2 Independent assessor‐rated ADHD symptoms, Outcome 5 Subgroup analysis: trials with cohort selection bias of all participants compared with trials without cohort selection bias of all participants.
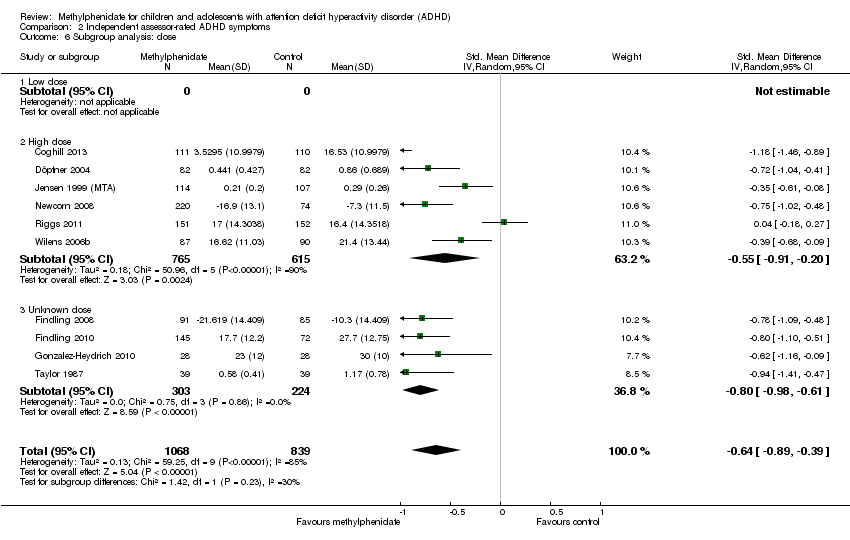
Comparison 2 Independent assessor‐rated ADHD symptoms, Outcome 6 Subgroup analysis: dose.

Comparison 2 Independent assessor‐rated ADHD symptoms, Outcome 7 ADHD symptoms, cross‐over trials (endpoint data), subgroup analysis: risk of bias.
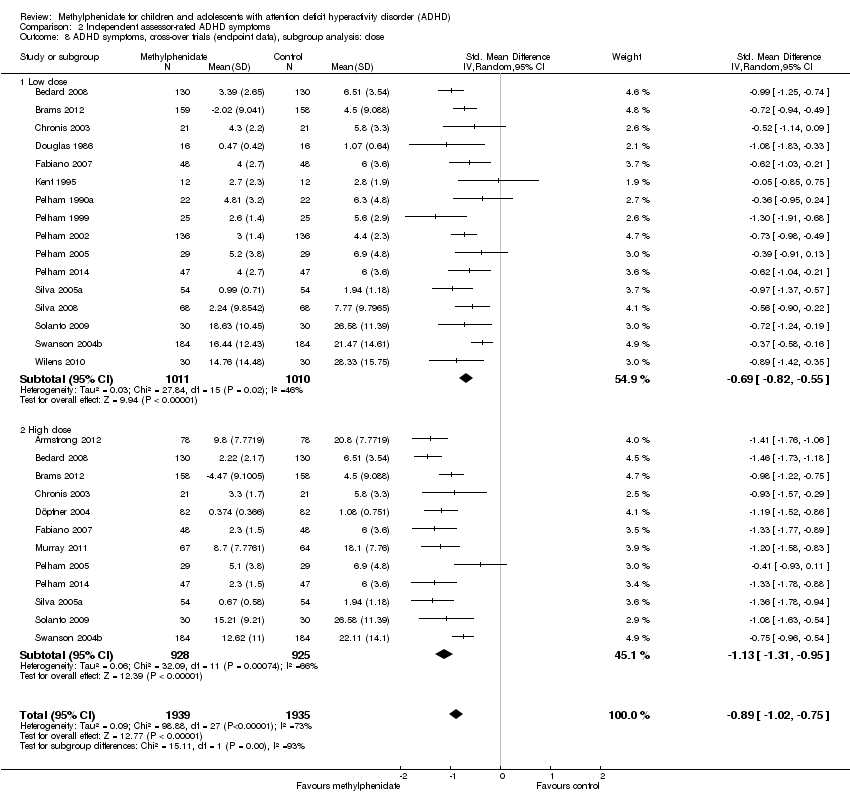
Comparison 2 Independent assessor‐rated ADHD symptoms, Outcome 8 ADHD symptoms, cross‐over trials (endpoint data), subgroup analysis: dose.
Comparison 2 Independent assessor‐rated ADHD symptoms, Outcome 9 Subgroup analysis: all parallel‐group trials and first‐period cross‐over trials compared with cross‐over trials (endpoint data).
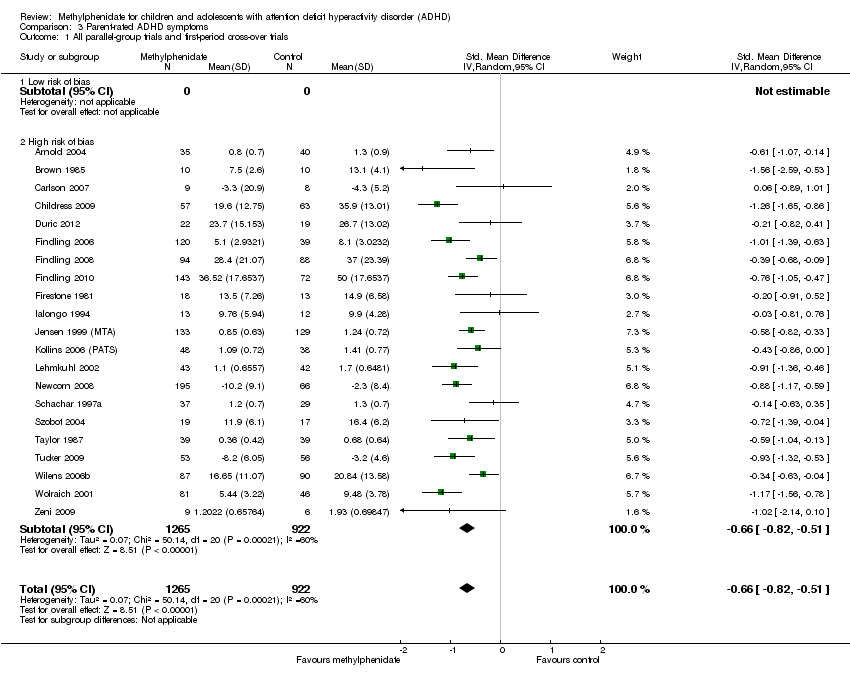
Comparison 3 Parent‐rated ADHD symptoms, Outcome 1 All parallel‐group trials and first‐period cross‐over trials.

Comparison 3 Parent‐rated ADHD symptoms, Outcome 2 Subgroup analysis: types of scales.

Comparison 3 Parent‐rated ADHD symptoms, Outcome 3 Subgroup analysis: duration of treatment.
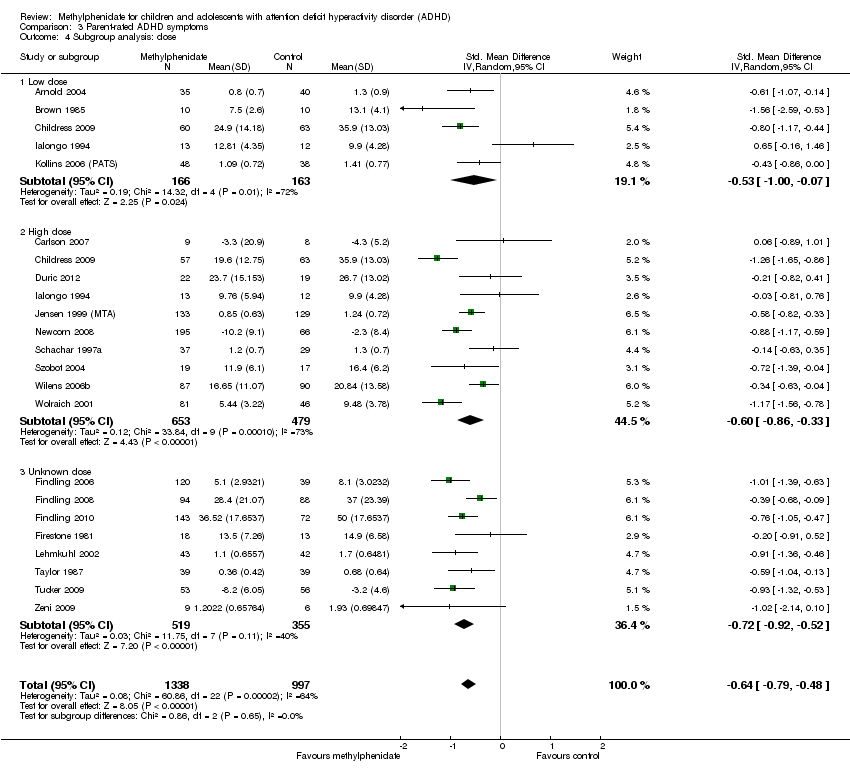
Comparison 3 Parent‐rated ADHD symptoms, Outcome 4 Subgroup analysis: dose.

Comparison 3 Parent‐rated ADHD symptoms, Outcome 5 Medication status: medication naive versus not medication naive.

Comparison 3 Parent‐rated ADHD symptoms, Outcome 6 Subgroup analysis: trials with cohort selection bias of all participants compared with trials without cohort selection bias of all participants.

Comparison 3 Parent‐rated ADHD symptoms, Outcome 7 Subgroup analysis: parallel‐group trials compared with first‐period cross‐over trials.

Comparison 3 Parent‐rated ADHD symptoms, Outcome 8 ADHD symptoms, cross‐over trials (endpoint data).
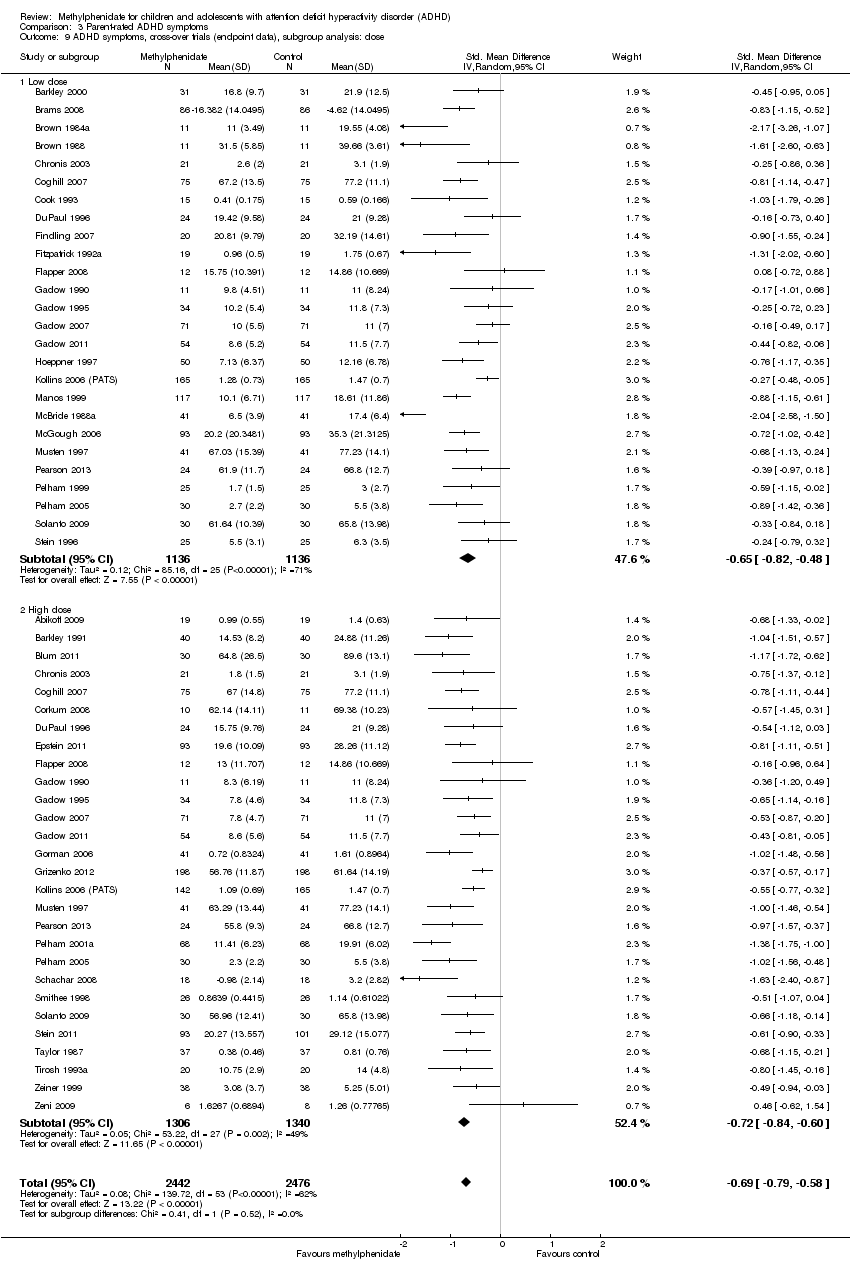
Comparison 3 Parent‐rated ADHD symptoms, Outcome 9 ADHD symptoms, cross‐over trials (endpoint data), subgroup analysis: dose.
Comparison 3 Parent‐rated ADHD symptoms, Outcome 10 Subgroup analysis: all parallel‐group trials and first‐period cross‐over trials compared with cross‐over trials (endpoint data).

Comparison 4 Additional subgroup analyses of ADHD symptoms: parallel‐group trials and first‐period cross‐over trials, Outcome 1 Comparision of raters.

Comparison 4 Additional subgroup analyses of ADHD symptoms: parallel‐group trials and first‐period cross‐over trials, Outcome 2 Age.

Comparison 4 Additional subgroup analyses of ADHD symptoms: parallel‐group trials and first‐period cross‐over trials, Outcome 3 Comorbidity versus no comorbidity.
Comparison 4 Additional subgroup analyses of ADHD symptoms: parallel‐group trials and first‐period cross‐over trials, Outcome 4 Subtypes ADHD: ADHD Rating Scale (parent‐, teacher‐ or independent assessor‐rated).

Comparison 4 Additional subgroup analyses of ADHD symptoms: parallel‐group trials and first‐period cross‐over trials, Outcome 5 Cross‐over trials: first‐period data versus endpoint data (parent‐, independent assessor‐ and teacher‐rated).

Comparison 5 Number of serious adverse events: parallel‐group trials and first‐period cross‐over trials, Outcome 1 Number of serious adverse events (SAE).
Comparison 5 Number of serious adverse events: parallel‐group trials and first‐period cross‐over trials, Outcome 2 Nervous system.

Comparison 5 Number of serious adverse events: parallel‐group trials and first‐period cross‐over trials, Outcome 3 Digestive system: gastrointestinal disorders.

Comparison 5 Number of serious adverse events: parallel‐group trials and first‐period cross‐over trials, Outcome 4 Urinary system: kidney infection.
Comparison 5 Number of serious adverse events: parallel‐group trials and first‐period cross‐over trials, Outcome 5 Circulatory and respiratory systems: asthma.

Comparison 5 Number of serious adverse events: parallel‐group trials and first‐period cross‐over trials, Outcome 6 Immune system: cyst rupture.

Comparison 5 Number of serious adverse events: parallel‐group trials and first‐period cross‐over trials, Outcome 7 Other: drug toxicity.

Comparison 6 Number of serious adverse events: cross‐over trials (endpoint data), Outcome 1 Number of serious adverse events (SAE).

Comparison 6 Number of serious adverse events: cross‐over trials (endpoint data), Outcome 2 Hallucinations/psychosis.

Comparison 7 Number of non‐serious adverse events: parallel‐group trials and first‐period cross‐over trials, Outcome 1 Total number of non‐serious adverse events.

Comparison 7 Number of non‐serious adverse events: parallel‐group trials and first‐period cross‐over trials, Outcome 2 Subgroup analysis: total number of non‐serious adverse events according to dose.
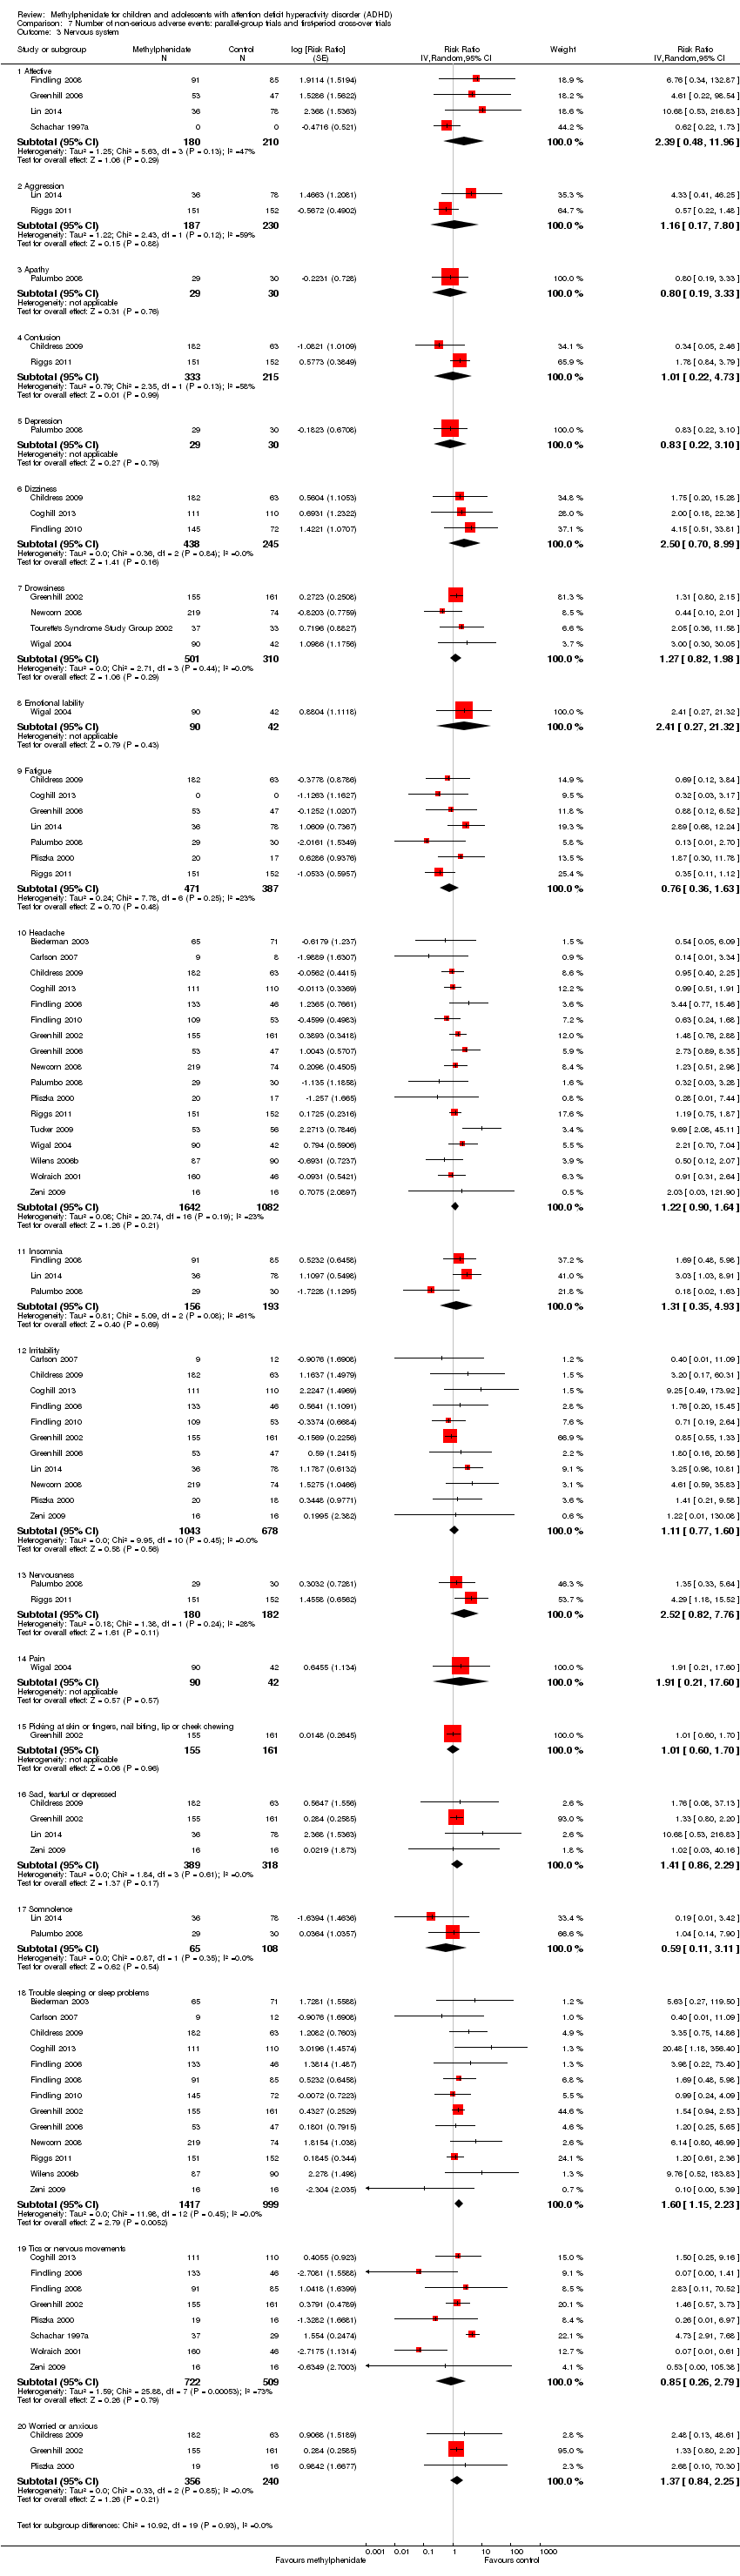
Comparison 7 Number of non‐serious adverse events: parallel‐group trials and first‐period cross‐over trials, Outcome 3 Nervous system.

Comparison 7 Number of non‐serious adverse events: parallel‐group trials and first‐period cross‐over trials, Outcome 4 Digestive system.

Comparison 7 Number of non‐serious adverse events: parallel‐group trials and first‐period cross‐over trials, Outcome 5 Circulatory and respiratory systems.
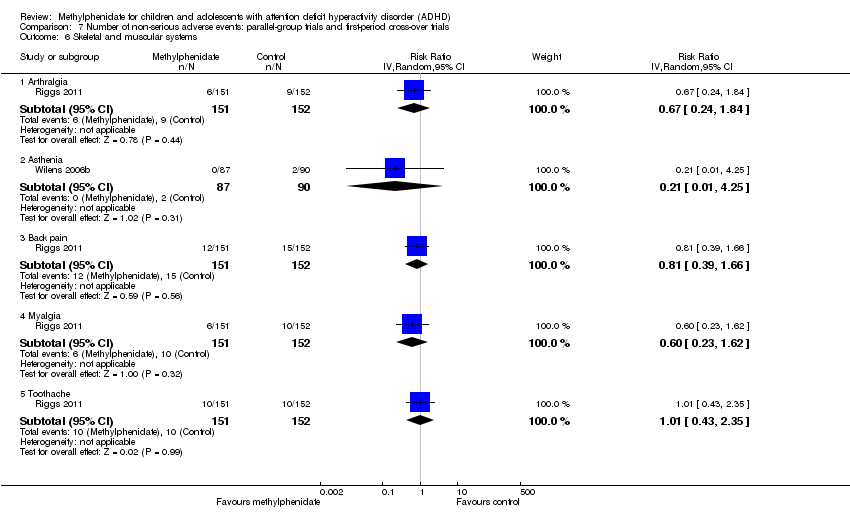
Comparison 7 Number of non‐serious adverse events: parallel‐group trials and first‐period cross‐over trials, Outcome 6 Skeletal and muscular systems.
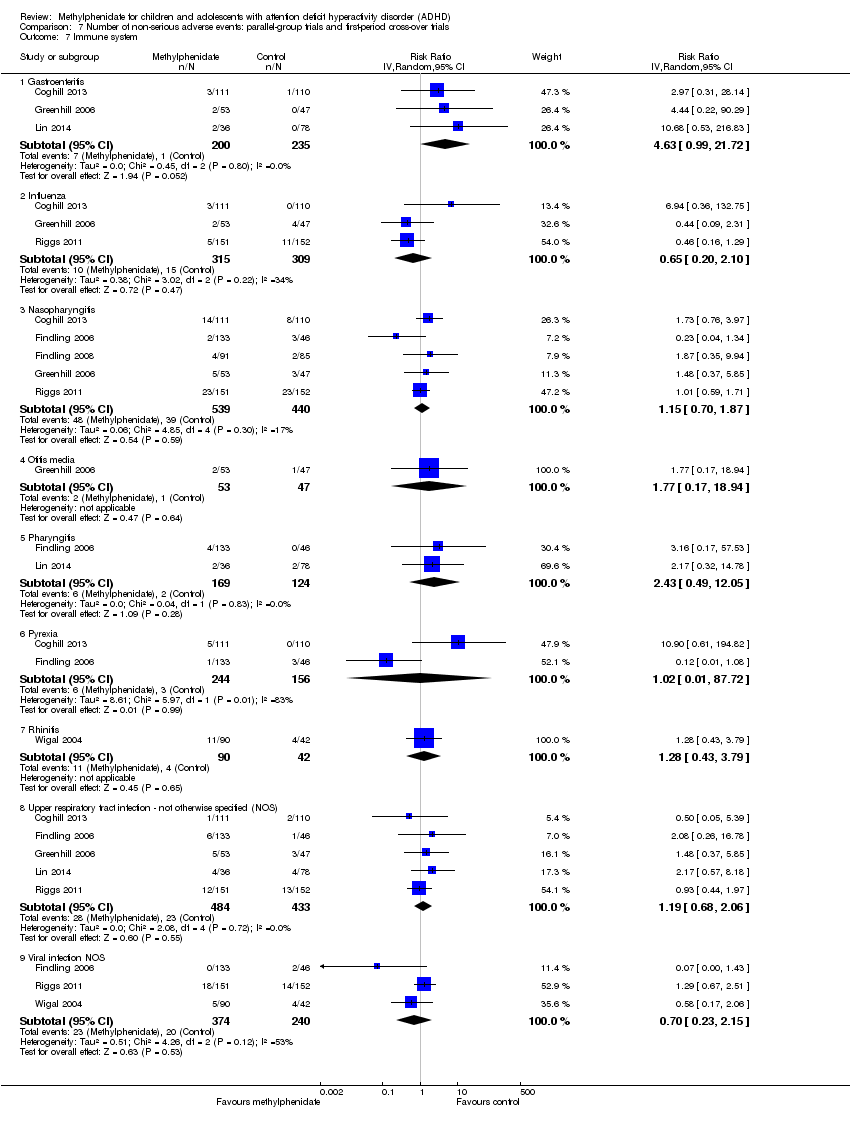
Comparison 7 Number of non‐serious adverse events: parallel‐group trials and first‐period cross‐over trials, Outcome 7 Immune system.
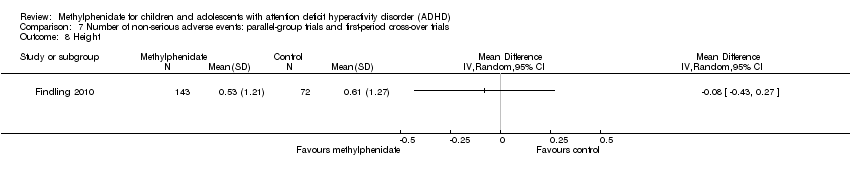
Comparison 7 Number of non‐serious adverse events: parallel‐group trials and first‐period cross‐over trials, Outcome 8 Height.

Comparison 7 Number of non‐serious adverse events: parallel‐group trials and first‐period cross‐over trials, Outcome 9 Weight.

Comparison 7 Number of non‐serious adverse events: parallel‐group trials and first‐period cross‐over trials, Outcome 10 BMI.

Comparison 7 Number of non‐serious adverse events: parallel‐group trials and first‐period cross‐over trials, Outcome 11 Vital signs.

Comparison 7 Number of non‐serious adverse events: parallel‐group trials and first‐period cross‐over trials, Outcome 12 Other.

Comparison 8 Number of non‐serious adverse events: cross‐over trials (endpoint data), Outcome 1 Total number of non‐serious adverse events.

Comparison 8 Number of non‐serious adverse events: cross‐over trials (endpoint data), Outcome 2 Subgroup analysis: total number of non‐serious adverse events according to dose.
Comparison 8 Number of non‐serious adverse events: cross‐over trials (endpoint data), Outcome 3 Nervous system.

Comparison 8 Number of non‐serious adverse events: cross‐over trials (endpoint data), Outcome 4 Digestive system.

Comparison 8 Number of non‐serious adverse events: cross‐over trials (endpoint data), Outcome 5 Urinary system: urinary incontinence.
Comparison 8 Number of non‐serious adverse events: cross‐over trials (endpoint data), Outcome 6 Skeletal and muscular system: somatic complaints.

Comparison 8 Number of non‐serious adverse events: cross‐over trials (endpoint data), Outcome 7 Immune system.
Comparison 8 Number of non‐serious adverse events: cross‐over trials (endpoint data), Outcome 8 Skin.

Comparison 8 Number of non‐serious adverse events: cross‐over trials (endpoint data), Outcome 9 Vital signs.
Comparison 8 Number of non‐serious adverse events: cross‐over trials (endpoint data), Outcome 10 Height (cm).

Comparison 8 Number of non‐serious adverse events: cross‐over trials (endpoint data), Outcome 11 Weight.

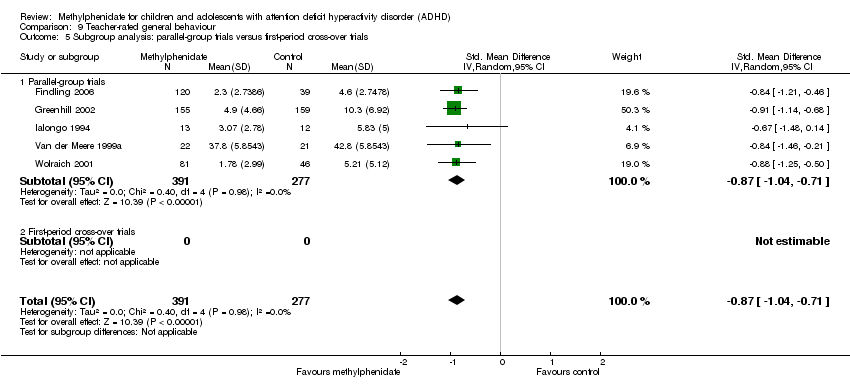
Comparison 9 Teacher‐rated general behaviour, Outcome 1 All parallel‐group trials and first‐period cross‐over trials: risk of bias.

Comparison 9 Teacher‐rated general behaviour, Outcome 2 Subgroup analysis: types of scales.

Comparison 9 Teacher‐rated general behaviour, Outcome 3 Subgroup analysis: dose.

Comparison 9 Teacher‐rated general behaviour, Outcome 4 Subgroup analysis: duration of treatment.
Comparison 9 Teacher‐rated general behaviour, Outcome 5 Subgroup analysis: parallel‐group trials versus first‐period cross‐over trials.

Comparison 9 Teacher‐rated general behaviour, Outcome 6 General behaviour, cross‐over trials (endpoint data).

Comparison 9 Teacher‐rated general behaviour, Outcome 7 Subgroup analysis: general behaviour, cross‐over trials (endpoint data): risk of bias.

Comparison 9 Teacher‐rated general behaviour, Outcome 8 Subgroup analysis: all parallel‐group trials and first‐period cross‐over trials (teacher‐rated) versus cross‐over trials (endpoint data).

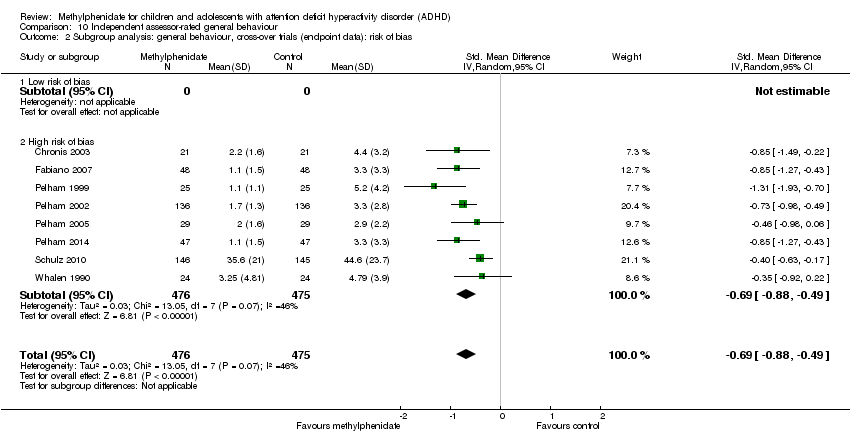
Comparison 10 Independent assessor‐rated general behaviour, Outcome 1 General behaviour, cross‐over trials (endpoint data).
Comparison 10 Independent assessor‐rated general behaviour, Outcome 2 Subgroup analysis: general behaviour, cross‐over trials (endpoint data): risk of bias.
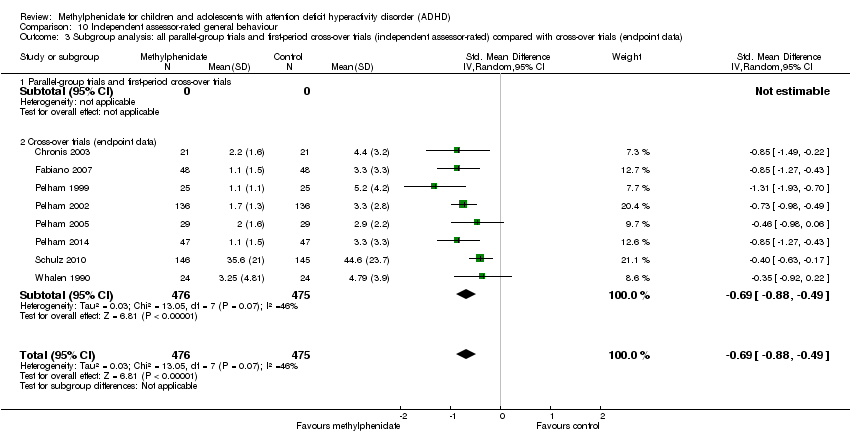
Comparison 10 Independent assessor‐rated general behaviour, Outcome 3 Subgroup analysis: all parallel‐group trials and first‐period cross‐over trials (independent assessor‐rated) compared with cross‐over trials (endpoint data).

Comparison 11 Parent‐rated general behaviour, Outcome 1 All parallel‐group trials and first‐period cross‐over trials.
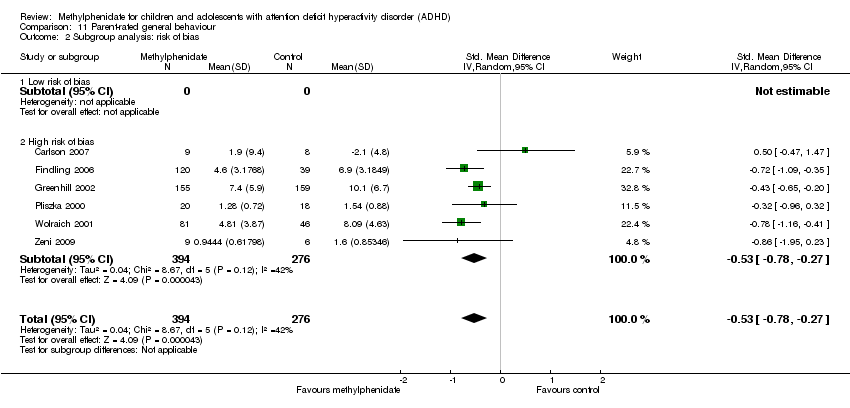
Comparison 11 Parent‐rated general behaviour, Outcome 2 Subgroup analysis: risk of bias.

Comparison 11 Parent‐rated general behaviour, Outcome 3 Subgroup analysis: types of scales.

Comparison 11 Parent‐rated general behaviour, Outcome 4 Subgroup analysis: parallel‐group trials compared with first‐period cross‐over trials.

Comparison 11 Parent‐rated general behaviour, Outcome 5 Subgroup analysis: duration of treatment.

Comparison 11 Parent‐rated general behaviour, Outcome 6 Subgroup analysis: dose.

Comparison 11 Parent‐rated general behaviour, Outcome 7 General behaviour, cross‐over trials (endpoint data).
Comparison 11 Parent‐rated general behaviour, Outcome 8 Subgroup analysis: general behaviour, cross‐over trials (endpoint data): risk of bias.

Comparison 11 Parent‐rated general behaviour, Outcome 9 Subgroup analysis: all parallel‐group trials and first‐period cross‐over trials (parent‐rated) compared with cross‐over trials (endpoint data).
Comparison 12 Additional subgroup analyses of general behaviour: parallel‐group trials and first‐period cross‐over trials, Outcome 1 Comparisions of raters.

Comparison 12 Additional subgroup analyses of general behaviour: parallel‐group trials and first‐period cross‐over trials, Outcome 2 Comorbidity versus no comorbidity.

Comparison 12 Additional subgroup analyses of general behaviour: parallel‐group trials and first‐period cross‐over trials, Outcome 3 Cross‐over trials: first‐period data versus endpoint data (teacher‐, parent‐, and independent assessor‐rated).

Comparison 13 Quality of life: parallel‐group trials and first‐period cross‐over trials, Outcome 1 Subgroup analysis: types of scales.
| Methylphenidate compared with placebo or no intervention for ADHD | ||||||
| Patient or population: children and adolescents (up to and including 18 years of age) with ADHD | ||||||
| Outcomes | Illustrative comparative risks* (95% CI) | Relative effect | Number of participants | Quality of the evidence | Comments | |
| Assumed risk | Corresponding risk | |||||
| Placebo or no intervention | Methylphenidate | |||||
| ADHD symptoms: all parallel‐group trials and first‐period cross‐over trials Average study duration: 74.8 days | Mean ADHD symptom score in the intervention groups corresponds to a mean difference of 9.6 (95% CI 11.25 to 8.00) on ADHD Rating Scale | SMD ‐0.77 (‐0.90 to ‐0.64) | 1698 | ⊕⊝⊝⊝ | The analysis was conducted on a standardised scale with data from studies that used different teacher‐rated scales of symptoms (Conners' Teacher Rating Scale (CTRS), Strengths and Weaknesses of ADHD Symptoms and Normal Behaviour (SWAN) Scale, Schedule for Non‐adaptive and Adaptive Personality (SNAP) ‐ Teacher, Fremdbeurteilungsbogen für Hyperkinetische Störungen (FBB‐HKS)). The effect size has been translated on to the ADHD Rating Scale from the SMD | |
| Total number of serious adverse events | Trial population | RR 0.98 | 1532 | ⊕⊝⊝⊝ | ‐ | |
| 16 per 1000 | 16 per 1000 | |||||
| Total number of non‐serious adverse events | Trial population | RR 1.29 | 3132 | ⊕⊝⊝⊝ | ‐ | |
| 408 per 1000 | 526 per 1000 | |||||
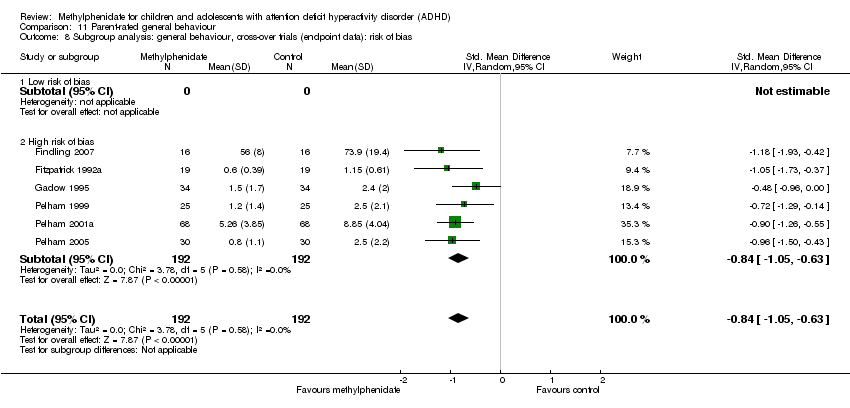
| General behaviour: all parallel‐group trials and first‐period cross‐over trials | Mean general behaviour score in the intervention groups was 0.87 standard mean deviations lower (95% CI 1.04 to 0.71 lower) | SMD ‐0.87 (‐0.71 to ‐1.04) | 668 | ⊕⊝⊝⊝ | ‐ | |
| Quality of life (Parent‐rated) | Mean quality of life score in the intervention groups corresponds to a mean difference of 8.0 (95% CI 5.49 to 10.46) on the Child Health Questionnaire | SMD 0.61 | 514 | ⊕⊝⊝⊝ | ‐ | |
| *The basis for the assumed risk (e.g. median control group risk across studies) is provided in footnotes. The corresponding risk (and its 95% confidence interval) is based on the assumed risk in the comparison group and the relative effect of the intervention (and its 95% CI). | ||||||
| GRADE Working Group grades of evidence. | ||||||
| aDowngraded two levels due to high risk of bias (systematic errors causing overestimation of benefits and underestimation of harms) in several risk of bias domains, including lack of sufficient blinding and selective outcome reporting (many of the included trials did not report on this outcome). | ||||||
| Name of scale | Abbreviation | Reference |
| Abbreviated Conners’ Rating Scales, Parent (ACPRS) and Teacher (ACTRS), including Abbreviated Parent Rating Scale (APRS) and Teacher Rating Scale, Hyperkinesis Index and ADHD and Emotional Lability subscales | ACRS | |
| Abbreviated Symptom Questionnaire, including ASQ Teacher and ASQ Parent | ASQ | |
| Academic Performance Rating Scale | APRS | |
| The ADD/H Comprehensive Teacher Rating Scale | ACTeRS | |
| ADHD/ODD Rating Scale, Parent‐ and Teacher‐Rated | ADHD‐RS | |
| ADHD Rating Scale, including ADHD Rating Scale Parent and Teacher Ratings | ADHD‐RS | |
| ADHD Rating Scale‐IV, including ADHD Rating Scale‐IV Parent and Teacher Versions | ADHD‐RS‐IV | |
| Brief Psychiatric Rating Scale for Children | BPRS | |
| Child Attention Problems Rating Scale | CAP | |
| Child Attention Profile | CAP | |
| Child Behavior Rating Form | NCBHF | |
| Child Symptom Inventory | CSI | |
| Children’s Psychiatric Rating Scale | CPRS | |
| Conners’ Abbreviated Hyperactivity Questionnaire | C‐HI | |
| Conners’ Abbreviated Questionnaire | ASQ | |
| Conners’ Abbreviated Parent Teacher Questionnaire | APTQ | |
| Conners’ Abbreviated Rating Scale | ABRS | |
| Conners’ Abbreviated Symptom Questionnaire | ASQ | |
| Conners Abbreviated Symptom Questionnaire for Parents | ASQ‐Parent | |
| Conners’ Abbreviated Symptom Questionnaire for Teachers | ASQ‐Teacher | |
| Conners’ Abbreviated Teacher Rating Scale | ABTRS | |
| Conners’ ADHD/DSM‐IV Scales Adolescent | CADS‐A | |
| Conners’ ADHD/DSM‐IV Scales Parent | CADS–P, CADS‐P DSM‐IV | |
| Conners’ ADHD/DSM‐IV Scale Teacher, including Inattentive and Hyperactive‐Impulsive subscales | CADS‐T, CADS‐T DSM‐IV | |
| Conners’ Rating Scale ‐ Revised, Parent and Teacher: Hyperactivity and Conduct Factors score | CPRS‐R and CTRS‐R | |
| Conners’ Hyperactivity Index, Parent and Teacher, including abbreviated versions | CPRS/CTRS‐Hyperactivity index | |
| Conners’ Hyperkinesis Index | ‐ | |
| Conners, Loney and Milich Scale | CLAM | |
| Conners’ Parent and Teacher Rating Scale ‐ Revised, Short Form | CRS‐R:S | |
| Conners’ Parent Rating Scale, including abbreviated versions | CPRS | |
| Conners’ Parent Rating Scale ‐ Revised | CPRS‐R | |
| Conners’ Parent Rating Scale ‐ Revised, Short Form | CPRS‐R:S | |
| Conners’ Parent Rating Scale ‐ Revised, Long Version | CPRS‐R:L | |
| Conners’ Rating Scale ‐ Revised | CRS‐R | |
| Conners’ Short Form Rating Scale, Parent and Teacher | ‐ | |
| Conners’ Teacher Rating Scale | CTRS | |
| Conners’ Teacher Rating Scale ‐ Revised, Long Version | CTRS‐R:L | |
| Diagnostic and Statistical Manual of Mental Disorders Total | DSM‐IV | |
| Diagnostiksystem für Psychische Störungen im Kindes ‐ und Jugendalter nach ICD‐10 und DSM‐IV, Parental Questionnaire of ADHD symptoms | DISYPS | |
| Fremdbeurteilungsbogen für Hyperkinetische Störungen | FBB‐HKS | |
| German Teacher’s report on ADHD symptoms | FBB‐HKS of the DISYPS | |
| Hyperactivity Index of the Revised Conners Parent and Teacher Rating Scales | ‐ | |
| IOWA Conners Parent Rating Scale, including abbreviated versions | IOWA CPRS | |
| IOWA Conners Teacher Rating Scale, including abbreviated versions | IOWA CTRS | |
| IOWA Conners Teacher Rating Scale, Inattention/Overactivity (I/O) and Oppositional/Defiant (O/D) subscales | IOWA‐I/O and O/D subscales | |
| IOWA Inattention/Overactivity and Aggression/Noncompliance scales ‐ Parent and Teacher rating | IOWA | |
| Lehrer‐Fragenbogen von Steinhausen | LF | |
| Loney’s Time on Task Scale, Hyperactivity, Attention and Aggression subscales | TOTS | |
| Modified Conner Scale Parent and Teacher | ACR | |
| Mothers’ Objective Method for Subgrouping | MOMS | |
| Parent Symptom Checklist | PSC ADHD | |
| Parental Account of Children’s Symptoms | PACS | |
| Restricted Academic Situation Scale | RASS | |
| Schedule for Affective Disorders and Schizophrenia | K‐SADS/ K‐SADS‐E for diagnosis | |
| Schedule for Non‐adaptive and Adaptive Personality | SNAP | |
| Swanson, Nolan, and Pelham ‐ IV SNAP‐ADHD Rating scale | SNAP‐ADHD | |
| Swanson, Nolan, and Pelham ‐ IV SNAP‐IV (Brazilian Version) | SNAP‐IV | |
| Swanson, Kotkin, Atkins, M‐Flynn, Pelham Scale (SKAMP combined, SKAMP attention, and SKAMP deportment) | SKAMP (SKAMP combined, SKAMP attention, and SKAMP deportment) | |
| Teacher Self‐control Rating Scale | SCRS | |
| Turgay ‐ DSM‐IV Scale, Parent | T‐DSM‐IV Scale, Parent | |
| Turgay ‐ DSM‐IV Scale, Teacher | T‐DSM‐IV Scale, Teacher | |
| Teacher Hyperactivity Index | THI | |
| Teacher Symptom Checklist | TSC | |
| Vanderbilt ADHD Rating Scale | VADP(T)RS | |
| Wender Utah Rating Scale | WURS | |
| Wide Range Achievement Test | WRAT‐4 | |
| Wide Range Achievement Test Revised | WRAT‐R | |
| ADD/H: Attention deficit disorder with hyperactivity. | ||
| Name of scale | Abbreviation | Reference |
| Achenbach Child Behaviour Checklist | CBCL | |
| Achenbach’s Teacher Report | ATRF | |
| ADHD Rating Scale | ADHD‐RS | |
| ADHD School Observation Code | ADHD‐SOC | |
| Barkley Scales, Disruptive Behavior Disorders Rating Scale | ‐ | |
| Child Attention Problems Scale | CAP | |
| Child Attention Profile | CAP | |
| Child Behavior Checklist | CBCL | |
| Child Health Questionnaire | CHQ | |
| Child and Adolescent Psychiatric Assessment, selected items | CAPA | |
| Children’s Psychiatric Rating Scale | CPRS | |
| Classroom Observation Code (Abikoff Classroom Observational System) | COC | |
| Code for Observing Social Activity | COSA | |
| Conners' Child Behavior Scale | UC‐CCBS | |
| Conners' Global Index Scale | CGI‐S | |
| Conners’ Global Index ‐ Parent | CGI‐P | |
| Conners' Global Index ‐ Teacher | CGI‐T | |
| Conners', Loney and Milich Scale | CLAM | |
| Conners’ Parent Questionnaire | CPQ | |
| Conners’ Parent Rating Scale | CPRS | |
| Conners’ Teacher Rating Scale | CTRS | |
| Conners’ Teacher Rating Conduct Problems | ‐ | |
| Disruptive Behavior Disorders Rating Scale, Parent‐ and Teacher‐Rated | DBS | |
| Disruptive Behavior Disorders Rating Scale | DBD | |
| Groninger Behaviour Observation Scale | GOO and GBO | |
| Groninger Behaviour Checklists, Parent and Teacher Versions of the abbreviated Groninger | GGGS and GGBS | |
| Hillside Behavior Rating Scale | HBRS | |
| Home Situations Questionnaire | HSQ | |
| Home Situations Questionnaire ‐ Revised | HSQ‐R | |
| Humphrey’s Teacher Self‐Control Rating Scale | TSCRS | |
| Hyperactivity Index from the Conners Revised Teacher Rating Scale | CTRS‐R‐Hyperactivity Index | |
| Impairment Rating Scale | IRS | |
| Inpatient Global Rating Scale, Revised | IGRS | |
| Inpatient Global Rating Scale, Somatic factor | IGRS‐S | |
| IOWA Conners' Rating Scale, Oppositional/Defiant (O/D) subscales | IOWA‐O/D subscales | |
| Nisonger Child Behavior Rating Form | NCBRF | |
| Paired Associates Learning | PAL | |
| Parent Global Assessment for Improvement | PGA | |
| Peer Conflict Scale | PCS | |
| Personality Inventory for Children | PIC | |
| School Situations Questionnaire | SSQ | |
| School Situations Questionnaire ‐ Revised | SSQ‐R | |
| Schedule for Nonadaptive and Adaptive Personality | SNAP | |
| Strengths and Weaknesses of ADHD Symptoms and Normal Behavior Scale, Parent and Teacher | SWAN | |
| Subjective Treatment Emergent Symptom Scale | STESS‐R | |
| Swanson, Nolan and Pelham, Fourth Edition | SNAP‐IV | |
| Teachers Report Form | TRF | |
| Telephone Interview Probe (Parent and Teacher) | TIP | |
| Vanderbilt ADHD rating scales: Vanderbilt ADHD Diagnostic Parent Rating Scale and Vanderbilt ADHD Diagnostic Teacher Rating Scale | VADPRS and VADTRS | |
| Wahler, House and Stambaugh’s Ecobehavioral Assessment System | ECO | |
| The Weekly Parent Ratings of Evening and Morning Behaviour | WREMB‐R | |
| Werry‐Weiss‐Peters Activity Rating Scale | WWP | |
| Woodcock‐Johnson Achievement Battery | WJ‐III Ach | |
| ADHD: attention deficit hyperactivity disorder. | ||
| Name of scale | Abbreviation | Reference |
| ADHD Impact Module‐Child | AIM‐C | |
| Child Impact Scale and Home Impact Scale | CIS/HIS | |
| Child Health and Illness Profile, Child Edition: Parent Report Form | CHIP‐CE:PRF | |
| Child Health Questionnaire | CHQ‐P | |
| Children's Global Assessment Scale | CGAS | |
| Comprehensive Psychopathological Rating Scale | CPRS | |
| Health Utilities Index ‐ 2 | HUI‐2 | |
| ADHD: attention deficit hyperactivity disorder. | ||
| Outcome or subgroup title | No. of studies | No. of participants | Statistical method | Effect size |
| 1 All parallel‐group trials and first‐period cross‐over trials Show forest plot | 19 | 1698 | Std. Mean Difference (IV, Random, 95% CI) | ‐0.77 [‐0.90, ‐0.64] |
| 1.1 Low risk of bias | 0 | 0 | Std. Mean Difference (IV, Random, 95% CI) | 0.0 [0.0, 0.0] |
| 1.2 High risk of bias | 19 | 1698 | Std. Mean Difference (IV, Random, 95% CI) | ‐0.77 [‐0.90, ‐0.64] |
| 2 Subgroup analysis: types of scales Show forest plot | 19 | Std. Mean Difference (IV, Random, 95% CI) | Subtotals only | |
| 2.1 Conners' Teacher Rating Scale (CTRS) | 8 | 518 | Std. Mean Difference (IV, Random, 95% CI) | ‐0.64 [‐0.82, ‐0.47] |
| 2.2 Abbreviated Conners' Rating Scale (ACRS) ‐ Teacher | 2 | 105 | Std. Mean Difference (IV, Random, 95% CI) | ‐0.75 [‐1.79, 0.29] |
| 2.3 Conners' Abbreviated Symptom Questionnaire for Teachers (ASQ‐Teacher) | 1 | 59 | Std. Mean Difference (IV, Random, 95% CI) | ‐0.28 [‐0.79, 0.23] |
| 2.4 IOWA Conners' Teacher Rating Scale (IOWA CTRS) ‐ hyperactivity | 2 | 193 | Std. Mean Difference (IV, Random, 95% CI) | ‐1.08 [‐1.39, ‐0.77] |
| 2.5 Schedule for Non‐adaptive and Adaptive Personality (SNAP) ‐ Teacher | 2 | 328 | Std. Mean Difference (IV, Random, 95% CI) | ‐0.61 [‐0.96, ‐0.25] |
| 2.6 Teacher ratings of attention | 1 | 20 | Std. Mean Difference (IV, Random, 95% CI) | ‐0.55 [‐1.45, 0.35] |
| 2.7 Teacher ratings of impulsivity | 1 | 20 | Std. Mean Difference (IV, Random, 95% CI) | 0.04 [‐0.83, 0.92] |
| 2.8 IOWA Conners' Teacher Rating Scale ‐ Inattention/Overactivity (IOWA‐I/O) | 2 | 197 | Std. Mean Difference (IV, Random, 95% CI) | ‐1.03 [‐1.36, ‐0.69] |
| 2.9 Fremdbeurteilungsbogen für Hyperkinetische Störungen (FBB‐HKS) | 1 | 85 | Std. Mean Difference (IV, Random, 95% CI) | ‐1.06 [‐1.52, ‐0.61] |
| 2.10 Conners’ ADHD/DSM‐IV Scales ‐ Teacher (CADS‐T) | 2 | 254 | Std. Mean Difference (IV, Random, 95% CI) | ‐1.05 [‐1.31, ‐0.78] |
| 2.11 Strengths and Weaknesses of ADHD Symptoms and Normal Behaviour (SWAN) Scale | 1 | 64 | Std. Mean Difference (IV, Random, 95% CI) | ‐0.33 [‐0.82, 0.17] |
| 3 Medication status: medication naive versus not medication naive Show forest plot | 6 | 717 | Std. Mean Difference (IV, Random, 95% CI) | ‐0.79 [‐1.08, ‐0.50] |
| 3.1 Medication naive | 4 | 431 | Std. Mean Difference (IV, Random, 95% CI) | ‐0.63 [‐0.94, ‐0.31] |
| 3.2 Not medication naive | 2 | 286 | Std. Mean Difference (IV, Random, 95% CI) | ‐1.06 [‐1.33, ‐0.79] |
| 4 Subgroup analysis: duration of treatment Show forest plot | 19 | 1698 | Std. Mean Difference (IV, Random, 95% CI) | ‐0.77 [‐0.90, ‐0.64] |
| 4.1 Short term (up to 6 months) | 18 | 1445 | Std. Mean Difference (IV, Random, 95% CI) | ‐0.81 [‐0.94, ‐0.68] |
| 4.2 Long term (over 6 months) | 1 | 253 | Std. Mean Difference (IV, Random, 95% CI) | ‐0.47 [‐0.72, ‐0.22] |
| 5 Subgroup analysis: dose Show forest plot | 19 | Std. Mean Difference (IV, Random, 95% CI) | Subtotals only | |
| 5.1 Low dose | 8 | 493 | Std. Mean Difference (IV, Random, 95% CI) | ‐0.64 [‐0.82, ‐0.46] |
| 5.2 High dose | 7 | 688 | Std. Mean Difference (IV, Random, 95% CI) | ‐0.81 [‐1.08, ‐0.54] |
| 5.3 Unknown dose | 6 | 669 | Std. Mean Difference (IV, Random, 95% CI) | ‐0.87 [‐1.06, ‐0.68] |
| 6 Subgroup analysis: parallel‐group trials compared with first‐period cross‐over trials Show forest plot | 19 | 1698 | Std. Mean Difference (IV, Random, 95% CI) | ‐0.77 [‐0.90, ‐0.64] |
| 6.1 Parallel‐group trials | 17 | 1506 | Std. Mean Difference (IV, Random, 95% CI) | ‐0.80 [‐0.95, ‐0.65] |
| 6.2 First‐period cross‐over trials | 2 | 192 | Std. Mean Difference (IV, Random, 95% CI) | ‐0.58 [‐0.87, ‐0.29] |
| 7 Subgroup analysis: trials with cohort selection bias of all participants compared with trials without cohort selection bias of all participants Show forest plot | 19 | 1698 | Std. Mean Difference (IV, Random, 95% CI) | ‐0.77 [‐0.90, ‐0.64] |
| 7.1 Trials with cohort selection bias of all participants | 7 | 994 | Std. Mean Difference (IV, Random, 95% CI) | ‐0.79 [‐1.01, ‐0.57] |
| 7.2 Trials without cohort selection bias of all participants | 12 | 704 | Std. Mean Difference (IV, Random, 95% CI) | ‐0.76 [‐0.93, ‐0.59] |
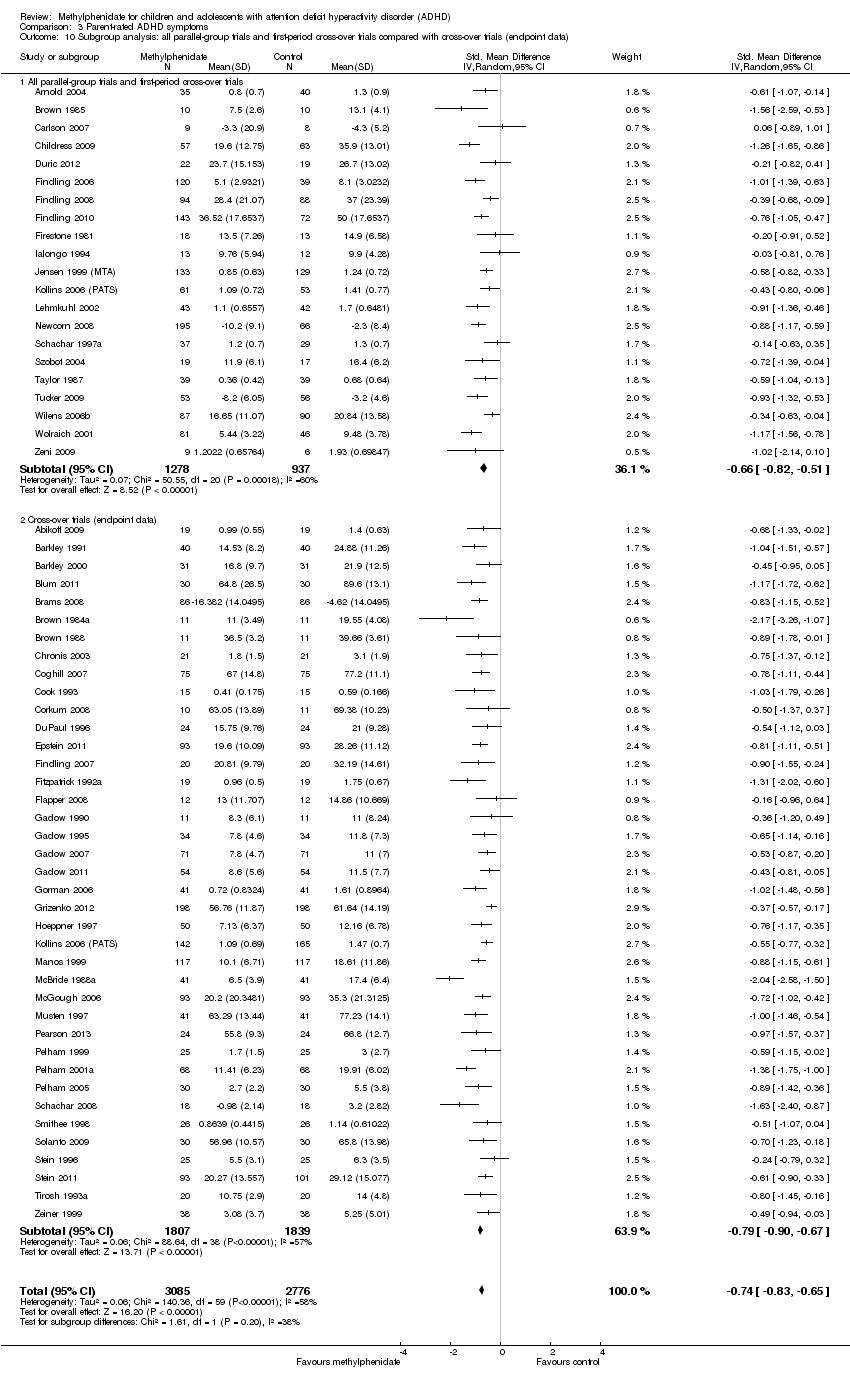
| 8 ADHD symptoms, cross‐over trial (endpoint data) Show forest plot | 59 | 5145 | Std. Mean Difference (IV, Random, 95% CI) | ‐0.93 [‐1.06, ‐0.80] |
| 8.1 Low risk of bias | 4 | 204 | Std. Mean Difference (IV, Random, 95% CI) | ‐0.64 [‐0.97, ‐0.30] |
| 8.2 High risk of bias | 55 | 4941 | Std. Mean Difference (IV, Random, 95% CI) | ‐0.95 [‐1.09, ‐0.82] |
| 9 ADHD symptoms, cross‐over trials (endpoint data), subgroup analysis: dose Show forest plot | 59 | 6821 | Std. Mean Difference (IV, Random, 95% CI) | ‐0.85 [‐0.96, ‐0.74] |
| 9.1 Low dose | 42 | 3408 | Std. Mean Difference (IV, Random, 95% CI) | ‐0.73 [‐0.89, ‐0.57] |
| 9.2 High dose | 36 | 3413 | Std. Mean Difference (IV, Random, 95% CI) | ‐0.98 [‐1.13, ‐0.84] |
| 10 Subgroup analysis: all parallel‐group trials and first‐period cross‐over trials compared with cross‐over trials (endpoint data) Show forest plot | 75 | 6344 | Std. Mean Difference (IV, Random, 95% CI) | ‐0.91 [‐1.01, ‐0.80] |
| 10.1 All parallel‐group trials and first‐period cross‐over trials | 19 | 1698 | Std. Mean Difference (IV, Random, 95% CI) | ‐0.77 [‐0.90, ‐0.64] |
| 10.2 Cross‐over trials (endpoint data) | 56 | 4646 | Std. Mean Difference (IV, Random, 95% CI) | ‐0.95 [‐1.09, ‐0.82] |
| 11 All parallel‐group trials and cross‐over trials: risk of bias Show forest plot | 75 | 6344 | Std. Mean Difference (IV, Random, 95% CI) | ‐0.91 [‐1.01, ‐0.80] |
| 11.1 Low risk of bias | 4 | 204 | Std. Mean Difference (IV, Random, 95% CI) | ‐0.64 [‐0.97, ‐0.30] |
| 11.2 High risk of bias | 71 | 6140 | Std. Mean Difference (IV, Random, 95% CI) | ‐0.92 [‐1.03, ‐0.81] |
| Outcome or subgroup title | No. of studies | No. of participants | Statistical method | Effect size |
| 1 All parallel‐group trials and first‐period cross‐over trials Show forest plot | 10 | 1907 | Std. Mean Difference (IV, Random, 95% CI) | ‐0.64 [‐0.89, ‐0.39] |
| 1.1 Low risk of bias | 0 | 0 | Std. Mean Difference (IV, Random, 95% CI) | 0.0 [0.0, 0.0] |
| 1.2 High risk of bias | 10 | 1907 | Std. Mean Difference (IV, Random, 95% CI) | ‐0.64 [‐0.89, ‐0.39] |
| 2 Subgroup analysis: types of scales Show forest plot | 10 | Std. Mean Difference (IV, Random, 95% CI) | Subtotals only | |
| 2.1 Swanson, Kotkin, Agler, M‐Glynn and Pelham (SKAMP) Scale | 1 | 164 | Std. Mean Difference (IV, Random, 95% CI) | ‐0.72 [‐1.04, ‐0.41] |
| 2.2 ADHD Rating Scale (ADHD‐RS ) | 7 | 1442 | Std. Mean Difference (IV, Random, 95% CI) | ‐0.71 [‐1.09, ‐0.32] |
| 2.3 Swanson, Nolan and Pelham (SNAP) Scale | 1 | 221 | Std. Mean Difference (IV, Random, 95% CI) | ‐0.35 [‐0.61, ‐0.08] |
| 2.4 Unknown | 1 | 78 | Std. Mean Difference (IV, Random, 95% CI) | ‐0.94 [‐1.41, ‐0.47] |
| 3 Subgroup analysis: duration of treatment Show forest plot | 10 | 1907 | Std. Mean Difference (IV, Random, 95% CI) | ‐0.64 [‐0.89, ‐0.39] |
| 3.1 Short term (up to 6 months) | 9 | 1686 | Std. Mean Difference (IV, Random, 95% CI) | ‐0.68 [‐0.95, ‐0.40] |
| 3.2 Long term (over 6 months) | 1 | 221 | Std. Mean Difference (IV, Random, 95% CI) | ‐0.35 [‐0.61, ‐0.08] |
| 4 Subgroup analysis: parallel‐group trials compared with first‐period cross‐over trials Show forest plot | 10 | 1907 | Std. Mean Difference (IV, Random, 95% CI) | ‐0.64 [‐0.89, ‐0.39] |
| 4.1 Parallel‐group trials | 7 | 1609 | Std. Mean Difference (IV, Random, 95% CI) | ‐0.60 [‐0.91, ‐0.28] |
| 4.2 First‐period cross‐over trials | 3 | 298 | Std. Mean Difference (IV, Random, 95% CI) | ‐0.76 [‐0.99, ‐0.52] |
| 5 Subgroup analysis: trials with cohort selection bias of all participants compared with trials without cohort selection bias of all participants Show forest plot | 10 | 1907 | Std. Mean Difference (IV, Random, 95% CI) | ‐0.64 [‐0.89, ‐0.39] |
| 5.1 Trials with cohort selection bias of all participants | 4 | 630 | Std. Mean Difference (IV, Random, 95% CI) | ‐0.51 [‐0.73, ‐0.29] |
| 5.2 Trials without cohort selection bias of all participants | 6 | 1277 | Std. Mean Difference (IV, Random, 95% CI) | ‐0.72 [‐1.11, ‐0.33] |
| 6 Subgroup analysis: dose Show forest plot | 10 | 1907 | Std. Mean Difference (IV, Random, 95% CI) | ‐0.64 [‐0.89, ‐0.39] |
| 6.1 Low dose | 0 | 0 | Std. Mean Difference (IV, Random, 95% CI) | 0.0 [0.0, 0.0] |
| 6.2 High dose | 6 | 1380 | Std. Mean Difference (IV, Random, 95% CI) | ‐0.55 [‐0.91, ‐0.20] |
| 6.3 Unknown dose | 4 | 527 | Std. Mean Difference (IV, Random, 95% CI) | ‐0.80 [‐0.98, ‐0.61] |
| 7 ADHD symptoms, cross‐over trials (endpoint data), subgroup analysis: risk of bias Show forest plot | 19 | 2471 | Std. Mean Difference (IV, Random, 95% CI) | 1.00 [‐1.16, ‐0.84] |
| 7.1 Low risk of bias | 0 | 0 | Std. Mean Difference (IV, Random, 95% CI) | 0.0 [0.0, 0.0] |
| 7.2 High risk of bias | 19 | 2471 | Std. Mean Difference (IV, Random, 95% CI) | 1.00 [‐1.16, ‐0.84] |
| 8 ADHD symptoms, cross‐over trials (endpoint data), subgroup analysis: dose Show forest plot | 19 | 3874 | Std. Mean Difference (IV, Random, 95% CI) | ‐0.89 [‐1.02, ‐0.75] |
| 8.1 Low dose | 16 | 2021 | Std. Mean Difference (IV, Random, 95% CI) | ‐0.69 [‐0.82, ‐0.55] |
| 8.2 High dose | 12 | 1853 | Std. Mean Difference (IV, Random, 95% CI) | ‐1.13 [‐1.31, ‐0.95] |
| 9 Subgroup analysis: all parallel‐group trials and first‐period cross‐over trials compared with cross‐over trials (endpoint data) Show forest plot | 28 | 4215 | Std. Mean Difference (IV, Random, 95% CI) | ‐0.83 [‐0.98, ‐0.67] |
| 9.1 All parallel‐group trials and first‐period cross‐over trials | 10 | 1907 | Std. Mean Difference (IV, Random, 95% CI) | ‐0.64 [‐0.89, ‐0.39] |
| 9.2 Cross‐over trials (endpoint data) | 18 | 2308 | Std. Mean Difference (IV, Random, 95% CI) | ‐0.95 [‐1.13, ‐0.77] |
| Outcome or subgroup title | No. of studies | No. of participants | Statistical method | Effect size |
| 1 All parallel‐group trials and first‐period cross‐over trials Show forest plot | 21 | 2187 | Std. Mean Difference (IV, Random, 95% CI) | ‐0.66 [‐0.82, ‐0.51] |
| 1.1 Low risk of bias | 0 | 0 | Std. Mean Difference (IV, Random, 95% CI) | 0.0 [0.0, 0.0] |
| 1.2 High risk of bias | 21 | 2187 | Std. Mean Difference (IV, Random, 95% CI) | ‐0.66 [‐0.82, ‐0.51] |
| 2 Subgroup analysis: types of scales Show forest plot | 21 | Std. Mean Difference (IV, Random, 95% CI) | Subtotals only | |
| 2.1 Conners' Parent Rating Scale (CPRS) | 7 | 751 | Std. Mean Difference (IV, Random, 95% CI) | ‐0.58 [‐0.87, ‐0.30] |
| 2.2 ADHD Rating Scale ‐ Fourth Edition (ADHD‐RS‐IV) | 2 | 194 | Std. Mean Difference (IV, Random, 95% CI) | ‐0.30 [‐0.58, ‐0.02] |
| 2.3 Fremdbeurteilungsbogen für Hyperkinetische Störungen (FBB‐HKS) | 1 | 85 | Std. Mean Difference (IV, Random, 95% CI) | ‐0.91 [‐1.36, ‐0.46] |
| 2.4 Conners’ ADHD/DSM‐IV Scales ‐ Parent (CADS‐P) | 1 | 120 | Std. Mean Difference (IV, Random, 95% CI) | ‐1.26 [‐1.65, ‐0.86] |
| 2.5 CADS‐P Inattentive subscale | 1 | 109 | Std. Mean Difference (IV, Random, 95% CI) | ‐0.78 [‐1.17, ‐0.39] |
| 2.6 CADS‐P Hyperactivity subscale | 1 | 109 | Std. Mean Difference (IV, Random, 95% CI) | ‐0.93 [‐1.32, ‐0.53] |
| 2.7 Clinican's Manual for the Assesment of Disruptive Behavior Disorders Rating Scale for Parents (Barkley) | 1 | 41 | Std. Mean Difference (IV, Random, 95% CI) | ‐0.21 [‐0.82, 0.41] |
| 2.8 Abbreviated Conners' Rating Scale (ACRS) ‐ Parent | 2 | 121 | Std. Mean Difference (IV, Random, 95% CI) | ‐0.62 [‐0.99, ‐0.25] |
| 2.9 Swanson, Nolan, and Pelham, Fourth Edition ‐ Parent (SNAP‐IV‐Parent) Scale | 4 | 430 | Std. Mean Difference (IV, Random, 95% CI) | ‐0.60 [‐0.79, ‐0.40] |
| 2.10 Strengths and Weaknesses of ADHD Symptoms and Normal Behavior (SWAN) Scale | 1 | 86 | Std. Mean Difference (IV, Random, 95% CI) | ‐0.43 [‐0.86, 0.00] |
| 2.11 IOWA Conners' Rating Scale ‐ Inattention/Overactivity (IOWA‐I/O) | 3 | 352 | Std. Mean Difference (IV, Random, 95% CI) | ‐0.78 [‐1.35, ‐0.21] |
| 3 Subgroup analysis: duration of treatment Show forest plot | 21 | 2187 | Std. Mean Difference (IV, Random, 95% CI) | ‐0.66 [‐0.82, ‐0.51] |
| 3.1 Short term (up to 6 months) | 20 | 1925 | Std. Mean Difference (IV, Random, 95% CI) | ‐0.67 [‐0.84, ‐0.50] |
| 3.2 Long term (over 6 months) | 1 | 262 | Std. Mean Difference (IV, Random, 95% CI) | ‐0.58 [‐0.82, ‐0.33] |
| 4 Subgroup analysis: dose Show forest plot | 21 | 2335 | Std. Mean Difference (IV, Random, 95% CI) | ‐0.64 [‐0.79, ‐0.48] |
| 4.1 Low dose | 5 | 329 | Std. Mean Difference (IV, Random, 95% CI) | ‐0.53 [1.00, ‐0.07] |
| 4.2 High dose | 10 | 1132 | Std. Mean Difference (IV, Random, 95% CI) | ‐0.60 [‐0.86, ‐0.33] |
| 4.3 Unknown dose | 8 | 874 | Std. Mean Difference (IV, Random, 95% CI) | ‐0.72 [‐0.92, ‐0.52] |
| 5 Medication status: medication naive versus not medication naive Show forest plot | 7 | 795 | Std. Mean Difference (IV, Random, 95% CI) | ‐0.76 [‐1.05, ‐0.48] |
| 5.1 Medication naive | 4 | 492 | Std. Mean Difference (IV, Random, 95% CI) | ‐0.69 [‐1.03, ‐0.35] |
| 5.2 Not medication naive | 3 | 303 | Std. Mean Difference (IV, Random, 95% CI) | ‐0.88 [‐1.33, ‐0.42] |
| 6 Subgroup analysis: trials with cohort selection bias of all participants compared with trials without cohort selection bias of all participants Show forest plot | 21 | 2187 | Std. Mean Difference (IV, Random, 95% CI) | ‐0.66 [‐0.82, ‐0.51] |
| 6.1 Trials with selection bias of all participants | 10 | 1559 | Std. Mean Difference (IV, Random, 95% CI) | ‐0.68 [‐0.86, ‐0.51] |
| 6.2 Trials without cohort selection bias of all participants | 11 | 628 | Std. Mean Difference (IV, Random, 95% CI) | ‐0.62 [‐0.90, ‐0.33] |
| 7 Subgroup analysis: parallel‐group trials compared with first‐period cross‐over trials Show forest plot | 21 | 2187 | Std. Mean Difference (IV, Random, 95% CI) | ‐0.66 [‐0.82, ‐0.51] |
| 7.1 Parallel‐group trials | 19 | 2094 | Std. Mean Difference (IV, Random, 95% CI) | ‐0.66 [‐0.83, ‐0.50] |
| 7.2 First‐period cross‐over trials | 2 | 93 | Std. Mean Difference (IV, Random, 95% CI) | ‐0.65 [‐1.07, ‐0.23] |
| 8 ADHD symptoms, cross‐over trials (endpoint data) Show forest plot | 41 | 3734 | Std. Mean Difference (IV, Random, 95% CI) | ‐0.78 [‐0.90, ‐0.67] |
| 8.1 Low risk of bias | 4 | 204 | Std. Mean Difference (IV, Random, 95% CI) | ‐0.54 [‐0.96, ‐0.13] |
| 8.2 High risk of bias | 37 | 3530 | Std. Mean Difference (IV, Random, 95% CI) | ‐0.81 [‐0.92, ‐0.69] |
| 9 ADHD symptoms, cross‐over trials (endpoint data), subgroup analysis: dose Show forest plot | 41 | 4918 | Std. Mean Difference (IV, Random, 95% CI) | ‐0.69 [‐0.79, ‐0.58] |
| 9.1 Low dose | 26 | 2272 | Std. Mean Difference (IV, Random, 95% CI) | ‐0.65 [‐0.82, ‐0.48] |
| 9.2 High dose | 28 | 2646 | Std. Mean Difference (IV, Random, 95% CI) | ‐0.72 [‐0.84, ‐0.60] |
| 10 Subgroup analysis: all parallel‐group trials and first‐period cross‐over trials compared with cross‐over trials (endpoint data) Show forest plot | 59 | 5861 | Std. Mean Difference (IV, Random, 95% CI) | ‐0.74 [‐0.83, ‐0.65] |
| 10.1 All parallel‐group trials and first‐period cross‐over trials | 21 | 2215 | Std. Mean Difference (IV, Random, 95% CI) | ‐0.66 [‐0.82, ‐0.51] |
| 10.2 Cross‐over trials (endpoint data) | 39 | 3646 | Std. Mean Difference (IV, Random, 95% CI) | ‐0.79 [‐0.90, ‐0.67] |
| Outcome or subgroup title | No. of studies | No. of participants | Statistical method | Effect size |
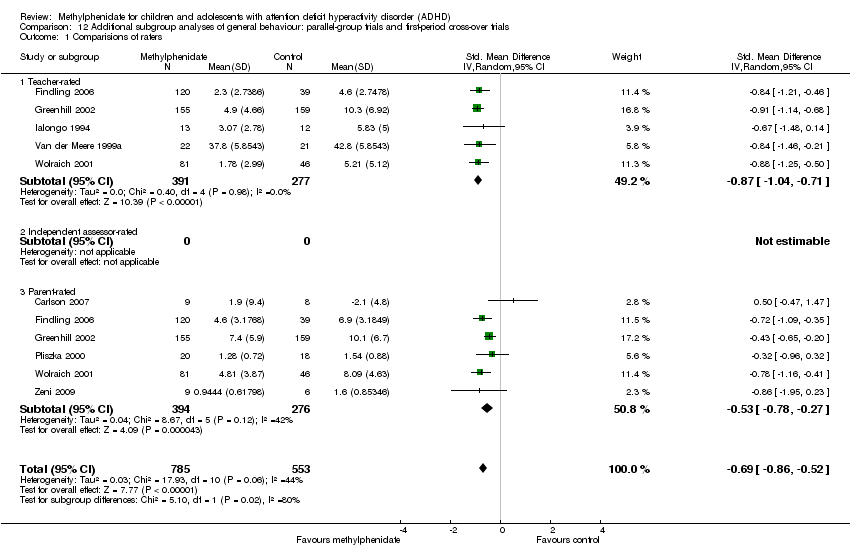
| 1 Comparision of raters Show forest plot | 31 | 5697 | Std. Mean Difference (IV, Random, 95% CI) | ‐0.69 [‐0.79, ‐0.59] |
| 1.1 Teacher‐rated | 19 | 1689 | Std. Mean Difference (IV, Random, 95% CI) | ‐0.78 [‐0.93, ‐0.63] |
| 1.2 Independent assessor‐rated | 9 | 1829 | Std. Mean Difference (IV, Random, 95% CI) | ‐0.61 [‐0.87, ‐0.35] |
| 1.3 Parent‐rated | 21 | 2179 | Std. Mean Difference (IV, Random, 95% CI) | ‐0.65 [‐0.81, ‐0.50] |
| 2 Age Show forest plot | 6 | 1039 | Std. Mean Difference (IV, Random, 95% CI) | ‐0.44 [‐0.74, ‐0.14] |
| 2.1 2 to 6 years | 1 | 64 | Std. Mean Difference (IV, Random, 95% CI) | ‐0.33 [‐0.82, 0.17] |
| 2.2 7 to 11 years | 2 | 278 | Std. Mean Difference (IV, Random, 95% CI) | ‐0.59 [‐1.03, ‐0.15] |
| 2.3 12 to 18 years | 3 | 697 | Std. Mean Difference (IV, Random, 95% CI) | ‐0.38 [‐0.88, 0.12] |
| 3 Comorbidity versus no comorbidity Show forest plot | 20 | 2310 | Std. Mean Difference (IV, Random, 95% CI) | ‐0.72 [‐0.91, ‐0.53] |
| 3.1 ADHD with comorbidity | 18 | 1981 | Std. Mean Difference (IV, Random, 95% CI) | ‐0.72 [‐0.94, ‐0.51] |
| 3.2 ADHD without comorbidity | 2 | 329 | Std. Mean Difference (IV, Random, 95% CI) | ‐0.69 [‐0.92, ‐0.46] |
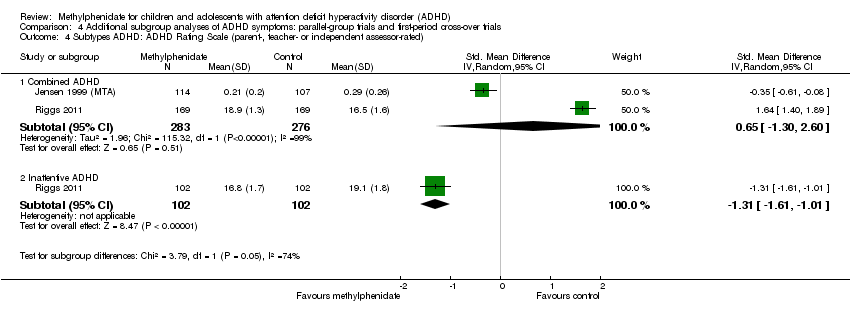
| 4 Subtypes ADHD: ADHD Rating Scale (parent‐, teacher‐ or independent assessor‐rated) Show forest plot | 2 | Std. Mean Difference (IV, Random, 95% CI) | Subtotals only | |
| 4.1 Combined ADHD | 2 | 559 | Std. Mean Difference (IV, Random, 95% CI) | 0.65 [‐1.30, 2.60] |
| 4.2 Inattentive ADHD | 1 | 204 | Std. Mean Difference (IV, Random, 95% CI) | ‐1.31 [‐1.61, ‐1.01] |
| 5 Cross‐over trials: first‐period data versus endpoint data (parent‐, independent assessor‐ and teacher‐rated) Show forest plot | 4 | Std. Mean Difference (IV, Random, 95% CI) | Subtotals only | |
| 5.1 First‐period data | 4 | 372 | Std. Mean Difference (IV, Random, 95% CI) | ‐0.64 [‐0.85, ‐0.44] |
| 5.2 Endpoint data | 4 | 372 | Std. Mean Difference (IV, Random, 95% CI) | ‐0.91 [‐1.18, ‐0.65] |
| Outcome or subgroup title | No. of studies | No. of participants | Statistical method | Effect size |
| 1 Number of serious adverse events (SAE) Show forest plot | 9 | 1532 | Risk Ratio (IV, Random, 95% CI) | 0.98 [0.44, 2.22] |
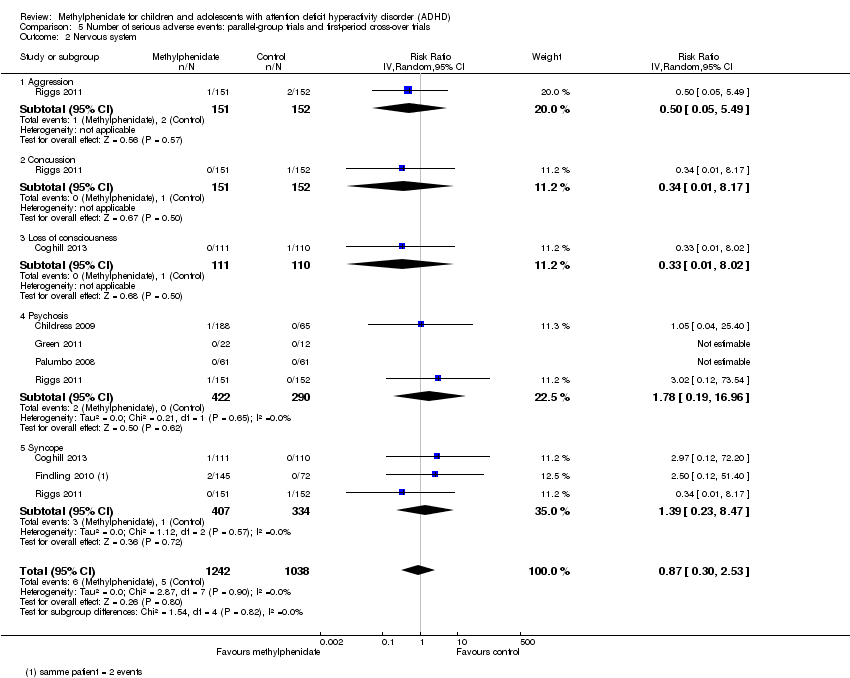
| 2 Nervous system Show forest plot | 6 | 2280 | Risk Ratio (IV, Random, 95% CI) | 0.87 [0.30, 2.53] |
| 2.1 Aggression | 1 | 303 | Risk Ratio (IV, Random, 95% CI) | 0.50 [0.05, 5.49] |
| 2.2 Concussion | 1 | 303 | Risk Ratio (IV, Random, 95% CI) | 0.34 [0.01, 8.17] |
| 2.3 Loss of consciousness | 1 | 221 | Risk Ratio (IV, Random, 95% CI) | 0.33 [0.01, 8.02] |
| 2.4 Psychosis | 4 | 712 | Risk Ratio (IV, Random, 95% CI) | 1.78 [0.19, 16.96] |
| 2.5 Syncope | 3 | 741 | Risk Ratio (IV, Random, 95% CI) | 1.39 [0.23, 8.47] |
| 3 Digestive system: gastrointestinal disorders Show forest plot | 1 | Risk Ratio (IV, Random, 95% CI) | Subtotals only | |
| 4 Urinary system: kidney infection Show forest plot | 1 | Risk Ratio (IV, Random, 95% CI) | Subtotals only | |
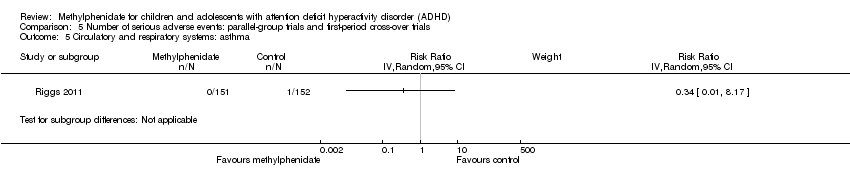
| 5 Circulatory and respiratory systems: asthma Show forest plot | 1 | Risk Ratio (IV, Random, 95% CI) | Subtotals only | |
| 6 Immune system: cyst rupture Show forest plot | 1 | Risk Ratio (IV, Random, 95% CI) | Subtotals only | |
| 7 Other: drug toxicity Show forest plot | 1 | 303 | Risk Ratio (IV, Random, 95% CI) | 0.34 [0.01, 8.17] |
| Outcome or subgroup title | No. of studies | No. of participants | Statistical method | Effect size |
| 1 Number of serious adverse events (SAE) Show forest plot | 8 | 1721 | Risk Ratio (IV, Random, 95% CI) | 1.62 [0.34, 7.71] |
| 2 Hallucinations/psychosis Show forest plot | 4 | 187 | Risk Ratio (IV, Random, 95% CI) | 1.10 [0.18, 6.72] |
| Outcome or subgroup title | No. of studies | No. of participants | Statistical method | Effect size |
| 1 Total number of non‐serious adverse events Show forest plot | 21 | 3132 | Risk Ratio (IV, Random, 95% CI) | 1.29 [1.10, 1.51] |
| 2 Subgroup analysis: total number of non‐serious adverse events according to dose Show forest plot | 21 | 3135 | Risk Ratio (IV, Random, 95% CI) | 1.28 [1.11, 1.49] |
| 2.1 Low dose | 2 | 151 | Risk Ratio (IV, Random, 95% CI) | 1.09 [0.82, 1.46] |
| 2.2 High dose | 10 | 1761 | Risk Ratio (IV, Random, 95% CI) | 1.22 [1.10, 1.35] |
| 2.3 Unknown dose | 10 | 1223 | Risk Ratio (IV, Random, 95% CI) | 1.37 [1.01, 1.87] |
| 3 Nervous system Show forest plot | 21 | Risk Ratio (Random, 95% CI) | Subtotals only | |
| 3.1 Affective | 4 | 390 | Risk Ratio (Random, 95% CI) | 2.39 [0.48, 11.96] |
| 3.2 Aggression | 2 | 417 | Risk Ratio (Random, 95% CI) | 1.16 [0.17, 7.80] |
| 3.3 Apathy | 1 | 59 | Risk Ratio (Random, 95% CI) | 0.80 [0.19, 3.33] |
| 3.4 Confusion | 2 | 548 | Risk Ratio (Random, 95% CI) | 1.01 [0.22, 4.73] |
| 3.5 Depression | 1 | 59 | Risk Ratio (Random, 95% CI) | 0.83 [0.22, 3.10] |
| 3.6 Dizziness | 3 | 683 | Risk Ratio (Random, 95% CI) | 2.50 [0.70, 8.99] |
| 3.7 Drowsiness | 4 | 811 | Risk Ratio (Random, 95% CI) | 1.27 [0.82, 1.98] |
| 3.8 Emotional lability | 1 | 132 | Risk Ratio (Random, 95% CI) | 2.41 [0.27, 21.32] |
| 3.9 Fatigue | 7 | 858 | Risk Ratio (Random, 95% CI) | 0.76 [0.36, 1.63] |
| 3.10 Headache | 17 | 2724 | Risk Ratio (Random, 95% CI) | 1.22 [0.90, 1.64] |
| 3.11 Insomnia | 3 | 349 | Risk Ratio (Random, 95% CI) | 1.31 [0.35, 4.93] |
| 3.12 Irritability | 11 | 1721 | Risk Ratio (Random, 95% CI) | 1.11 [0.77, 1.60] |
| 3.13 Nervousness | 2 | 362 | Risk Ratio (Random, 95% CI) | 2.52 [0.82, 7.76] |
| 3.14 Pain | 1 | 132 | Risk Ratio (Random, 95% CI) | 1.91 [0.21, 17.60] |
| 3.15 Picking at skin or fingers, nail biting, lip or cheek chewing | 1 | 316 | Risk Ratio (Random, 95% CI) | 1.01 [0.60, 1.70] |
| 3.16 Sad, tearful or depressed | 4 | 707 | Risk Ratio (Random, 95% CI) | 1.41 [0.86, 2.29] |
| 3.17 Somnolence | 2 | 173 | Risk Ratio (Random, 95% CI) | 0.59 [0.11, 3.11] |
| 3.18 Trouble sleeping or sleep problems | 13 | 2416 | Risk Ratio (Random, 95% CI) | 1.60 [1.15, 2.23] |
| 3.19 Tics or nervous movements | 8 | 1231 | Risk Ratio (Random, 95% CI) | 0.85 [0.26, 2.79] |
| 3.20 Worried or anxious | 3 | 596 | Risk Ratio (Random, 95% CI) | 1.37 [0.84, 2.25] |
| 4 Digestive system Show forest plot | 18 | Risk Ratio (IV, Random, 95% CI) | Subtotals only | |
| 4.1 Decreased appetite | 16 | 2962 | Risk Ratio (IV, Random, 95% CI) | 3.66 [2.56, 5.23] |
| 4.2 Decreased weight | 6 | 859 | Risk Ratio (IV, Random, 95% CI) | 3.89 [1.43, 10.59] |
| 4.3 Diarrhoea | 5 | 857 | Risk Ratio (IV, Random, 95% CI) | 1.07 [0.41, 2.74] |
| 4.4 Dyspepsia | 2 | 159 | Risk Ratio (IV, Random, 95% CI) | 1.80 [0.71, 4.54] |
| 4.5 Increased appetite | 1 | 179 | Risk Ratio (IV, Random, 95% CI) | 0.07 [0.00, 1.43] |
| 4.6 Nausea | 11 | 1995 | Risk Ratio (IV, Random, 95% CI) | 1.30 [0.85, 1.99] |
| 4.7 Stomachache | 13 | 2341 | Risk Ratio (IV, Random, 95% CI) | 1.30 [1.00, 1.69] |
| 4.8 Vomiting | 11 | 1916 | Risk Ratio (IV, Random, 95% CI) | 1.17 [0.76, 1.79] |
| 5 Circulatory and respiratory systems Show forest plot | 8 | Risk Ratio (Random, 95% CI) | Subtotals only | |
| 5.1 ECG: prolonged QT‐interval | 2 | 466 | Risk Ratio (Random, 95% CI) | 0.81 [0.13, 5.00] |
| 5.2 ECG: tachycardia | 1 | 245 | Risk Ratio (Random, 95% CI) | 1.04 [0.11, 10.18] |
| 5.3 Cough | 4 | 996 | Risk Ratio (Random, 95% CI) | 0.95 [0.41, 2.18] |
| 5.4 Nasal congestion | 2 | 479 | Risk Ratio (Random, 95% CI) | 1.19 [0.59, 2.41] |
| 5.5 Pharyngolaryngeal pain | 1 | 303 | Risk Ratio (Random, 95% CI) | 1.12 [0.59, 2.13] |
| 5.6 Supraventricular extrasystoles | 1 | 17 | Risk Ratio (Random, 95% CI) | 3.00 [0.11, 84.55] |
| 5.7 Upper respiratory tract infection | 1 | 217 | Risk Ratio (Random, 95% CI) | 1.07 [0.42, 2.76] |
| 6 Skeletal and muscular systems Show forest plot | 2 | Risk Ratio (IV, Random, 95% CI) | Subtotals only | |
| 6.1 Arthralgia | 1 | 303 | Risk Ratio (IV, Random, 95% CI) | 0.67 [0.24, 1.84] |
| 6.2 Asthenia | 1 | 177 | Risk Ratio (IV, Random, 95% CI) | 0.21 [0.01, 4.25] |
| 6.3 Back pain | 1 | 303 | Risk Ratio (IV, Random, 95% CI) | 0.81 [0.39, 1.66] |
| 6.4 Myalgia | 1 | 303 | Risk Ratio (IV, Random, 95% CI) | 0.60 [0.23, 1.62] |
| 6.5 Toothache | 1 | 303 | Risk Ratio (IV, Random, 95% CI) | 1.01 [0.43, 2.35] |
| 7 Immune system Show forest plot | 7 | Risk Ratio (IV, Random, 95% CI) | Subtotals only | |
| 7.1 Gastroenteritis | 3 | 435 | Risk Ratio (IV, Random, 95% CI) | 4.63 [0.99, 21.72] |
| 7.2 Influenza | 3 | 624 | Risk Ratio (IV, Random, 95% CI) | 0.65 [0.20, 2.10] |
| 7.3 Nasopharyngitis | 5 | 979 | Risk Ratio (IV, Random, 95% CI) | 1.15 [0.70, 1.87] |
| 7.4 Otitis media | 1 | 100 | Risk Ratio (IV, Random, 95% CI) | 1.77 [0.17, 18.94] |
| 7.5 Pharyngitis | 2 | 293 | Risk Ratio (IV, Random, 95% CI) | 2.43 [0.49, 12.05] |
| 7.6 Pyrexia | 2 | 400 | Risk Ratio (IV, Random, 95% CI) | 1.02 [0.01, 87.72] |
| 7.7 Rhinitis | 1 | 132 | Risk Ratio (IV, Random, 95% CI) | 1.28 [0.43, 3.79] |
| 7.8 Upper respiratory tract infection ‐ not otherwise specified (NOS) | 5 | 917 | Risk Ratio (IV, Random, 95% CI) | 1.19 [0.68, 2.06] |
| 7.9 Viral infection NOS | 3 | 614 | Risk Ratio (IV, Random, 95% CI) | 0.70 [0.23, 2.15] |
| 8 Height Show forest plot | 1 | Mean Difference (IV, Random, 95% CI) | Totals not selected | |
| 9 Weight Show forest plot | 5 | 805 | Std. Mean Difference (IV, Random, 95% CI) | ‐1.12 [‐1.55, ‐0.70] |
| 10 BMI Show forest plot | 1 | Mean Difference (IV, Random, 95% CI) | Totals not selected | |
| 11 Vital signs Show forest plot | 9 | 3374 | Mean Difference (IV, Random, 95% CI) | 1.41 [0.30, 2.52] |
| 11.1 Diastolic blood pressure (mmHg) | 8 | 1067 | Mean Difference (IV, Random, 95% CI) | 0.94 [‐0.12, 2.01] |
| 11.2 Systolic blood pressure (mmHg) | 8 | 1067 | Mean Difference (IV, Random, 95% CI) | ‐0.05 [‐1.25, 1.16] |
| 11.3 Pulse or heart rate (bpm) | 8 | 1240 | Mean Difference (IV, Random, 95% CI) | 3.41 [0.87, 5.94] |
| 12 Other Show forest plot | 5 | 1815 | Risk Ratio (IV, Random, 95% CI) | 1.20 [0.56, 2.57] |
| 12.1 Accidental injury | 3 | 656 | Risk Ratio (IV, Random, 95% CI) | 0.99 [0.48, 2.07] |
| 12.2 Epistasis | 1 | 132 | Risk Ratio (IV, Random, 95% CI) | 4.25 [0.23, 77.22] |
| 12.3 Excoriation | 1 | 303 | Risk Ratio (IV, Random, 95% CI) | 3.52 [1.19, 10.46] |
| 12.4 Overdose | 1 | 221 | Risk Ratio (IV, Random, 95% CI) | 2.97 [0.12, 72.20] |
| 12.5 Skin disorder (rash) | 2 | 200 | Risk Ratio (IV, Random, 95% CI) | 0.52 [0.01, 26.44] |
| 12.6 Skin laceration | 1 | 303 | Risk Ratio (IV, Random, 95% CI) | 0.42 [0.15, 1.16] |
| Outcome or subgroup title | No. of studies | No. of participants | Statistical method | Effect size |
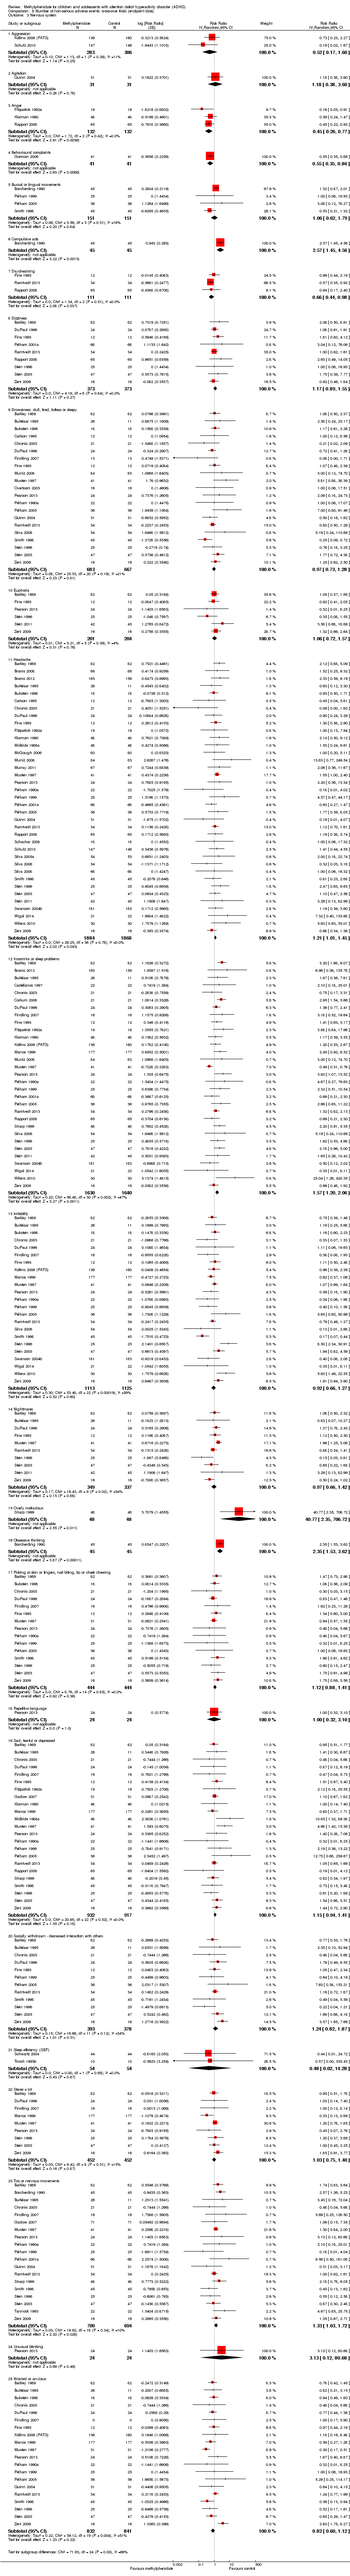
| 1 Total number of non‐serious adverse events Show forest plot | 21 | 2072 | Risk Ratio (Random, 95% CI) | 1.33 [1.11, 1.58] |
| 2 Subgroup analysis: total number of non‐serious adverse events according to dose Show forest plot | 21 | 2859 | Risk Ratio (Random, 95% CI) | 1.26 [1.11, 1.44] |
| 2.1 Low dose | 16 | 1539 | Risk Ratio (Random, 95% CI) | 1.11 [0.94, 1.31] |
| 2.2 High dose | 12 | 1080 | Risk Ratio (Random, 95% CI) | 1.57 [1.22, 2.01] |
| 2.3 Unknown dose | 2 | 240 | Risk Ratio (Random, 95% CI) | 0.98 [0.51, 1.86] |
| 3 Nervous system Show forest plot | 50 | Risk Ratio (Random, 95% CI) | Subtotals only | |
| 3.1 Aggression | 2 | 589 | Risk Ratio (Random, 95% CI) | 0.52 [0.17, 1.60] |
| 3.2 Agitation | 1 | 62 | Risk Ratio (Random, 95% CI) | 1.18 [0.38, 3.60] |
| 3.3 Anger | 3 | 264 | Risk Ratio (Random, 95% CI) | 0.45 [0.26, 0.77] |
| 3.4 Behavioural complaints | 1 | 82 | Risk Ratio (Random, 95% CI) | 0.55 [0.35, 0.86] |
| 3.5 Buccal or lingual movements | 4 | 302 | Risk Ratio (Random, 95% CI) | 1.06 [0.62, 1.79] |
| 3.6 Compulsive acts | 1 | 90 | Risk Ratio (Random, 95% CI) | 2.57 [1.45, 4.56] |
| 3.7 Daydreaming | 3 | 222 | Risk Ratio (Random, 95% CI) | 0.66 [0.44, 0.98] |
| 3.8 Dizziness | 9 | 746 | Risk Ratio (Random, 95% CI) | 1.17 [0.89, 1.55] |
| 3.9 Drowsiness: dull, tired, listless or sleepy | 21 | 1350 | Risk Ratio (Random, 95% CI) | 0.97 [0.73, 1.28] |
| 3.10 Euphoria | 6 | 405 | Risk Ratio (Random, 95% CI) | 1.06 [0.72, 1.57] |
| 3.11 Headache | 37 | 3752 | Risk Ratio (Random, 95% CI) | 1.21 [1.01, 1.45] |
| 3.12 Insomnia or sleep problems | 31 | 3270 | Risk Ratio (Random, 95% CI) | 1.57 [1.20, 2.06] |
| 3.13 Irritability | 23 | 2238 | Risk Ratio (Random, 95% CI) | 0.92 [0.66, 1.27] |
| 3.14 Nightmares | 10 | 686 | Risk Ratio (Random, 95% CI) | 0.97 [0.66, 1.42] |
| 3.15 Overly meticulous | 1 | 96 | Risk Ratio (Random, 95% CI) | 40.77 [2.35, 706.72] |
| 3.16 Obsessive thinking | 1 | 90 | Risk Ratio (Random, 95% CI) | 2.35 [1.53, 3.62] |
| 3.17 Picking at skin or fingers, nail biting, lip or cheek chewing | 15 | 888 | Risk Ratio (Random, 95% CI) | 1.12 [0.88, 1.41] |
| 3.18 Repetitive language | 1 | 48 | Risk Ratio (Random, 95% CI) | 1.0 [0.32, 3.10] |
| 3.19 Sad, tearful or depressed | 23 | 1849 | Risk Ratio (Random, 95% CI) | 1.15 [0.94, 1.41] |
| 3.20 Socially withdrawn ‐ decreased interaction with others | 12 | 771 | Risk Ratio (Random, 95% CI) | 1.24 [0.82, 1.87] |
| 3.21 Sleep efficiency (SEF) | 2 | 108 | Risk Ratio (Random, 95% CI) | 0.48 [0.02, 14.28] |
| 3.22 Stares a lot | 9 | 904 | Risk Ratio (Random, 95% CI) | 1.03 [0.75, 1.40] |
| 3.23 Tics or nervous movements | 19 | 1403 | Risk Ratio (Random, 95% CI) | 1.33 [1.03, 1.72] |
| 3.24 Unusual blinking | 1 | 48 | Risk Ratio (Random, 95% CI) | 3.13 [0.12, 80.68] |
| 3.25 Worried or anxious | 20 | 1673 | Risk Ratio (Random, 95% CI) | 0.82 [0.60, 1.12] |
| 4 Digestive system Show forest plot | 42 | Risk Ratio (Random, 95% CI) | Subtotals only | |
| 4.1 Decreased appetite or loss of appetite | 35 | 3862 | Risk Ratio (Random, 95% CI) | 3.04 [2.35, 3.94] |
| 4.2 Diarrhoea | 3 | 402 | Risk Ratio (Random, 95% CI) | 0.58 [0.19, 1.74] |
| 4.3 Dry mouth | 5 | 342 | Risk Ratio (Random, 95% CI) | 1.25 [0.54, 2.90] |
| 4.4 Dyspepsia | 1 | 62 | Risk Ratio (Random, 95% CI) | 0.22 [0.02, 2.14] |
| 4.5 Nausea | 9 | 768 | Risk Ratio (Random, 95% CI) | 1.52 [1.00, 2.30] |
| 4.6 Increased appetite | 1 | 136 | Risk Ratio (Random, 95% CI) | 0.20 [0.08, 0.50] |
| 4.7 Stomachache | 33 | 3777 | Risk Ratio (Random, 95% CI) | 1.61 [1.27, 2.04] |
| 4.8 Vomiting | 4 | 710 | Risk Ratio (Random, 95% CI) | 0.90 [0.26, 3.11] |
| 5 Urinary system: urinary incontinence Show forest plot | 1 | Risk Ratio (IV, Random, 95% CI) | Totals not selected | |
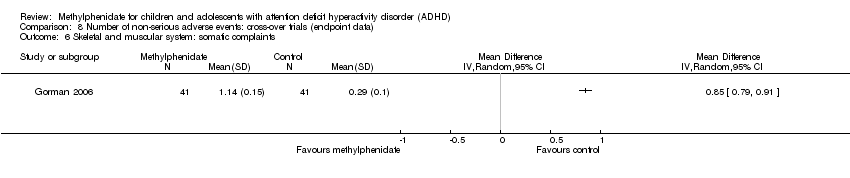
| 6 Skeletal and muscular system: somatic complaints Show forest plot | 1 | Mean Difference (IV, Random, 95% CI) | Totals not selected | |
| 7 Immune system Show forest plot | 7 | Risk Ratio (IV, Random, 95% CI) | Subtotals only | |
| 7.1 Allergic rhinitis | 4 | 475 | Risk Ratio (IV, Random, 95% CI) | 1.38 [0.35, 5.51] |
| 7.2 Fever | 2 | 91 | Risk Ratio (IV, Random, 95% CI) | 1.39 [0.09, 20.56] |
| 7.3 Lymphadenitis | 2 | 296 | Risk Ratio (IV, Random, 95% CI) | 3.93 [0.44, 35.11] |
| 7.4 Pharyngolaryngeal pain | 1 | 160 | Risk Ratio (IV, Random, 95% CI) | 2.0 [0.19, 21.62] |
| 7.5 Pharyngitis | 4 | 754 | Risk Ratio (IV, Random, 95% CI) | 0.71 [0.19, 2.62] |
| 7.6 Upper respiratory tract infection | 5 | 888 | Risk Ratio (IV, Random, 95% CI) | 0.61 [0.27, 1.37] |
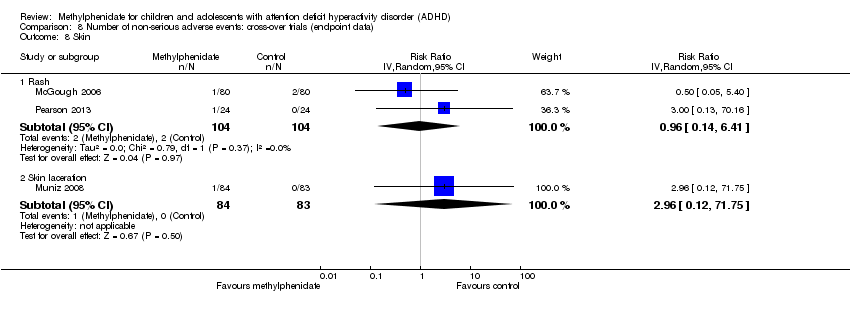
| 8 Skin Show forest plot | 3 | Risk Ratio (IV, Random, 95% CI) | Subtotals only | |
| 8.1 Rash | 2 | 208 | Risk Ratio (IV, Random, 95% CI) | 0.96 [0.14, 6.41] |
| 8.2 Skin laceration | 1 | 167 | Risk Ratio (IV, Random, 95% CI) | 2.96 [0.12, 71.75] |
| 9 Vital signs Show forest plot | 14 | Mean Difference (IV, Random, 95% CI) | Subtotals only | |
| 9.1 Diastolic blood pressure (mmHg) | 11 | 755 | Mean Difference (IV, Random, 95% CI) | 1.23 [‐0.39, 2.86] |
| 9.2 Systolic blood pressure (mmHg) | 11 | 755 | Mean Difference (IV, Random, 95% CI) | 0.53 [‐1.30, 2.36] |
| 9.3 Pulse or heart rate (bpm) | 14 | 939 | Mean Difference (IV, Random, 95% CI) | 5.06 [2.88, 7.24] |
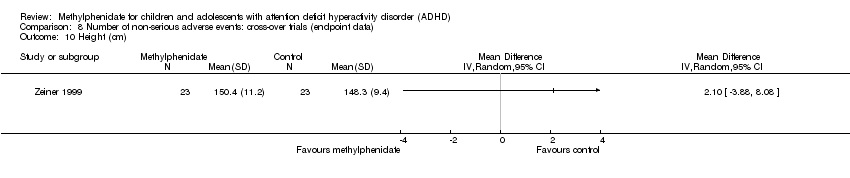
| 10 Height (cm) Show forest plot | 1 | Mean Difference (IV, Random, 95% CI) | Totals not selected | |
| 11 Weight Show forest plot | 6 | 530 | Std. Mean Difference (IV, Random, 95% CI) | ‐0.06 [‐0.23, 0.11] |
| Outcome or subgroup title | No. of studies | No. of participants | Statistical method | Effect size |
| 1 All parallel‐group trials and first‐period cross‐over trials: risk of bias Show forest plot | 5 | 668 | Std. Mean Difference (IV, Random, 95% CI) | ‐0.87 [‐1.04, ‐0.71] |
| 1.1 Low risk of bias | 0 | 0 | Std. Mean Difference (IV, Random, 95% CI) | 0.0 [0.0, 0.0] |
| 1.2 High risk of bias | 5 | 668 | Std. Mean Difference (IV, Random, 95% CI) | ‐0.87 [‐1.04, ‐0.71] |
| 2 Subgroup analysis: types of scales Show forest plot | 5 | 668 | Std. Mean Difference (IV, Random, 95% CI) | ‐0.87 [‐1.04, ‐0.71] |
| 2.1 Conners' Global Index ‐ Teacher (CGI‐T) | 1 | 314 | Std. Mean Difference (IV, Random, 95% CI) | ‐0.91 [‐1.14, ‐0.68] |
| 2.2 Groninger Behaviour Observation Scale (GBOS) | 1 | 43 | Std. Mean Difference (IV, Random, 95% CI) | ‐0.84 [‐1.46, ‐0.21] |
| 2.3 Conners' Teacher Rating Scale ‐ Conduct problems | 1 | 25 | Std. Mean Difference (IV, Random, 95% CI) | ‐0.67 [‐1.48, 0.14] |
| 2.4 IOWA Conners' Rating Scale ‐ Oppositional/Defiant (IOWA‐O/D) | 2 | 286 | Std. Mean Difference (IV, Random, 95% CI) | ‐0.86 [‐1.12, ‐0.59] |
| 3 Subgroup analysis: dose Show forest plot | 5 | 696 | Std. Mean Difference (IV, Random, 95% CI) | ‐0.85 [‐1.02, ‐0.69] |
| 3.1 Low dose | 2 | 71 | Std. Mean Difference (IV, Random, 95% CI) | ‐0.67 [‐1.16, ‐0.19] |
| 3.2 High dose | 3 | 466 | Std. Mean Difference (IV, Random, 95% CI) | ‐0.89 [‐1.08, ‐0.70] |
| 3.3 Unknown dose | 1 | 159 | Std. Mean Difference (IV, Random, 95% CI) | ‐0.84 [‐1.21, ‐0.46] |
| 4 Subgroup analysis: duration of treatment Show forest plot | 5 | 668 | Std. Mean Difference (IV, Random, 95% CI) | ‐0.87 [‐1.04, ‐0.71] |
| 4.1 Short term (up to 6 months) | 5 | 668 | Std. Mean Difference (IV, Random, 95% CI) | ‐0.87 [‐1.04, ‐0.71] |
| 4.2 Long term (over 6 months) | 0 | 0 | Std. Mean Difference (IV, Random, 95% CI) | 0.0 [0.0, 0.0] |
| 5 Subgroup analysis: parallel‐group trials versus first‐period cross‐over trials Show forest plot | 5 | 668 | Std. Mean Difference (IV, Random, 95% CI) | ‐0.87 [‐1.04, ‐0.71] |
| 5.1 Parallel‐group trials | 5 | 668 | Std. Mean Difference (IV, Random, 95% CI) | ‐0.87 [‐1.04, ‐0.71] |
| 5.2 First‐period cross‐over trials | 0 | 0 | Std. Mean Difference (IV, Random, 95% CI) | 0.0 [0.0, 0.0] |
| 6 General behaviour, cross‐over trials (endpoint data) Show forest plot | 16 | 2014 | Std. Mean Difference (IV, Random, 95% CI) | ‐0.69 [‐0.78, ‐0.60] |
| 6.1 Low dose | 13 | 1110 | Std. Mean Difference (IV, Random, 95% CI) | ‐0.60 [‐0.72, ‐0.48] |
| 6.2 High dose | 12 | 904 | Std. Mean Difference (IV, Random, 95% CI) | ‐0.82 [‐0.95, ‐0.68] |
| 7 Subgroup analysis: general behaviour, cross‐over trials (endpoint data): risk of bias Show forest plot | 16 | 1308 | Std. Mean Difference (IV, Random, 95% CI) | ‐0.75 [‐0.87, ‐0.63] |
| 7.1 Low risk of bias | 0 | 0 | Std. Mean Difference (IV, Random, 95% CI) | 0.0 [0.0, 0.0] |
| 7.2 High risk of bias | 16 | 1308 | Std. Mean Difference (IV, Random, 95% CI) | ‐0.75 [‐0.87, ‐0.63] |
| 8 Subgroup analysis: all parallel‐group trials and first‐period cross‐over trials (teacher‐rated) versus cross‐over trials (endpoint data) Show forest plot | 21 | 1976 | Std. Mean Difference (IV, Random, 95% CI) | ‐0.79 [‐0.88, ‐0.70] |
| 8.1 All parallel‐group trials and first‐period cross‐over trials | 5 | 668 | Std. Mean Difference (IV, Random, 95% CI) | ‐0.87 [‐1.04, ‐0.71] |
| 8.2 Cross‐over trials (endpoint data) | 16 | 1308 | Std. Mean Difference (IV, Random, 95% CI) | ‐0.75 [‐0.87, ‐0.63] |
| Outcome or subgroup title | No. of studies | No. of participants | Statistical method | Effect size |
| 1 General behaviour, cross‐over trials (endpoint data) Show forest plot | 8 | 1241 | Std. Mean Difference (IV, Random, 95% CI) | ‐0.60 [‐0.75, ‐0.46] |
| 1.1 Low dose | 7 | 903 | Std. Mean Difference (IV, Random, 95% CI) | ‐0.56 [‐0.76, ‐0.36] |
| 1.2 High dose | 5 | 338 | Std. Mean Difference (IV, Random, 95% CI) | ‐0.71 [‐0.93, ‐0.49] |
| 2 Subgroup analysis: general behaviour, cross‐over trials (endpoint data): risk of bias Show forest plot | 8 | 951 | Std. Mean Difference (IV, Random, 95% CI) | ‐0.69 [‐0.88, ‐0.49] |
| 2.1 Low risk of bias | 0 | 0 | Std. Mean Difference (IV, Random, 95% CI) | 0.0 [0.0, 0.0] |
| 2.2 High risk of bias | 8 | 951 | Std. Mean Difference (IV, Random, 95% CI) | ‐0.69 [‐0.88, ‐0.49] |
| 3 Subgroup analysis: all parallel‐group trials and first‐period cross‐over trials (independent assessor‐rated) compared with cross‐over trials (endpoint data) Show forest plot | 8 | 951 | Std. Mean Difference (IV, Random, 95% CI) | ‐0.69 [‐0.88, ‐0.49] |
| 3.1 Parallel‐group trials and first‐period cross‐over trials | 0 | 0 | Std. Mean Difference (IV, Random, 95% CI) | 0.0 [0.0, 0.0] |
| 3.2 Cross‐over trials (endpoint data) | 8 | 951 | Std. Mean Difference (IV, Random, 95% CI) | ‐0.69 [‐0.88, ‐0.49] |
| Outcome or subgroup title | No. of studies | No. of participants | Statistical method | Effect size |
| 1 All parallel‐group trials and first‐period cross‐over trials Show forest plot | 6 | 670 | Std. Mean Difference (IV, Random, 95% CI) | ‐0.53 [‐0.78, ‐0.27] |
| 2 Subgroup analysis: risk of bias Show forest plot | 6 | 670 | Std. Mean Difference (IV, Random, 95% CI) | ‐0.53 [‐0.78, ‐0.27] |
| 2.1 Low risk of bias | 0 | 0 | Std. Mean Difference (IV, Random, 95% CI) | 0.0 [0.0, 0.0] |
| 2.2 High risk of bias | 6 | 670 | Std. Mean Difference (IV, Random, 95% CI) | ‐0.53 [‐0.78, ‐0.27] |
| 3 Subgroup analysis: types of scales Show forest plot | 6 | 670 | Std. Mean Difference (IV, Random, 95% CI) | ‐0.53 [‐0.78, ‐0.27] |
| 3.1 The Weekly Parent Ratings of Evening and Morning Behaviour (WPREMB) ‐ Revised | 1 | 17 | Std. Mean Difference (IV, Random, 95% CI) | 0.50 [‐0.47, 1.47] |
| 3.2 Conners' Global Index (CGI) ‐ Parent | 2 | 352 | Std. Mean Difference (IV, Random, 95% CI) | ‐0.41 [‐0.63, ‐0.20] |
| 3.3 Swanson, Nolan and Pelham, Fourth Edition ‐ Oppositional (SNAP‐IV‐Oppositional) | 1 | 15 | Std. Mean Difference (IV, Random, 95% CI) | ‐0.86 [‐1.95, 0.23] |
| 3.4 IOWA Conners' Rating Scale ‐ Oppositional/Defiant (IOWA‐I/O) | 2 | 286 | Std. Mean Difference (IV, Random, 95% CI) | ‐0.75 [‐1.01, ‐0.49] |
| 4 Subgroup analysis: parallel‐group trials compared with first‐period cross‐over trials Show forest plot | 6 | 670 | Std. Mean Difference (IV, Random, 95% CI) | ‐0.53 [‐0.78, ‐0.27] |
| 4.1 Parallel‐group trials | 5 | 655 | Std. Mean Difference (IV, Random, 95% CI) | ‐0.51 [‐0.78, ‐0.23] |
| 4.2 First‐period cross‐over trials | 1 | 15 | Std. Mean Difference (IV, Random, 95% CI) | ‐0.86 [‐1.95, 0.23] |
| 5 Subgroup analysis: duration of treatment Show forest plot | 6 | 670 | Std. Mean Difference (IV, Random, 95% CI) | ‐0.53 [‐0.78, ‐0.27] |
| 5.1 Short term (up to 6 months) | 6 | 670 | Std. Mean Difference (IV, Random, 95% CI) | ‐0.53 [‐0.78, ‐0.27] |
| 5.2 Long term (over 6 months) | 0 | 0 | Std. Mean Difference (IV, Random, 95% CI) | 0.0 [0.0, 0.0] |
| 6 Subgroup analysis: dose Show forest plot | 6 | 670 | Std. Mean Difference (IV, Random, 95% CI) | ‐0.53 [‐0.78, ‐0.27] |
| 6.1 Low dose | 0 | 0 | Std. Mean Difference (IV, Random, 95% CI) | 0.0 [0.0, 0.0] |
| 6.2 High dose | 4 | 496 | Std. Mean Difference (IV, Random, 95% CI) | ‐0.42 [‐0.77, ‐0.08] |
| 6.3 Unknown dose | 2 | 174 | Std. Mean Difference (IV, Random, 95% CI) | ‐0.73 [‐1.08, ‐0.38] |
| 7 General behaviour, cross‐over trials (endpoint data) Show forest plot | 6 | 550 | Std. Mean Difference (IV, Random, 95% CI) | ‐0.75 [‐0.93, ‐0.56] |
| 7.1 Low dose | 5 | 248 | Std. Mean Difference (IV, Random, 95% CI) | ‐0.65 [‐0.93, ‐0.38] |
| 7.2 High dose | 4 | 302 | Std. Mean Difference (IV, Random, 95% CI) | ‐0.83 [‐1.07, ‐0.60] |
| 8 Subgroup analysis: general behaviour, cross‐over trials (endpoint data): risk of bias Show forest plot | 6 | 384 | Std. Mean Difference (IV, Random, 95% CI) | ‐0.84 [‐1.05, ‐0.63] |
| 8.1 Low risk of bias | 0 | 0 | Std. Mean Difference (IV, Random, 95% CI) | 0.0 [0.0, 0.0] |
| 8.2 High risk of bias | 6 | 384 | Std. Mean Difference (IV, Random, 95% CI) | ‐0.84 [‐1.05, ‐0.63] |
| 9 Subgroup analysis: all parallel‐group trials and first‐period cross‐over trials (parent‐rated) compared with cross‐over trials (endpoint data) Show forest plot | 12 | 1054 | Std. Mean Difference (IV, Random, 95% CI) | ‐0.68 [‐0.86, ‐0.50] |
| 9.1 All parallel‐group trials and first‐period cross‐over trials | 6 | 670 | Std. Mean Difference (IV, Random, 95% CI) | ‐0.53 [‐0.78, ‐0.27] |
| 9.2 Cross‐over trials (endpoint data) | 6 | 384 | Std. Mean Difference (IV, Random, 95% CI) | ‐0.84 [‐1.05, ‐0.63] |
| Outcome or subgroup title | No. of studies | No. of participants | Statistical method | Effect size |
| 1 Comparisions of raters Show forest plot | 8 | 1338 | Std. Mean Difference (IV, Random, 95% CI) | ‐0.69 [‐0.86, ‐0.52] |
| 1.1 Teacher‐rated | 5 | 668 | Std. Mean Difference (IV, Random, 95% CI) | ‐0.87 [‐1.04, ‐0.71] |
| 1.2 Independent assessor‐rated | 0 | 0 | Std. Mean Difference (IV, Random, 95% CI) | 0.0 [0.0, 0.0] |
| 1.3 Parent‐rated | 6 | 670 | Std. Mean Difference (IV, Random, 95% CI) | ‐0.53 [‐0.78, ‐0.27] |
| 2 Comorbidity versus no comorbidity Show forest plot | 7 | 579 | Std. Mean Difference (IV, Random, 95% CI) | ‐0.70 [‐0.98, ‐0.43] |
| 2.1 ADHD with comorbidity | 6 | 265 | Std. Mean Difference (IV, Random, 95% CI) | ‐0.59 [‐0.95, ‐0.23] |
| 2.2 ADHD without comorbidity | 1 | 314 | Std. Mean Difference (IV, Random, 95% CI) | ‐0.91 [‐1.14, ‐0.68] |
| 3 Cross‐over trials: first‐period data versus endpoint data (teacher‐, parent‐, and independent assessor‐rated) Show forest plot | 1 | Mean Difference (IV, Random, 95% CI) | Subtotals only | |
| 3.1 First‐period data | 1 | 16 | Mean Difference (IV, Random, 95% CI) | ‐0.81 [‐1.75, 0.13] |
| 3.2 Endpoint data | 1 | 14 | Mean Difference (IV, Random, 95% CI) | 0.14 [‐0.71, 1.00] |
| Outcome or subgroup title | No. of studies | No. of participants | Statistical method | Effect size |
| 1 Subgroup analysis: types of scales Show forest plot | 3 | 514 | Std. Mean Difference (IV, Random, 95% CI) | 0.61 [0.42, 0.80] |
| 1.1 Child Health Questionnaire (CHQ) | 1 | 257 | Std. Mean Difference (IV, Random, 95% CI) | 0.54 [0.25, 0.83] |
| 1.2 Children´s Global Assessment Scale (CGAS) | 1 | 36 | Std. Mean Difference (IV, Random, 95% CI) | 0.79 [0.10, 1.47] |
| 1.3 Child Health and Illness Profile, Child Edition: Parent Report Form (CHIP‐CE:PRF) | 1 | 221 | Std. Mean Difference (IV, Random, 95% CI) | 0.64 [0.37, 0.91] |