Metilfenidato para niños y adolescentes con trastorno de déficit de atención e hiperactividad (TDAH)
Appendices
Appendix 1. Search strategies
| Database | Search strategy |
| CENTRAL (Cochrane Library) | Efficacy Adverse events |
| Ovid MEDLINE | Efficacy Adverse events |
| EMBASE (Ovid) | Efficacy Adverse events |
| CINAHL (EBSCOhost) | Broad strategy to capture both efficacy and adverse events studies |
| PsycINFO (Ovid) | Efficacy Adverse events |
| CPCI‐S, CPCI‐SSH (Web of Science) | Broad strategy to capture both efficacy and adverse events studies #2 AND #1 #2 TS=(child* or boy* or girl* or adolescen* or teen* or preschool* or "pre school*" or infant* or baby or babies or toddler* or "school child*" or schoolchild* or youth*) #1 TS=(Methylphenidate or Attenta or Biphentin or Calocain or Centedrin* or Concerta or Daytrana or Dexmethylphenidat* or Elmifiten or Equasym or Focalin or Medikid or Medikinet or Meridil or Metadate or "Methyl phenidat*" or "Methyl phenidylacetat" or Methylfenid or Methylin or Methylofenidan or Methylphenid* or "Methyl phenidyl acetat*" or Methypatch or Metilfenidato or Motiron or MPH or Penid or Omozin or Quazym or "Phenidyl hydrochlorid*" or Phenidylat* or Plimasin* or "PMS‐Methylphenid* " or "Richter Works" or Riphenidat* or Ritalin* or Rubifen or Stimdat* or Tifinidat or Tranquilyn or Tsentedrin*) |
| Advanced search: Methylphenidate OR concerta OR daytrana OR dexmethylphenidate OR equasym OR focalin OR medikinet OR MPH OR Ritalin Studies with results Age group: Child | |
| WHO ICTRP (who.int/ictrp/en | Intervention: Methylphenidate OR concerta OR daytrana OR dexmethylphenidate OR equasym OR focalin OR medikinet OR MPH OR Ritalin Status: all Children |
CENTRAL: Cochrane Central Register of Controlled Trials.
CINAHL: Cumulative Index to Nursing and Allied Health Literature.
CPCI‐S: Conference Proceedings Citation Index ‐ Science.
CPCI‐SSH: Conference Proceedings Citation Index ‐ Social Science & Humanities.
WHO ICTRP: World Health Organisation International Clinical Trials Registry Platform.
Appendix 2. Letter to pharmaceutical companies
To whom it might concern,
| Date: June 2013 The Cochrane Methylphenidate Group Psychiatric Research Unit Toftebakken 9 4000 Roskilde, Denmark Ole Jakob Storebø Email: [email protected] Phone: +45 25119901 |
Regarding: Methylphenidate for attention deficit hyperactivity disorder (ADHD) in children and adolescents – a Cochrane systematic review.
On behalf of the Cochrane Methylphenidate Group we address you in order to request your assistance. We are elaborating a systematic review on the effect of methylphenidate treatment for children and adolescents with ADHD. We have been entrusted the elaboration of this review by The Cochrane Developmental, Psychosocial and Learning Problems Group.
The Cochrane systematic review intends to include all relevant literature empirically describing both the positive and possibly negative effects of the medical treatment. We believe the elaboration of this review is in common interest of patients, doctors and manufacturers of methylphenidate. Furthermore, it is an important ethical issue. The results from this review will, in the future, guide authorities, clinicians and researchers when it comes to considering the use of methylphenidate in the treatment for children and adolescents with ADHD.
The Cochrane review will be comprehensive. The currently included studies come from our search for literature through international, scientific databases [1]. However, the published literature only provides us with limited and possibly selective knowledge, since it is unlikely that all studies and data are available through these databases. By contacting authors of significant publications, experts in the field and pharmaceutical companies, we hope to be informed of additional studies, published as well as unpublished. We have been inspired by this approach used in other Cochrane systematic reviews investigating medical preparations for other widespread diseases as ADHD.
We hope you will assist us with providing data that are relevant for our review. As previously noted, we are interested in data regarding both positive and negative effects of methylphenidate from both observational studies and randomised clinical trials, regardless of the year the data were recorded or published.
It is important for us to point out that we are not investigating specific methylphenidate preparations but simply the effect of the active substance, methylphenidate. Thus, we will not refer to or recommend any specific methylphenidate preparation or drug company. However, we will state which companies we have been in contact with, and which of these who have assisted us with data.
If possible, we would be very pleased to meet a representative from your company.
Enclosed to this letter are our protocol, a recommendation from The Cochrane Developmental, Psychosocial and Learning Problems Group and a list of the currently included studies in our review.
We are hoping to hear from you. If you have any questions, please contact us.
On behalf of
The Cochrane Developmental, Psychosocial and Learning Problems Group
The Cochrane Methylphenidate Group
Ole Jakob Storebø
Project coordinator, Ph.D, Senior Scientist
Phone: +45 25119901
E‐mail: [email protected]
Erik Simonsen
Professor of Psychiatry, PhD, Dr.h.c.
Psychiatric Research Unit
Region Zealand
Toftebakken 9, 4000 Roskilde, Denmark
Christian Gluud
MD, dr. Med. Sci.,
Head of Department, Copenhagen Trial Unit,
Centre for Clinical Intervention Research,
Copenhagen University Hospital, Denmark
Per Hove Thomsen
Professor, MD, DMSc
Department of Children and Youth Psychiatry, Aarhus University Hospital
[1] Cochrane Central Register of Controlled Trials (CENTRAL) part of The Cochrane Library, MEDLINE, PsycINFO, EMBASE, CINAHL, ISI Conference Proceedings Citation Index (Science, and Social Science and Humanities), Clinical Trials.gov, and International Clinical Trials Registry Platform (ICTRP)
Appendix 3. Data extraction sheet RCTs ‐ parallel‐group trials
Version 09.04.2014
Source
| Trial ID (e.g. Plizska 2000) |
| Trial registry with ID Searchclinicaltrials.gov(from 2008 ‐) andwho.int/ictrp/en(from 2004 ‐) |
| Full citation |
| Form filled by |
| Author contact information |
| Other publications on same trial |
ID: identifier.
Eligibility
| Confirm eligibility | Yes No Awaiting assessment |
Correspondence
| Correspondence required |
Method
| Cluster‐randomised | Yes/no Intervention (n (number)) =, control (n) = |
| Location (e.g. hospital, out‐clinic) | ‐ |
| Summary (method) | Parallel trial with 2 arms:
|
Participants
| Summary (participants) | Number of participants screened Number of participants included Number of participants randomly assigned to methylphenidate and control Number of participants followed up in each arm: methylphenidate and control Number of withdrawals in each arm: Methylphenidate and control Diagnostic and Statistical Manual of Mental Disorders, Third Edition (DSM‐III) diagnosis of attention deficit hyperactivity disorder (ADHD) (combined (%), hyperactive‐impulsive (%), inattentive (%)) Age (years) (mean, range) IQ (mean, range) Sex (male, female) Methylphenidate naive (%/number) Ethnicity (Caucasian (%), African American (%), Asian (%), Hispanic (%), other (%)) Country Comorbidity (type %) Comedication (no/yes) Sociodemographics (e.g. double or single parent family, low, middle or upper class) Inclusion criteria Exclusion criteria |
Interventions
Participants were randomly assigned to type of (e.g. immediate‐release (IR), extended‐release (ER)) (dex‐) methylphenidate or control
Methylphenidate dosage: Mean (standard deviation (SD))
Administration schedule: time points
Duration of intervention
Titration period: none/duration initiated before/after randomisation
Treatment compliance
Outcome listing
| (Our outcomes according to our protocol: short, general description) ADHD symptoms Measure instrument (e.g. ADHD Rating Scale (ADHD‐RS); Swanson, Kotkin, Atkins, M‐Flynn and Pelham (SKAMP) Scale), parent‐/teacher‐/independent assessor‐rated, time point General behaviour Measure instrument (e.g. Child Behavior Checklist (CBCL)), parent‐/teacher‐/independent assessor‐rated, time point Quality of life Measure instrument, parent‐/teacher‐/independent assessor‐rated, time point Serious adverse events Type of outcome/adverse event, measure method/instrument, parent‐/teacher‐/independent assessor‐rated, time point Non‐serious adverse events Type of outcome/adverse event, measure method/instrument, parent‐/teacher‐/independent assessor‐rated, time point |
Outcomes (positive effects)
*e.g. copy of table from article*
Outcomes (adverse events)
*e.g. copy of table from article*
| Outcomes specified | Type of adverse events/responses | Total numbers | Mean | SD | Time point |
| Serious adverse events (temporal association, but not necessarily causal relationship) | |||||
| Serious adverse reaction (response to the drug) | |||||
| Non‐serious adverse events (temporal association) |
Risk of bias
| Item | Quote | Risk of bias (high, unclear, low) |
| Random sequence generation/generation of allocation sequence (selection bias) | ||
| Allocation concealment (selection bias) | ||
| Blinding of participants and personnel (performance bias) | ||
| Blinding of outcome assessment (detection bias) | ||
| Incomplete outcome data (intention‐to‐treat (ITT), imputation method) (attrition bias) | ||
| Selective outcome reporting (according to protocol?) | ||
| Vested interest | ||
| Other sources of bias | Authors’ affiliations (e.g. Novartis) Selection bias (e.g. titration after randomisation → exclusion of methylphenidate non‐responders or placebo responders) |
Notes
| Sample calculation Ethics approval Inclusion of methylphenidate responders only/exclusion of methylphenidate non‐responders/children who have previously experienced adverse events while taking methylphenidate Any withdrawals due to adverse events Comments from trial authors Key conclusions of trial authors Comments from review authors Supplemental information/data received through personal email correspondence with trial authors in *month* 2014 |
Appendix 4. Data extraction sheet RCTs ‐ cross‐over trials
Version 09.04.2014
Source
| Trial ID (e.g. Plizska 2000) | |
| Trial registry with ID Searchclinicaltrials.gov(from 2008 ‐) andwho.int/ictrp/en(from 2004 ‐) | |
| Full citation | |
| Form filled by | Date and name |
| Author contact information | |
| Other publications on same trial |
Eligibility
| Confirm eligibility | Yes No Awaiting assessment |
Correspondence
| Correspondence required | Data for each intervention period |
Method
| Cluster‐randomised | Yes/No Intervention (number (n)) =, control (n) = |
| Location (e.g. hospital, out‐clinic) | |
| Ethics approval | Yes/No/No information |
| Summary (method) | Cross‐over trial with 2 interventions:
Phases |
Participants
| Summary (participants) | Number of participants screened Number of participants included Participants were randomly assigned to 1 of X possible drug condition orders Number of participants followed up Number of withdrawals Diagnostic and Statistical Manual of Mental Disorders (DSM) or International Classification of Diseases (ICD) diagnosis of ADHD (combined (%), hyperactive‐impulsive (%), inattentive (%)) Age (years) (mean, range) IQ (mean, range) Sex (male, female) Methylphenidate naive (%/number) Ethnicity (Caucasian (%), African‐american (%), Asian (%), Hispanic (%), other (%)) Country Comorbidity (type %) Comedication (no/yes) Sociodemographics (e.g. double‐ or single‐parent family, low, middle or upper class) Inclusion criteria Exclusion criteria |
Interventions
Participants were randomly assigned to 1 of X possible drug condition orders of methylphenidate and control
Methylphenidate dosage: Mean (standard deviation (SD))
Administration schedule: time points
Duration of each medication condition
Washout before trial initiation
Medication‐free period between interventions
Titration period: none/duration initiated before/after randomisation
Treatment compliance
Outcome listing
| (Our outcomes according to our protocol: short, general description) ADHD symptoms Measure instrument (e.g. ADHD Rating Scale (ADHD‐RS), Swanson, Kotkin, Atkins, M‐Flynn and Pelham (SKAMP) scale), parent‐/teacher‐/independent assessor‐rated, time point General behaviour Measure instrument (e.g. Child Behavior Checklist (CBCL)), parent‐/teacher‐/independent assessor‐rated, time point Quality of life Measure instrument, parent‐/teacher‐/independent assessor‐rated, time point Serious adverse events Type of outcome/adverse event, measure method/instrument, parent‐ /teacher‐/independent assessor‐rated, time point Non‐serious adverse events Type of outcome/adverse event, measure method/instrument, parent‐ /teacher‐/independent assessor‐rated, time point |
Outcomes (positive effects)
*e.g. copy of table from article*
Outcomes (adverse events)
*e.g. copy of table from article*
| Outcomes specified | Types of adverse events/responses | Total numbers | Mean | SD | Time point |
| Serious adverse events (temporal association, but not necessarily causal relationship) | |||||
| Serious adverse reaction (response to the drug) | |||||
| Non‐serious adverse events (temporal association) |
Risk of bias
| Item | Quote | Risk of bias (high, unclear, low) |
| Random sequence generation/generation of allocation sequence (selection bias) | ||
| Allocation concealment (selection bias) | ||
| Blinding of participants and personnel (performance bias) | ||
| Blinding of outcome assessment (detection bias) | ||
| Incomplete outcome data (intention‐to‐treat (ITT), imputation method) (attrition bias) Exclusion of placebo responders etc.: methylphenidate non‐responders (after randomisation) | ||
| Selective outcome reporting (according to protocol?) | ||
| Vested interest | ||
| Other sources of bias | Authors’ affiliations (e.g. Novartis) Selection bias (e.g. titration after randomisation → exclusion of methylphenidate non‐responders or placebo responders) |
Notes
| Sample calculation Ethics approval Comments from trial authors Key conclusions of trial authors Comments from review authors Inclusion of methylphenidate responders only/exclusion of methylphenidate non‐responders/children who have previously experienced adverse events while taking methylphenidate Any withdrawals due to adverse events Supplemental information/data received through personal email correspondence with trial authors in *month* 2014 |
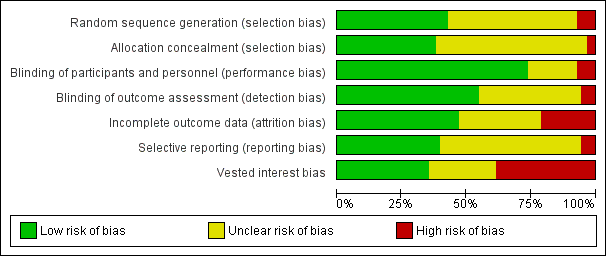
Risk of bias graph: review authors' judgements about each risk of bias item presented as percentages across all included studies.

Risk of bias summary: review authors' judgements about each risk of bias item for each included trial.
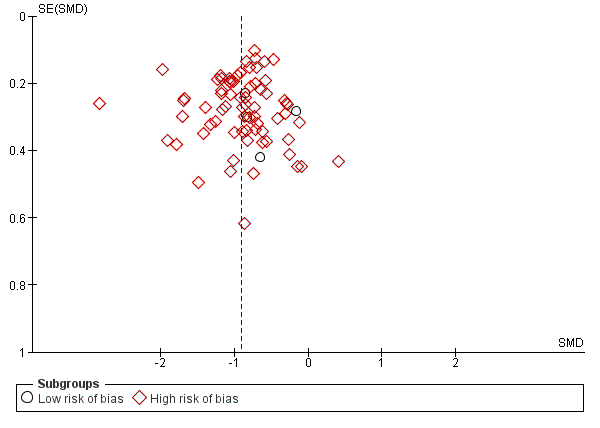
Funnel plot of comparison: 1. Teacher‐rated ADHD symptoms, outcome: 1.8 All data at low and high risk of bias (parallel‐group and cross‐over trials).

Trial Sequential Analysis: serious adverse events.
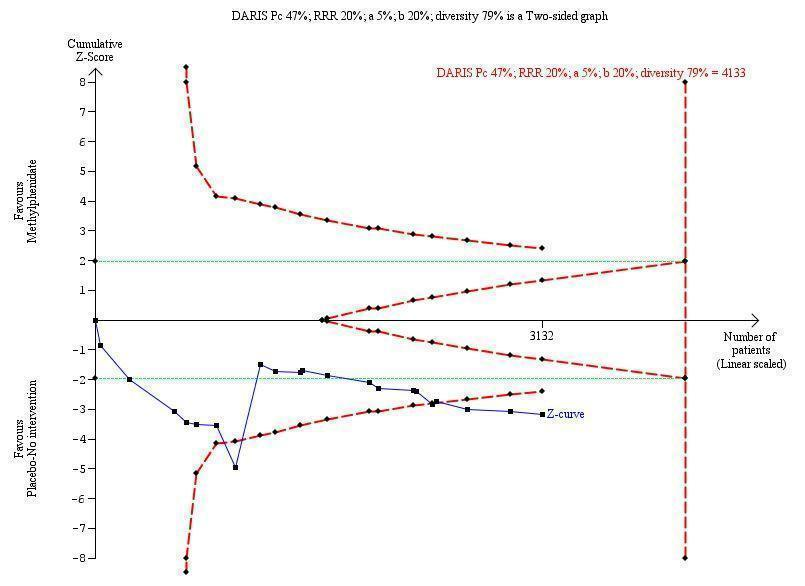
Trial Sequential Analysis: non‐serious adverse events.

Comparison 1 Teacher‐rated ADHD symptoms, Outcome 1 All parallel‐group trials and first‐period cross‐over trials.
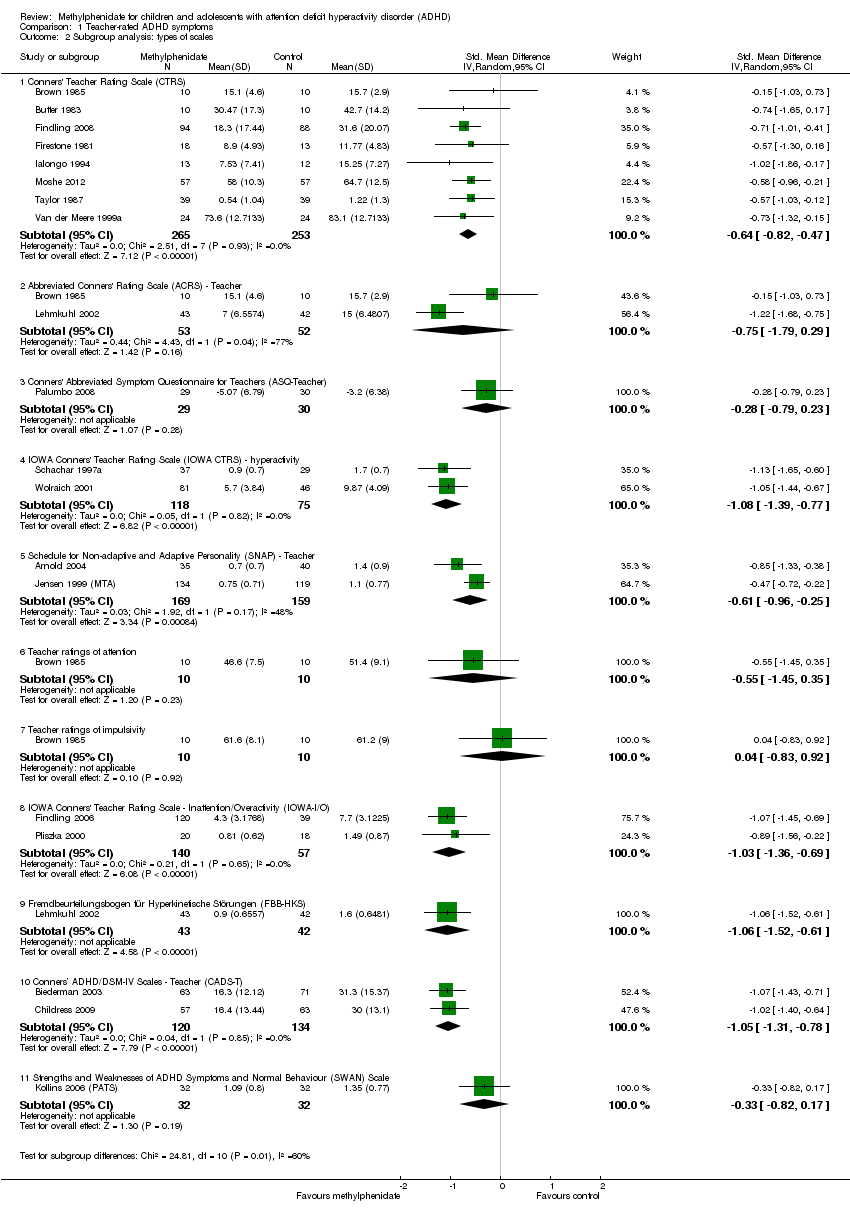
Comparison 1 Teacher‐rated ADHD symptoms, Outcome 2 Subgroup analysis: types of scales.

Comparison 1 Teacher‐rated ADHD symptoms, Outcome 3 Medication status: medication naive versus not medication naive.

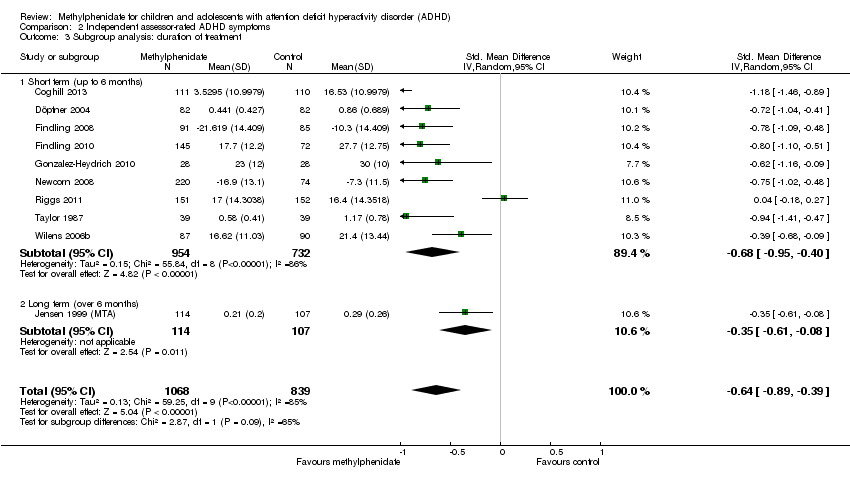
Comparison 1 Teacher‐rated ADHD symptoms, Outcome 4 Subgroup analysis: duration of treatment.

Comparison 1 Teacher‐rated ADHD symptoms, Outcome 5 Subgroup analysis: dose.
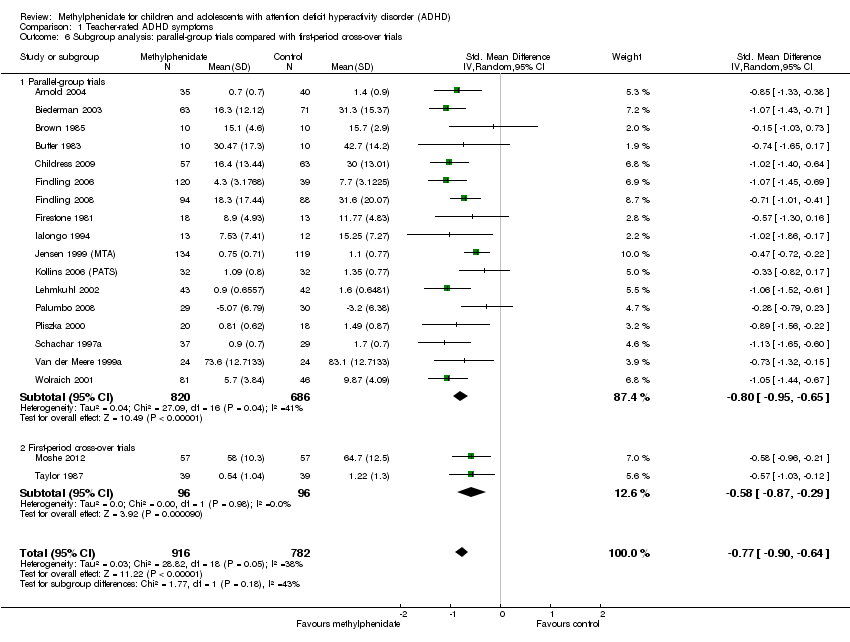
Comparison 1 Teacher‐rated ADHD symptoms, Outcome 6 Subgroup analysis: parallel‐group trials compared with first‐period cross‐over trials.

Comparison 1 Teacher‐rated ADHD symptoms, Outcome 7 Subgroup analysis: trials with cohort selection bias of all participants compared with trials without cohort selection bias of all participants.

Comparison 1 Teacher‐rated ADHD symptoms, Outcome 8 ADHD symptoms, cross‐over trial (endpoint data).

Comparison 1 Teacher‐rated ADHD symptoms, Outcome 9 ADHD symptoms, cross‐over trials (endpoint data), subgroup analysis: dose.
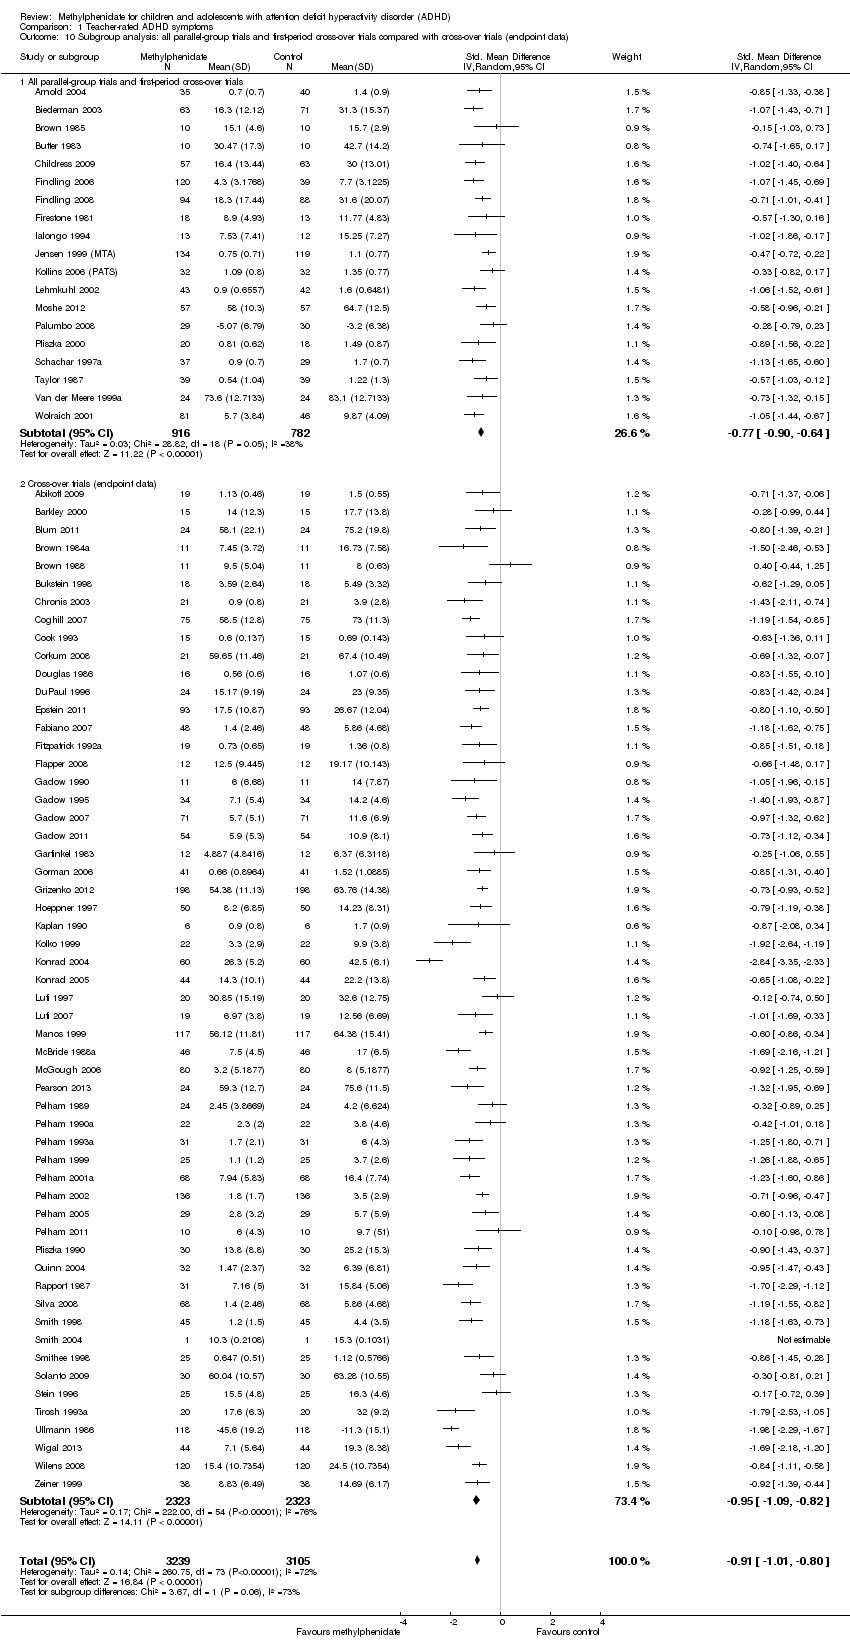
Comparison 1 Teacher‐rated ADHD symptoms, Outcome 10 Subgroup analysis: all parallel‐group trials and first‐period cross‐over trials compared with cross‐over trials (endpoint data).

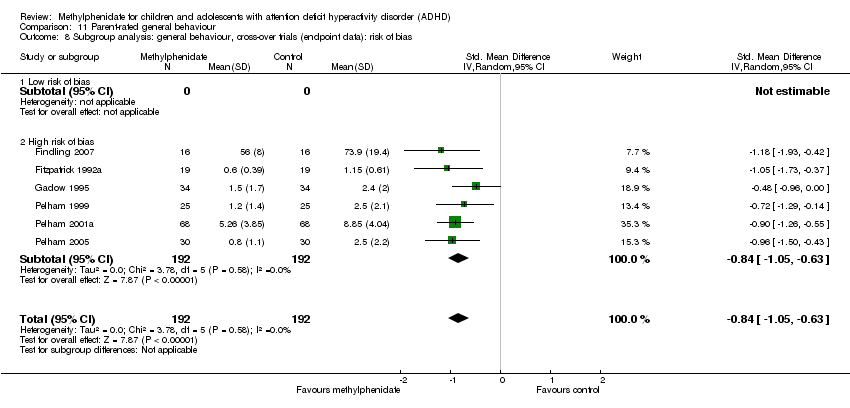
Comparison 1 Teacher‐rated ADHD symptoms, Outcome 11 All parallel‐group trials and cross‐over trials: risk of bias.

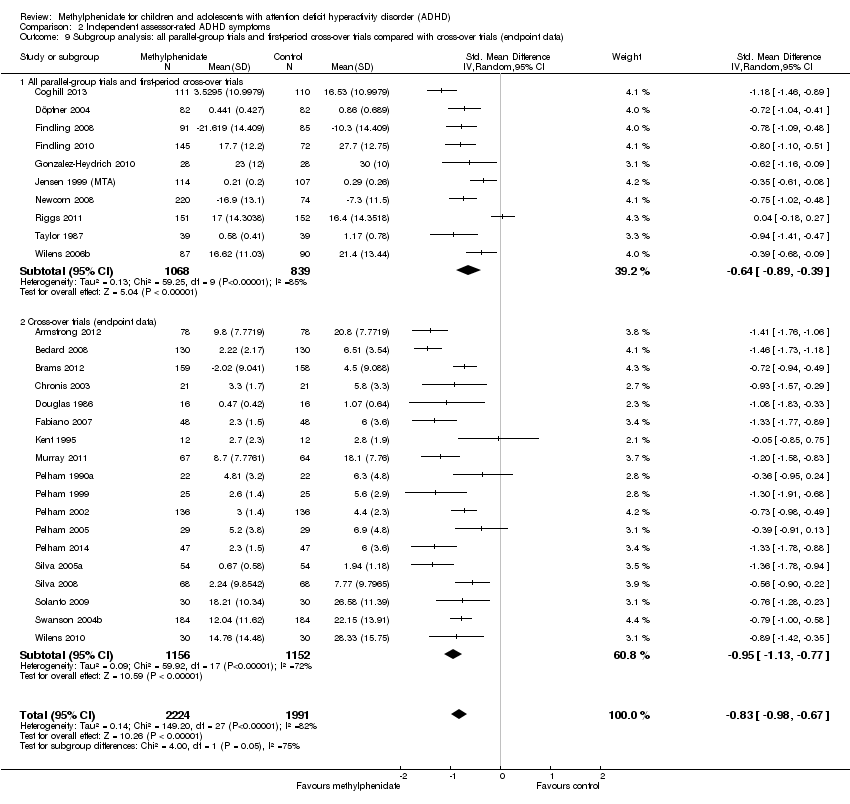
Comparison 2 Independent assessor‐rated ADHD symptoms, Outcome 1 All parallel‐group trials and first‐period cross‐over trials.

Comparison 2 Independent assessor‐rated ADHD symptoms, Outcome 2 Subgroup analysis: types of scales.
Comparison 2 Independent assessor‐rated ADHD symptoms, Outcome 3 Subgroup analysis: duration of treatment.
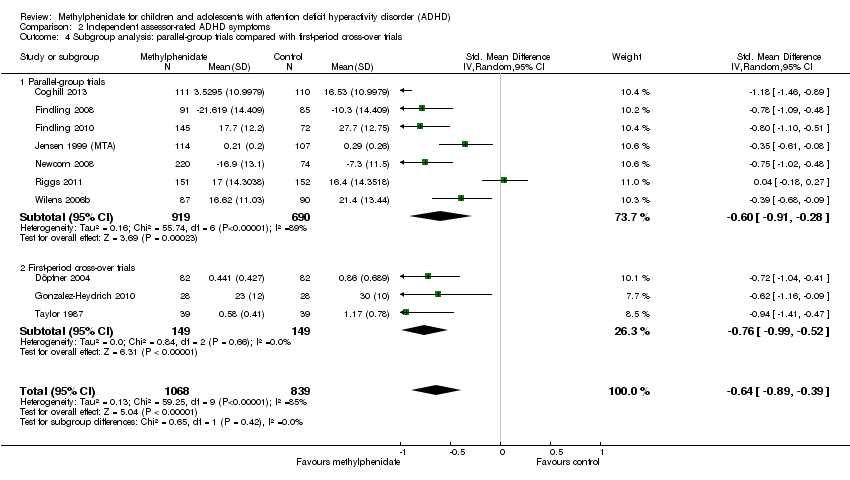
Comparison 2 Independent assessor‐rated ADHD symptoms, Outcome 4 Subgroup analysis: parallel‐group trials compared with first‐period cross‐over trials.
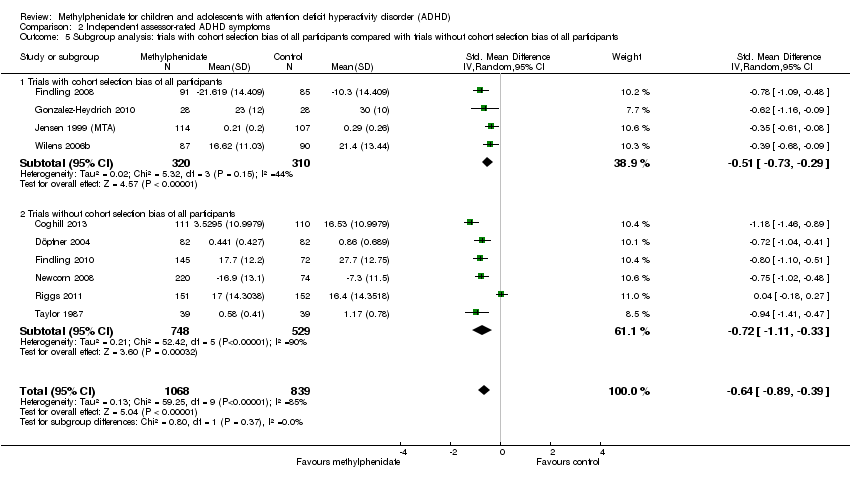
Comparison 2 Independent assessor‐rated ADHD symptoms, Outcome 5 Subgroup analysis: trials with cohort selection bias of all participants compared with trials without cohort selection bias of all participants.
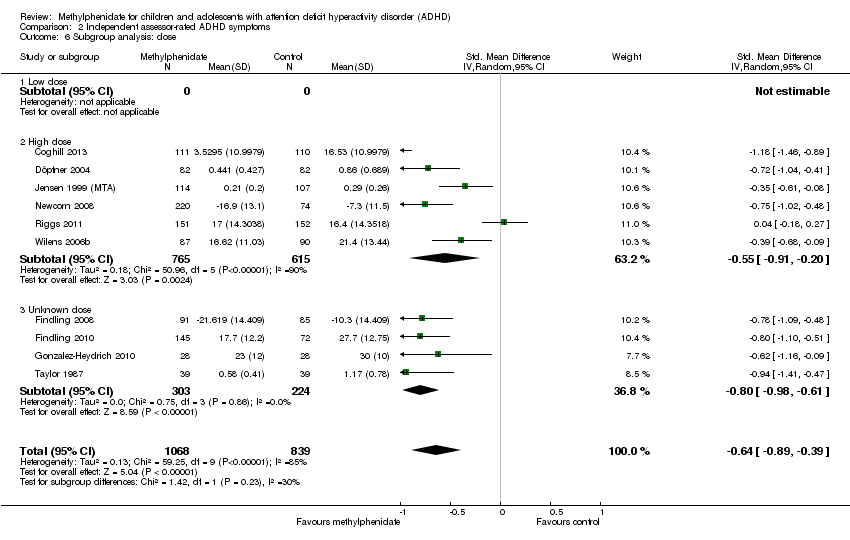
Comparison 2 Independent assessor‐rated ADHD symptoms, Outcome 6 Subgroup analysis: dose.

Comparison 2 Independent assessor‐rated ADHD symptoms, Outcome 7 ADHD symptoms, cross‐over trials (endpoint data), subgroup analysis: risk of bias.
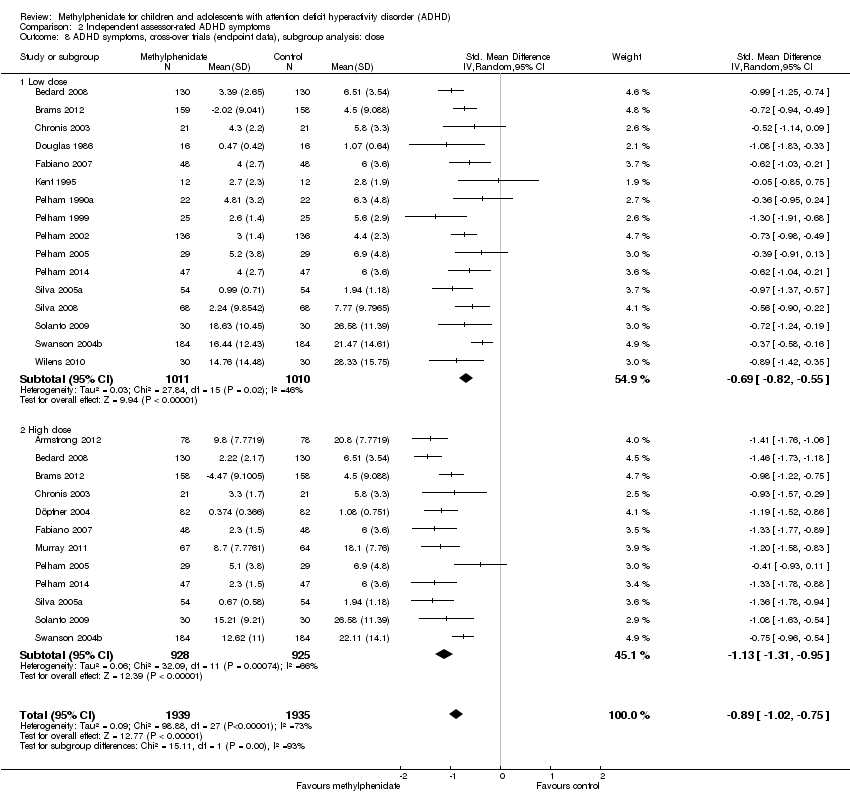
Comparison 2 Independent assessor‐rated ADHD symptoms, Outcome 8 ADHD symptoms, cross‐over trials (endpoint data), subgroup analysis: dose.
Comparison 2 Independent assessor‐rated ADHD symptoms, Outcome 9 Subgroup analysis: all parallel‐group trials and first‐period cross‐over trials compared with cross‐over trials (endpoint data).
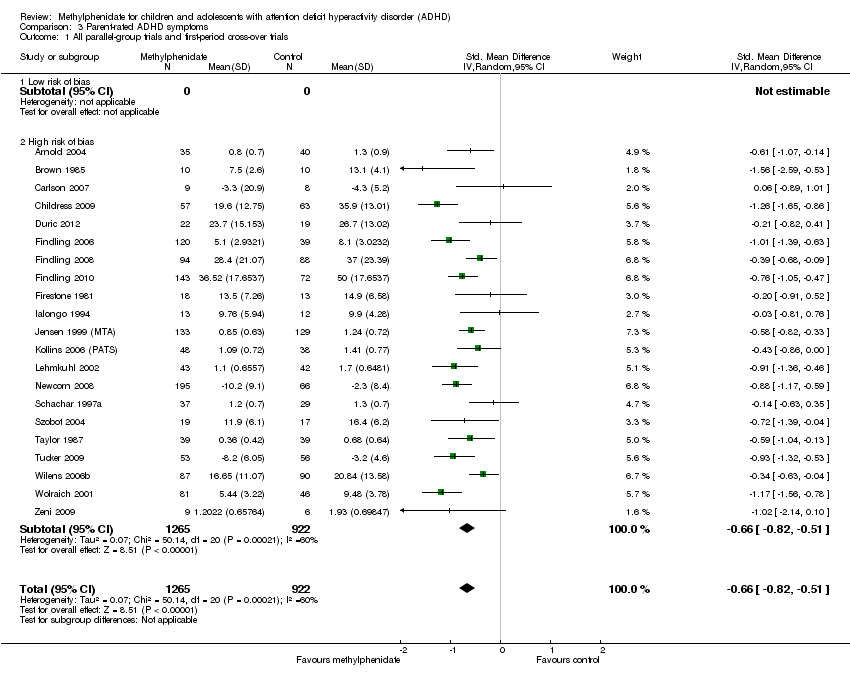
Comparison 3 Parent‐rated ADHD symptoms, Outcome 1 All parallel‐group trials and first‐period cross‐over trials.

Comparison 3 Parent‐rated ADHD symptoms, Outcome 2 Subgroup analysis: types of scales.

Comparison 3 Parent‐rated ADHD symptoms, Outcome 3 Subgroup analysis: duration of treatment.
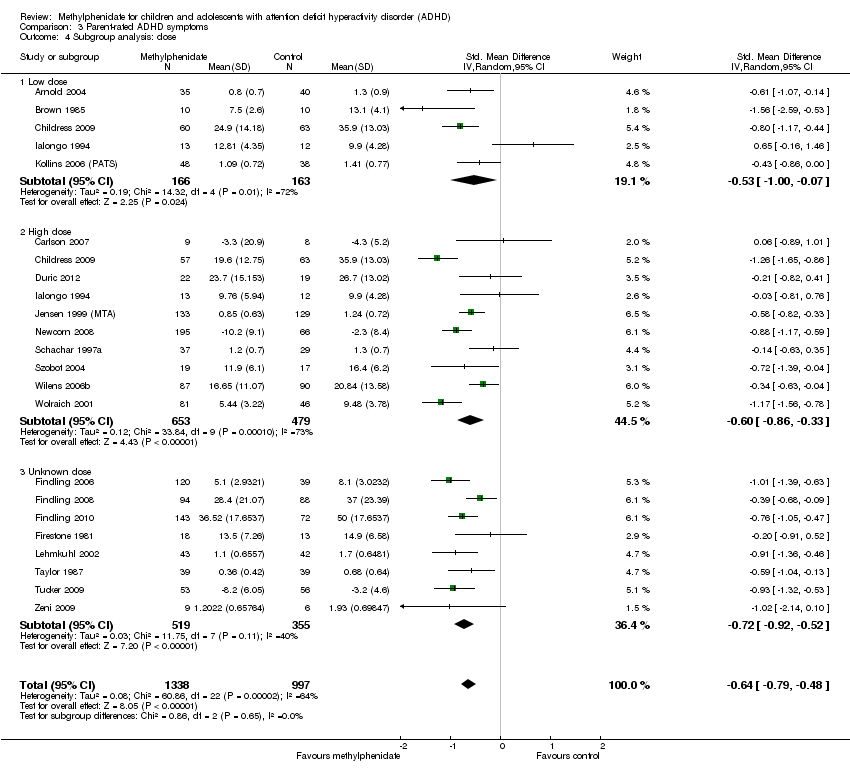
Comparison 3 Parent‐rated ADHD symptoms, Outcome 4 Subgroup analysis: dose.

Comparison 3 Parent‐rated ADHD symptoms, Outcome 5 Medication status: medication naive versus not medication naive.

Comparison 3 Parent‐rated ADHD symptoms, Outcome 6 Subgroup analysis: trials with cohort selection bias of all participants compared with trials without cohort selection bias of all participants.

Comparison 3 Parent‐rated ADHD symptoms, Outcome 7 Subgroup analysis: parallel‐group trials compared with first‐period cross‐over trials.

Comparison 3 Parent‐rated ADHD symptoms, Outcome 8 ADHD symptoms, cross‐over trials (endpoint data).
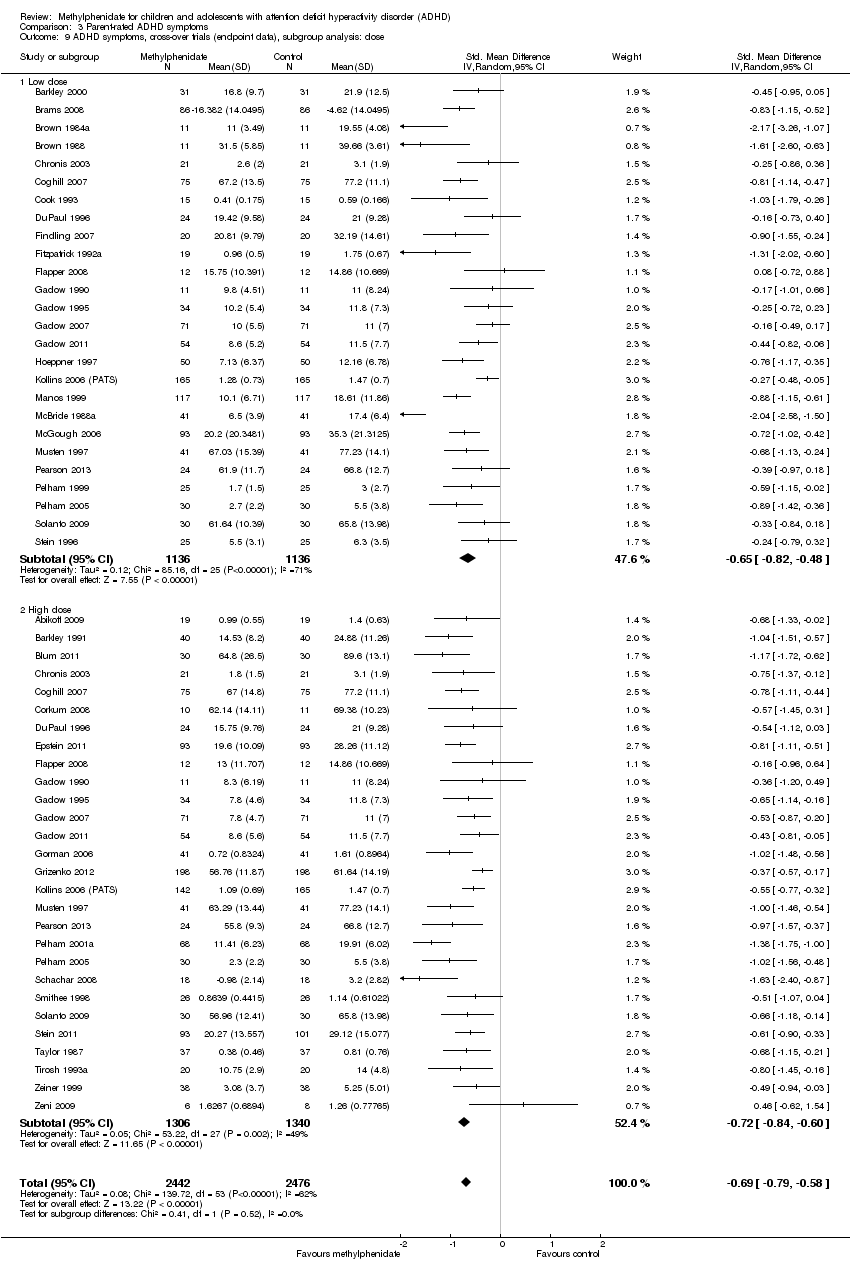
Comparison 3 Parent‐rated ADHD symptoms, Outcome 9 ADHD symptoms, cross‐over trials (endpoint data), subgroup analysis: dose.
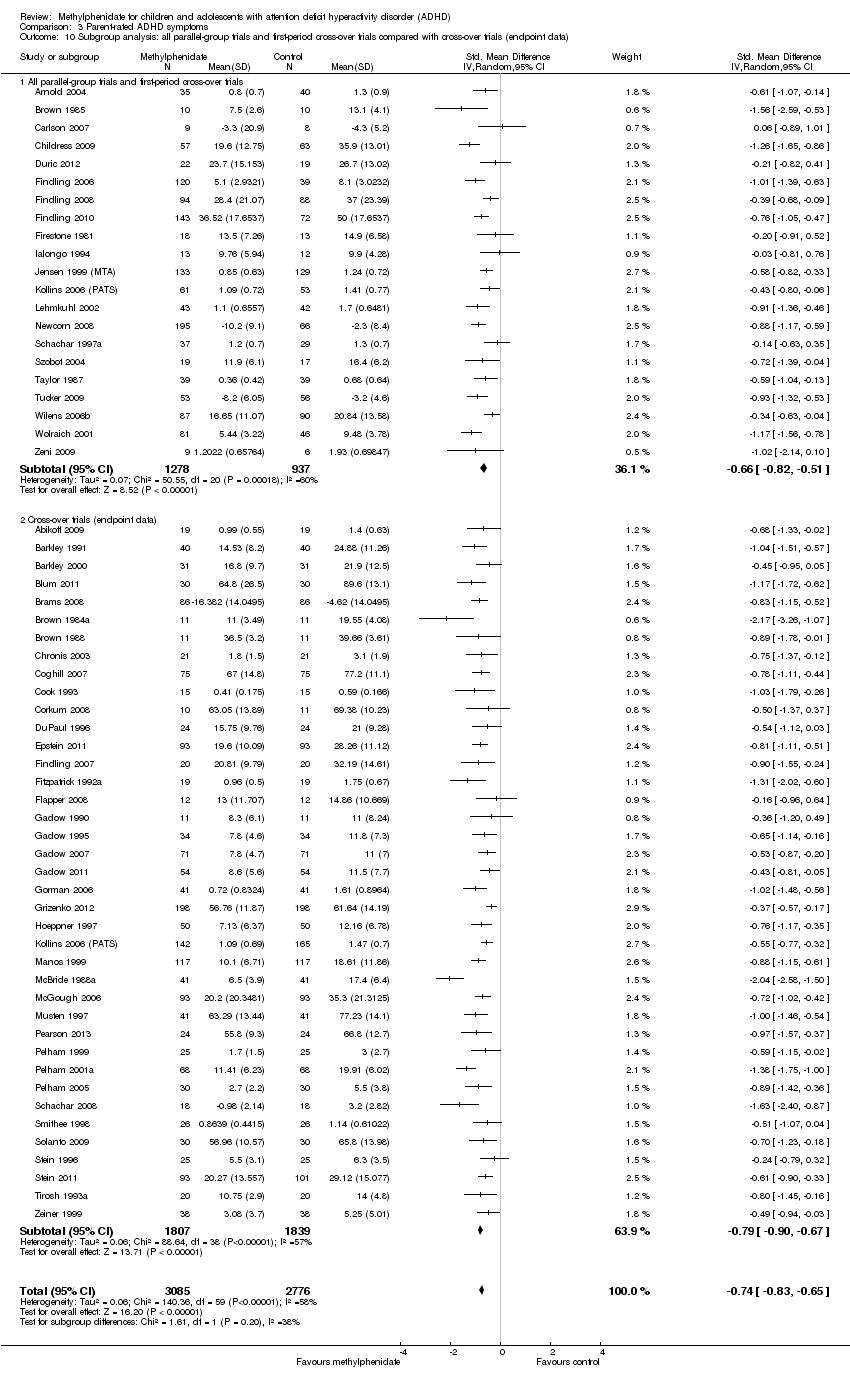
Comparison 3 Parent‐rated ADHD symptoms, Outcome 10 Subgroup analysis: all parallel‐group trials and first‐period cross‐over trials compared with cross‐over trials (endpoint data).

Comparison 4 Additional subgroup analyses of ADHD symptoms: parallel‐group trials and first‐period cross‐over trials, Outcome 1 Comparision of raters.

Comparison 4 Additional subgroup analyses of ADHD symptoms: parallel‐group trials and first‐period cross‐over trials, Outcome 2 Age.

Comparison 4 Additional subgroup analyses of ADHD symptoms: parallel‐group trials and first‐period cross‐over trials, Outcome 3 Comorbidity versus no comorbidity.
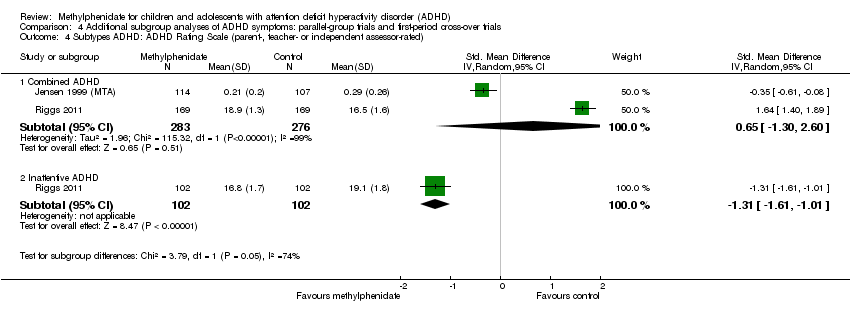
Comparison 4 Additional subgroup analyses of ADHD symptoms: parallel‐group trials and first‐period cross‐over trials, Outcome 4 Subtypes ADHD: ADHD Rating Scale (parent‐, teacher‐ or independent assessor‐rated).

Comparison 4 Additional subgroup analyses of ADHD symptoms: parallel‐group trials and first‐period cross‐over trials, Outcome 5 Cross‐over trials: first‐period data versus endpoint data (parent‐, independent assessor‐ and teacher‐rated).

Comparison 5 Number of serious adverse events: parallel‐group trials and first‐period cross‐over trials, Outcome 1 Number of serious adverse events (SAE).
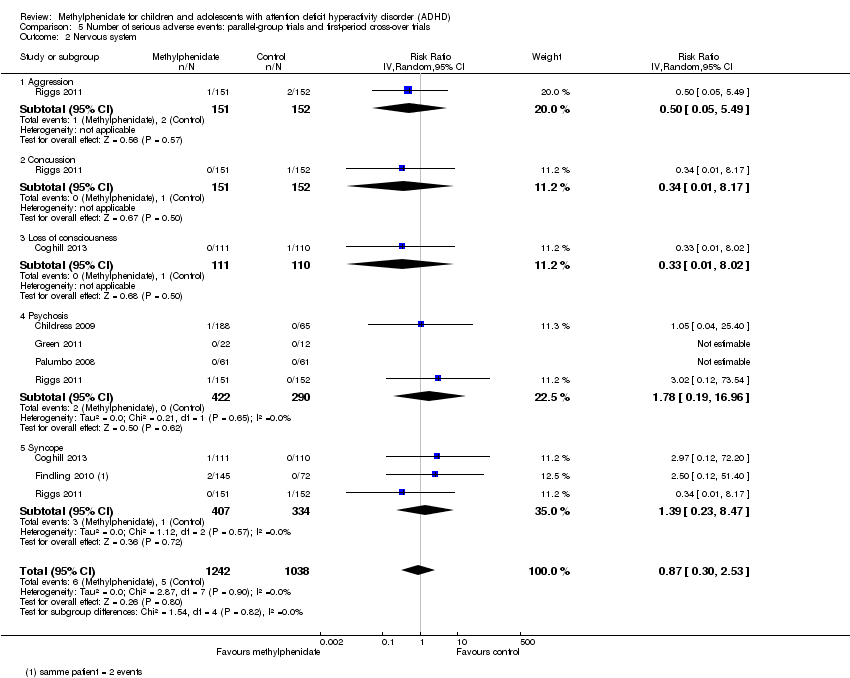
Comparison 5 Number of serious adverse events: parallel‐group trials and first‐period cross‐over trials, Outcome 2 Nervous system.

Comparison 5 Number of serious adverse events: parallel‐group trials and first‐period cross‐over trials, Outcome 3 Digestive system: gastrointestinal disorders.

Comparison 5 Number of serious adverse events: parallel‐group trials and first‐period cross‐over trials, Outcome 4 Urinary system: kidney infection.
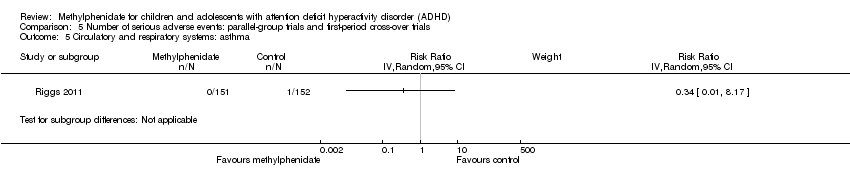
Comparison 5 Number of serious adverse events: parallel‐group trials and first‐period cross‐over trials, Outcome 5 Circulatory and respiratory systems: asthma.

Comparison 5 Number of serious adverse events: parallel‐group trials and first‐period cross‐over trials, Outcome 6 Immune system: cyst rupture.

Comparison 5 Number of serious adverse events: parallel‐group trials and first‐period cross‐over trials, Outcome 7 Other: drug toxicity.

Comparison 6 Number of serious adverse events: cross‐over trials (endpoint data), Outcome 1 Number of serious adverse events (SAE).

Comparison 6 Number of serious adverse events: cross‐over trials (endpoint data), Outcome 2 Hallucinations/psychosis.

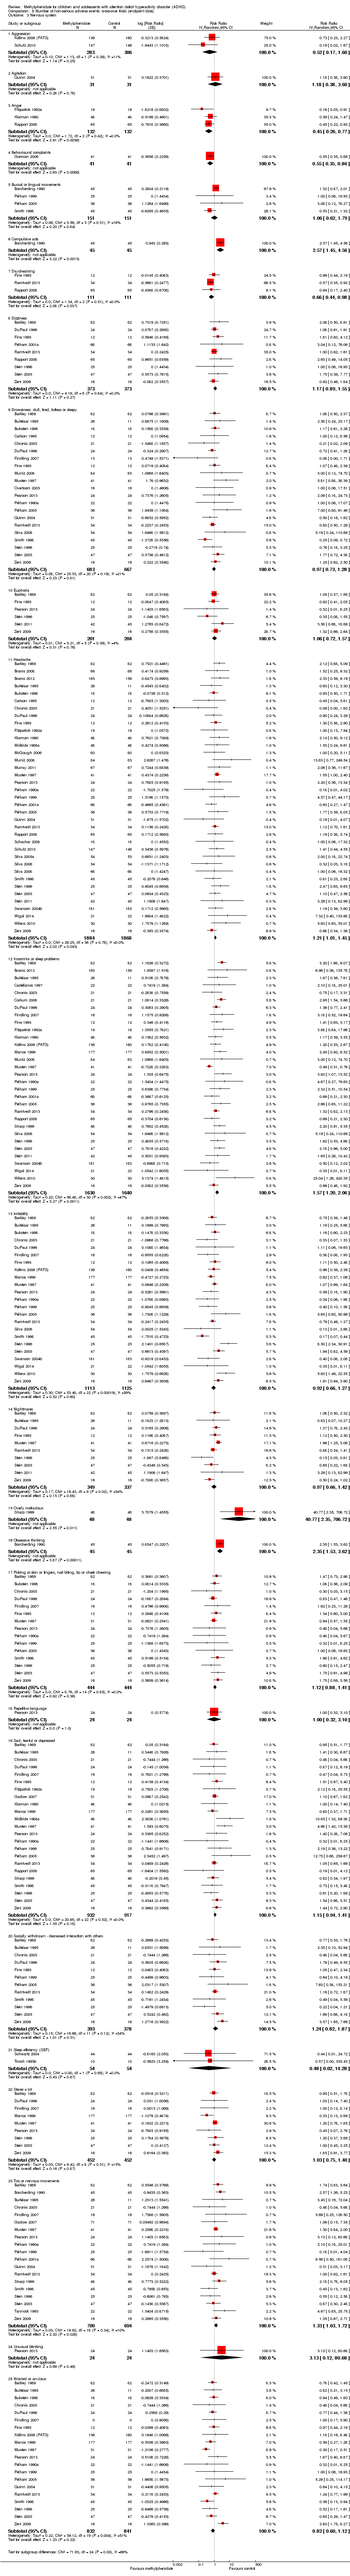
Comparison 7 Number of non‐serious adverse events: parallel‐group trials and first‐period cross‐over trials, Outcome 1 Total number of non‐serious adverse events.

Comparison 7 Number of non‐serious adverse events: parallel‐group trials and first‐period cross‐over trials, Outcome 2 Subgroup analysis: total number of non‐serious adverse events according to dose.
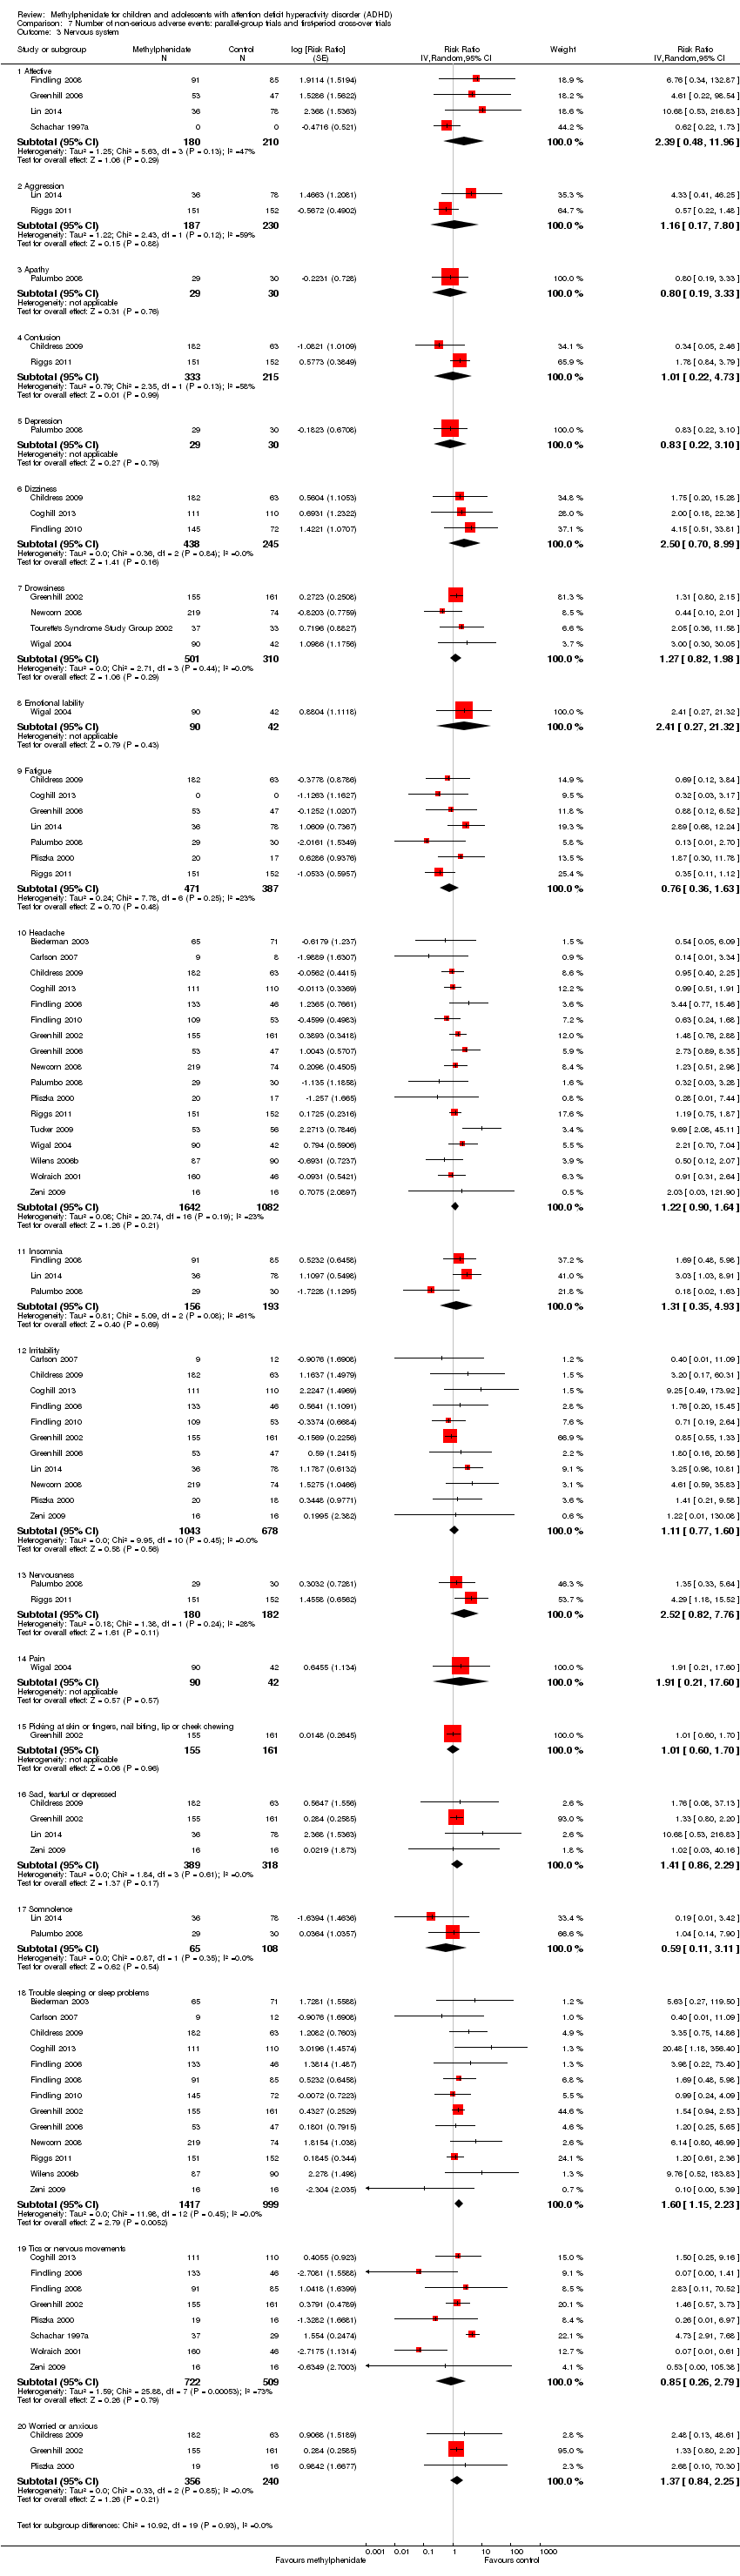
Comparison 7 Number of non‐serious adverse events: parallel‐group trials and first‐period cross‐over trials, Outcome 3 Nervous system.

Comparison 7 Number of non‐serious adverse events: parallel‐group trials and first‐period cross‐over trials, Outcome 4 Digestive system.

Comparison 7 Number of non‐serious adverse events: parallel‐group trials and first‐period cross‐over trials, Outcome 5 Circulatory and respiratory systems.
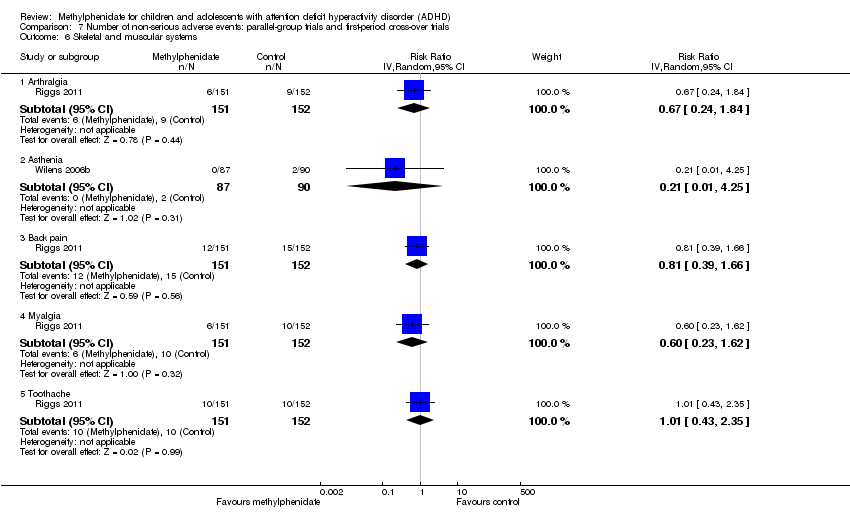
Comparison 7 Number of non‐serious adverse events: parallel‐group trials and first‐period cross‐over trials, Outcome 6 Skeletal and muscular systems.
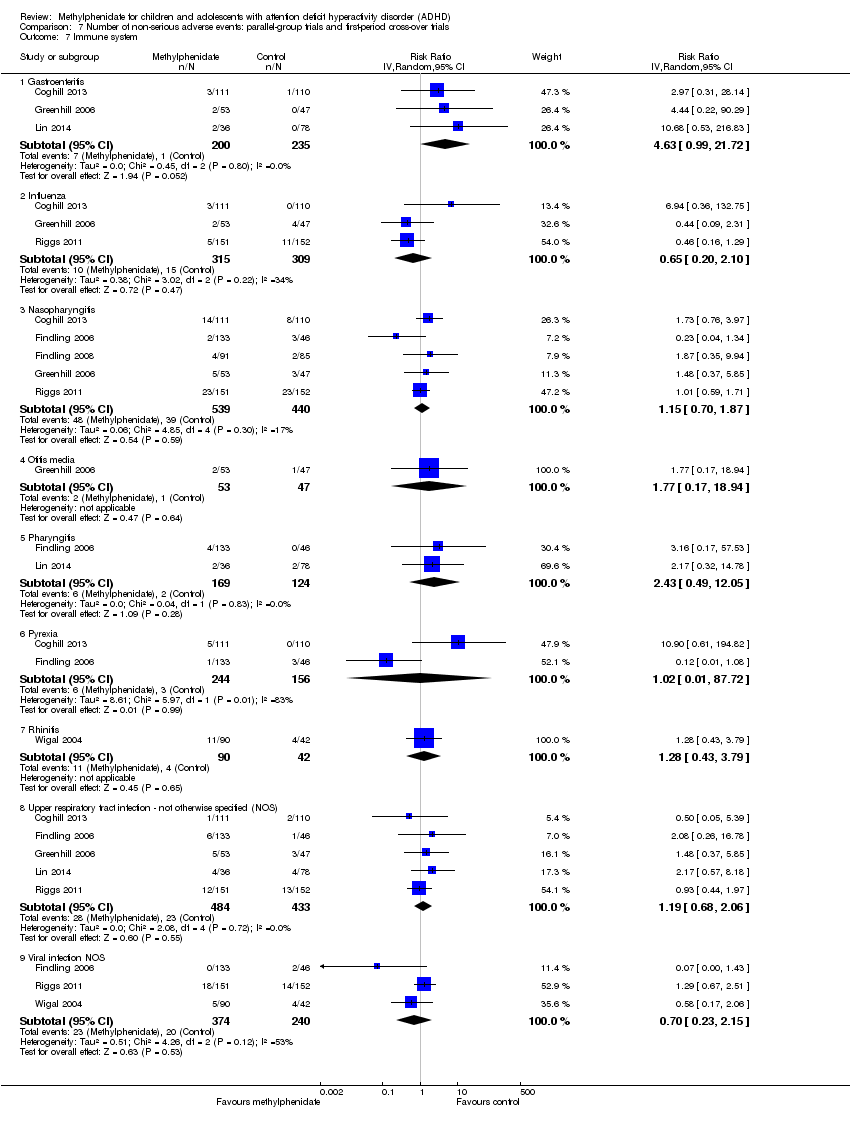
Comparison 7 Number of non‐serious adverse events: parallel‐group trials and first‐period cross‐over trials, Outcome 7 Immune system.
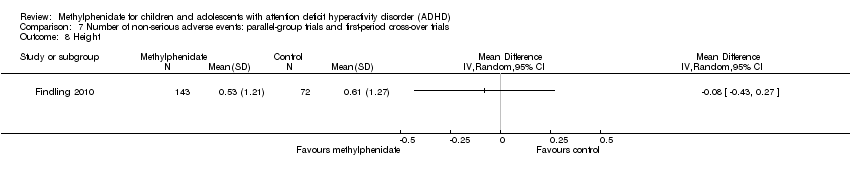
Comparison 7 Number of non‐serious adverse events: parallel‐group trials and first‐period cross‐over trials, Outcome 8 Height.

Comparison 7 Number of non‐serious adverse events: parallel‐group trials and first‐period cross‐over trials, Outcome 9 Weight.

Comparison 7 Number of non‐serious adverse events: parallel‐group trials and first‐period cross‐over trials, Outcome 10 BMI.

Comparison 7 Number of non‐serious adverse events: parallel‐group trials and first‐period cross‐over trials, Outcome 11 Vital signs.

Comparison 7 Number of non‐serious adverse events: parallel‐group trials and first‐period cross‐over trials, Outcome 12 Other.

Comparison 8 Number of non‐serious adverse events: cross‐over trials (endpoint data), Outcome 1 Total number of non‐serious adverse events.

Comparison 8 Number of non‐serious adverse events: cross‐over trials (endpoint data), Outcome 2 Subgroup analysis: total number of non‐serious adverse events according to dose.
Comparison 8 Number of non‐serious adverse events: cross‐over trials (endpoint data), Outcome 3 Nervous system.

Comparison 8 Number of non‐serious adverse events: cross‐over trials (endpoint data), Outcome 4 Digestive system.

Comparison 8 Number of non‐serious adverse events: cross‐over trials (endpoint data), Outcome 5 Urinary system: urinary incontinence.
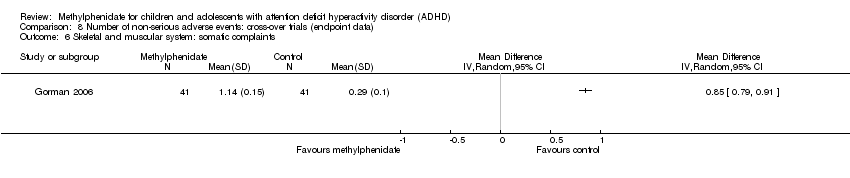
Comparison 8 Number of non‐serious adverse events: cross‐over trials (endpoint data), Outcome 6 Skeletal and muscular system: somatic complaints.

Comparison 8 Number of non‐serious adverse events: cross‐over trials (endpoint data), Outcome 7 Immune system.
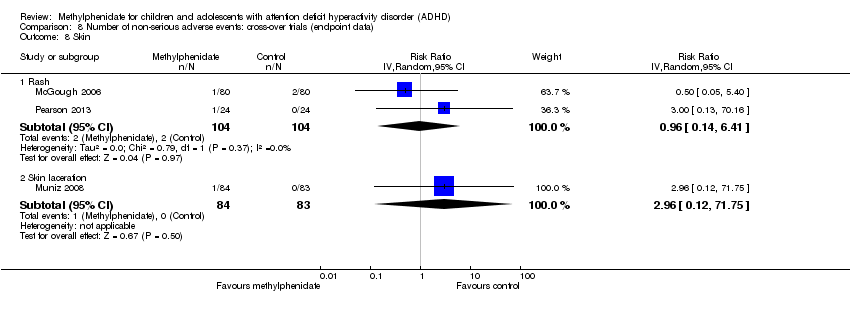
Comparison 8 Number of non‐serious adverse events: cross‐over trials (endpoint data), Outcome 8 Skin.

Comparison 8 Number of non‐serious adverse events: cross‐over trials (endpoint data), Outcome 9 Vital signs.
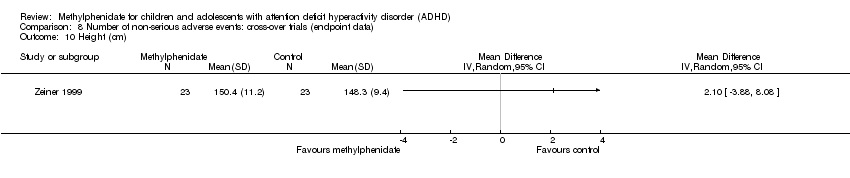
Comparison 8 Number of non‐serious adverse events: cross‐over trials (endpoint data), Outcome 10 Height (cm).

Comparison 8 Number of non‐serious adverse events: cross‐over trials (endpoint data), Outcome 11 Weight.

Comparison 9 Teacher‐rated general behaviour, Outcome 1 All parallel‐group trials and first‐period cross‐over trials: risk of bias.

Comparison 9 Teacher‐rated general behaviour, Outcome 2 Subgroup analysis: types of scales.

Comparison 9 Teacher‐rated general behaviour, Outcome 3 Subgroup analysis: dose.

Comparison 9 Teacher‐rated general behaviour, Outcome 4 Subgroup analysis: duration of treatment.
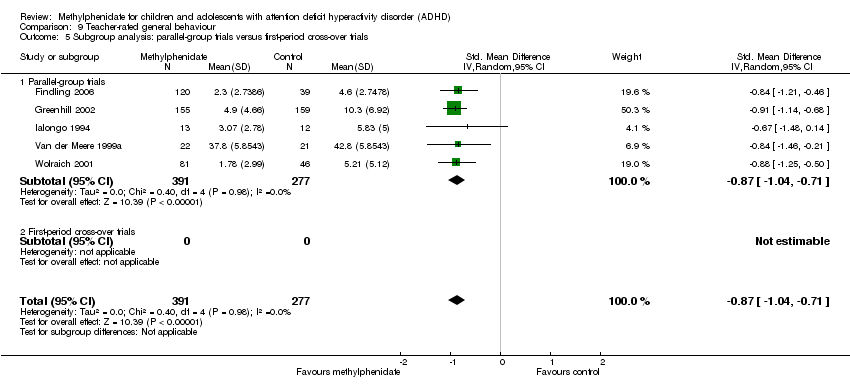
Comparison 9 Teacher‐rated general behaviour, Outcome 5 Subgroup analysis: parallel‐group trials versus first‐period cross‐over trials.

Comparison 9 Teacher‐rated general behaviour, Outcome 6 General behaviour, cross‐over trials (endpoint data).

Comparison 9 Teacher‐rated general behaviour, Outcome 7 Subgroup analysis: general behaviour, cross‐over trials (endpoint data): risk of bias.

Comparison 9 Teacher‐rated general behaviour, Outcome 8 Subgroup analysis: all parallel‐group trials and first‐period cross‐over trials (teacher‐rated) versus cross‐over trials (endpoint data).

Comparison 10 Independent assessor‐rated general behaviour, Outcome 1 General behaviour, cross‐over trials (endpoint data).
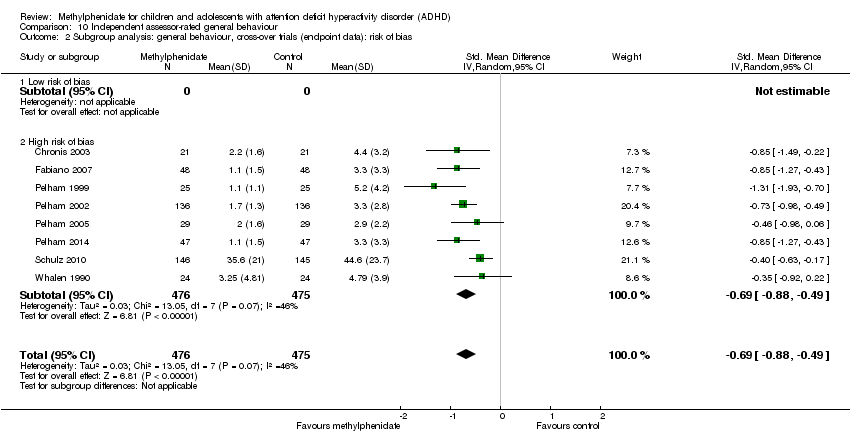
Comparison 10 Independent assessor‐rated general behaviour, Outcome 2 Subgroup analysis: general behaviour, cross‐over trials (endpoint data): risk of bias.
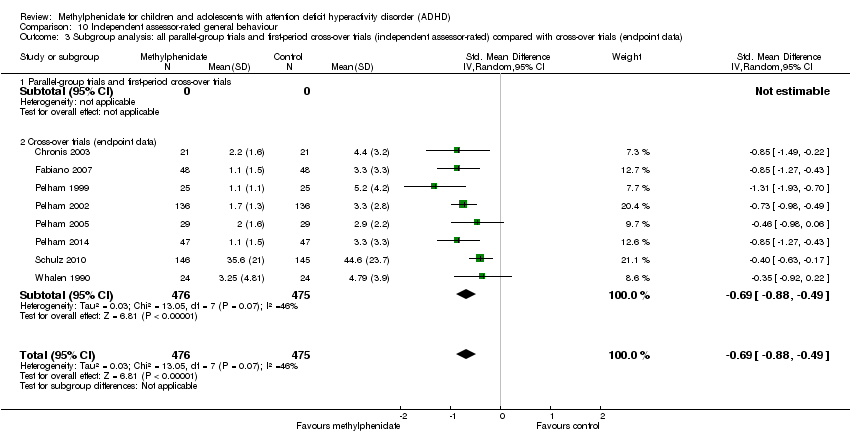
Comparison 10 Independent assessor‐rated general behaviour, Outcome 3 Subgroup analysis: all parallel‐group trials and first‐period cross‐over trials (independent assessor‐rated) compared with cross‐over trials (endpoint data).

Comparison 11 Parent‐rated general behaviour, Outcome 1 All parallel‐group trials and first‐period cross‐over trials.
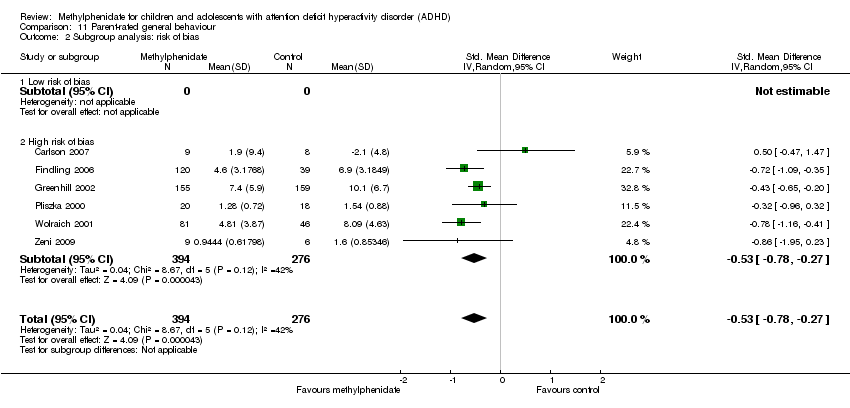
Comparison 11 Parent‐rated general behaviour, Outcome 2 Subgroup analysis: risk of bias.

Comparison 11 Parent‐rated general behaviour, Outcome 3 Subgroup analysis: types of scales.

Comparison 11 Parent‐rated general behaviour, Outcome 4 Subgroup analysis: parallel‐group trials compared with first‐period cross‐over trials.

Comparison 11 Parent‐rated general behaviour, Outcome 5 Subgroup analysis: duration of treatment.

Comparison 11 Parent‐rated general behaviour, Outcome 6 Subgroup analysis: dose.

Comparison 11 Parent‐rated general behaviour, Outcome 7 General behaviour, cross‐over trials (endpoint data).
Comparison 11 Parent‐rated general behaviour, Outcome 8 Subgroup analysis: general behaviour, cross‐over trials (endpoint data): risk of bias.

Comparison 11 Parent‐rated general behaviour, Outcome 9 Subgroup analysis: all parallel‐group trials and first‐period cross‐over trials (parent‐rated) compared with cross‐over trials (endpoint data).
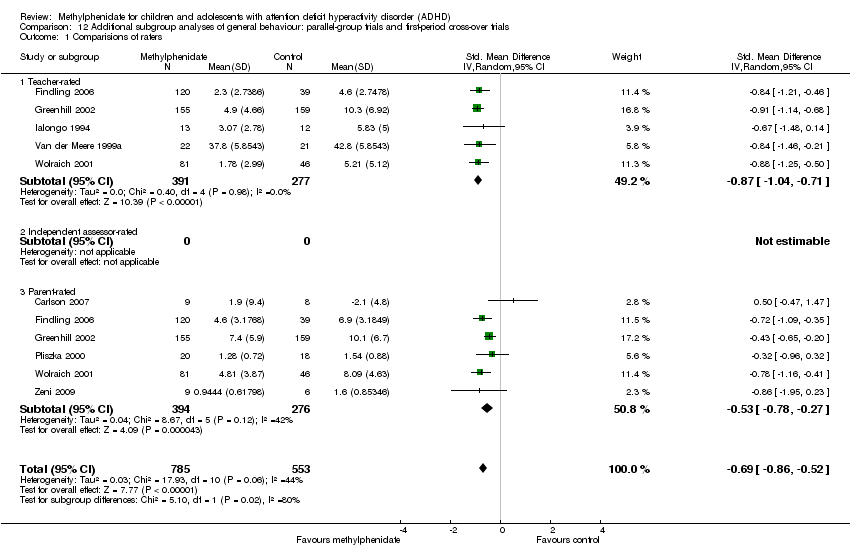
Comparison 12 Additional subgroup analyses of general behaviour: parallel‐group trials and first‐period cross‐over trials, Outcome 1 Comparisions of raters.

Comparison 12 Additional subgroup analyses of general behaviour: parallel‐group trials and first‐period cross‐over trials, Outcome 2 Comorbidity versus no comorbidity.

Comparison 12 Additional subgroup analyses of general behaviour: parallel‐group trials and first‐period cross‐over trials, Outcome 3 Cross‐over trials: first‐period data versus endpoint data (teacher‐, parent‐, and independent assessor‐rated).

Comparison 13 Quality of life: parallel‐group trials and first‐period cross‐over trials, Outcome 1 Subgroup analysis: types of scales.
| Methylphenidate compared with placebo or no intervention for ADHD | ||||||
| Patient or population: children and adolescents (up to and including 18 years of age) with ADHD | ||||||
| Outcomes | Illustrative comparative risks* (95% CI) | Relative effect | Number of participants | Quality of the evidence | Comments | |
| Assumed risk | Corresponding risk | |||||
| Placebo or no intervention | Methylphenidate | |||||
| ADHD symptoms: all parallel‐group trials and first‐period cross‐over trials Average study duration: 74.8 days | Mean ADHD symptom score in the intervention groups corresponds to a mean difference of 9.6 (95% CI 11.25 to 8.00) on ADHD Rating Scale | SMD ‐0.77 (‐0.90 to ‐0.64) | 1698 | ⊕⊝⊝⊝ | The analysis was conducted on a standardised scale with data from studies that used different teacher‐rated scales of symptoms (Conners' Teacher Rating Scale (CTRS), Strengths and Weaknesses of ADHD Symptoms and Normal Behaviour (SWAN) Scale, Schedule for Non‐adaptive and Adaptive Personality (SNAP) ‐ Teacher, Fremdbeurteilungsbogen für Hyperkinetische Störungen (FBB‐HKS)). The effect size has been translated on to the ADHD Rating Scale from the SMD | |
| Total number of serious adverse events | Trial population | RR 0.98 | 1532 | ⊕⊝⊝⊝ | ‐ | |
| 16 per 1000 | 16 per 1000 | |||||
| Total number of non‐serious adverse events | Trial population | RR 1.29 | 3132 | ⊕⊝⊝⊝ | ‐ | |
| 408 per 1000 | 526 per 1000 | |||||
| General behaviour: all parallel‐group trials and first‐period cross‐over trials | Mean general behaviour score in the intervention groups was 0.87 standard mean deviations lower (95% CI 1.04 to 0.71 lower) | SMD ‐0.87 (‐0.71 to ‐1.04) | 668 | ⊕⊝⊝⊝ | ‐ | |
| Quality of life (Parent‐rated) | Mean quality of life score in the intervention groups corresponds to a mean difference of 8.0 (95% CI 5.49 to 10.46) on the Child Health Questionnaire | SMD 0.61 | 514 | ⊕⊝⊝⊝ | ‐ | |
| *The basis for the assumed risk (e.g. median control group risk across studies) is provided in footnotes. The corresponding risk (and its 95% confidence interval) is based on the assumed risk in the comparison group and the relative effect of the intervention (and its 95% CI). | ||||||
| GRADE Working Group grades of evidence. | ||||||
| aDowngraded two levels due to high risk of bias (systematic errors causing overestimation of benefits and underestimation of harms) in several risk of bias domains, including lack of sufficient blinding and selective outcome reporting (many of the included trials did not report on this outcome). | ||||||
| Name of scale | Abbreviation | Reference |
| Abbreviated Conners’ Rating Scales, Parent (ACPRS) and Teacher (ACTRS), including Abbreviated Parent Rating Scale (APRS) and Teacher Rating Scale, Hyperkinesis Index and ADHD and Emotional Lability subscales | ACRS | |
| Abbreviated Symptom Questionnaire, including ASQ Teacher and ASQ Parent | ASQ | |
| Academic Performance Rating Scale | APRS | |
| The ADD/H Comprehensive Teacher Rating Scale | ACTeRS | |
| ADHD/ODD Rating Scale, Parent‐ and Teacher‐Rated | ADHD‐RS | |
| ADHD Rating Scale, including ADHD Rating Scale Parent and Teacher Ratings | ADHD‐RS | |
| ADHD Rating Scale‐IV, including ADHD Rating Scale‐IV Parent and Teacher Versions | ADHD‐RS‐IV | |
| Brief Psychiatric Rating Scale for Children | BPRS | |
| Child Attention Problems Rating Scale | CAP | |
| Child Attention Profile | CAP | |
| Child Behavior Rating Form | NCBHF | |
| Child Symptom Inventory | CSI | |
| Children’s Psychiatric Rating Scale | CPRS | |
| Conners’ Abbreviated Hyperactivity Questionnaire | C‐HI | |
| Conners’ Abbreviated Questionnaire | ASQ | |
| Conners’ Abbreviated Parent Teacher Questionnaire | APTQ | |
| Conners’ Abbreviated Rating Scale | ABRS | |
| Conners’ Abbreviated Symptom Questionnaire | ASQ | |
| Conners Abbreviated Symptom Questionnaire for Parents | ASQ‐Parent | |
| Conners’ Abbreviated Symptom Questionnaire for Teachers | ASQ‐Teacher | |
| Conners’ Abbreviated Teacher Rating Scale | ABTRS | |
| Conners’ ADHD/DSM‐IV Scales Adolescent | CADS‐A | |
| Conners’ ADHD/DSM‐IV Scales Parent | CADS–P, CADS‐P DSM‐IV | |
| Conners’ ADHD/DSM‐IV Scale Teacher, including Inattentive and Hyperactive‐Impulsive subscales | CADS‐T, CADS‐T DSM‐IV | |
| Conners’ Rating Scale ‐ Revised, Parent and Teacher: Hyperactivity and Conduct Factors score | CPRS‐R and CTRS‐R | |
| Conners’ Hyperactivity Index, Parent and Teacher, including abbreviated versions | CPRS/CTRS‐Hyperactivity index | |
| Conners’ Hyperkinesis Index | ‐ | |
| Conners, Loney and Milich Scale | CLAM | |
| Conners’ Parent and Teacher Rating Scale ‐ Revised, Short Form | CRS‐R:S | |
| Conners’ Parent Rating Scale, including abbreviated versions | CPRS | |
| Conners’ Parent Rating Scale ‐ Revised | CPRS‐R | |
| Conners’ Parent Rating Scale ‐ Revised, Short Form | CPRS‐R:S | |
| Conners’ Parent Rating Scale ‐ Revised, Long Version | CPRS‐R:L | |
| Conners’ Rating Scale ‐ Revised | CRS‐R | |
| Conners’ Short Form Rating Scale, Parent and Teacher | ‐ | |
| Conners’ Teacher Rating Scale | CTRS | |
| Conners’ Teacher Rating Scale ‐ Revised, Long Version | CTRS‐R:L | |
| Diagnostic and Statistical Manual of Mental Disorders Total | DSM‐IV | |
| Diagnostiksystem für Psychische Störungen im Kindes ‐ und Jugendalter nach ICD‐10 und DSM‐IV, Parental Questionnaire of ADHD symptoms | DISYPS | |
| Fremdbeurteilungsbogen für Hyperkinetische Störungen | FBB‐HKS | |
| German Teacher’s report on ADHD symptoms | FBB‐HKS of the DISYPS | |
| Hyperactivity Index of the Revised Conners Parent and Teacher Rating Scales | ‐ | |
| IOWA Conners Parent Rating Scale, including abbreviated versions | IOWA CPRS | |
| IOWA Conners Teacher Rating Scale, including abbreviated versions | IOWA CTRS | |
| IOWA Conners Teacher Rating Scale, Inattention/Overactivity (I/O) and Oppositional/Defiant (O/D) subscales | IOWA‐I/O and O/D subscales | |
| IOWA Inattention/Overactivity and Aggression/Noncompliance scales ‐ Parent and Teacher rating | IOWA | |
| Lehrer‐Fragenbogen von Steinhausen | LF | |
| Loney’s Time on Task Scale, Hyperactivity, Attention and Aggression subscales | TOTS | |
| Modified Conner Scale Parent and Teacher | ACR | |
| Mothers’ Objective Method for Subgrouping | MOMS | |
| Parent Symptom Checklist | PSC ADHD | |
| Parental Account of Children’s Symptoms | PACS | |
| Restricted Academic Situation Scale | RASS | |
| Schedule for Affective Disorders and Schizophrenia | K‐SADS/ K‐SADS‐E for diagnosis | |
| Schedule for Non‐adaptive and Adaptive Personality | SNAP | |
| Swanson, Nolan, and Pelham ‐ IV SNAP‐ADHD Rating scale | SNAP‐ADHD | |
| Swanson, Nolan, and Pelham ‐ IV SNAP‐IV (Brazilian Version) | SNAP‐IV | |
| Swanson, Kotkin, Atkins, M‐Flynn, Pelham Scale (SKAMP combined, SKAMP attention, and SKAMP deportment) | SKAMP (SKAMP combined, SKAMP attention, and SKAMP deportment) | |
| Teacher Self‐control Rating Scale | SCRS | |
| Turgay ‐ DSM‐IV Scale, Parent | T‐DSM‐IV Scale, Parent | |
| Turgay ‐ DSM‐IV Scale, Teacher | T‐DSM‐IV Scale, Teacher | |
| Teacher Hyperactivity Index | THI | |
| Teacher Symptom Checklist | TSC | |
| Vanderbilt ADHD Rating Scale | VADP(T)RS | |
| Wender Utah Rating Scale | WURS | |
| Wide Range Achievement Test | WRAT‐4 | |
| Wide Range Achievement Test Revised | WRAT‐R | |
| ADD/H: Attention deficit disorder with hyperactivity. | ||
| Name of scale | Abbreviation | Reference |
| Achenbach Child Behaviour Checklist | CBCL | |
| Achenbach’s Teacher Report | ATRF | |
| ADHD Rating Scale | ADHD‐RS | |
| ADHD School Observation Code | ADHD‐SOC | |
| Barkley Scales, Disruptive Behavior Disorders Rating Scale | ‐ | |
| Child Attention Problems Scale | CAP | |
| Child Attention Profile | CAP | |
| Child Behavior Checklist | CBCL | |
| Child Health Questionnaire | CHQ | |
| Child and Adolescent Psychiatric Assessment, selected items | CAPA | |
| Children’s Psychiatric Rating Scale | CPRS | |
| Classroom Observation Code (Abikoff Classroom Observational System) | COC | |
| Code for Observing Social Activity | COSA | |
| Conners' Child Behavior Scale | UC‐CCBS | |
| Conners' Global Index Scale | CGI‐S | |
| Conners’ Global Index ‐ Parent | CGI‐P | |
| Conners' Global Index ‐ Teacher | CGI‐T | |
| Conners', Loney and Milich Scale | CLAM | |
| Conners’ Parent Questionnaire | CPQ | |
| Conners’ Parent Rating Scale | CPRS | |
| Conners’ Teacher Rating Scale | CTRS | |
| Conners’ Teacher Rating Conduct Problems | ‐ | |
| Disruptive Behavior Disorders Rating Scale, Parent‐ and Teacher‐Rated | DBS | |
| Disruptive Behavior Disorders Rating Scale | DBD | |
| Groninger Behaviour Observation Scale | GOO and GBO | |
| Groninger Behaviour Checklists, Parent and Teacher Versions of the abbreviated Groninger | GGGS and GGBS | |
| Hillside Behavior Rating Scale | HBRS | |
| Home Situations Questionnaire | HSQ | |
| Home Situations Questionnaire ‐ Revised | HSQ‐R | |
| Humphrey’s Teacher Self‐Control Rating Scale | TSCRS | |
| Hyperactivity Index from the Conners Revised Teacher Rating Scale | CTRS‐R‐Hyperactivity Index | |
| Impairment Rating Scale | IRS | |
| Inpatient Global Rating Scale, Revised | IGRS | |
| Inpatient Global Rating Scale, Somatic factor | IGRS‐S | |
| IOWA Conners' Rating Scale, Oppositional/Defiant (O/D) subscales | IOWA‐O/D subscales | |
| Nisonger Child Behavior Rating Form | NCBRF | |
| Paired Associates Learning | PAL | |
| Parent Global Assessment for Improvement | PGA | |
| Peer Conflict Scale | PCS | |
| Personality Inventory for Children | PIC | |
| School Situations Questionnaire | SSQ | |
| School Situations Questionnaire ‐ Revised | SSQ‐R | |
| Schedule for Nonadaptive and Adaptive Personality | SNAP | |
| Strengths and Weaknesses of ADHD Symptoms and Normal Behavior Scale, Parent and Teacher | SWAN | |
| Subjective Treatment Emergent Symptom Scale | STESS‐R | |
| Swanson, Nolan and Pelham, Fourth Edition | SNAP‐IV | |
| Teachers Report Form | TRF | |
| Telephone Interview Probe (Parent and Teacher) | TIP | |
| Vanderbilt ADHD rating scales: Vanderbilt ADHD Diagnostic Parent Rating Scale and Vanderbilt ADHD Diagnostic Teacher Rating Scale | VADPRS and VADTRS | |
| Wahler, House and Stambaugh’s Ecobehavioral Assessment System | ECO | |
| The Weekly Parent Ratings of Evening and Morning Behaviour | WREMB‐R | |
| Werry‐Weiss‐Peters Activity Rating Scale | WWP | |
| Woodcock‐Johnson Achievement Battery | WJ‐III Ach | |
| ADHD: attention deficit hyperactivity disorder. | ||
| Name of scale | Abbreviation | Reference |
| ADHD Impact Module‐Child | AIM‐C | |
| Child Impact Scale and Home Impact Scale | CIS/HIS | |
| Child Health and Illness Profile, Child Edition: Parent Report Form | CHIP‐CE:PRF | |
| Child Health Questionnaire | CHQ‐P | |
| Children's Global Assessment Scale | CGAS | |
| Comprehensive Psychopathological Rating Scale | CPRS | |
| Health Utilities Index ‐ 2 | HUI‐2 | |
| ADHD: attention deficit hyperactivity disorder. | ||
| Outcome or subgroup title | No. of studies | No. of participants | Statistical method | Effect size |
| 1 All parallel‐group trials and first‐period cross‐over trials Show forest plot | 19 | 1698 | Std. Mean Difference (IV, Random, 95% CI) | ‐0.77 [‐0.90, ‐0.64] |
| 1.1 Low risk of bias | 0 | 0 | Std. Mean Difference (IV, Random, 95% CI) | 0.0 [0.0, 0.0] |
| 1.2 High risk of bias | 19 | 1698 | Std. Mean Difference (IV, Random, 95% CI) | ‐0.77 [‐0.90, ‐0.64] |
| 2 Subgroup analysis: types of scales Show forest plot | 19 | Std. Mean Difference (IV, Random, 95% CI) | Subtotals only | |
| 2.1 Conners' Teacher Rating Scale (CTRS) | 8 | 518 | Std. Mean Difference (IV, Random, 95% CI) | ‐0.64 [‐0.82, ‐0.47] |
| 2.2 Abbreviated Conners' Rating Scale (ACRS) ‐ Teacher | 2 | 105 | Std. Mean Difference (IV, Random, 95% CI) | ‐0.75 [‐1.79, 0.29] |
| 2.3 Conners' Abbreviated Symptom Questionnaire for Teachers (ASQ‐Teacher) | 1 | 59 | Std. Mean Difference (IV, Random, 95% CI) | ‐0.28 [‐0.79, 0.23] |
| 2.4 IOWA Conners' Teacher Rating Scale (IOWA CTRS) ‐ hyperactivity | 2 | 193 | Std. Mean Difference (IV, Random, 95% CI) | ‐1.08 [‐1.39, ‐0.77] |
| 2.5 Schedule for Non‐adaptive and Adaptive Personality (SNAP) ‐ Teacher | 2 | 328 | Std. Mean Difference (IV, Random, 95% CI) | ‐0.61 [‐0.96, ‐0.25] |
| 2.6 Teacher ratings of attention | 1 | 20 | Std. Mean Difference (IV, Random, 95% CI) | ‐0.55 [‐1.45, 0.35] |
| 2.7 Teacher ratings of impulsivity | 1 | 20 | Std. Mean Difference (IV, Random, 95% CI) | 0.04 [‐0.83, 0.92] |
| 2.8 IOWA Conners' Teacher Rating Scale ‐ Inattention/Overactivity (IOWA‐I/O) | 2 | 197 | Std. Mean Difference (IV, Random, 95% CI) | ‐1.03 [‐1.36, ‐0.69] |
| 2.9 Fremdbeurteilungsbogen für Hyperkinetische Störungen (FBB‐HKS) | 1 | 85 | Std. Mean Difference (IV, Random, 95% CI) | ‐1.06 [‐1.52, ‐0.61] |
| 2.10 Conners’ ADHD/DSM‐IV Scales ‐ Teacher (CADS‐T) | 2 | 254 | Std. Mean Difference (IV, Random, 95% CI) | ‐1.05 [‐1.31, ‐0.78] |
| 2.11 Strengths and Weaknesses of ADHD Symptoms and Normal Behaviour (SWAN) Scale | 1 | 64 | Std. Mean Difference (IV, Random, 95% CI) | ‐0.33 [‐0.82, 0.17] |
| 3 Medication status: medication naive versus not medication naive Show forest plot | 6 | 717 | Std. Mean Difference (IV, Random, 95% CI) | ‐0.79 [‐1.08, ‐0.50] |
| 3.1 Medication naive | 4 | 431 | Std. Mean Difference (IV, Random, 95% CI) | ‐0.63 [‐0.94, ‐0.31] |
| 3.2 Not medication naive | 2 | 286 | Std. Mean Difference (IV, Random, 95% CI) | ‐1.06 [‐1.33, ‐0.79] |
| 4 Subgroup analysis: duration of treatment Show forest plot | 19 | 1698 | Std. Mean Difference (IV, Random, 95% CI) | ‐0.77 [‐0.90, ‐0.64] |
| 4.1 Short term (up to 6 months) | 18 | 1445 | Std. Mean Difference (IV, Random, 95% CI) | ‐0.81 [‐0.94, ‐0.68] |
| 4.2 Long term (over 6 months) | 1 | 253 | Std. Mean Difference (IV, Random, 95% CI) | ‐0.47 [‐0.72, ‐0.22] |
| 5 Subgroup analysis: dose Show forest plot | 19 | Std. Mean Difference (IV, Random, 95% CI) | Subtotals only | |
| 5.1 Low dose | 8 | 493 | Std. Mean Difference (IV, Random, 95% CI) | ‐0.64 [‐0.82, ‐0.46] |
| 5.2 High dose | 7 | 688 | Std. Mean Difference (IV, Random, 95% CI) | ‐0.81 [‐1.08, ‐0.54] |
| 5.3 Unknown dose | 6 | 669 | Std. Mean Difference (IV, Random, 95% CI) | ‐0.87 [‐1.06, ‐0.68] |
| 6 Subgroup analysis: parallel‐group trials compared with first‐period cross‐over trials Show forest plot | 19 | 1698 | Std. Mean Difference (IV, Random, 95% CI) | ‐0.77 [‐0.90, ‐0.64] |
| 6.1 Parallel‐group trials | 17 | 1506 | Std. Mean Difference (IV, Random, 95% CI) | ‐0.80 [‐0.95, ‐0.65] |
| 6.2 First‐period cross‐over trials | 2 | 192 | Std. Mean Difference (IV, Random, 95% CI) | ‐0.58 [‐0.87, ‐0.29] |
| 7 Subgroup analysis: trials with cohort selection bias of all participants compared with trials without cohort selection bias of all participants Show forest plot | 19 | 1698 | Std. Mean Difference (IV, Random, 95% CI) | ‐0.77 [‐0.90, ‐0.64] |
| 7.1 Trials with cohort selection bias of all participants | 7 | 994 | Std. Mean Difference (IV, Random, 95% CI) | ‐0.79 [‐1.01, ‐0.57] |
| 7.2 Trials without cohort selection bias of all participants | 12 | 704 | Std. Mean Difference (IV, Random, 95% CI) | ‐0.76 [‐0.93, ‐0.59] |
| 8 ADHD symptoms, cross‐over trial (endpoint data) Show forest plot | 59 | 5145 | Std. Mean Difference (IV, Random, 95% CI) | ‐0.93 [‐1.06, ‐0.80] |
| 8.1 Low risk of bias | 4 | 204 | Std. Mean Difference (IV, Random, 95% CI) | ‐0.64 [‐0.97, ‐0.30] |
| 8.2 High risk of bias | 55 | 4941 | Std. Mean Difference (IV, Random, 95% CI) | ‐0.95 [‐1.09, ‐0.82] |
| 9 ADHD symptoms, cross‐over trials (endpoint data), subgroup analysis: dose Show forest plot | 59 | 6821 | Std. Mean Difference (IV, Random, 95% CI) | ‐0.85 [‐0.96, ‐0.74] |
| 9.1 Low dose | 42 | 3408 | Std. Mean Difference (IV, Random, 95% CI) | ‐0.73 [‐0.89, ‐0.57] |
| 9.2 High dose | 36 | 3413 | Std. Mean Difference (IV, Random, 95% CI) | ‐0.98 [‐1.13, ‐0.84] |
| 10 Subgroup analysis: all parallel‐group trials and first‐period cross‐over trials compared with cross‐over trials (endpoint data) Show forest plot | 75 | 6344 | Std. Mean Difference (IV, Random, 95% CI) | ‐0.91 [‐1.01, ‐0.80] |
| 10.1 All parallel‐group trials and first‐period cross‐over trials | 19 | 1698 | Std. Mean Difference (IV, Random, 95% CI) | ‐0.77 [‐0.90, ‐0.64] |
| 10.2 Cross‐over trials (endpoint data) | 56 | 4646 | Std. Mean Difference (IV, Random, 95% CI) | ‐0.95 [‐1.09, ‐0.82] |
| 11 All parallel‐group trials and cross‐over trials: risk of bias Show forest plot | 75 | 6344 | Std. Mean Difference (IV, Random, 95% CI) | ‐0.91 [‐1.01, ‐0.80] |
| 11.1 Low risk of bias | 4 | 204 | Std. Mean Difference (IV, Random, 95% CI) | ‐0.64 [‐0.97, ‐0.30] |
| 11.2 High risk of bias | 71 | 6140 | Std. Mean Difference (IV, Random, 95% CI) | ‐0.92 [‐1.03, ‐0.81] |
| Outcome or subgroup title | No. of studies | No. of participants | Statistical method | Effect size |
| 1 All parallel‐group trials and first‐period cross‐over trials Show forest plot | 10 | 1907 | Std. Mean Difference (IV, Random, 95% CI) | ‐0.64 [‐0.89, ‐0.39] |
| 1.1 Low risk of bias | 0 | 0 | Std. Mean Difference (IV, Random, 95% CI) | 0.0 [0.0, 0.0] |
| 1.2 High risk of bias | 10 | 1907 | Std. Mean Difference (IV, Random, 95% CI) | ‐0.64 [‐0.89, ‐0.39] |
| 2 Subgroup analysis: types of scales Show forest plot | 10 | Std. Mean Difference (IV, Random, 95% CI) | Subtotals only | |
| 2.1 Swanson, Kotkin, Agler, M‐Glynn and Pelham (SKAMP) Scale | 1 | 164 | Std. Mean Difference (IV, Random, 95% CI) | ‐0.72 [‐1.04, ‐0.41] |
| 2.2 ADHD Rating Scale (ADHD‐RS ) | 7 | 1442 | Std. Mean Difference (IV, Random, 95% CI) | ‐0.71 [‐1.09, ‐0.32] |
| 2.3 Swanson, Nolan and Pelham (SNAP) Scale | 1 | 221 | Std. Mean Difference (IV, Random, 95% CI) | ‐0.35 [‐0.61, ‐0.08] |
| 2.4 Unknown | 1 | 78 | Std. Mean Difference (IV, Random, 95% CI) | ‐0.94 [‐1.41, ‐0.47] |
| 3 Subgroup analysis: duration of treatment Show forest plot | 10 | 1907 | Std. Mean Difference (IV, Random, 95% CI) | ‐0.64 [‐0.89, ‐0.39] |
| 3.1 Short term (up to 6 months) | 9 | 1686 | Std. Mean Difference (IV, Random, 95% CI) | ‐0.68 [‐0.95, ‐0.40] |
| 3.2 Long term (over 6 months) | 1 | 221 | Std. Mean Difference (IV, Random, 95% CI) | ‐0.35 [‐0.61, ‐0.08] |
| 4 Subgroup analysis: parallel‐group trials compared with first‐period cross‐over trials Show forest plot | 10 | 1907 | Std. Mean Difference (IV, Random, 95% CI) | ‐0.64 [‐0.89, ‐0.39] |
| 4.1 Parallel‐group trials | 7 | 1609 | Std. Mean Difference (IV, Random, 95% CI) | ‐0.60 [‐0.91, ‐0.28] |
| 4.2 First‐period cross‐over trials | 3 | 298 | Std. Mean Difference (IV, Random, 95% CI) | ‐0.76 [‐0.99, ‐0.52] |
| 5 Subgroup analysis: trials with cohort selection bias of all participants compared with trials without cohort selection bias of all participants Show forest plot | 10 | 1907 | Std. Mean Difference (IV, Random, 95% CI) | ‐0.64 [‐0.89, ‐0.39] |
| 5.1 Trials with cohort selection bias of all participants | 4 | 630 | Std. Mean Difference (IV, Random, 95% CI) | ‐0.51 [‐0.73, ‐0.29] |
| 5.2 Trials without cohort selection bias of all participants | 6 | 1277 | Std. Mean Difference (IV, Random, 95% CI) | ‐0.72 [‐1.11, ‐0.33] |
| 6 Subgroup analysis: dose Show forest plot | 10 | 1907 | Std. Mean Difference (IV, Random, 95% CI) | ‐0.64 [‐0.89, ‐0.39] |
| 6.1 Low dose | 0 | 0 | Std. Mean Difference (IV, Random, 95% CI) | 0.0 [0.0, 0.0] |
| 6.2 High dose | 6 | 1380 | Std. Mean Difference (IV, Random, 95% CI) | ‐0.55 [‐0.91, ‐0.20] |
| 6.3 Unknown dose | 4 | 527 | Std. Mean Difference (IV, Random, 95% CI) | ‐0.80 [‐0.98, ‐0.61] |
| 7 ADHD symptoms, cross‐over trials (endpoint data), subgroup analysis: risk of bias Show forest plot | 19 | 2471 | Std. Mean Difference (IV, Random, 95% CI) | 1.00 [‐1.16, ‐0.84] |
| 7.1 Low risk of bias | 0 | 0 | Std. Mean Difference (IV, Random, 95% CI) | 0.0 [0.0, 0.0] |
| 7.2 High risk of bias | 19 | 2471 | Std. Mean Difference (IV, Random, 95% CI) | 1.00 [‐1.16, ‐0.84] |
| 8 ADHD symptoms, cross‐over trials (endpoint data), subgroup analysis: dose Show forest plot | 19 | 3874 | Std. Mean Difference (IV, Random, 95% CI) | ‐0.89 [‐1.02, ‐0.75] |
| 8.1 Low dose | 16 | 2021 | Std. Mean Difference (IV, Random, 95% CI) | ‐0.69 [‐0.82, ‐0.55] |
| 8.2 High dose | 12 | 1853 | Std. Mean Difference (IV, Random, 95% CI) | ‐1.13 [‐1.31, ‐0.95] |
| 9 Subgroup analysis: all parallel‐group trials and first‐period cross‐over trials compared with cross‐over trials (endpoint data) Show forest plot | 28 | 4215 | Std. Mean Difference (IV, Random, 95% CI) | ‐0.83 [‐0.98, ‐0.67] |
| 9.1 All parallel‐group trials and first‐period cross‐over trials | 10 | 1907 | Std. Mean Difference (IV, Random, 95% CI) | ‐0.64 [‐0.89, ‐0.39] |
| 9.2 Cross‐over trials (endpoint data) | 18 | 2308 | Std. Mean Difference (IV, Random, 95% CI) | ‐0.95 [‐1.13, ‐0.77] |
| Outcome or subgroup title | No. of studies | No. of participants | Statistical method | Effect size |
| 1 All parallel‐group trials and first‐period cross‐over trials Show forest plot | 21 | 2187 | Std. Mean Difference (IV, Random, 95% CI) | ‐0.66 [‐0.82, ‐0.51] |
| 1.1 Low risk of bias | 0 | 0 | Std. Mean Difference (IV, Random, 95% CI) | 0.0 [0.0, 0.0] |
| 1.2 High risk of bias | 21 | 2187 | Std. Mean Difference (IV, Random, 95% CI) | ‐0.66 [‐0.82, ‐0.51] |
| 2 Subgroup analysis: types of scales Show forest plot | 21 | Std. Mean Difference (IV, Random, 95% CI) | Subtotals only | |
| 2.1 Conners' Parent Rating Scale (CPRS) | 7 | 751 | Std. Mean Difference (IV, Random, 95% CI) | ‐0.58 [‐0.87, ‐0.30] |
| 2.2 ADHD Rating Scale ‐ Fourth Edition (ADHD‐RS‐IV) | 2 | 194 | Std. Mean Difference (IV, Random, 95% CI) | ‐0.30 [‐0.58, ‐0.02] |
| 2.3 Fremdbeurteilungsbogen für Hyperkinetische Störungen (FBB‐HKS) | 1 | 85 | Std. Mean Difference (IV, Random, 95% CI) | ‐0.91 [‐1.36, ‐0.46] |
| 2.4 Conners’ ADHD/DSM‐IV Scales ‐ Parent (CADS‐P) | 1 | 120 | Std. Mean Difference (IV, Random, 95% CI) | ‐1.26 [‐1.65, ‐0.86] |
| 2.5 CADS‐P Inattentive subscale | 1 | 109 | Std. Mean Difference (IV, Random, 95% CI) | ‐0.78 [‐1.17, ‐0.39] |
| 2.6 CADS‐P Hyperactivity subscale | 1 | 109 | Std. Mean Difference (IV, Random, 95% CI) | ‐0.93 [‐1.32, ‐0.53] |
| 2.7 Clinican's Manual for the Assesment of Disruptive Behavior Disorders Rating Scale for Parents (Barkley) | 1 | 41 | Std. Mean Difference (IV, Random, 95% CI) | ‐0.21 [‐0.82, 0.41] |
| 2.8 Abbreviated Conners' Rating Scale (ACRS) ‐ Parent | 2 | 121 | Std. Mean Difference (IV, Random, 95% CI) | ‐0.62 [‐0.99, ‐0.25] |
| 2.9 Swanson, Nolan, and Pelham, Fourth Edition ‐ Parent (SNAP‐IV‐Parent) Scale | 4 | 430 | Std. Mean Difference (IV, Random, 95% CI) | ‐0.60 [‐0.79, ‐0.40] |
| 2.10 Strengths and Weaknesses of ADHD Symptoms and Normal Behavior (SWAN) Scale | 1 | 86 | Std. Mean Difference (IV, Random, 95% CI) | ‐0.43 [‐0.86, 0.00] |
| 2.11 IOWA Conners' Rating Scale ‐ Inattention/Overactivity (IOWA‐I/O) | 3 | 352 | Std. Mean Difference (IV, Random, 95% CI) | ‐0.78 [‐1.35, ‐0.21] |
| 3 Subgroup analysis: duration of treatment Show forest plot | 21 | 2187 | Std. Mean Difference (IV, Random, 95% CI) | ‐0.66 [‐0.82, ‐0.51] |
| 3.1 Short term (up to 6 months) | 20 | 1925 | Std. Mean Difference (IV, Random, 95% CI) | ‐0.67 [‐0.84, ‐0.50] |
| 3.2 Long term (over 6 months) | 1 | 262 | Std. Mean Difference (IV, Random, 95% CI) | ‐0.58 [‐0.82, ‐0.33] |
| 4 Subgroup analysis: dose Show forest plot | 21 | 2335 | Std. Mean Difference (IV, Random, 95% CI) | ‐0.64 [‐0.79, ‐0.48] |
| 4.1 Low dose | 5 | 329 | Std. Mean Difference (IV, Random, 95% CI) | ‐0.53 [1.00, ‐0.07] |
| 4.2 High dose | 10 | 1132 | Std. Mean Difference (IV, Random, 95% CI) | ‐0.60 [‐0.86, ‐0.33] |
| 4.3 Unknown dose | 8 | 874 | Std. Mean Difference (IV, Random, 95% CI) | ‐0.72 [‐0.92, ‐0.52] |
| 5 Medication status: medication naive versus not medication naive Show forest plot | 7 | 795 | Std. Mean Difference (IV, Random, 95% CI) | ‐0.76 [‐1.05, ‐0.48] |
| 5.1 Medication naive | 4 | 492 | Std. Mean Difference (IV, Random, 95% CI) | ‐0.69 [‐1.03, ‐0.35] |
| 5.2 Not medication naive | 3 | 303 | Std. Mean Difference (IV, Random, 95% CI) | ‐0.88 [‐1.33, ‐0.42] |
| 6 Subgroup analysis: trials with cohort selection bias of all participants compared with trials without cohort selection bias of all participants Show forest plot | 21 | 2187 | Std. Mean Difference (IV, Random, 95% CI) | ‐0.66 [‐0.82, ‐0.51] |
| 6.1 Trials with selection bias of all participants | 10 | 1559 | Std. Mean Difference (IV, Random, 95% CI) | ‐0.68 [‐0.86, ‐0.51] |
| 6.2 Trials without cohort selection bias of all participants | 11 | 628 | Std. Mean Difference (IV, Random, 95% CI) | ‐0.62 [‐0.90, ‐0.33] |
| 7 Subgroup analysis: parallel‐group trials compared with first‐period cross‐over trials Show forest plot | 21 | 2187 | Std. Mean Difference (IV, Random, 95% CI) | ‐0.66 [‐0.82, ‐0.51] |
| 7.1 Parallel‐group trials | 19 | 2094 | Std. Mean Difference (IV, Random, 95% CI) | ‐0.66 [‐0.83, ‐0.50] |
| 7.2 First‐period cross‐over trials | 2 | 93 | Std. Mean Difference (IV, Random, 95% CI) | ‐0.65 [‐1.07, ‐0.23] |
| 8 ADHD symptoms, cross‐over trials (endpoint data) Show forest plot | 41 | 3734 | Std. Mean Difference (IV, Random, 95% CI) | ‐0.78 [‐0.90, ‐0.67] |
| 8.1 Low risk of bias | 4 | 204 | Std. Mean Difference (IV, Random, 95% CI) | ‐0.54 [‐0.96, ‐0.13] |
| 8.2 High risk of bias | 37 | 3530 | Std. Mean Difference (IV, Random, 95% CI) | ‐0.81 [‐0.92, ‐0.69] |
| 9 ADHD symptoms, cross‐over trials (endpoint data), subgroup analysis: dose Show forest plot | 41 | 4918 | Std. Mean Difference (IV, Random, 95% CI) | ‐0.69 [‐0.79, ‐0.58] |
| 9.1 Low dose | 26 | 2272 | Std. Mean Difference (IV, Random, 95% CI) | ‐0.65 [‐0.82, ‐0.48] |
| 9.2 High dose | 28 | 2646 | Std. Mean Difference (IV, Random, 95% CI) | ‐0.72 [‐0.84, ‐0.60] |
| 10 Subgroup analysis: all parallel‐group trials and first‐period cross‐over trials compared with cross‐over trials (endpoint data) Show forest plot | 59 | 5861 | Std. Mean Difference (IV, Random, 95% CI) | ‐0.74 [‐0.83, ‐0.65] |
| 10.1 All parallel‐group trials and first‐period cross‐over trials | 21 | 2215 | Std. Mean Difference (IV, Random, 95% CI) | ‐0.66 [‐0.82, ‐0.51] |
| 10.2 Cross‐over trials (endpoint data) | 39 | 3646 | Std. Mean Difference (IV, Random, 95% CI) | ‐0.79 [‐0.90, ‐0.67] |
| Outcome or subgroup title | No. of studies | No. of participants | Statistical method | Effect size |
| 1 Comparision of raters Show forest plot | 31 | 5697 | Std. Mean Difference (IV, Random, 95% CI) | ‐0.69 [‐0.79, ‐0.59] |
| 1.1 Teacher‐rated | 19 | 1689 | Std. Mean Difference (IV, Random, 95% CI) | ‐0.78 [‐0.93, ‐0.63] |
| 1.2 Independent assessor‐rated | 9 | 1829 | Std. Mean Difference (IV, Random, 95% CI) | ‐0.61 [‐0.87, ‐0.35] |
| 1.3 Parent‐rated | 21 | 2179 | Std. Mean Difference (IV, Random, 95% CI) | ‐0.65 [‐0.81, ‐0.50] |
| 2 Age Show forest plot | 6 | 1039 | Std. Mean Difference (IV, Random, 95% CI) | ‐0.44 [‐0.74, ‐0.14] |
| 2.1 2 to 6 years | 1 | 64 | Std. Mean Difference (IV, Random, 95% CI) | ‐0.33 [‐0.82, 0.17] |
| 2.2 7 to 11 years | 2 | 278 | Std. Mean Difference (IV, Random, 95% CI) | ‐0.59 [‐1.03, ‐0.15] |
| 2.3 12 to 18 years | 3 | 697 | Std. Mean Difference (IV, Random, 95% CI) | ‐0.38 [‐0.88, 0.12] |
| 3 Comorbidity versus no comorbidity Show forest plot | 20 | 2310 | Std. Mean Difference (IV, Random, 95% CI) | ‐0.72 [‐0.91, ‐0.53] |
| 3.1 ADHD with comorbidity | 18 | 1981 | Std. Mean Difference (IV, Random, 95% CI) | ‐0.72 [‐0.94, ‐0.51] |
| 3.2 ADHD without comorbidity | 2 | 329 | Std. Mean Difference (IV, Random, 95% CI) | ‐0.69 [‐0.92, ‐0.46] |
| 4 Subtypes ADHD: ADHD Rating Scale (parent‐, teacher‐ or independent assessor‐rated) Show forest plot | 2 | Std. Mean Difference (IV, Random, 95% CI) | Subtotals only | |
| 4.1 Combined ADHD | 2 | 559 | Std. Mean Difference (IV, Random, 95% CI) | 0.65 [‐1.30, 2.60] |
| 4.2 Inattentive ADHD | 1 | 204 | Std. Mean Difference (IV, Random, 95% CI) | ‐1.31 [‐1.61, ‐1.01] |
| 5 Cross‐over trials: first‐period data versus endpoint data (parent‐, independent assessor‐ and teacher‐rated) Show forest plot | 4 | Std. Mean Difference (IV, Random, 95% CI) | Subtotals only | |
| 5.1 First‐period data | 4 | 372 | Std. Mean Difference (IV, Random, 95% CI) | ‐0.64 [‐0.85, ‐0.44] |
| 5.2 Endpoint data | 4 | 372 | Std. Mean Difference (IV, Random, 95% CI) | ‐0.91 [‐1.18, ‐0.65] |
| Outcome or subgroup title | No. of studies | No. of participants | Statistical method | Effect size |
| 1 Number of serious adverse events (SAE) Show forest plot | 9 | 1532 | Risk Ratio (IV, Random, 95% CI) | 0.98 [0.44, 2.22] |
| 2 Nervous system Show forest plot | 6 | 2280 | Risk Ratio (IV, Random, 95% CI) | 0.87 [0.30, 2.53] |
| 2.1 Aggression | 1 | 303 | Risk Ratio (IV, Random, 95% CI) | 0.50 [0.05, 5.49] |
| 2.2 Concussion | 1 | 303 | Risk Ratio (IV, Random, 95% CI) | 0.34 [0.01, 8.17] |
| 2.3 Loss of consciousness | 1 | 221 | Risk Ratio (IV, Random, 95% CI) | 0.33 [0.01, 8.02] |
| 2.4 Psychosis | 4 | 712 | Risk Ratio (IV, Random, 95% CI) | 1.78 [0.19, 16.96] |
| 2.5 Syncope | 3 | 741 | Risk Ratio (IV, Random, 95% CI) | 1.39 [0.23, 8.47] |
| 3 Digestive system: gastrointestinal disorders Show forest plot | 1 | Risk Ratio (IV, Random, 95% CI) | Subtotals only | |
| 4 Urinary system: kidney infection Show forest plot | 1 | Risk Ratio (IV, Random, 95% CI) | Subtotals only | |
| 5 Circulatory and respiratory systems: asthma Show forest plot | 1 | Risk Ratio (IV, Random, 95% CI) | Subtotals only | |
| 6 Immune system: cyst rupture Show forest plot | 1 | Risk Ratio (IV, Random, 95% CI) | Subtotals only | |
| 7 Other: drug toxicity Show forest plot | 1 | 303 | Risk Ratio (IV, Random, 95% CI) | 0.34 [0.01, 8.17] |
| Outcome or subgroup title | No. of studies | No. of participants | Statistical method | Effect size |
| 1 Number of serious adverse events (SAE) Show forest plot | 8 | 1721 | Risk Ratio (IV, Random, 95% CI) | 1.62 [0.34, 7.71] |
| 2 Hallucinations/psychosis Show forest plot | 4 | 187 | Risk Ratio (IV, Random, 95% CI) | 1.10 [0.18, 6.72] |
| Outcome or subgroup title | No. of studies | No. of participants | Statistical method | Effect size |
| 1 Total number of non‐serious adverse events Show forest plot | 21 | 3132 | Risk Ratio (IV, Random, 95% CI) | 1.29 [1.10, 1.51] |
| 2 Subgroup analysis: total number of non‐serious adverse events according to dose Show forest plot | 21 | 3135 | Risk Ratio (IV, Random, 95% CI) | 1.28 [1.11, 1.49] |
| 2.1 Low dose | 2 | 151 | Risk Ratio (IV, Random, 95% CI) | 1.09 [0.82, 1.46] |
| 2.2 High dose | 10 | 1761 | Risk Ratio (IV, Random, 95% CI) | 1.22 [1.10, 1.35] |
| 2.3 Unknown dose | 10 | 1223 | Risk Ratio (IV, Random, 95% CI) | 1.37 [1.01, 1.87] |
| 3 Nervous system Show forest plot | 21 | Risk Ratio (Random, 95% CI) | Subtotals only | |
| 3.1 Affective | 4 | 390 | Risk Ratio (Random, 95% CI) | 2.39 [0.48, 11.96] |
| 3.2 Aggression | 2 | 417 | Risk Ratio (Random, 95% CI) | 1.16 [0.17, 7.80] |
| 3.3 Apathy | 1 | 59 | Risk Ratio (Random, 95% CI) | 0.80 [0.19, 3.33] |
| 3.4 Confusion | 2 | 548 | Risk Ratio (Random, 95% CI) | 1.01 [0.22, 4.73] |
| 3.5 Depression | 1 | 59 | Risk Ratio (Random, 95% CI) | 0.83 [0.22, 3.10] |
| 3.6 Dizziness | 3 | 683 | Risk Ratio (Random, 95% CI) | 2.50 [0.70, 8.99] |
| 3.7 Drowsiness | 4 | 811 | Risk Ratio (Random, 95% CI) | 1.27 [0.82, 1.98] |
| 3.8 Emotional lability | 1 | 132 | Risk Ratio (Random, 95% CI) | 2.41 [0.27, 21.32] |
| 3.9 Fatigue | 7 | 858 | Risk Ratio (Random, 95% CI) | 0.76 [0.36, 1.63] |
| 3.10 Headache | 17 | 2724 | Risk Ratio (Random, 95% CI) | 1.22 [0.90, 1.64] |
| 3.11 Insomnia | 3 | 349 | Risk Ratio (Random, 95% CI) | 1.31 [0.35, 4.93] |
| 3.12 Irritability | 11 | 1721 | Risk Ratio (Random, 95% CI) | 1.11 [0.77, 1.60] |
| 3.13 Nervousness | 2 | 362 | Risk Ratio (Random, 95% CI) | 2.52 [0.82, 7.76] |
| 3.14 Pain | 1 | 132 | Risk Ratio (Random, 95% CI) | 1.91 [0.21, 17.60] |
| 3.15 Picking at skin or fingers, nail biting, lip or cheek chewing | 1 | 316 | Risk Ratio (Random, 95% CI) | 1.01 [0.60, 1.70] |
| 3.16 Sad, tearful or depressed | 4 | 707 | Risk Ratio (Random, 95% CI) | 1.41 [0.86, 2.29] |
| 3.17 Somnolence | 2 | 173 | Risk Ratio (Random, 95% CI) | 0.59 [0.11, 3.11] |
| 3.18 Trouble sleeping or sleep problems | 13 | 2416 | Risk Ratio (Random, 95% CI) | 1.60 [1.15, 2.23] |
| 3.19 Tics or nervous movements | 8 | 1231 | Risk Ratio (Random, 95% CI) | 0.85 [0.26, 2.79] |
| 3.20 Worried or anxious | 3 | 596 | Risk Ratio (Random, 95% CI) | 1.37 [0.84, 2.25] |
| 4 Digestive system Show forest plot | 18 | Risk Ratio (IV, Random, 95% CI) | Subtotals only | |
| 4.1 Decreased appetite | 16 | 2962 | Risk Ratio (IV, Random, 95% CI) | 3.66 [2.56, 5.23] |
| 4.2 Decreased weight | 6 | 859 | Risk Ratio (IV, Random, 95% CI) | 3.89 [1.43, 10.59] |
| 4.3 Diarrhoea | 5 | 857 | Risk Ratio (IV, Random, 95% CI) | 1.07 [0.41, 2.74] |
| 4.4 Dyspepsia | 2 | 159 | Risk Ratio (IV, Random, 95% CI) | 1.80 [0.71, 4.54] |
| 4.5 Increased appetite | 1 | 179 | Risk Ratio (IV, Random, 95% CI) | 0.07 [0.00, 1.43] |
| 4.6 Nausea | 11 | 1995 | Risk Ratio (IV, Random, 95% CI) | 1.30 [0.85, 1.99] |
| 4.7 Stomachache | 13 | 2341 | Risk Ratio (IV, Random, 95% CI) | 1.30 [1.00, 1.69] |
| 4.8 Vomiting | 11 | 1916 | Risk Ratio (IV, Random, 95% CI) | 1.17 [0.76, 1.79] |
| 5 Circulatory and respiratory systems Show forest plot | 8 | Risk Ratio (Random, 95% CI) | Subtotals only | |
| 5.1 ECG: prolonged QT‐interval | 2 | 466 | Risk Ratio (Random, 95% CI) | 0.81 [0.13, 5.00] |
| 5.2 ECG: tachycardia | 1 | 245 | Risk Ratio (Random, 95% CI) | 1.04 [0.11, 10.18] |
| 5.3 Cough | 4 | 996 | Risk Ratio (Random, 95% CI) | 0.95 [0.41, 2.18] |
| 5.4 Nasal congestion | 2 | 479 | Risk Ratio (Random, 95% CI) | 1.19 [0.59, 2.41] |
| 5.5 Pharyngolaryngeal pain | 1 | 303 | Risk Ratio (Random, 95% CI) | 1.12 [0.59, 2.13] |
| 5.6 Supraventricular extrasystoles | 1 | 17 | Risk Ratio (Random, 95% CI) | 3.00 [0.11, 84.55] |
| 5.7 Upper respiratory tract infection | 1 | 217 | Risk Ratio (Random, 95% CI) | 1.07 [0.42, 2.76] |
| 6 Skeletal and muscular systems Show forest plot | 2 | Risk Ratio (IV, Random, 95% CI) | Subtotals only | |
| 6.1 Arthralgia | 1 | 303 | Risk Ratio (IV, Random, 95% CI) | 0.67 [0.24, 1.84] |
| 6.2 Asthenia | 1 | 177 | Risk Ratio (IV, Random, 95% CI) | 0.21 [0.01, 4.25] |
| 6.3 Back pain | 1 | 303 | Risk Ratio (IV, Random, 95% CI) | 0.81 [0.39, 1.66] |
| 6.4 Myalgia | 1 | 303 | Risk Ratio (IV, Random, 95% CI) | 0.60 [0.23, 1.62] |
| 6.5 Toothache | 1 | 303 | Risk Ratio (IV, Random, 95% CI) | 1.01 [0.43, 2.35] |
| 7 Immune system Show forest plot | 7 | Risk Ratio (IV, Random, 95% CI) | Subtotals only | |
| 7.1 Gastroenteritis | 3 | 435 | Risk Ratio (IV, Random, 95% CI) | 4.63 [0.99, 21.72] |
| 7.2 Influenza | 3 | 624 | Risk Ratio (IV, Random, 95% CI) | 0.65 [0.20, 2.10] |
| 7.3 Nasopharyngitis | 5 | 979 | Risk Ratio (IV, Random, 95% CI) | 1.15 [0.70, 1.87] |
| 7.4 Otitis media | 1 | 100 | Risk Ratio (IV, Random, 95% CI) | 1.77 [0.17, 18.94] |
| 7.5 Pharyngitis | 2 | 293 | Risk Ratio (IV, Random, 95% CI) | 2.43 [0.49, 12.05] |
| 7.6 Pyrexia | 2 | 400 | Risk Ratio (IV, Random, 95% CI) | 1.02 [0.01, 87.72] |
| 7.7 Rhinitis | 1 | 132 | Risk Ratio (IV, Random, 95% CI) | 1.28 [0.43, 3.79] |
| 7.8 Upper respiratory tract infection ‐ not otherwise specified (NOS) | 5 | 917 | Risk Ratio (IV, Random, 95% CI) | 1.19 [0.68, 2.06] |
| 7.9 Viral infection NOS | 3 | 614 | Risk Ratio (IV, Random, 95% CI) | 0.70 [0.23, 2.15] |
| 8 Height Show forest plot | 1 | Mean Difference (IV, Random, 95% CI) | Totals not selected | |
| 9 Weight Show forest plot | 5 | 805 | Std. Mean Difference (IV, Random, 95% CI) | ‐1.12 [‐1.55, ‐0.70] |
| 10 BMI Show forest plot | 1 | Mean Difference (IV, Random, 95% CI) | Totals not selected | |
| 11 Vital signs Show forest plot | 9 | 3374 | Mean Difference (IV, Random, 95% CI) | 1.41 [0.30, 2.52] |
| 11.1 Diastolic blood pressure (mmHg) | 8 | 1067 | Mean Difference (IV, Random, 95% CI) | 0.94 [‐0.12, 2.01] |
| 11.2 Systolic blood pressure (mmHg) | 8 | 1067 | Mean Difference (IV, Random, 95% CI) | ‐0.05 [‐1.25, 1.16] |
| 11.3 Pulse or heart rate (bpm) | 8 | 1240 | Mean Difference (IV, Random, 95% CI) | 3.41 [0.87, 5.94] |
| 12 Other Show forest plot | 5 | 1815 | Risk Ratio (IV, Random, 95% CI) | 1.20 [0.56, 2.57] |
| 12.1 Accidental injury | 3 | 656 | Risk Ratio (IV, Random, 95% CI) | 0.99 [0.48, 2.07] |
| 12.2 Epistasis | 1 | 132 | Risk Ratio (IV, Random, 95% CI) | 4.25 [0.23, 77.22] |
| 12.3 Excoriation | 1 | 303 | Risk Ratio (IV, Random, 95% CI) | 3.52 [1.19, 10.46] |
| 12.4 Overdose | 1 | 221 | Risk Ratio (IV, Random, 95% CI) | 2.97 [0.12, 72.20] |
| 12.5 Skin disorder (rash) | 2 | 200 | Risk Ratio (IV, Random, 95% CI) | 0.52 [0.01, 26.44] |
| 12.6 Skin laceration | 1 | 303 | Risk Ratio (IV, Random, 95% CI) | 0.42 [0.15, 1.16] |
| Outcome or subgroup title | No. of studies | No. of participants | Statistical method | Effect size |
| 1 Total number of non‐serious adverse events Show forest plot | 21 | 2072 | Risk Ratio (Random, 95% CI) | 1.33 [1.11, 1.58] |
| 2 Subgroup analysis: total number of non‐serious adverse events according to dose Show forest plot | 21 | 2859 | Risk Ratio (Random, 95% CI) | 1.26 [1.11, 1.44] |
| 2.1 Low dose | 16 | 1539 | Risk Ratio (Random, 95% CI) | 1.11 [0.94, 1.31] |
| 2.2 High dose | 12 | 1080 | Risk Ratio (Random, 95% CI) | 1.57 [1.22, 2.01] |
| 2.3 Unknown dose | 2 | 240 | Risk Ratio (Random, 95% CI) | 0.98 [0.51, 1.86] |
| 3 Nervous system Show forest plot | 50 | Risk Ratio (Random, 95% CI) | Subtotals only | |
| 3.1 Aggression | 2 | 589 | Risk Ratio (Random, 95% CI) | 0.52 [0.17, 1.60] |
| 3.2 Agitation | 1 | 62 | Risk Ratio (Random, 95% CI) | 1.18 [0.38, 3.60] |
| 3.3 Anger | 3 | 264 | Risk Ratio (Random, 95% CI) | 0.45 [0.26, 0.77] |
| 3.4 Behavioural complaints | 1 | 82 | Risk Ratio (Random, 95% CI) | 0.55 [0.35, 0.86] |
| 3.5 Buccal or lingual movements | 4 | 302 | Risk Ratio (Random, 95% CI) | 1.06 [0.62, 1.79] |
| 3.6 Compulsive acts | 1 | 90 | Risk Ratio (Random, 95% CI) | 2.57 [1.45, 4.56] |
| 3.7 Daydreaming | 3 | 222 | Risk Ratio (Random, 95% CI) | 0.66 [0.44, 0.98] |
| 3.8 Dizziness | 9 | 746 | Risk Ratio (Random, 95% CI) | 1.17 [0.89, 1.55] |
| 3.9 Drowsiness: dull, tired, listless or sleepy | 21 | 1350 | Risk Ratio (Random, 95% CI) | 0.97 [0.73, 1.28] |
| 3.10 Euphoria | 6 | 405 | Risk Ratio (Random, 95% CI) | 1.06 [0.72, 1.57] |
| 3.11 Headache | 37 | 3752 | Risk Ratio (Random, 95% CI) | 1.21 [1.01, 1.45] |
| 3.12 Insomnia or sleep problems | 31 | 3270 | Risk Ratio (Random, 95% CI) | 1.57 [1.20, 2.06] |
| 3.13 Irritability | 23 | 2238 | Risk Ratio (Random, 95% CI) | 0.92 [0.66, 1.27] |
| 3.14 Nightmares | 10 | 686 | Risk Ratio (Random, 95% CI) | 0.97 [0.66, 1.42] |
| 3.15 Overly meticulous | 1 | 96 | Risk Ratio (Random, 95% CI) | 40.77 [2.35, 706.72] |
| 3.16 Obsessive thinking | 1 | 90 | Risk Ratio (Random, 95% CI) | 2.35 [1.53, 3.62] |
| 3.17 Picking at skin or fingers, nail biting, lip or cheek chewing | 15 | 888 | Risk Ratio (Random, 95% CI) | 1.12 [0.88, 1.41] |
| 3.18 Repetitive language | 1 | 48 | Risk Ratio (Random, 95% CI) | 1.0 [0.32, 3.10] |
| 3.19 Sad, tearful or depressed | 23 | 1849 | Risk Ratio (Random, 95% CI) | 1.15 [0.94, 1.41] |
| 3.20 Socially withdrawn ‐ decreased interaction with others | 12 | 771 | Risk Ratio (Random, 95% CI) | 1.24 [0.82, 1.87] |
| 3.21 Sleep efficiency (SEF) | 2 | 108 | Risk Ratio (Random, 95% CI) | 0.48 [0.02, 14.28] |
| 3.22 Stares a lot | 9 | 904 | Risk Ratio (Random, 95% CI) | 1.03 [0.75, 1.40] |
| 3.23 Tics or nervous movements | 19 | 1403 | Risk Ratio (Random, 95% CI) | 1.33 [1.03, 1.72] |
| 3.24 Unusual blinking | 1 | 48 | Risk Ratio (Random, 95% CI) | 3.13 [0.12, 80.68] |
| 3.25 Worried or anxious | 20 | 1673 | Risk Ratio (Random, 95% CI) | 0.82 [0.60, 1.12] |
| 4 Digestive system Show forest plot | 42 | Risk Ratio (Random, 95% CI) | Subtotals only | |
| 4.1 Decreased appetite or loss of appetite | 35 | 3862 | Risk Ratio (Random, 95% CI) | 3.04 [2.35, 3.94] |
| 4.2 Diarrhoea | 3 | 402 | Risk Ratio (Random, 95% CI) | 0.58 [0.19, 1.74] |
| 4.3 Dry mouth | 5 | 342 | Risk Ratio (Random, 95% CI) | 1.25 [0.54, 2.90] |
| 4.4 Dyspepsia | 1 | 62 | Risk Ratio (Random, 95% CI) | 0.22 [0.02, 2.14] |
| 4.5 Nausea | 9 | 768 | Risk Ratio (Random, 95% CI) | 1.52 [1.00, 2.30] |
| 4.6 Increased appetite | 1 | 136 | Risk Ratio (Random, 95% CI) | 0.20 [0.08, 0.50] |
| 4.7 Stomachache | 33 | 3777 | Risk Ratio (Random, 95% CI) | 1.61 [1.27, 2.04] |
| 4.8 Vomiting | 4 | 710 | Risk Ratio (Random, 95% CI) | 0.90 [0.26, 3.11] |
| 5 Urinary system: urinary incontinence Show forest plot | 1 | Risk Ratio (IV, Random, 95% CI) | Totals not selected | |
| 6 Skeletal and muscular system: somatic complaints Show forest plot | 1 | Mean Difference (IV, Random, 95% CI) | Totals not selected | |
| 7 Immune system Show forest plot | 7 | Risk Ratio (IV, Random, 95% CI) | Subtotals only | |
| 7.1 Allergic rhinitis | 4 | 475 | Risk Ratio (IV, Random, 95% CI) | 1.38 [0.35, 5.51] |
| 7.2 Fever | 2 | 91 | Risk Ratio (IV, Random, 95% CI) | 1.39 [0.09, 20.56] |
| 7.3 Lymphadenitis | 2 | 296 | Risk Ratio (IV, Random, 95% CI) | 3.93 [0.44, 35.11] |
| 7.4 Pharyngolaryngeal pain | 1 | 160 | Risk Ratio (IV, Random, 95% CI) | 2.0 [0.19, 21.62] |
| 7.5 Pharyngitis | 4 | 754 | Risk Ratio (IV, Random, 95% CI) | 0.71 [0.19, 2.62] |
| 7.6 Upper respiratory tract infection | 5 | 888 | Risk Ratio (IV, Random, 95% CI) | 0.61 [0.27, 1.37] |
| 8 Skin Show forest plot | 3 | Risk Ratio (IV, Random, 95% CI) | Subtotals only | |
| 8.1 Rash | 2 | 208 | Risk Ratio (IV, Random, 95% CI) | 0.96 [0.14, 6.41] |
| 8.2 Skin laceration | 1 | 167 | Risk Ratio (IV, Random, 95% CI) | 2.96 [0.12, 71.75] |
| 9 Vital signs Show forest plot | 14 | Mean Difference (IV, Random, 95% CI) | Subtotals only | |
| 9.1 Diastolic blood pressure (mmHg) | 11 | 755 | Mean Difference (IV, Random, 95% CI) | 1.23 [‐0.39, 2.86] |
| 9.2 Systolic blood pressure (mmHg) | 11 | 755 | Mean Difference (IV, Random, 95% CI) | 0.53 [‐1.30, 2.36] |
| 9.3 Pulse or heart rate (bpm) | 14 | 939 | Mean Difference (IV, Random, 95% CI) | 5.06 [2.88, 7.24] |
| 10 Height (cm) Show forest plot | 1 | Mean Difference (IV, Random, 95% CI) | Totals not selected | |
| 11 Weight Show forest plot | 6 | 530 | Std. Mean Difference (IV, Random, 95% CI) | ‐0.06 [‐0.23, 0.11] |
| Outcome or subgroup title | No. of studies | No. of participants | Statistical method | Effect size |
| 1 All parallel‐group trials and first‐period cross‐over trials: risk of bias Show forest plot | 5 | 668 | Std. Mean Difference (IV, Random, 95% CI) | ‐0.87 [‐1.04, ‐0.71] |
| 1.1 Low risk of bias | 0 | 0 | Std. Mean Difference (IV, Random, 95% CI) | 0.0 [0.0, 0.0] |
| 1.2 High risk of bias | 5 | 668 | Std. Mean Difference (IV, Random, 95% CI) | ‐0.87 [‐1.04, ‐0.71] |
| 2 Subgroup analysis: types of scales Show forest plot | 5 | 668 | Std. Mean Difference (IV, Random, 95% CI) | ‐0.87 [‐1.04, ‐0.71] |
| 2.1 Conners' Global Index ‐ Teacher (CGI‐T) | 1 | 314 | Std. Mean Difference (IV, Random, 95% CI) | ‐0.91 [‐1.14, ‐0.68] |
| 2.2 Groninger Behaviour Observation Scale (GBOS) | 1 | 43 | Std. Mean Difference (IV, Random, 95% CI) | ‐0.84 [‐1.46, ‐0.21] |
| 2.3 Conners' Teacher Rating Scale ‐ Conduct problems | 1 | 25 | Std. Mean Difference (IV, Random, 95% CI) | ‐0.67 [‐1.48, 0.14] |
| 2.4 IOWA Conners' Rating Scale ‐ Oppositional/Defiant (IOWA‐O/D) | 2 | 286 | Std. Mean Difference (IV, Random, 95% CI) | ‐0.86 [‐1.12, ‐0.59] |
| 3 Subgroup analysis: dose Show forest plot | 5 | 696 | Std. Mean Difference (IV, Random, 95% CI) | ‐0.85 [‐1.02, ‐0.69] |
| 3.1 Low dose | 2 | 71 | Std. Mean Difference (IV, Random, 95% CI) | ‐0.67 [‐1.16, ‐0.19] |
| 3.2 High dose | 3 | 466 | Std. Mean Difference (IV, Random, 95% CI) | ‐0.89 [‐1.08, ‐0.70] |
| 3.3 Unknown dose | 1 | 159 | Std. Mean Difference (IV, Random, 95% CI) | ‐0.84 [‐1.21, ‐0.46] |
| 4 Subgroup analysis: duration of treatment Show forest plot | 5 | 668 | Std. Mean Difference (IV, Random, 95% CI) | ‐0.87 [‐1.04, ‐0.71] |
| 4.1 Short term (up to 6 months) | 5 | 668 | Std. Mean Difference (IV, Random, 95% CI) | ‐0.87 [‐1.04, ‐0.71] |
| 4.2 Long term (over 6 months) | 0 | 0 | Std. Mean Difference (IV, Random, 95% CI) | 0.0 [0.0, 0.0] |
| 5 Subgroup analysis: parallel‐group trials versus first‐period cross‐over trials Show forest plot | 5 | 668 | Std. Mean Difference (IV, Random, 95% CI) | ‐0.87 [‐1.04, ‐0.71] |
| 5.1 Parallel‐group trials | 5 | 668 | Std. Mean Difference (IV, Random, 95% CI) | ‐0.87 [‐1.04, ‐0.71] |
| 5.2 First‐period cross‐over trials | 0 | 0 | Std. Mean Difference (IV, Random, 95% CI) | 0.0 [0.0, 0.0] |
| 6 General behaviour, cross‐over trials (endpoint data) Show forest plot | 16 | 2014 | Std. Mean Difference (IV, Random, 95% CI) | ‐0.69 [‐0.78, ‐0.60] |
| 6.1 Low dose | 13 | 1110 | Std. Mean Difference (IV, Random, 95% CI) | ‐0.60 [‐0.72, ‐0.48] |
| 6.2 High dose | 12 | 904 | Std. Mean Difference (IV, Random, 95% CI) | ‐0.82 [‐0.95, ‐0.68] |
| 7 Subgroup analysis: general behaviour, cross‐over trials (endpoint data): risk of bias Show forest plot | 16 | 1308 | Std. Mean Difference (IV, Random, 95% CI) | ‐0.75 [‐0.87, ‐0.63] |
| 7.1 Low risk of bias | 0 | 0 | Std. Mean Difference (IV, Random, 95% CI) | 0.0 [0.0, 0.0] |
| 7.2 High risk of bias | 16 | 1308 | Std. Mean Difference (IV, Random, 95% CI) | ‐0.75 [‐0.87, ‐0.63] |
| 8 Subgroup analysis: all parallel‐group trials and first‐period cross‐over trials (teacher‐rated) versus cross‐over trials (endpoint data) Show forest plot | 21 | 1976 | Std. Mean Difference (IV, Random, 95% CI) | ‐0.79 [‐0.88, ‐0.70] |
| 8.1 All parallel‐group trials and first‐period cross‐over trials | 5 | 668 | Std. Mean Difference (IV, Random, 95% CI) | ‐0.87 [‐1.04, ‐0.71] |
| 8.2 Cross‐over trials (endpoint data) | 16 | 1308 | Std. Mean Difference (IV, Random, 95% CI) | ‐0.75 [‐0.87, ‐0.63] |
| Outcome or subgroup title | No. of studies | No. of participants | Statistical method | Effect size |
| 1 General behaviour, cross‐over trials (endpoint data) Show forest plot | 8 | 1241 | Std. Mean Difference (IV, Random, 95% CI) | ‐0.60 [‐0.75, ‐0.46] |
| 1.1 Low dose | 7 | 903 | Std. Mean Difference (IV, Random, 95% CI) | ‐0.56 [‐0.76, ‐0.36] |
| 1.2 High dose | 5 | 338 | Std. Mean Difference (IV, Random, 95% CI) | ‐0.71 [‐0.93, ‐0.49] |
| 2 Subgroup analysis: general behaviour, cross‐over trials (endpoint data): risk of bias Show forest plot | 8 | 951 | Std. Mean Difference (IV, Random, 95% CI) | ‐0.69 [‐0.88, ‐0.49] |
| 2.1 Low risk of bias | 0 | 0 | Std. Mean Difference (IV, Random, 95% CI) | 0.0 [0.0, 0.0] |
| 2.2 High risk of bias | 8 | 951 | Std. Mean Difference (IV, Random, 95% CI) | ‐0.69 [‐0.88, ‐0.49] |
| 3 Subgroup analysis: all parallel‐group trials and first‐period cross‐over trials (independent assessor‐rated) compared with cross‐over trials (endpoint data) Show forest plot | 8 | 951 | Std. Mean Difference (IV, Random, 95% CI) | ‐0.69 [‐0.88, ‐0.49] |
| 3.1 Parallel‐group trials and first‐period cross‐over trials | 0 | 0 | Std. Mean Difference (IV, Random, 95% CI) | 0.0 [0.0, 0.0] |
| 3.2 Cross‐over trials (endpoint data) | 8 | 951 | Std. Mean Difference (IV, Random, 95% CI) | ‐0.69 [‐0.88, ‐0.49] |
| Outcome or subgroup title | No. of studies | No. of participants | Statistical method | Effect size |
| 1 All parallel‐group trials and first‐period cross‐over trials Show forest plot | 6 | 670 | Std. Mean Difference (IV, Random, 95% CI) | ‐0.53 [‐0.78, ‐0.27] |
| 2 Subgroup analysis: risk of bias Show forest plot | 6 | 670 | Std. Mean Difference (IV, Random, 95% CI) | ‐0.53 [‐0.78, ‐0.27] |
| 2.1 Low risk of bias | 0 | 0 | Std. Mean Difference (IV, Random, 95% CI) | 0.0 [0.0, 0.0] |
| 2.2 High risk of bias | 6 | 670 | Std. Mean Difference (IV, Random, 95% CI) | ‐0.53 [‐0.78, ‐0.27] |
| 3 Subgroup analysis: types of scales Show forest plot | 6 | 670 | Std. Mean Difference (IV, Random, 95% CI) | ‐0.53 [‐0.78, ‐0.27] |
| 3.1 The Weekly Parent Ratings of Evening and Morning Behaviour (WPREMB) ‐ Revised | 1 | 17 | Std. Mean Difference (IV, Random, 95% CI) | 0.50 [‐0.47, 1.47] |
| 3.2 Conners' Global Index (CGI) ‐ Parent | 2 | 352 | Std. Mean Difference (IV, Random, 95% CI) | ‐0.41 [‐0.63, ‐0.20] |
| 3.3 Swanson, Nolan and Pelham, Fourth Edition ‐ Oppositional (SNAP‐IV‐Oppositional) | 1 | 15 | Std. Mean Difference (IV, Random, 95% CI) | ‐0.86 [‐1.95, 0.23] |
| 3.4 IOWA Conners' Rating Scale ‐ Oppositional/Defiant (IOWA‐I/O) | 2 | 286 | Std. Mean Difference (IV, Random, 95% CI) | ‐0.75 [‐1.01, ‐0.49] |
| 4 Subgroup analysis: parallel‐group trials compared with first‐period cross‐over trials Show forest plot | 6 | 670 | Std. Mean Difference (IV, Random, 95% CI) | ‐0.53 [‐0.78, ‐0.27] |
| 4.1 Parallel‐group trials | 5 | 655 | Std. Mean Difference (IV, Random, 95% CI) | ‐0.51 [‐0.78, ‐0.23] |
| 4.2 First‐period cross‐over trials | 1 | 15 | Std. Mean Difference (IV, Random, 95% CI) | ‐0.86 [‐1.95, 0.23] |
| 5 Subgroup analysis: duration of treatment Show forest plot | 6 | 670 | Std. Mean Difference (IV, Random, 95% CI) | ‐0.53 [‐0.78, ‐0.27] |
| 5.1 Short term (up to 6 months) | 6 | 670 | Std. Mean Difference (IV, Random, 95% CI) | ‐0.53 [‐0.78, ‐0.27] |
| 5.2 Long term (over 6 months) | 0 | 0 | Std. Mean Difference (IV, Random, 95% CI) | 0.0 [0.0, 0.0] |
| 6 Subgroup analysis: dose Show forest plot | 6 | 670 | Std. Mean Difference (IV, Random, 95% CI) | ‐0.53 [‐0.78, ‐0.27] |
| 6.1 Low dose | 0 | 0 | Std. Mean Difference (IV, Random, 95% CI) | 0.0 [0.0, 0.0] |
| 6.2 High dose | 4 | 496 | Std. Mean Difference (IV, Random, 95% CI) | ‐0.42 [‐0.77, ‐0.08] |
| 6.3 Unknown dose | 2 | 174 | Std. Mean Difference (IV, Random, 95% CI) | ‐0.73 [‐1.08, ‐0.38] |
| 7 General behaviour, cross‐over trials (endpoint data) Show forest plot | 6 | 550 | Std. Mean Difference (IV, Random, 95% CI) | ‐0.75 [‐0.93, ‐0.56] |
| 7.1 Low dose | 5 | 248 | Std. Mean Difference (IV, Random, 95% CI) | ‐0.65 [‐0.93, ‐0.38] |
| 7.2 High dose | 4 | 302 | Std. Mean Difference (IV, Random, 95% CI) | ‐0.83 [‐1.07, ‐0.60] |
| 8 Subgroup analysis: general behaviour, cross‐over trials (endpoint data): risk of bias Show forest plot | 6 | 384 | Std. Mean Difference (IV, Random, 95% CI) | ‐0.84 [‐1.05, ‐0.63] |
| 8.1 Low risk of bias | 0 | 0 | Std. Mean Difference (IV, Random, 95% CI) | 0.0 [0.0, 0.0] |
| 8.2 High risk of bias | 6 | 384 | Std. Mean Difference (IV, Random, 95% CI) | ‐0.84 [‐1.05, ‐0.63] |
| 9 Subgroup analysis: all parallel‐group trials and first‐period cross‐over trials (parent‐rated) compared with cross‐over trials (endpoint data) Show forest plot | 12 | 1054 | Std. Mean Difference (IV, Random, 95% CI) | ‐0.68 [‐0.86, ‐0.50] |
| 9.1 All parallel‐group trials and first‐period cross‐over trials | 6 | 670 | Std. Mean Difference (IV, Random, 95% CI) | ‐0.53 [‐0.78, ‐0.27] |
| 9.2 Cross‐over trials (endpoint data) | 6 | 384 | Std. Mean Difference (IV, Random, 95% CI) | ‐0.84 [‐1.05, ‐0.63] |
| Outcome or subgroup title | No. of studies | No. of participants | Statistical method | Effect size |
| 1 Comparisions of raters Show forest plot | 8 | 1338 | Std. Mean Difference (IV, Random, 95% CI) | ‐0.69 [‐0.86, ‐0.52] |
| 1.1 Teacher‐rated | 5 | 668 | Std. Mean Difference (IV, Random, 95% CI) | ‐0.87 [‐1.04, ‐0.71] |
| 1.2 Independent assessor‐rated | 0 | 0 | Std. Mean Difference (IV, Random, 95% CI) | 0.0 [0.0, 0.0] |
| 1.3 Parent‐rated | 6 | 670 | Std. Mean Difference (IV, Random, 95% CI) | ‐0.53 [‐0.78, ‐0.27] |
| 2 Comorbidity versus no comorbidity Show forest plot | 7 | 579 | Std. Mean Difference (IV, Random, 95% CI) | ‐0.70 [‐0.98, ‐0.43] |
| 2.1 ADHD with comorbidity | 6 | 265 | Std. Mean Difference (IV, Random, 95% CI) | ‐0.59 [‐0.95, ‐0.23] |
| 2.2 ADHD without comorbidity | 1 | 314 | Std. Mean Difference (IV, Random, 95% CI) | ‐0.91 [‐1.14, ‐0.68] |
| 3 Cross‐over trials: first‐period data versus endpoint data (teacher‐, parent‐, and independent assessor‐rated) Show forest plot | 1 | Mean Difference (IV, Random, 95% CI) | Subtotals only | |
| 3.1 First‐period data | 1 | 16 | Mean Difference (IV, Random, 95% CI) | ‐0.81 [‐1.75, 0.13] |
| 3.2 Endpoint data | 1 | 14 | Mean Difference (IV, Random, 95% CI) | 0.14 [‐0.71, 1.00] |
| Outcome or subgroup title | No. of studies | No. of participants | Statistical method | Effect size |
| 1 Subgroup analysis: types of scales Show forest plot | 3 | 514 | Std. Mean Difference (IV, Random, 95% CI) | 0.61 [0.42, 0.80] |
| 1.1 Child Health Questionnaire (CHQ) | 1 | 257 | Std. Mean Difference (IV, Random, 95% CI) | 0.54 [0.25, 0.83] |
| 1.2 Children´s Global Assessment Scale (CGAS) | 1 | 36 | Std. Mean Difference (IV, Random, 95% CI) | 0.79 [0.10, 1.47] |
| 1.3 Child Health and Illness Profile, Child Edition: Parent Report Form (CHIP‐CE:PRF) | 1 | 221 | Std. Mean Difference (IV, Random, 95% CI) | 0.64 [0.37, 0.91] |