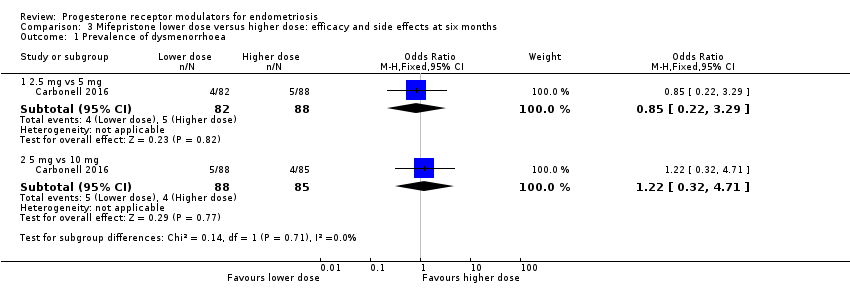
| 1 Prevalence of dysmenorrhoea Show forest plot | 1 | | Odds Ratio (M‐H, Fixed, 95% CI) | Subtotals only |
|
| 1.1 2.5 mg vs 5 mg | 1 | 170 | Odds Ratio (M‐H, Fixed, 95% CI) | 0.85 [0.22, 3.29] |
| 1.2 5 mg vs 10 mg | 1 | 173 | Odds Ratio (M‐H, Fixed, 95% CI) | 1.22 [0.32, 4.71] |
| 2 Dysmenorrhoea score 0‐10 VAS scale Show forest plot | 1 | | Mean Difference (IV, Fixed, 95% CI) | Totals not selected |
|
| 2.1 5 mg vs 25 mg | 1 | | Mean Difference (IV, Fixed, 95% CI) | 0.0 [0.0, 0.0] |
| 3 Prevalence of dyspareunia Show forest plot | 1 | | Odds Ratio (M‐H, Fixed, 95% CI) | Subtotals only |
|
| 3.1 2.5 mg vs 5 mg | 1 | 108 | Odds Ratio (M‐H, Fixed, 95% CI) | 6.37 [0.74, 54.81] |
| 3.2 5 mg vs 10 mg | 1 | 109 | Odds Ratio (M‐H, Fixed, 95% CI) | 0.52 [0.05, 5.90] |
| 4 Dyspareunia score 0‐10 VAS scale Show forest plot | 1 | | Mean Difference (IV, Fixed, 95% CI) | Totals not selected |
|
| 4.1 5 mg vs 25 mg | 1 | | Mean Difference (IV, Fixed, 95% CI) | 0.0 [0.0, 0.0] |
| 5 Prevalence of pelvic pain Show forest plot | 1 | | Odds Ratio (M‐H, Fixed, 95% CI) | Subtotals only |
|
| 5.1 2.5 mg vs 5 mg | 1 | 110 | Odds Ratio (M‐H, Fixed, 95% CI) | 1.81 [0.63, 5.17] |
| 5.2 5 mg vs 10 mg | 1 | 120 | Odds Ratio (M‐H, Fixed, 95% CI) | 3.97 [0.79, 19.97] |
| 6 Prevalence of amenorrhoea Show forest plot | 2 | | Odds Ratio (M‐H, Fixed, 95% CI) | Subtotals only |
|
| 6.1 2.5 mg vs 5 mg | 1 | 180 | Odds Ratio (M‐H, Fixed, 95% CI) | 0.45 [0.21, 0.97] |
| 6.2 5 mg vs 10 mg | 1 | 180 | Odds Ratio (M‐H, Fixed, 95% CI) | 1.10 [0.47, 2.56] |
| 6.3 5 mg vs 25 mg | 1 | 26 | Odds Ratio (M‐H, Fixed, 95% CI) | 0.61 [0.08, 4.41] |
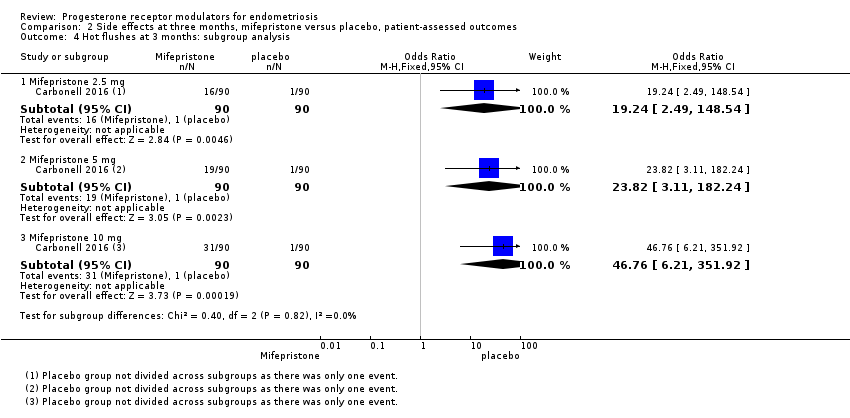
| 7 Prevalence of hot flushes Show forest plot | 2 | | Odds Ratio (M‐H, Fixed, 95% CI) | Subtotals only |
|
| 7.1 2.5 mg vs 5 mg | 1 | 180 | Odds Ratio (M‐H, Fixed, 95% CI) | 0.84 [0.38, 1.89] |
| 7.2 5 mg vs 10 mg | 1 | 180 | Odds Ratio (M‐H, Fixed, 95% CI) | 0.75 [0.35, 1.58] |
| 7.3 5 mg vs 25 mg | 1 | 26 | Odds Ratio (M‐H, Fixed, 95% CI) | 3.24 [0.12, 87.13] |
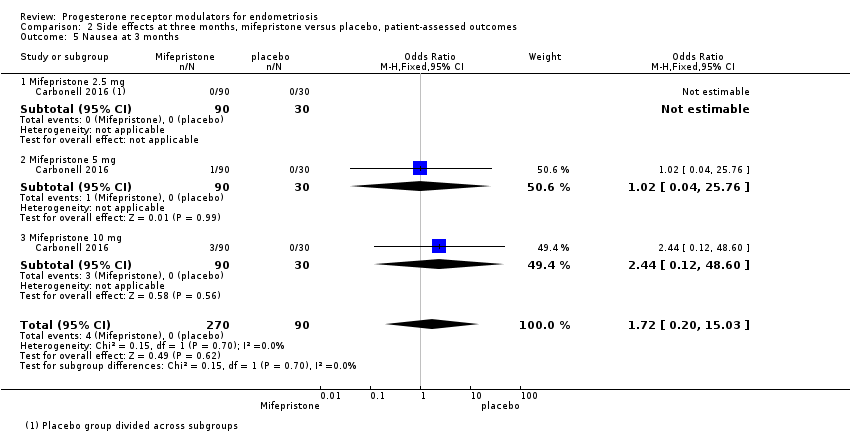
| 8 Prevalence of nausea Show forest plot | 1 | | Odds Ratio (M‐H, Fixed, 95% CI) | Subtotals only |
|
| 8.1 2.5 mg vs 5 mg | 1 | 180 | Odds Ratio (M‐H, Fixed, 95% CI) | 2.02 [0.18, 22.71] |
| 8.2 5 mg vs 10 mg | 1 | 180 | Odds Ratio (M‐H, Fixed, 95% CI) | 1.0 [0.06, 16.24] |
| 9 Prevalence of vomiting Show forest plot | 1 | | Odds Ratio (M‐H, Fixed, 95% CI) | Subtotals only |
|
| 9.1 2.5 mg vs 5 mg | 1 | 180 | Odds Ratio (M‐H, Fixed, 95% CI) | 3.03 [0.12, 75.46] |
| 9.2 5 mg vs 10 mg | 1 | 180 | Odds Ratio (M‐H, Fixed, 95% CI) | 0.33 [0.01, 8.20] |
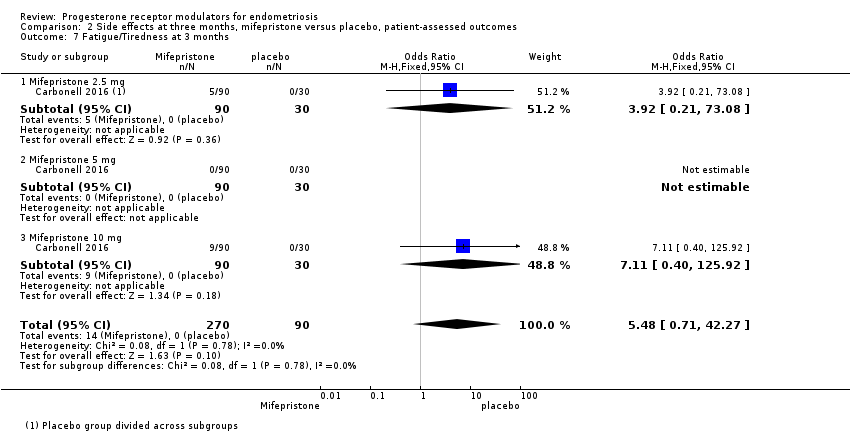
| 10 Prevalence of fatigue/tiredness Show forest plot | 1 | | Odds Ratio (M‐H, Fixed, 95% CI) | Subtotals only |
|
| 10.1 2.5 mg vs 5 mg | 1 | 180 | Odds Ratio (M‐H, Fixed, 95% CI) | 13.92 [0.77, 250.94] |
| 10.2 5 mg vs 10 mg | 1 | 180 | Odds Ratio (M‐H, Fixed, 95% CI) | 0.03 [0.00, 0.54] |
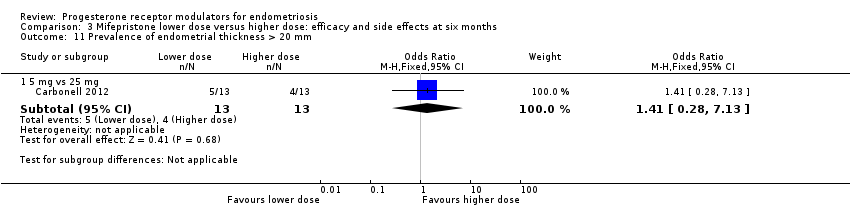
| 11 Prevalence of endometrial thickness > 20 mm Show forest plot | 1 | | Odds Ratio (M‐H, Fixed, 95% CI) | Subtotals only |
|
| 11.1 5 mg vs 25 mg | 1 | 26 | Odds Ratio (M‐H, Fixed, 95% CI) | 1.41 [0.28, 7.13] |