Scolaris Content Display Scolaris Content Display

Study selection flow diagram.
Figuras y tablas -
Figure 1

Study selection flow diagram.

Risk of bias summary: review authors' judgements about each risk of bias item for each included study.
Figuras y tablas -
Figure 2

Risk of bias summary: review authors' judgements about each risk of bias item for each included study.

Comparison 1 Interdental brushing versus flossing, Outcome 1 Gingivitis at 1 month.
Figuras y tablas -
Analysis 1.1

Comparison 1 Interdental brushing versus flossing, Outcome 1 Gingivitis at 1 month.

Comparison 1 Interdental brushing versus flossing, Outcome 2 Gingivitis at 3 months.
Figuras y tablas -
Analysis 1.2

Comparison 1 Interdental brushing versus flossing, Outcome 2 Gingivitis at 3 months.

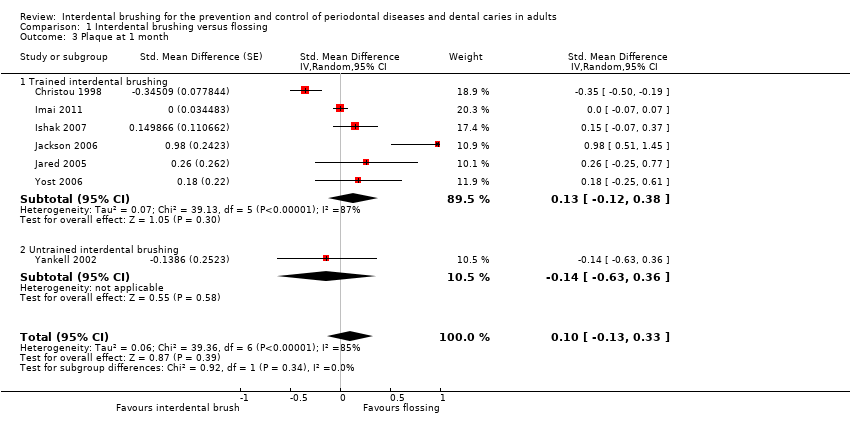
Comparison 1 Interdental brushing versus flossing, Outcome 3 Plaque at 1 month.
Figuras y tablas -
Analysis 1.3

Comparison 1 Interdental brushing versus flossing, Outcome 3 Plaque at 1 month.

Comparison 1 Interdental brushing versus flossing, Outcome 4 Plaque at 3 months.
Figuras y tablas -
Analysis 1.4

Comparison 1 Interdental brushing versus flossing, Outcome 4 Plaque at 3 months.

Summary of findings for the main comparison. Interdental brushing with toothbrushing compared to toothbrushing alone for periodontal diseases and dental caries in adults

Interdental brushing for periodontal diseases and dental caries in adults

Patient or population: Adults, 16 years and older
Settings: Everyday self care
Intervention: Interdental brushing plus toothbrushing
Comparison: Toothbrushing

Outcomes

Illustrative comparative risks* (95% CI)

Relative effect
(95% CI)

No of participants
(studies)

Quality of the evidence
(GRADE)

Comments

Assumed risk

Corresponding risk

No IDB

IDB

Gingivitis
Scale from: 0 to 4
Follow‐up: mean 1 month

The mean gingivitis in the control group was 1.56

The mean gingivitis in the intervention groups was 0.53 lower (95% CI 0.23 to 0.83)

62
(1 study)

⊕⊝⊝⊝
very low1

34% reduction in gingivitis

Periodontitis

Not estimable

0
(0)

See comment

No included study assessed periodontitis as an outcome

Plaque
Scale from: 0 to 5
Follow‐up: mean 1 month

The mean plaque in the control groups was
2.97

The mean plaque in the intervention groups was 0.95 lower (95% CI 0.56 to 1.34)

62
(1 study)

⊕⊝⊝⊝
very low1

32% reduction in plaque

Interproximal caries

Not estimable

0
(0)

See comment

No included study assessed caries as an outcome

Harms and adverse outcomes

Not estimable

0
(0)

See comment

Only 1 study reported adverse outcomes in terms of problems with the use of the assigned interdental cleaning aids

Bad breath

(halitosis)

Not estimable

0
(0)

See comment

No included study assessed bad breath as an outcome

Quality of life

Not estimable

0
(0)

See comment

No included study assessed quality of life as an outcome

*The basis for the assumed risk (e.g. the median control group risk across studies) is provided in footnotes. The corresponding risk (and its 95% confidence interval) is based on the assumed risk in the comparison group and the relative effect of the intervention (and its 95% CI).
CI: confidence interval; IDB: interdental brushing; RR: risk ratio

GRADE Working Group grades of evidence
High quality: Further research is very unlikely to change our confidence in the estimate of effect.
Moderate quality: Further research is likely to have an important impact on our confidence in the estimate of effect and may change the estimate.
Low quality: Further research is very likely to have an important impact on our confidence in the estimate of effect and is likely to change the estimate.
Very low quality: We are very uncertain about the estimate.

1Single study at high risk of bias.

Figuras y tablas -
Summary of findings for the main comparison. Interdental brushing with toothbrushing compared to toothbrushing alone for periodontal diseases and dental caries in adults
Summary of findings 2. Interdental brushing compared to flossing for periodontal diseases and dental caries in adults

Interdental brushing compared to flossing for periodontal diseases and dental caries in adults

Patient or population: Adults, 16 years and older
Settings: Everyday self care
Intervention: Interdental brushing plus toothbrushing
Comparison: Flossing plus toothbrushing

Outcomes

Illustrative comparative risks* (95% CI)

Relative effect
(95% CI)

No of participants
(studies)

Quality of the evidence
(GRADE)

Comments

Assumed risk

Corresponding risk

Flossing

IDB

Gingivitis
Score 0 or 1 Scale from: 0 to 1
Follow‐up: mean 1 month (4 to 6 weeks)

The mean gingivitis in the flossing groups was
0.23 points1

The mean gingivitis in the intervention groups was
0.53 standard deviations lower
(0.81 to 0.24 lower)

390
(7 studies)

⊕⊕⊝⊝
low2,3

The estimate is for the 1‐month (4 to 6 weeks) time point and converts back to 52% reduction (of control mean) for IDB (based on 1 study). Results (based on 2 studies, very low‐quality evidence) at 3 months show a large SMD but we are unable to draw conclusions on the effect due to the wide confidence interval including no effect

Periodontitis

Not estimable

0
(0)

See comment

No included study assessed clinical attachment loss, a measure of progression of periodontitis

Plaque
Scale from 0 to 3
Follow‐up: mean 1 month (4 to 6 weeks)

The mean plaque in the flossing groups was
1.23 points4

The mean plaque in the intervention groups was
0.10 standard deviations higher
(0.13 lower to 0.33 higher)

326
(7 studies)

⊕⊕⊝⊝
low2,3,5

The estimate is for the 1‐month (4 to 6 weeks) time point, and converts back to 2% reduction (of control mean) for IDB (based on 1 study). The effect for the 3 months time point somewhat differs, with a large SMD but we are unable to draw conclusions on the effect due to the wide confidence interval including no effect (based on 2 studies, very low‐quality evidence)

Interproximal caries

Not estimable

0
(0)

See comment

No included study assessed caries as an outcome

Harms and adverse outcomes

Not estimable

0
(0)

See comment

2 studies reported adverse outcomes in terms of problems with the use of the assigned interdental cleaning aids. We were unable to pool data

Bad breath

(halitosis)

Not estimable

0
(0)

See comment

No included study assessed bad breath as an outcome

Quality of life

Not estimable

0
(0)

See comment

No included study assessed quality of life as an outcome

*The basis for the assumed risk (e.g. the median control group risk across studies) is provided in footnotes. The corresponding risk (and its 95% confidence interval) is based on the assumed risk in the comparison group and the relative effect of the intervention (and its 95% CI).
CI: confidence interval; IDB: interdental brushing; RR: risk ratio; SMD: standardised mean difference

GRADE Working Group grades of evidence
High quality: Further research is very unlikely to change our confidence in the estimate of effect.
Moderate quality: Further research is likely to have an important impact on our confidence in the estimate of effect and may change the estimate.
Low quality: Further research is very likely to have an important impact on our confidence in the estimate of effect and is likely to change the estimate.
Very low quality: We are very uncertain about the estimate.

1Re‐expressed from SMD into Eastman Interdental Bleeding Index score. The results should be interpreted with caution since back‐translation of the effect size is based on the results of only one study (Jackson 2006). The estimate is for the one‐month time point with a SMD of ‐0.53. A larger effect was observed for the three months time point with a SMD of ‐1.98.
2Three studies at high risk of bias, three unclear. Two studies were industry‐sponsored, whilst in three studies the source of funding was not declared.
3Heterogeneity I2 = 85%, P value < 0.001.
4Re‐expressed from the SMD into the Silness and Löe Plaque Index score. Results should be interpreted with caution since back‐translation of the effect size is based on the results of only one study (Imai 2011). The estimate is for the one‐month time point, with a SMD of 0.10. The three months time point shows a larger effect with a SMD of ‐2.14.
5Imprecision is due to heterogeneity, which we have already downgraded for.

Figuras y tablas -
Summary of findings 2. Interdental brushing compared to flossing for periodontal diseases and dental caries in adults
Table 1. Means and standard deviations (SD); gingivitis

Study

Time

Interdental brushing

Floss

n

Mean

SD

n

Mean

SD

Christou 1998*

6 weeks

26

0.83

0.18

26

0.86

0.15

Imai 2011*

6 weeks

29

0.11

0.03

29

0.17

0.04

12 weeks

30

0.08

0.02

30

0.2

0.04

Ishak 2007*

4 weeks

10

0.056

0.0479

10

0.081

0.0506

Jackson 2006

6 weeks

39

0.14

0.15

38

0.23

0.22

12 weeks

39

0.1

0.11

38

0.16

0.17

Jared 2005

4 weeks

30

1.03

0.57

29

1.29

0.7

Yankell 2002

4 weeks

31

1.21

0.27

31

1.41

0.39

Yost 2006

6 weeks

31

0.78

0.83**

31

0.95

0.83*

28

0.91

0.79*

*Split‐mouth studies.

**The standard deviations in the Yost 2006 study were calculated from standard errors reported within graphs in the study report.

Figuras y tablas -
Table 1. Means and standard deviations (SD); gingivitis
Table 2. Means and standard deviations (SD); plaque

Study

Time

Interdental brushing

Floss

n

Mean

SD

n

Mean

SD

Christou 1998*

6 weeks

26

2.15

0.99

26

2.47

0.86

Imai 2011*

6 weeks

29

1.23

0.18

29

1.23

0.18

12 weeks

30

1.26

0.24

30

1.28

0.22

Ishak 2007*

4 weeks

10

0.057

0.0221

10

0.053

0.0306

Jackson 2006

6 weeks

39

0.68

0.28

38

1

0.36

12 weeks

39

0.72

0.37

38

0.96

0.4

Jared 2005

4 weeks

30

2.02

0.77

29

2.23

0.83

Yankell 2002

4 weeks

31

1.67

0.29

31

1.71

0.28

Yost 2006

6 weeks

31

1.84

1.1**

31

2.06

1.1*

28

1.98

1.05*

*Split‐mouth studies.

**The standard deviations in the Yost 2006 study were calculated from standard errors reported within graphs in the study report.

Figuras y tablas -
Table 2. Means and standard deviations (SD); plaque
Comparison 1. Interdental brushing versus flossing

Outcome or subgroup title

No. of studies

No. of participants

Statistical method

Effect size

1 Gingivitis at 1 month Show forest plot

7

Std. Mean Difference (Random, 95% CI)

‐0.53 [‐0.81, ‐0.24]

1.1 Trained interdental brushing

6

Std. Mean Difference (Random, 95% CI)

‐0.52 [‐0.83, ‐0.21]

1.2 Untrained interdental brushing

1

Std. Mean Difference (Random, 95% CI)

‐0.62 [‐1.13, ‐0.11]

2 Gingivitis at 3 months Show forest plot

2

Std. Mean Difference (Random, 95% CI)

‐1.98 [‐5.42, 1.47]

3 Plaque at 1 month Show forest plot

7

Std. Mean Difference (Random, 95% CI)

0.10 [‐0.13, 0.33]

3.1 Trained interdental brushing

6

Std. Mean Difference (Random, 95% CI)

0.13 [‐0.12, 0.38]

3.2 Untrained interdental brushing

1

Std. Mean Difference (Random, 95% CI)

‐0.14 [‐0.63, 0.36]

4 Plaque at 3 months Show forest plot

2

Std. Mean Difference (Random, 95% CI)

‐2.14 [‐5.25, 0.97]

Figuras y tablas -
Comparison 1. Interdental brushing versus flossing