نقش مداخلات حمایتی برای افزایش مصرف غذا در افراد مبتلا به سوءتغذیه یا بزرگسالان در معرض خطر سوءتغذیه
چکیده
پیشینه
مداخلات حمایتی مانند خوردن غذا در یک اتاق ناهارخوری یا استفاده از دستیاران برای تغذیه بیماران غالبا برای مدیریت افراد در معرض خطر سوءتغذیه توصیه میشود. چنین مداخلاتی در بسیاری از دستورالعملها و سیاستگذاریها لحاظ شده است، این مداخلات پیامدهایی برای زمان کارکنان دارد، یعنی احتمالا در وقت آنها صرفهجویی میشود، اما ممکن است موجب هزینههای اضافی شود، با این حال هنوز به نظر میرسد شواهدی برای اثربخشی آن وجود ندارد.
اهداف
ارزیابی تاثیرات مداخلات حمایتی برای افزایش مصرف غذا در افراد مبتلا به سوءتغذیه یا بزرگسالان در معرض خطر سوءتغذیه.
روشهای جستوجو
انتشارات مربوطه را با انجام یک جستوجوی جامع در کتابخانه کاکرین،MEDLINE؛ Embase؛ AMED؛ British Nursing Index؛ CINAHL؛ SCOPUS؛ بانک اطلاعاتی ISI Web of Science، و با بررسی موشکافانه در فهرست منابع کارآزماییهای وارد شده و مرورهای سیستماتیک مربوطه و با جستوجوی دستی چکیده مقالات نشستها و کنفرانسهای مرتبط شناسایی کردیم. زمان آخرین جستوجوی ما در همه این بانکهای اطلاعاتی، 31 مارچ 2013 بود. جستوجوهای اضافی از CENTRAL؛ MEDLINE؛ ClinicalTrials.gov و WHO ICTRP تا سپتامبر 2016 انجام شد. زمان آخرین جستوجو در این بانکهای اطلاعاتی 14 سپتامبر 2016 بود.
معیارهای انتخاب
معیار انتخاب ما کارآزماییهای تصادفیسازی و کنترل شده بود که در آنها مداخلات حمایتی با هدف افزایش مصرف غذا در افراد در معرض خطر سوءتغذیه با مراقبتهای معمول مقایسه شده بود.
گردآوری و تجزیهوتحلیل دادهها
سه نویسنده مرور و سردبیر ‐ برای جستوجوی نهایی ‐ کارآزماییها را با توجه به عناوین و چکیده مقالات انتخاب کرده و بهطور مستقل از هم، واجد شرایط بودن کارآزماییهای وارد شده را برای ورود به این مرور ارزیابی کردند. دو نویسنده مرور بهطور مستقل از هم دادهها را استخراج، و خطر سوگیری (bias) را ارزیابی کردند، آنها همچنین کیفیت کلی شواهد را با استفاده از ابزار درجهبندی توصیه، ارزیابی، توسعه و ارزشیابی (GRADE) بررسی کردند، سپس برای ورود دادهها به این مرور موافقت کردند. احتمال ناهمگونی بالینی میان کارآزماییها بالا بود چون کارآزماییها در جمعیتهایی با زمینههای بالینی کاملا متفاوت و در وضعیتهایی با مراقبتسلامت متفاوت انجام شده بودند، همچنین علیرغم گروهبندی مداخلات مشابه، مداخلات به طور قابل توجهی متنوع بودند. بنابراین ما متاآنالیزها (meta‐analysis) را برای معیارهای پیامدهای «مورتالیتی به هر علتی»، «بستری شدن در بیمارستان» و «وضعیت غذایی» (با توجه به تغییر وزن) انجام دادیم.
نتایج اصلی
چهلویک کارآزمایی (10,681 شرکتکننده) معیارهای ورود به مرور را داشتند. کارآزماییها بر طبق مداخلات مشابه گروهبندی شدند، این مداخلات عبارت بودند از: تغییرات بر اساس سازماندهی مراقبتهای تغذیهای (3456 شرکتکننده؛ N = 13)، تغییرات بر اساس محیط غذاخوری (351 شرکتکننده؛ N = 5)، تغییر و اصلاح پروفایل یا الگوی غذایی (649 شرکتکننده؛ N = 12)، مکملهای غذایی اضافی (6022 شرکتکننده؛ N = 10)، سیستمهای تحویل غذا به خانه (203 شرکتکننده؛ N = 1). پیگیری شرکتکنندگان از مدت زمانی که در بیمارستان بودند تا 12 ماه متغیر بود.
کیفیت کلی شواهد پائین تا متوسط بود، و خطر سوگیری در چندین حوزه وجود داشت؛ به این دلیل خطر سوگیری در اکثریت کارآزماییها نامشخص بود. خطر نسبی (RR) برای مورتالیتی به هر علتی 0.78 بود (95% فاصله اطمینان (CI): 0.66 تا 0.92)؛ 0.004 = P؛ 12 کارآزمایی؛ 6683 شرکتکننده؛ شواهد با کیفیت متوسط. این بدین معنی است که 26 مورد مرگومیر در هر 1000 شرکتکننده کمتر شده است (95% CI؛ 9 تا 41) و این به نفع مداخلات حمایتی است. RR برای تعداد شرکتکنندگان با هر عارضه پزشکی از 1.42 به نفع گروه کنترل در مقایسه با 0.59 به نفع مداخلات حمایتی متنوع بود (شواهد با کیفیت بسیار پائین). فقط پنج کارآزمایی (4451 شرکتکننده) کیفیت زندگی مرتبط با سلامت را بررسی کرده بودند و هیچ تفاوت اساسی میان گروه مداخله و مقایسه کننده مشاهده نشد. اطلاعات درباره رضایت بیماران غیر‐قابل اعتماد بود. تاثیرات مداخلات حمایتی در برابر مقایسه کنندهها برای پیامد بستری در بیمارستان به این صورت است: تفاوت میانگین (MD): 0.5‐ روز؛ (95% CI؛ 2.6‐ تا 1.6)؛ 0.65 = P؛ 5 کارآزمایی؛ 667 شرکتکننده؛ شواهد با کیفیت بسیار پائین. فقط در سه مورد از 41 کارآزمایی وارد شده (4108 شرکتکننده؛ شواهد با کیفیت بسیار پائین)، عوارض جانبی گزارش شده بود؛ به صورت عدم تحمل مکملها (اسهال، استفراغ، 5/34 شرکتکننده) و قطع مکمل غذایی خوراکی به دلیل امتناع از خوردن یا دوست نداشتن مزه غذا (567/2017 شرکتکننده). متاآنالیز 17 کارآزمایی با دادههای کافی برای تغییر وزن، بهبودی کلی در وزن را به نفع مداخلات حمایتی در برابر گروه کنترل نشان داد: MD: 0.6 کیلوگرم (95% CI؛ 0.21 تا 1.02)؛ 2024 شرکتکننده؛ شواهد با کیفیت متوسط. در مجموع 27 کارآزمایی مصرف غذا را بررسی کرده بودند که یافتههای اکثر مطالعات تفاوت مشخصی را در گرفتن انرژی بین گروه مداخله و مقایسه کننده نشان ندادند. فقط سه کارآزمایی (1152 شرکتکننده) دادههایی را درباره هزینههای اقتصادی گزارش کرده بودند اما از روشهای اقتصاد سلامت پذیرفته شده استفاده نکرده بودند (شواهد با کیفیت بسیار پائین).
نتیجهگیریهای نویسندگان
شواهد با کیفیت متوسط تا بسیار پائین نشان میدهند که مداخلات حمایتی باعث بهبود مراقبتهای تغذیهای و حداقل وزنگیری میشود. بیشتر شواهد مربوط به خطر پائین مورتالیتی به هر علتی برای مداخلات حمایتی، از کارآزماییهای بیمارستان‐محور به دست میآید و پژوهش بیشتری نیاز است تا این تاثیر را تایید کنند. در رابطه با عوارض جانبی، شواهد با کیفیت بسیار پائین وجود داشت، بنابراین در حالی که برخی از این مداخلات توسط پزشکان در سطح ملی حمایت شدهاند، باید فقدان شواهد واضح برای حمایت از نقش آنها شناسایی شود. این مرور اهمیت ارزیابی پیامدهایی را که از نظر بیمار مهم هستند، در پژوهشهای بعدی برجسته میسازد.
PICO
خلاصه به زبان ساده
مداخلات حمایتی برای بهبود مصرف غذا در افراد در معرض خطر سوءتغذیه
سوال مطالعه مروری
آیا مداخلات حمایتی برای بهبود تغذیه در افراد در معرض خطر سوءتغذیه (افراد مبتلا به سوءتغذیه یا افراد در معرض خطر) موثر است؟
پیشینه
سرو غذا در اتاق ناهارخوری یا استفاده از دستیار برای کمک به تغذیه افراد نیازمند و روشهای مشابه دیگر غالبا برای کمک به افرادی که وزن از دست دادهاند یا احتمالا از دست خواهند داد (افراد در معرض خطر سوءتغذیه) خصوصا در افراد بیمار و سالخورده، توصیه میشود. این مداخلات حمایتی در مراقبتهای سلامت در بسیاری از کشورها استفاده میشود، اما تاثیرات آنها به صورت دقیق بررسی نشده است.
ویژگیهای مطالعه
ما 41 مطالعه تصادفیسازی و کنترل شده (مطالعاتی بالینی که در آنها افراد بهطور تصادفی در یکی از دو یا چند گروه درمان قرار میگیرند) را با 10,681 فرد در مرور خود وارد کردیم. پنج مداخله متفاوت وجود داشت که آنها را «مداخلات حمایتی» نامیدیم، این مداخلات عبارت بودند از: تغییرات بر اساس سازماندهی مراقبتهای تغذیهای (3456 نفر؛ 13 مطالعه)، تغییرات بر اساس محیط غذاخوری (351 نفر؛ 5 مطالعه)، تغییر و اصلاح پروفایل یا الگوی غذایی (649 نفر؛ 12 مطالعه)، مکملهای غذایی اضافی (6022 نفر؛ 10 مطالعه)، سیستمهای تحویل غذا به خانه (203 نفر، 1 مطالعه). پایش شرکتکنندگان در طول زمان (پیگیری) از «زمان بستری در بیمارستان» تا 12 ماه متغیر بود. گروه مقایسه کننده، مراقبتهای معمول را دریافت میکردند. بیشتر از نیمی از شرکتکنندگانی که در مطالعات حاضر بودند، از نظر مکملهای غذایی اضافی بررسی شدند (مثلا مصرف مکملهای انرژیزای پروتئینی خوراکی علاوه بر رژیم معمول).
نتایج کلیدی
مداخلات حمایتی برای افزایش مصرف غذا در افراد در معرض خطر سوءتغذیه ممکن است مرگومیر به هر علتی را کاهش دهد (تقریبا به ازای هر 1000 شرکتکننده، 23 مورد در گروه مداخلات حمایتی کمتر است). اما این مسئله باید با شواهد بیشتری از کارآزماییهای تصادفیسازی و کنترل شده با کیفیت بالا تایید شود. تعداد شرکتکنندگانی که دچار عوارض پزشکی شدند، در گروه مداخلات حمایتی با گروه مقایسه کننده تفاوتی نداشتند. همین نکته (یعنی عدم تفاوت در هر دو گروه) برای کیفیت زندگی مرتبط با سلامت (یعنی سلامت جسمانی، روانی، عاطفی و اجتماعی)، رضایت بیمار، دریافت انرژی یا غذا و تعداد روزهای بستری شده در بیمارستان، صادق بود. هزینههای اقتصادی به خوبی بررسی نشد.
فقط سه مطالعه عوارض جانبی را گزارش کردند، به صورت عدم تحمل مکمل غذایی (مانند اسهال یا استفراغ در 5 نفر از 34 شرکتکننده) و قطع مصرف مکملهای غذایی به دلیل امتناع از خوردن یا دوست نداشتن مزه آنها (567 نفر از 2017 شرکتکننده) تعریف شد.
بعد از تجزیهوتحلیل 15 مطالعه با 1945 شرکتکننده ما دریافتیم که مداخلات حمایتی نسبت به مقایسه کنندهها تاثیر مفیدی روی وزن دارند: یعنی به طور میانگین افرادی که در گروه مداخلات حمایتی قرار داشتند 0.6 کیلوگرم بیشتر از افراد در گروهای مقایسه کننده افزایش وزن داشتند.
این شواهد تا سپتامبر 2016 بهروز است.
کیفیت شواهد
کیفیت کلی شواهد از متوسط تا بسیار پائین متغیر بود، دلیل آن یا این بود که برای اکثر پیامدهای مد نظر ما تنها مطالعات و شرکتکنندگان اندکی با اطلاعات قابل اعتماد وجود داشت، یا این بود که خطر سوگیری (bias) باعث میشد نتایج نامطمئن باشند. اما اگر مطالعات تصادفیسازی و کنترل شده با خطر پائین سوگیری برای پیامدهای مهم از نظر بیمار و با تعداد مناسبی شرکتکننده انجام شود، این مرور میتواند راهنمای خوبی برای بهتر شدن مراقبت سلامت ارائه کند.
Authors' conclusions
Summary of findings
| Supportive interventions compared with usual care for malnourished or nutritionally at‐risk adults | ||||||
| Population: malnourished or nutritionally at‐risk adults | ||||||
| Outcomes | Illustrative comparative risks* (95% CI) | Relative effect | No of participants | Quality of the evidence | Comments | |
| Usual care | Supportive interventions | |||||
| All‐cause mortality | 133 per 1000 | 107 per 1000 (92 to 124) | RR 0.78 | 6683 (12) | ⊕⊕⊕⊝ | ‐ |
| Morbidity/complications (number of participants with any medical complication) Follow‐up: duration of hospital stay to 6 months | See comment | See comment | See comment | 4015 (5) | ⊕⊝⊝⊝ | No summary effect size calculated because of high inconsistency; RR ranged from 0.59 in favour of supportive interventions to 1.42 in favour of usual care |
| Health‐related quality of life and patient satisfaction Follow‐up: duration of hospital stay to 12 months | See comment | See comment | See comment | 4451 (5) | ⊕⊕⊝⊝ | 5/41 trials investigated health‐related quality of life using different instruments in participants from a wide range of different clinical backgrounds; overall we noted no substantial differences between intervention and comparator groups 2/41 trials investigated patient satisfaction by means of an unvalidated questionnaire |
| Hospitalisation and institutionalisation (days) | The mean hospitalisation ranged across control groups from 10 days to 40 days | The mean hospitalisation in the intervention groups was | ‐ | 667 (5) | ⊕⊝⊝⊝ | 3/5 trials with data on hospitalisation were in the group of trials of 'Changes to the organisation of nutritional care' |
| Adverse events Follow‐up: 8 days to 6 months | See comment | See comment | See comment | 4108 (3) | ⊕⊝⊝⊝ | Only 3/41 trials reported on adverse events (all evaluating the impact of supplementation of meals with oral nutritional supplements); 1 trial reported intolerance to the supplement (diarrhoea, vomiting) in 3/34 (15%) of participants. In another large trial 565/2017 (28%) of stroke patients stopped taking the oral nutritional supplements because of refusal or dislike of taste |
| Nutritional status (weight change in kg) | The mean weight change ranged across control groups from ‐3.0 kg to +0.3 kg | The mean weight change in the intervention groups was +0.6 kg higher (0.2 kg to 1.0 kg higher) | ‐ | 2024 (17) | ⊕⊕⊕⊝ | ‐ |
| Economic costs Follow‐up: duration of hospital stay to 12 months | See comment | See comment | See comment | 1152 (3) | ⊕⊝⊝⊝ | 3/41 trials evaluated and 2/41 trials reported some data on economic costs; none of the trials used accepted health economic methods and the reported data on both costs and effectiveness were generally poor |
| *The basis for the assumed risk (e.g. the median control group risk across trials) is provided in footnotes. The corresponding risk (and its 95% confidence interval) is based on the assumed risk in the comparison group and the relative effect of the intervention (and its 95% CI). | ||||||
| GRADE Working Group grades of evidence | ||||||
| *aAssumed risk was derived from the event rates in the comparator groups (usual care) aDowngraded by one level because of risk of bias in several risk of bias domains | ||||||
Background
Malnutrition in patients admitted to hospital was initially recognised in the 1970s (Butterworth 1974;McWhirter 1994). In recent years, malnutrition in the community has also been reported (Elia 2009). Whether in the hospital or the community, malnutrition is associated with poor clinical outcome, decreased health‐related quality of life and increased mortality (Kubrak 2007; Norman 2008; Stratton 2003).
Malnutrition is both a cause and consequence of ill health (Lean 2008) and its aetiology is complex. It predisposes to illness but is also a consequence of illness (NCCAC 2006), creating a vicious, self‐perpetuating cycle of malnutrition and infection (Scrimshaw 2003). People who are undernourished on admission to hospital, who do not receive adequate nutritional care, experience decline in their nutritional status (McWhirter 1994). While in hospital, the reasons for further poor intakes and subsequent weight loss may include temporary starvation for medical procedures, difficulty in feeding, lack of nursing supervision during mealtimes, depression, unpalatable foods and disease‐ or drug‐induced anorexia (Kelly 2000; Lennard‐Jones 1992). At home, in addition to the effects of illness and its management, sub‐optimal nutritional status may be due to practical challenges, such as lack of transport, difficulties in grocery shopping, or difficulties utilising cooking facilities, resulting in diets of poor nutritional quality. Social and psychological issues also have a significant impact. The factors that contribute to malnutrition in hospital and community patients have been described extensively elsewhere (Lennard‐Jones 1992; NCCAC 2006).
Nutrition intervention and treatment of malnutrition has been recommended in clinical guidelines from many countries based on associations between improved dietary intake and nutritional status, health‐related quality of life and functional outcomes (Mueller 2011; NCCAC 2006). Therefore, it is recommended that at the first sign of malnutrition or risk of malnutrition, a full nutritional assessment and appropriate nutritional intervention should follow (Mueller 2011; NCCAC 2006). As the causes of malnutrition are multifactorial, the interventions designed to treat malnutrition are likely to be complex. This merits an understanding of the multidimensional causes of malnutrition and the complex support strategies needed across a range of healthcare services from the strategic policy level down to the individual feeding of a patient (Weekes 2009).
Description of the condition
Despite the absence of universally accepted diagnostic criteria, a widely quoted definition describes malnutrition as the nutritional state in which an energy, protein or nutrient deficiency, excess or imbalance leads to adverse effects on body or tissue form (body shape, size and composition) and function, as well as clinical outcome (Elia 2003). The recently convened International Guideline Consensus Committee categorised malnutrition as, "starvation‐related malnutrition" in cases of chronic starvation in the absence of inflammation, "chronic disease‐related malnutrition" where there is chronic but mild‐to‐moderate inflammation and, "acute disease or injury‐related malnutrition" where there is acute severe inflammation (Jensen 2010). While this provides a useful aetiological classification of malnutrition and recognises the effect of illness on nutritional status, there remain no clear criteria for how each category might be identified in practice. Nutrition screening is often used to detect risk factors known to be associated with nutritional complications (McMahon 2000) such as recent, unintentional weight loss; inadequate food intake; disease‐related anorexia; low body weight, body mass index (BMI) or lean body mass; in order to decide whether a full nutritional assessment is indicated (Elia 2003). Nutrition screening tools commonly employ a standard pro forma to determine nutritional risk. The included parameters are intended to determine whether an individual is nutritionally at risk on the basis of a score, which determines the course of action (Green 2006; Jones 2002). Many tools suggest suitable action plans that may involve nutritional intervention. Nutritional assessment is a more comprehensive investigation including anthropometric measurements, biochemical tests, clinical examination and dietary intake monitoring, used to determine whether an individual is malnourished or likely to become malnourished (at risk of malnutrition) (Corish 2000a; McMahon 2000). Nutritional assessment is usually followed by appropriate nutritional intervention (Corish 2000a; McMahon 2000).
The absence of clear and universally accepted criteria for the diagnosis of malnutrition further complicates the interpretation of prevalence data and intervention trials. Major classic and more recent trials that assessed the prevalence of malnutrition in hospitals have estimated a prevalence of between 11% and 50% depending on the criteria used (Bistrian 1974; Corish 2000a; Corish 2000b; Edington 2000; Hill 1977; Kelly 2000; McWhirter 1994; Naber 1997). The variation in reports of prevalence result largely from differences in the definitions used to identify malnutrition across trials. In 2008, the nutrition screening week carried out by the British Association for Parenteral and Enteral Nutrition (BAPEN), which uses a standardised tool to assess nutritional risk status, demonstrated that malnutrition was present in nearly a third of people admitted to hospital, in just over a third of people admitted to care homes and in a fifth of people admitted to mental health units (Elia 2009). Furthermore, it has been estimated that at any given time over three million people in the UK are thought to be malnourished or at risk of malnutrition with the vast majority of these (93%) living at home (Elia 2009). In Australia, a survey that used a different nutrition screening tool to screen 3122 participants in the acute hospital setting, revealed that 41% of participants were "at risk" of malnutrition, with an overall prevalence of malnutrition of 32% (Agarwal 2011).
The clinical consequences of malnutrition are believed to include reduced muscle strength; failure of the respiratory, thermoregulatory, pancreatic, gastrointestinal, mental, endocrine, and cardiovascular systems; as well as impaired wound healing and poor clinical outcomes from surgical procedures or illness (Allison 2000; Corish 2000a; Lennard‐Jones 1992). Wounds that heal more slowly become much more vulnerable to infection. Immune function is impaired, compounding constraints on the body from other disease states, constituting a much reduced resistance to infection (Corish 2000a). Respiratory muscle wasting may also predispose to infections if patients are unable to cough and expectorate effectively (Lennard‐Jones 1992). Pressure sores may develop as mobility is reduced (Lennard‐Jones 1992) and as the body becomes thinner and wasted. Arguably, the effects of malnutrition on the musculoskeletal system extend beyond the gain or loss of lean body tissue, but may incur metabolic changes in cellular electrolytes including calcium accumulation, which may prevent optimal muscle function (Jeejeebhoy 1986). Furthermore, excretory systems may fail to regulate body sodium‐water balance efficiently and may result in excess fluid retention and oedema (Allison 2000), which has reportedly been detected in 17% of malnourished people admitted to hospital (Weekes 1999). As disease further impinges on appetite (Allison 2000), malnutrition will progress and the clinical implications aforementioned will occur much more quickly in ill people than in healthy individuals (Corish 2000a).
In addition to the clinical and social consequences, the economic impact of malnutrition is considerable. The increasing costs have become an economic burden for healthcare systems in many countries. Recent data from the UK suggest that malnutrition costs in excess of GBP 7.3 billion each year (EURO 8.74 billion/year ‐ December 2011 conversion) (DOH 2007; Russell 2007). Poor clinical outcomes, such as extended hospital stays, increased medical complications, reduced health‐related quality of life and slow disease recovery, all contribute to rising hospital and home care costs (Gallagher 1996; Russell 2007; Stratton 2003). Malnourished patients stay in hospital for longer, are three times more likely to develop complications during surgery and have a higher mortality than adequately nourished patients (DOH 2007). Furthermore, those considered at risk of malnutrition are much more likely to require home healthcare services after discharge from hospital than those considered not at risk (Chima 1997). Malnutrition in the community has also been shown to increase the need for healthcare resources such as general practitioner (GP) visits, hospital admissions and new prescriptions, in addition to contributing to an increased risk of mortality (Martyn 1998). Therefore, if healthcare economics is considered, an undernourished patient imposes a greater economic burden on health services than a patient whose nutritional status is well maintained (Lennard‐Jones 1992).
Description of the intervention
This review seeks to determine whether effective clinical management of malnutrition in both hospital and community settings requires more than just the provision of nutrients, dietary advice, or a combination, and whether additional strategies to support these existing approaches to ensure overall nutritional care is optimal, is worthy of consideration. The specific types of interventions considered are listed in Table 1. Related interventions include the sole use of oral nutritional supplements, dietary counselling or strategies, or a combination to manage malnutrition.
| Supportive nutritional care intervention Broad intervention category | Examples |
| 1. Changes to the organisation of nutritional care |
|
| 2. Changes to the feeding environment |
|
| 3. Modification of meal profile or pattern |
|
| 4. Additional supplementation of meals |
|
| 5. Congregate and home meal delivery systems |
|
Guidelines exist for the identification, regular monitoring and initiation of nutritional support in individuals who may be malnourished or at nutritional risk. These include UK clinical guidelines for nutritional screening and support in adults (NCCAC 2006), Essence of Care benchmarks for food and nutrition from the UK Department of Health (DOH 2003), and the American Society for Parenteral and Enteral Nutrition (ASPEN) guidelines on nutrition screening, assessment and intervention in adults (Mueller 2011).
The strategies most frequently used to treat malnutrition in individuals requiring nutritional support aim to increase energy and nutrient intake by means of the following.
-
Dietary counselling – provision of nutritional advice to increase nutrient intake, requiring an individual to understand and act upon instructions given. This approach may include providing advice on food fortification, to increase the energy density of foods without increasing quantity, or dietary fortification, to increase the energy density of the diet by adding extra snacks or drinks between meals.
-
Oral nutritional supplements – available in either liquid or solid forms. These usually provide a mixture of macro‐ and micronutrients and may be nutritionally complete in a specified volume and are often available in the form of commercial supplement products.
-
Artificial nutrition support ‐ includes enteral tube feeds and parenteral nutrition that are used when oral intake is not possible.
The efficacy of nutritional support interventions has been the subject of much previous research but so far has focused primarily on the use of oral nutritional supplements, which may be applicable to only a minority of people (Weekes 2009). There are more than 20 systematic reviews in the literature of oral nutritional supplement‐based interventions in the management of malnutrition (Stratton 2007). The findings are variable with some reviews showing clinical and nutritional benefits (Stratton 2007). However, these findings are by no means consistent and the patient groups most likely to benefit from this type of intervention remain to be characterised (Stratton 2007). Despite this, there has been a consistent trend to use oral nutritional supplements in clinical practice but the high cost implications of this approach, especially in the community as recently highlighted in a UK report (LPP 2009), makes the consideration of alternative approaches worthwhile. There has been an increased focus on the routine provision of food and drink as part of nutritional care since the 10 key characteristics of good nutritional care in hospital were published (COE 2003). Forty‐five trials have examined the role of food‐based interventions with or without oral nutritional supplements in the management of poor dietary intake (Baldwin 2011). The findings suggested that although dietary counselling may result in improvements in weight, body composition and muscle function, trials were heterogeneous and of variable quality with no evidence of benefit on mortality (Baldwin 2011). These trials have concentrated on interventions that rely on the patient receiving and acting on instructions to enhance their nutritional intake (i.e. dietary counselling). Despite the body of clinical evidence supporting the appropriate use of oral nutritional supplements and previous research around dietary counselling, whether additional supportive interventions are clinically effective in the management of malnutrition or the risk of malnutrition, remains unknown.
The Council of Europe and the UK Department of Health highlighted the importance of overall nutritional care including, among other supportive initiatives: mandatory nutritional screening, adequate provision of food and drink, oral supplements, modified diets, assistance with feeding and changes to the dining environment (COE 2003; DOH 2007). Such interventions have been incorporated into guidelines and healthcare policies and aim to improve nutritional intake by modifying aspects of food provision (e.g. the use of protected mealtimes, red tray initiatives (to identify those requiring mealtime assistance) and feeding assistance) or by adjusting the portion size and nutrient content of foods and enhancing the flavour, however, evidence of benefit of such initiatives is lacking.
Adverse effects of the intervention
The possible adverse effects of the supportive nutritional care interventions considered in this review may include but are not limited to the following events: provision of incorrect nutritional supplement, provision of incorrect between‐meal snacks, gastrointestinal effects due to intolerance of supplements/extra snacks/drinks (e.g. bloating, vomiting or diarrhoea), potential accidents occurring as a result of the intervention such as a patient falling on the way to a dining area in a change of dining environment intervention, inappropriate moving and handling by untrained staff trying to obtain a weight or height measure, inappropriate screening or intervention (e.g. during end of life).
How the intervention might work
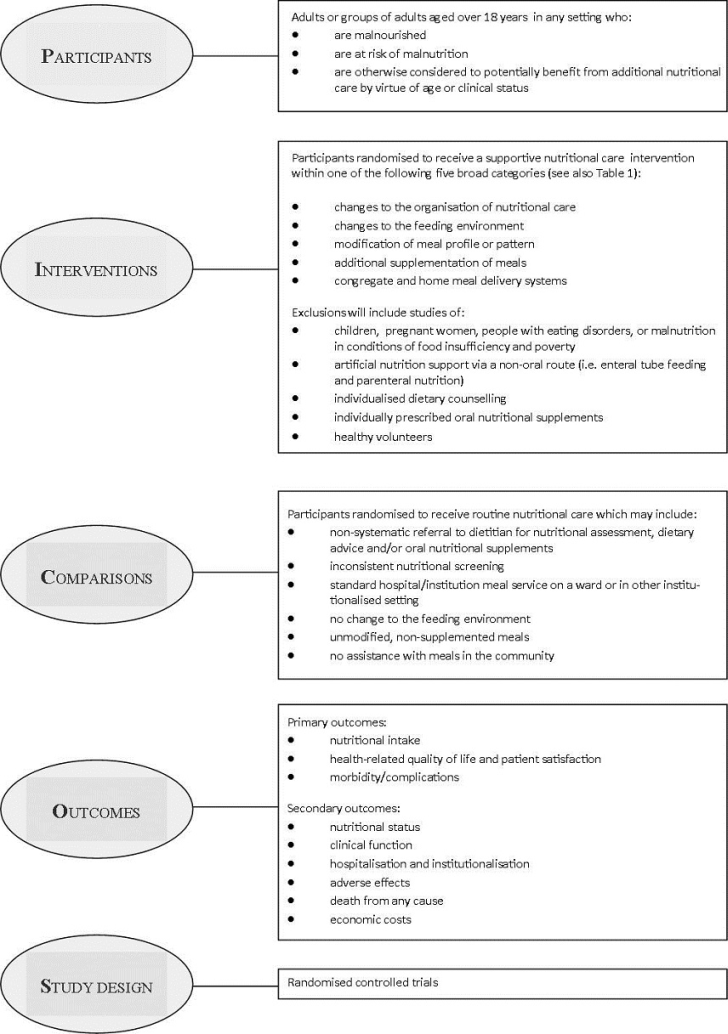
As recommended in the PRISMA statement (Liberati 2009), a conceptual framework highlighting the participants, interventions, comparisons, outcomes and trial design (PICOS) considered for this review, is illustrated (Figure 1).
The treatment of malnutrition aims to reverse its effects, including the physical and functional impairments, and the provision of appropriate nutritional care may involve several approaches. The factors that influence our experiences with food are complex and nutritional care interventions aimed at the management of malnutrition or nutritional risk may need to address more than the provision of energy (calories). The biological and symbolic dimensions of food are inseparable and a socio‐anthropological perspective suggests an intimate yet dynamic relationship between consumption of food and perceptions of self (Lupton 1996). The meaning of food extends beyond its mere nutritive value as it can have a tremendous impact on a person's sense of independence, self‐esteem, well‐being and health‐related quality of life, especially in elderly people (Donini 2003). Indeed, experiences with food have important implications for the emotional and psychological well‐being of an individual that sit within a traditional, cultural, socioeconomic and religious context and ultimately determines our food preferences (Donini 2003; Khan 1981; Lupton 1996). In severe illness, coping mechanisms, sense of body image, value of social networks and support, and personal symbolism may all be affected and food may take on new meaning (McQuestion 2011). Overall, this represents a challenge to health professionals and merits a deeper understanding of what really impacts on our experiences with food. Taking this into account, interventions that enhance the food experiences of malnourished individuals or those at risk of malnutrition by supporting their ability to take the intervention, thereby improving compliance, should theoretically result in greater dietary intakes and improved outcomes. Furthermore, the benefits of such interventions may extend beyond the conventional clinical, nutritional or functional outcomes and could conceivably also improve patient‐satisfaction and perceived health‐related quality of life. Indeed, following improvements in nutritional intake there may also be psychological and social benefits in individuals who are malnourished or at risk of malnutrition (NCCAC 2006). To summarise the mode of action, supportive nutritional care interventions should theoretically increase intake of micro‐ and macro‐nutrients and, in turn, improve the nutritional status and clinical function of nutritionally at‐risk individuals. By this, mortality, morbidity and hospitalisation are expected to be lowered. Considering the beneficial effects on physical health and the symbolic dimensions of food, health‐related quality of life should also improve.
Why it is important to do this review
A Cochrane systematic review of protein and energy supplementation in individuals over 65 years at risk from malnutrition contains 62 trials with a total of 10,187 randomised participants and the authors concluded that supplementation led to small but consistent weight gain in older people, and reductions in mortality in those who were undernourished (Milne 2009). There was no evidence of benefit to complications, functional status or length of hospital stay (Milne 2009). Interventions considered focused primarily on dietary supplementation with commercial sip feeds, milk‐based supplements and via the fortification of normal food sources (Milne 2009), rather than the array of supportive nutritional care interventions of interest to this review. In addition, the review included both randomised and quasi‐randomised trials (e.g. allocation by alternation, day of week, date of birth) (Milne 2009). It is acknowledged that the complex nature of the interventions in this area may result in trials that lack robust design and their inclusion may best represent the body of evidence available. However, meaningful conclusions may be more difficult to decipher, and therefore this systematic review of purely randomised controlled trials will better highlight the research needs and knowledge gaps in this area. Furthermore, a wider range of interventions and trials including adults of all ages have been considered in this review.
There is an urgent need to identify effective strategies for the management for malnourished people in hospitals and other health and social care settings. Not only has this been highlighted in reports from the Council of Europe (COE 2003) and within the UK by the Department of Health (DOH 2007), but also by professional bodies such as the Royal College of Nursing, the British Association for Parenteral and Enteral Nutrition (BAPEN) and patient‐focused organisations such as Age UK (BAPEN 2009; RCON 2008). Numerous strategies aimed at influencing nutritional management and improving the provision of nutritional care in hospitals, care homes and other health and social care settings, have been adopted and incorporated into national policies and international guidelines. Additionally, in the UK, protected mealtimes and the use of red trays have been rolled out across the National Health Service very recently, and interventions applicable across a range of healthcare settings, such as the use of feeding assistance, adjusting the portion size and nutrient content of foods and enhancing food flavours, are increasingly being used. Such service developments have received widespread support by local and national organisations and government. There has been a consistent trend to recommend the implementation of policies designed to influence nutritional care and the environment in which nutrition is provided, without a synthesis of the evidence of potential benefits or harms of such interventions. Crucially, the incorporation of such initiatives into usual care has implications for the staffing and funding of healthcare as well as the potential need for additional training across services. As yet there has been no synthesis of evidence to support the potential benefits of their implementation. Furthermore, a supportive multidisciplinary team approach is necessary in the provision of adequate nutritional care (Jefferies 2011). Given the widespread prevalence of malnutrition and with so many at risk, the potential impact of this systematic review in terms of informing the nutritional management of patients is considerable and therefore, the need for this review was paramount.
Two literature reviews examined various supportive nutritional care interventions (Silver 2009; Weekes 2009) but neither was systematic and both presented a narrative synthesis without meta‐analysis. Furthermore, the review by Weekes and colleagues (Weekes 2009) included non‐randomised trials and searched only electronic sources, while the review by Silver (Silver 2009) considered only trials in older adults. Despite their usefulness in presenting some of the available literature in this area, the true effect of supportive interventions to improve dietary intake by modifying the nutrient content of foods served or aspects of the food service system or environment remains unknown. Therefore, this review represents a first systematic attempt to bring together evidence on the impact of supportive interventions on nutritional, clinical, economic and patient‐centred outcomes.
Objectives
To assess the effects of supportive interventions for enhancing dietary intake in malnourished or nutritionally at‐risk adults.
Methods
Criteria for considering studies for this review
Types of studies
We included randomised controlled clinical trials (RCTs).
Types of participants
Adults (aged over 18 years) who were malnourished, judged to be at nutritional risk or otherwise would potentially benefit from improved nutritional care. The population is therefore described as nutritionally vulnerable.
Diagnostic criteria (malnourished or nutritionally at‐risk adults)
The term malnutrition used in this review refers to under‐nutrition, considered to be the state of poor nutritional status as a result of inadequate nutrient intake or metabolic impairment as well as the state of increased nutritional risk and imminent malnutrition (Corish 2000a; Reilly 1995).
The Malnutrition Universal Screening Tool (MUST) published by BAPEN (Elia 2003), as well as clinical guidelines in the UK and Europe published by the European Society for Parenteral and Enteral Nutrition (ESPEN) (Volkert 2006) and the National Institute for Health and Care Excellence (NICE) (NCCAC 2006), allow identification of malnourished individuals and those at risk of malnutrition in clinical practice and may be used to classify trial participants. These criteria are:
Malnourished
NICE (NCCAC 2006)
-
Body mass index (BMI) below 18.5 kg/m²
-
Unintentional weight loss greater than 10% within the last three to six months
-
BMI below 20 kg/m² and unintentional weight loss greater than 5% within the last three to six months
ESPEN (Volkert 2006)
-
5% unintentional weight loss in last three months and BMI below 20 kg/m²
-
10% unintentional weight loss in last six months and BMI below 20 kg/m²
At risk of malnutrition
NICE (NCCAC 2006)
-
Have eaten little or nothing for more than five days, are likely to eat little or nothing for the next five days or longer, or both
-
Have a poor absorptive capacity, have high nutrient losses, have increased nutritional needs from causes such as catabolism, or a combination
ESPEN (Volkert 2006)
-
Loss of appetite
-
Reduced dietary intake
-
Physical or psychological stress
MUST (Elia 2003)
-
Current acute illness plus no (or likely to be no) nutritional intake for more than five days
In the absence of clear, internationally accepted diagnostic criteria for clinical malnutrition, in many instances a health professional's decision to initiate dietetic referral for nutritional assessment or a clinician's decision to commence nutritional intervention is based on subjective criteria and clinical judgement (McCarron 2010). It was assumed therefore, that participants recruited to intervention trials were judged by the researcher to be malnourished or at risk of malnutrition, or otherwise had the potential to benefit from improved nutritional care on the basis of their clinical background or age.
Types of interventions
Intervention
Interventions that aimed to enhance food intake by improving either the meal itself (e.g. food fortification), aspects of the mealtime environment (e.g. enhancement of the eating environment), aspects of meal delivery, supplementation of meals or indirect supportive strategies (e.g. training of staff or carers). The strategies anticipated prior to searching included the examples listed within the five categories shown in Table 1. However, we recognised that it may become necessary to create additional categories as necessary following searching.
A previous systematic review (Baldwin 2011) included trials of interventions based on dietary counselling that required a person to receive instruction on food modification, oral nutritional supplements or both and have the ability and willingness to act on the instructions in order to enhance their nutritional intake. Although this review is closely related to the previous review, we planned to exclude trials where dietary counselling or oral nutritional supplements, or both were offered on an individualised basis. This review only considered food‐based or oral nutritional supplement interventions when they were provided as an institution‐led intervention without the patient needing to understand and act on instructions to take the additional items (e.g. offering snacks or supplements routinely to frail elderly people in an institutional setting, or the use of organisational structures to support the delivery of oral nutritional supplements). The inevitable overlap with reviews of oral nutritional supplements in the management of malnutrition is noted, but the inclusion of such trials in this review contributes to a more precise understanding of the benefits to be derived from these products.
Comparator
All interventions were compared with usual care.
Summary of specific exclusion criteria
We excluded the following intervention trials from this review.
-
Trials in children, pregnant women, people with eating disorders or malnutrition in conditions of food insufficiency and poverty. We have excluded these trials as malnutrition in such cases results from different aetiology, and the types of interventions and responses to such interventions also differ.
-
Trials of artificial nutrition support via a non‐oral route (i.e. enteral tube feeding and parenteral nutrition).
-
Trials of individualised nutritional support including either dietary counselling (i.e. where the individual was required to understand and act upon specific nutritional advice, which is most likely to occur in the outpatient setting). In cases where dietary advice was provided in combination with a supportive intervention, we have only included the trial if it was possible to evaluate the impact of the supportive intervention separately.
-
Trials of individually prescribed oral nutritional supplements.
-
Trials in healthy volunteers.
Types of outcome measures
We recorded the following outcome measures as change from baseline to end of intervention unless otherwise stated.
Primary outcomes
-
Nutritional intake (actual or percentage change in macro‐ and micronutrient intake)
-
Health‐related quality of life (evaluated by validated scores) and patient satisfaction
-
Morbidity/complications (number of participants with medical complications)
Secondary outcomes
-
Nutritional status (change in weight, body mass index (BMI), mid‐upper arm circumference (MUAC), triceps skin‐fold thickness (TSF) or as otherwise reported)
-
Clinical function (change in clinical functional status (e.g. skeletal muscle strength), respiratory and cardiac function, cognitive and behavioural function, activities of daily living)
-
Hospitalisation and institutionalisation
-
Adverse events
-
All‐cause mortality
-
Economic costs
Timing of outcome measurement
We extracted data on outcomes measured in each trial from baseline to the end of the intervention period. For trials with follow‐up periods that extended beyond the end of the intervention, we also extracted data at the end of intervention to the point of final follow‐up. From experience of a previous review of dietary advice with or without oral nutritional supplements for disease‐related malnutrition in adults (Baldwin 2011) we anticipated that the length, intensity and type of intervention would vary considerably in this current review, given its wider scope. We did not, therefore, establish lengths of intervention and only grouped interventions by time point if a sufficient number of trials was identified to permit this.
Summary of findings
We have presented a 'Summary of findings' table to report the following outcomes, listed according to priority.
-
All‐cause mortality
-
Morbidity/complications
-
Health‐related quality of life and patient satisfaction
-
Hospitalisation and institutionalisation
-
Adverse events
-
Nutritional status
-
Economic costs
Because of lack of data and substantial clinical and methodological heterogeneity we only performed meta‐analyses on all‐cause mortality, number of participants with complications and nutritional status (weight change).
Search methods for identification of studies
Electronic searches
We searched the following sources from inception of each database to the specified date and placed no restrictions on the language of publication.
-
Cochrane Library (14 September 2016).
-
Ovid Epub Ahead of Print, In‐Process & Other Non‐Indexed Citations, Ovid MEDLINE(R) Daily and Ovid MEDLINE(R) (1946 to 14 September 2016).
-
Embase (to March 2013).
-
AMED (to March 2013).
-
British Nursing Index (to March 2013).
-
CINAHL (to March 2013).
-
SCOPUS (to May 2013).
-
ISI Web of Science (to March 2013).
-
ClinicalTrials.gov (14 September 2016).
-
World Health Organization (WHO) ICTRP (International Clinical Trials Registry Platform ‐ http://apps.who.int/trialsearch/) (14 September 2016)
During the first round of electronic searches, we searched databases for all trials published up until the end of October 2011. During the second round of electronic searches, we searched databases for trials published between November 2011 and the end of March 2013 (May 2013 for SCOPUS only). We used identical search strategies in both the first and second round of searches. We carried out a third round of electronic searches prior to publication, when we used a revised search strategy to search the Cochrane Library, Ovid MEDLINE, ClinicalTrials.gov and WHO ICTRP. We carried out revised searches of the Cochrane Libary and Ovid MEDLINE from 1 January 2013 to 14 September 2016. We searched ClinicalTrials.gov and the ICTRP from inception to 14 September 2016.
For detailed search strategies please see Appendix 1 and Appendix 2.
Searching other resources
We searched the references lists of included trials and (systematic) reviews, and meta‐analyses to identify additional trials. We also searched the conference proceedings of relevant professional bodies and associations (British Dietetic Association, BAPEN and Royal College of Nursing) for the 10‐year period 2001 to 2011.
Data collection and analysis
Selection of studies
In order to identify trials to be assessed further, two review authors (MG and CEW) independently scanned the abstract, title or both for every record retrieved according to the inclusion criteria for the first round of searches. For the second round of searches, MG and CB independently scanned the abstract, title or both for every record retrieved according to the inclusion criteria, as before. For the third round of searching, CB and Bernd Richter (The review group editor) scanned titles and abstracts. We obtained all potentially relevant articles as full text and the three review authors (MG, CB and CEW) independently assessed their eligibility using a standardised trial eligibility form. Where there were differences in opinion, we resolved them by discussion among the three authors and made a decision by consensus. If resolving disagreement was not possible, we added the article to those 'awaiting assessment' and contacted the trial authors for clarification. We marked trials where we had not reached a primary consensus and if we included them later on, we planned to subject them to a sensitivity analysis. We listed excluded trials in the 'Characteristics of excluded studies' table along with the reasons for their exclusion. We present an adapted PRISMA flow‐diagram of trial selection (Liberati 2009).
Data extraction and management
For trials that fulfilled the inclusion criteria, two review authors (CB, CEW) abstracted relevant population and intervention characteristics using modified versions of standard data extraction sheets from the CMED Group which incorporated some adaptations from the data collection form used in a previous review by two of the review authors (Baldwin 2011). Data are reported as shown in Table 2; Table 3; Table 4; Table 5; Table 6; Table 7; Table 8; Table 9; Table 10; Table 11; Table 12; Table 13; Table 14; Table 15; Table 16; Table 17; Table 18; Table 19; Table 20; Table 21; Table 22; Table 23; Table 24; Table 25; Table 26 and Appendix 3; Appendix 4; Appendix 5; Appendix 6; Appendix 7; Appendix 8; Appendix 9; Appendix 10. The third review author acted as an arbiter in case of disagreement.
| Intervention(s) and comparator(s) | Screened/eligible | Randomised | ITT | Finishing trial | Randomised finishing trial | Follow‐up | |
| Barton 2000a2 | I1: reduced portion size, fortified menu | ‐ | 13 | ‐ | b | 70c | 56 days |
| I2: cooked breakfast | (8 not randomised) | ||||||
| C: normal hospital diet with usual portion size | 14 | ||||||
| total: | 27a | ‐ | ‐ | ||||
| Beck 2002a1 | I1: homemade oral supplement (A) | ‐ | ‐ | ‐ | ‐ | ‐ | 2 months |
| I2: homemade oral supplement (B) | |||||||
| C: usual diet | |||||||
| total: | 36 | ‐ | ‐ | ||||
| Bouillane 2013a1 | I: 78% protein at lunch | ‐ | 30 | ‐ | 30 | 88 | 6 weeks |
| C: usual diet (protein distributed between meals) | 36 | 23 | 79 | ||||
| total: | 66 | 63 | 96 | ||||
| Bourdel‐Marchasson 2000a3 | I: 2 oral nutritional supplements | 295 | ‐ | ‐ | ‐ | 15 days or until hospital discharge | |
| C: usual care | 377 | ||||||
| total: | 672 | ‐ | ‐ | ||||
| Brouillette1991a1 | I: osmotherapy + activities | ‐ | 10 | ‐ | 9 | 90 | 4 weeks |
| C: activities only | 10 | 7 | 70 | ||||
| total: | 20 | 16 | 80 | ||||
| Castellanos 2009a2 | I1: fortified breakfast and lunch menu | 39 | d | e | 2 days of the study | ||
| I2: fortified lunch menu | 39 | ||||||
| C: usual menu | 39 | ||||||
| total: | 39a | 33 | 85 | ||||
| Chang 2005a3 | I: training in feeding skills | ‐ | 31 | ‐ | 12 | 60 | Quote: "Data collection was from February 2004 to May 2004" Comment: implies 4 months of data collection, following training but not clearly stated |
| C: no training | 36 | 8 | 50 | ||||
| total: | 67 | 20f | 56 | ||||
| Dennis 2005a1 | I: oral nutritional supplement + normal diet | 2016 | ‐ | ‐ | ‐ | 6 months | |
| C: normal hospital diet | 2007 | ||||||
| total: | 4023 | ‐ | ‐ | ||||
| Duncan 2006a1 | I: dietetic assistant | 363 | 153 | ‐ | 145 | 95 | 4 months |
| C: usual care | 165 | 157 | 95 | ||||
| total: | 318 | 302 | 95 | ||||
| Essed 2007a4 | I1: monosodium glutamate | ‐ | ‐ | ‐ | 19 | N/A | 16 weeks |
| I2: flavour | 19 | ||||||
| I3: monosodium glutamate + flavour | 22 | ||||||
| C: maltodextrin (placebo) | 23 | ||||||
| total: | 97 | 83 | 86 | ||||
| Essed 2009a2 | I: monosodium glutamate + NaCl | ‐ | 59 | ‐ | 53 | 90 | 4 weeks |
| C: usual hot meal | 59 | 53 | 90 | ||||
| total: | 59a | 53 | 90 | ||||
| Faxen‐Irving 2011a1 | I: 30 mL of fat emulsion 3 x per day | 107 | 34 | ‐ | 24 | 71 | Median 8 days |
| C: usual care | 37 | 27 | 73 | ||||
| total: | 71 | 51 | 72 | ||||
| Gaskill 2009a3 | I: nutrition education programme | 377 | ‐ | ‐ | ‐ | ‐ | 6 months |
| C: usual care | |||||||
| total: | 352 | ‐ | ‐ | ||||
| Germain 2006a1 | I: re‐formed foods | 93 | 8 | ‐ | 7 | 88 | 12 weeks |
| C: usual diet | 9 | 8 | 89 | ||||
| total: | 17 | 15 | 88 | ||||
| Hankey 1993a1 | I: supplemented with nutritionally complete drink | ‐ | 10 | ‐ | 7 | 70 | 8 weeks |
| C: standard hospital food | 10 | 7 | 70 | ||||
| total: | 20 | 14 | 70 | ||||
| Hickson 2004a1 | I: feeding assistance | 1776 | 292 | 292 | 250 | 86 | Duration of hospital stay |
| C: usual care | 300 | 300 | 259 | 86 | |||
| total: | 592 | 592 | 509 | 86 | |||
| Holyday 2012a1 | I: malnutrition care plan | ‐ | 71 | 71 | 71 | 100 | Duration of hospital stay |
| C: usual care | 72 | 72 | 72 | 100 | |||
| total: | 143 | 143 | 143 | 100 | |||
| Johansen 2004a1 | I: nutrition team | 7468 | ‐ | ‐ | 108 | N/A | Duration of hospital stay |
| C: usual care | 104 | ||||||
| total: | 215 | 212 | 99 | ||||
| Kraft 2012a1 | I: oral nutritional supplement + telemedicine monitoring | 87/50 | 13 | 5 | 1 | 8 | 6 months |
| C: usual care | 13 | 9 | 4 | 31 | |||
| total: | 26 | 14 | 5 | 19 | |||
| Kretser 2003a1 | I: modified meals on wheels | 324 | 102 | ‐ | ‐ | ‐ | 26 weeks |
| C: traditional meals on wheels | 101 | ||||||
| total: | 203 | 60 | 30 | ||||
| Larsson 1990a1 | I: oral nutritional supplement + normal hospital diet | ‐ | 197 | ‐ | ‐ | ‐ | 26 weeks |
| C: normal hospital diet | 238 | ||||||
| total: | 435 | ‐ | ‐ | ||||
| Leslie 2012a3 | I: energy enriched usual meals | 445 | 22 | 16 | 73 | 12 weeks | |
| C: usual care | 19 | 16 | 84 | ||||
| total: | 41 | ||||||
| Lin 2010a3 | I1: spaced‐retrievalg | ‐ | 32 | ‐ | ‐ | ‐ | 8 weeks |
| I2: Montessorih | 29 | ||||||
| C: usual care | 24 | ||||||
| total: | 85 | 82 | 97 | ||||
| Lin 2011a2, a3 | I: Montessori | ‐ | ‐ | ‐ | ‐ | 8 weeks | |
| C: usual care | |||||||
| total: | 29a | 29 | 100 | ||||
| Mathey 2001aa3 | I: improved meal ambiance | 60 | 21 | ‐ | 12 | 57 | 12 months |
| C: usual care | 17 | 10 | 59 | ||||
| total: | 38 | 22 | 58 | ||||
| Mathey 2001ba1 | I: flavour enhancement | ‐ | ‐ | ‐ | 31 | N/A | 16 weeks |
| C: usual care | 36 | ||||||
| total: | 71 | 67 | 94 | ||||
| Munk 2014a1 | I: energy and protein enriched foods provided via a la carte menu in addition to hospital food | 44 | 41 | 96 | Duration of hospital stay | ||
| C: usual care | 40 | 40 | |||||
| total: | 84 | ||||||
| Nijs 2006a3 | I: family‐style meals | 282 | 133 | ‐ | 95 | 71 | 6 months |
| C: usual care | 112 | 83 | 74 | ||||
| total: | 245 | 178 | 73 | ||||
| Olofsson 2007a1 | I: multi‐component intervention (including nutrition) | 353 | 102 | ‐ | 83 | 81 | 4 months |
| C: usual care | 97 | 74 | 76 | ||||
| total: | 199 | 157 | 79 | ||||
| Pivi 2011a1 | I1: nutrition education | ‐ | ‐ | ‐ | 25 | N/A | 6 months |
| I2: oral nutritional supplements | 26 | ||||||
| C: usual care | 27 | ||||||
| total: | 90 | 78 | 87 | ||||
| Potter 2001a1 | I: oral nutritional supplement + normal hospital diet | 618 | 186 | ‐ | 186 | 100 | Duration of hospital stay |
| C: normal hospital diet | 195 | 195 | 100 | ||||
| total: | 381 | 381 | 100 | ||||
| Remsburg 2001a1 | I: buffet‐style meals | 62 | 20 | ‐ | 20 | 100 | 3 months |
| C: usual care | 20 | 19 | 95 | ||||
| total: | 40 | 39 | 98 | ||||
| Salva 2011a3 | I: teaching and training | ‐ | 448 | 448 | 300 | 67 | 12 months |
| C: usual care | 498 | 498 | 368 | 74 | |||
| total: | 946 | 946 | 668 | 71 | |||
| Silver 2008a2 | I: fortified home‐delivered lunch | ‐ | ‐ | ‐ | ‐ | ‐ | 7 months |
| C: usual home‐delivered lunch | |||||||
| total: | 52 | 45 | 87 | ||||
| Simmons 2008a2, a3 | I: feeding assistance and/or snacks | 173 | 30 | ‐ | 28 | 88 | 24 weeks |
| C: usual diet | 34 | 32 | 94 | ||||
| total: | 64a | ‐ | 60 | 94 | |||
| Simmons 2010a1 | I1: snacks | 280 | ‐ | ‐ | 25 | N/A | 6 weeks |
| I2: additional supplementation of meals | 18 | ||||||
| C: usual care | 20 | ||||||
| total: | 86 | 63 | 73 | ||||
| Smolliner 2008a3 | I: fortified meals and snacks | 295/92 | ‐ | ‐ | 22 | N/A | 12 weeks |
| C: usual diet | 30 | ||||||
| total: | 65 | 52 | 80 | ||||
| Splett 2003a3 | I: medical nutrition therapy | 394 | 223 | ‐ | 200 | 90 | 19‐180 days |
| C: usual care | 171 | 164 | 96 | ||||
| total: | 394 | 364 | 92 | ||||
| Taylor 2006a2 | I: 5‐meal menu | 66 | ‐ | ‐ | ‐ | ‐ | 2 periods of 4 days |
| C: usual (3‐meal menu) | |||||||
| total: | 31a | 31 | 100 | ||||
| Van den Berg 2015a1 | I1: offered 125 mL ONS daily with medication rounds | 885 | 88 | 75 | 85 | Maximum period 30 days | |
| I2: offered 62 mL ONS daily with medication rounds | 66 | 51 | 77 | ||||
| C: offered 125 mL ONS twice daily in between meals | 80 | 66 | 83 | ||||
| total: | 234 | ||||||
| Van Ort 1995a1 | I: contextual and behavioural intervention | 8 | ‐ | ‐ | ‐ | ‐ | 1 month to 6 weeks |
| C: usual care | |||||||
| total: | 8 | 7 | 88 | ||||
| Grand total | All interventionsj | ||||||
| All controlsj | |||||||
| All interventions and controls | 10,681 | ||||||
a1Parallel RCT; a2cross‐over RCT; a3cluster RCT; a4 factorial RCT
bData presented on 19 participants who had at least 3 days on each menu
cOf those randomised to normal or fortified menu, not stated for those receiving cooked breakfast
dData analysed for 26 participants with complete data
eData were reported on 67% of those who consented
fData on knowledge and attitude of staff to nutrition available on all 67 staff. Data on actual practice at mealtimes from observation available on 20 staff
gMethod to enhance learning, retention and recall of information
hMethod capable of stopping or reducing residents' problem behaviours
iAssmumed 30 per group, two groups included in this review
jNo details because of substantial number of trials not providing data
C: comparator; I: intervention; ITT: intention‐to‐treat
| Outcome measure | No. of studies | No. of participants | Studies potentially with data for meta‐analysis |
| Energy intake | 5 | 666 | 1 |
| Health‐related quality of life | 1 | 220 | 0 |
| Patient satisfaction | 2 | 1105 | 0 |
| Complications | 4 | 1263 | 3 |
| Nutritional status: weight | 10 | 2184 | 9 |
| BMI | 7 | 1537 | 6 |
| TSF | 3 | 536 | 3 |
| MAC | 3 | 568 | 3 |
| Length of stay | 5 | 1256 | 3 |
| Hospital admission | 1 | 143 | 1 |
| Mortality | 5 | 2182 | 5 |
| Costs | 2 | 1089 | 0 |
BMI: body mass index; MAC: mid‐arm circumference; TSF: triceps skinfold thickness
| Outcome measure | No. of studies | No. of participants | Studies with data for meta‐analysis |
| Energy intake | 3 | 216 | 3 |
| Health‐related quality of life | 2 | 200 | 0 |
| Nutritional status: weight | 3 | 239 | 3 |
| MAC | 1 | 178 | 1 |
| Clinical function | 3 | 1664 | 2 |
| Mortality | 3 | 236 | 3 |
MAC: mid‐arm circumference
| Outcome measure | No. of studies | No. of participants | Studies potentially with data for meta‐analysis |
| Energy intake | 11 | 506 | 7 |
| Health‐related quality of life | 1 | 52 | 0 |
| Complications | 1 | 66 | 1 |
| Nutritional status: weight | 7 | 387 | 7 |
| BMI | 3 | 98 | 3 |
| MAC | 1 | 32 | 1 |
| Clinical function | 3 | 200 | 3 |
| Length of stay | 1 | 81 | 1 |
| Mortality | 4 | 243 | 4 |
BMI: body mass index; MAC: mid‐arm circumference
| Outcome measure | No. of studies | No. of participants | Studies potentially with data for meta‐analysis |
| Energy intake | 8 | 1469 | 7 |
| Health‐related quality of life | 1 | 4023 | 0 |
| Complications | 2 | 4695 | 1 |
| Nutritional status: weight | 7 | 605 | 4 |
| BMI | 2 | 102 | 1 |
| TSF | 2 | 0 | |
| MAC | 3 | 1 | |
| Clinical function | 2 | 618 | 0 |
| Length of stay | 4 | 4689 | 1 |
| Mortality | 5 | 5745 | 5 |
| Costs | 1 | 63 | 0 |
BMI: body mass index; MAC: mid‐arm circumference; TSF: triceps skinfold thickness
| Outcome measure | No. of studies | No. of participants | Studies included in the meta‐analysis |
| Energy intake | 27 | 2857 | 0 |
| Health‐related quality of life | 5 | 4495 | 0 |
| Patient satisfaction | 2 | 1105 | 0 |
| Complications | 7 | 6024 | 5 |
| Nutritional status: weight | 28 | 3618 | 24 |
| BMI | 12 | 1737 | 0 |
| TSF | 5 | ‐ | 0 |
| MAC | 8 | ‐ | 0 |
| Clinical function | 9 | 2746 | 0 |
| Length of hospital stay | 10 | 6026 | 5 |
| Hospital admissions | 2 | 389 | 0 |
| Mortality | 18 | 8690 | 17 |
| Economic costs | 3 | 1152 | 0 |
BMI: body mass index; MAC: mid‐arm circumference; TSF: triceps skinfold thickness
| Outcome | Reason the data were not usable | Contact with author | Outcome of contact with author | Action taken | |
| 1. Organisational change | |||||
| Chang 2005 | Energy intake | Data reported as amount eaten in ¼, ½, ¾ | Yes | No response | Data reported in structured narrative summary |
| Duncan 2006 | Complications | Reported as a median and IQR | Yes | Data provided | Data used |
| Length of stay | Reported as median and IQR | Yes | Confirmed data skewed | Data reported in structured narrative summary | |
| Gaskill 2009 | Measured prevalence of malnutrition with SGA | Not an outcome of interest for this review | Yes, to request weight data (a component of SGA) | Unable to provide data | Data not reported |
| Hickson 2004 | Energy intake | Not measured at baseline, only at follow‐up | Yes, to confirm interpretation of data | Data not measured at baseline | Data reported in structured narrative summary |
| Complications (antibiotic prescription) | Reported as median and IQR | Yes, to request complications according to group allocation | No. complications according to group allocation was provided | Data reported in structured narrative summary | |
| Hospital admission | States in protocol these are collected, but not reported | Yes, to request data | Author unable to recall what happened with data | Data not reported | |
| Holyday 2012 | Costs | An estimate based on local prices, not a complete cost analysis | No, judged unlikely to be available | N/A | Data not reported |
| Hospital admission | Presented as a frequency | Yes, to request total number of readmissions | Data provided | Data reported in structured narrative summary | |
| Johansen 2004 | Energy intake | Reported as kJ/kg/day | Yes, for mean change | No response | Data not reported |
| Kraft 2012 | BMI | Presented as mean and SD at baseline and follow‐up, but no mean change | Yes | No response | Data not reported |
| Lin 2010 | Energy intake | 'Amount of each meal consumed' was reported as % eaten | Yes | No response | Data reported in structured narrative summary |
| Weight | Reported as mean and SD pre and post intervention/control | Yes, to request mean change | No response | Calculated mean change, and imputed the SD of change from Salva 2011 | |
| BMI | Reported as mean and SD pre and post intervention/control | Yes, to request mean change | No response | Calculated mean change, and imputed the SD of change from Salva 2011 | |
| Olofsson 2007 | Weight | Reported as mean and SD pre and post intervention/control | Yes, to request mean change and SD | Data provided | Data reported in structured narrative summary |
| BMI | Reported as mean and SD pre and post intervention/control | Yes, to request mean change and SD | Data provided | Data reported in structured narrative summary | |
| Complications | Reported as no. falls in men and women | Yes, to request total complications per group | Data provided | Data reported in structured narrative summary | |
| Pivi 2011 | Weight | Reported as mean and SD pre and post intervention/control | Yes, to request mean change | No response | Calculated mean change, and imputed the SD of change using the P value |
| BMI | Reported as mean and SD pre and post intervention/control | Yes, to request mean change | No response | Calculated mean change, and imputed the SD of change from Salva 2011 | |
| TSF | Reported as mean and SD pre and post intervention/control | Yes, to request mean change | No response | Calculated mean change, and imputed the SD of change from Salva 2011 | |
| MAC | Reported as mean and SD pre and post intervention/control | Yes, to request mean change | No response | Calculated mean change, and imputed the SD of change | |
| Salva 2011 | MAC | Methodology reported this was an outcome measured, but not reported in results | Yes | No response | Data not used |
| Costs | Described as data to be collected, but reported that analysis was not undertaken | No | Not reported | ||
| Splett 2003 | Intake | Food intake is documented as a nutrition assessment activity | Yes, to request mean energy intake per group | Unable to provide data | Not reported |
| Weight | Methodology reports this was an outcome measured, but reported in a format not usable | Yes | Unable to provide data | Not reported | |
| 2. Feeding environment | |||||
| Brouilette 1991 | Energy | Reported pre and post intervention data, but no SD of change | No, as no author contact details and study published in 1991 | N/A | Imputed the SD from Nijs 2006 |
| Van Ort 1995 | Weight change | No figures reported | Yes, to request data on mean and SD of change for each group | Waiting response | Not used |
| Intervention group clarification | Were the behavioural and contextual intervention received at the same time | Yes, to request this detail | Waiting response | Assumed the two interventions were given at the same time | |
| 3. Meal modification | |||||
| Bouillanne 2013 | Weight | Did not report weight, but assumed they had the data as Full Body Composition was used | Yes, to request data | Data provided | Data reported |
| Energy intake | Reported as kcal/kg/day | Yes, to request data | Data provided | Data reported | |
| Hand grip strength | Reported data as mean/median and 95% CI of the median | Yes, to request data | Provided mean and SD of change | Data reported | |
| ADL | Reported data as mean/median and 95% CI of the median | Yes, to request data | Data provided | Data reported | |
| Castellanos 2009 | Energy intake | Results were not analysed according to groups randomised, but regrouped subjects into small eaters and large eaters | Yes, to ask for data on mean and SD of change for each group | No response | Data reported |
| Germain 2006 | BMI | They reported the mean BMI rather than mean change | Yes, for mean and SD of change | Data provided | Data reported |
| Smolliner 2008 | Weight change | Reported mean and SD at baseline and end of intervention | Yes, for mean change and SD | Data provided | Data reported |
| BMI | Reported mean and SD at baseline and end of intervention | Yes, for mean change and SD | Data provided | Data reported | |
| Handgrip strength | Reported mean and SD at baseline and end of intervention | Yes, for mean change and SD | Data provided | Data reported | |
| health‐related quality of life | Reported mean and SD at baseline and end of intervention | Yes, for mean change and SD | Data provided | Data reported | |
| 4. Supplementation of meals | |||||
| Beck 2002 | Weight | Reported as median change with 95% CI | Yes, for mean change and SD | Response received but data not available | Data reported in structured narrative summary |
| Energy intake | Reported as median change with 95% CI | Yes, for mean change and SD | Response received but data not available | Data reported in structured narrative summary | |
| Bourdel‐ Marchasson 2000 | Pressure ulcers | Data given as percentage per group | Yes, for number per group | Data provided | Data reported in structured narrative summary |
| Weight | Data given for baseline only | Yes, for change in weight from baseline to follow‐up | Yes, author stated she did not find the analysis of discharge weight, probably due to the low quality of this data (too many missing data) | Data not reported | |
| Dennis 2005 | Complications | Data given as percentages | Yes for data on total complications per group | Data provided | Data reported in structured narrative summary |
| Health‐related quality of life score | Differences between means provided | Yes, to request mean and SD of changes | Unable to provide data, as EuroQol was only measured at follow‐up | Data reported in structured narrative summary | |
| Faxen‐Irving 2011 | Energy intake | Data given in a graph, no numbers available | Yes, for mean and SD of change in energy intake, between the control and intervention groups from baseline to the 2nd registration | Data provided | Data reported in structured narrative summary |
| Length of stay | Data provided at baseline, not follow‐up | Yes, for mean and SD | Data provided | Data reported in structured narrative summary | |
| Infection | Data provided at baseline, not follow‐up | Yes, for mean and SD | Unable to provide data | Data not reported | |
| BMI | Data provided at baseline, not follow‐up | Yes, for mean and SD | Data provided | Not reported in the summary because few studies measured this outcome | |
| ADL | Data provided at baseline, not follow‐up | Yes, for mean and SD | Data provided | Not reported in the summary because few studies measured this outcome | |
| Hankey 1993 | Weight | Presented in graphs, no numbers given | Yes, for mean and SD | Unable to provide data but suggested using data from the review by Milne 2009 which included these data | Data obtained from systematic review by Milne 2009 |
| MAC | Presented in graphs, no numbers given | Yes, for mean and SD | Unable to provide data but suggested using data from the review by Milne 2009 which included these data | Data obtained from systematic review by Milne 2009 but not reported as few studies measured this outcome | |
| TSF | Presented in graphs, no numbers given | Yes, for mean and SD | Unable to provide data but suggested using data from the review by Milne 2009 which included these data | Not reported in the summary because few studies measured this outcome | |
| Energy and protein intake | Presented in graphs, no numbers given | Yes, for mean and SD | Unable to provide data | Data not reported | |
| Larsson 1990 | Energy intake | Data included in Modified Norton Scale | Yes, data for change in energy intake between groups (mean and SD) | No response | Data not reported |
| Weight | Data provided as ‘weight index’ | Yes, for change in weight between groups (mean and SD) | No response | Data not reported | |
| TSF | Data provided as differences between men and women, and non‐PEM and PEM groups | Yes, for change between groups (mean and SD) | No response | Data not reported | |
| MAC | Data provided as differences between men and women, and non‐PEM and PEM groups | Yes, for change between groups (mean and SD) | No response | Data not reported | |
| Length of stay | Not given | Yes, for mean and SD between groups | No response | Data not reported | |
| Total number of eligible participants | Unclear across all 4 duplicates of this study | Yes, for a clear number of randomised participants, no finishing study, and deaths | No response | Data not reported | |
| Potter 2001 | Length of stay | Provided as median with a range | Yes, for mean and SD between groups | No response | Data reported in structured narrative summary |
| ADL | Stated as an outcome measure in methodology, then not reported in results | Yes, for mean and SD between groups | No response | Not reported in the summary because few studies measured this outcome | |
| BMI | Stated as an outcome measure in methodology, then not reported in results | Yes, for mean and SD between groups | No response | Not reported in the summary because few studies measured this outcome | |
| TSF | Stated as an outcome measure in methodology, then not reported in results | Yes, for mean and SD between groups | No response | Not reported in the summary because few studies measured this outcome | |
| Simmons 2008 | Weight | Data presented as phase 1 and 2 cross‐over combined. The data from phase 1 was needed for this review | Yes, for the phase 1 data | Yes, responded but unable to provide data | Data reported in structured narrative summary |
| BMI | Data presented as phase 1 and 2 cross‐over combined. The data from phase 1 was needed for this review | Yes, for the phase 1 data | Yes, responded but unable to provide data | Not reported in the summary because few studies measured this outcome | |
| Energy intake | Presented as pre‐ and post intervention | Yes, for mean and SD of change | Yes, responded but unable to provide data | Imputed SD from Nijs 2006 | |
| Simmons 2010 | Energy | Reported as mean difference without the SD | Yes, requested SD for mean change | Yes, responded but unable to provide data | Imputed SD from Nijs 2006 |
| 5. Home meal delivery systems | |||||
| Kretser 2003 | Weight | Reported separately for participants at risk of malnutrition, and those malnourished | No, failed to find contact information for the author | N/A | Combined the mean change data using the formulae for combining groups |
ADL: activities of daily living; BMI: body mass index; CI: confidence interval; EuroQol: European Quality of Life Scale; IQR: interquartile range; MAC: midarm muscle circumference; N/A: not applicable; PEM: protein‐energy malnutrition; SD: standard deviation; SGA: subjective global assessment; TSF: triceps skinfold thickness
| Setting | No. participants | No. studies |
| Hospital | 7591/10,681 (71.1) | 15 |
| Residential care home | 1731/10,681 (16.2) | 21 |
| Free‐living/outpatient setting | 1305/10,681 (12.2) | 5 |
| Outcome | (N) | Results | P Value | ||
| Intervention | Control | ||||
| Dietetic assistants (Hospital) | |||||
| Duncan 2006 | Mean (SD) energy intake (kcal/day) | 275 (total N = 302) | 1105 (361) | 756 (399) | < 0.001 |
| Hickson 2004 | Between‐group difference (kcal) | 37 (total N = 592) | 89 | 0.538 | |
| Specialist training (residential care settings) | |||||
| Chang 2005 | % (SD) meals consumed | 67 | Pre: 90 % (22) Post: 85 (25) | Pre: 78 % (34) Post: 94 % (18) | 0.49 |
| Lin 2010 | % (SD) meals consumed | 85 | Spaced retrieval (SR) Pre: 85 % (11) Post: 91 % (9) Montessori (MON) Pre: 75 % (23) Post 78 % (10) | Pre: 79 % (19) Post: 88 % (18) | SR vs control = NS MON vs control < 0.05 |
| Multi‐disciplinary team (hospital) | |||||
| Johansen 2004 | kcal/kg body weight per day (SE) | 202 (total N = 212) | 30 (SE 1) | 25 (SE 1) | < 0.005 |
kcal: kilocalorie; SD: standard deviation; SE: standard error
| Outcome | (N) | Results | P Value | ||
| Intervention | Control | ||||
| Patient satisfaction | |||||
| Dietetic assistants (hospital) | |||||
| Duncan 2006 | Median score (IQR) | 159 | 6.5 (2) | 3.0 (4) | 0.0001 |
| Health‐related quality of life | |||||
| Multi‐disciplinary team (hospital) | |||||
| Johansen 2004 | Change in physical score (SF‐36) | 110 | 2.4 (1.3) | 0.2 (1.5) | NS |
| Change in mental score (SF‐36) | 110 | 2.2 (2.5) | 3.3 (2) | NS | |
| Number of complications | |||||
| Dietetic assistants (hospital) | |||||
| Duncan 2006 | Total number of participants with complications | 302 | 84/125 (67%) | 79/130 (61%) | 0.29 |
| Hickson 2004 | Number of participants receiving oral antibiotics | 592 | 142/292 (49%) | 150/300 (50%) | 0.67 |
| Multi‐disciplinary team (hospital) | |||||
| Johansen 2004 | Total number of participants with complications | 212 | 34/108 (31%) | 23/104 22%) | NS |
| Olofsson 2007 | Total number of participants with complications | 157 | 81/83 (98%) | 74/74 (100%) | |
IQR: interquartile range; NS: not significant; SF‐36: short form‐36
| Outcome | (N) | Results | P Value | ||
| Intervention | Control | ||||
| Dietetic assistants (hospital) | |||||
| Duncan 2006 | Mean change (SD) Weight (kg) MAC (cm) TSF (mm) | (total N = 302) 170 230 205 | ‐0.36 (3.3) ‐0.9 (2.2) ‐0.88 (2.6) | ‐1.0 (2.8) ‐1.3 (1.5) ‐1.23 (3.2) | 0.16 0.002 0.087 |
| Hickson 2004 | Mean change (SD) Weight (kg) MAC (cm) TSF (mm) Median (IQR) MAMC BMI (kg/m²) | (total N = 592) 191 286 279 429 254 | ‐0.92 (2.71) ‐0.3 (1) ‐0.4 (1.8) ‐0.1 (‐0.8‐0.4) ‐0.04 (1.1) | ‐0.9 (3) ‐0.3 (1) ‐0.4 (1.7) ‐0.1 (‐0.5‐0.3) ‐0.25 (1.18) | 0.23 0.65 0.86 0.84 0.68 |
| Specialist training (residential care settings) | |||||
| Lin 2010 | Mean change (SD) Weight (kg) BMI (kg/m²) | 85 | Spaced retrieval ‐0.07 (0.57) Montessori ‐0.15 (0.57) Spaced retrieval 0.1 (1.0) Montessori ‐0.06 (1.0) | ‐0.09 (0.57) ‐0.03 (1) | NS NS |
| Lin 2011 | BMI | 29 | ‐0.26 (0.73) | ‐0.09 (0.85) | 0.245 |
| Specialist training (free‐living individuals) | |||||
| Pivi 2011 | Mean change (SD) Weight (kg) MAC (cm) TSF (mm) BMI (kg/m²) | 52 | 1.19 (imputed SD: 3.3) 1.87 (2) 2.3 (5.4) 1.19 (1) | ‐2.2 (imputed SD: 3.3) ‐0.4 (0.46) 2.2 (5.3) ‐2.21 (1) | Reported as between‐group differences for 4 groups |
| Salva 2011 | Mean change (SD) Weight (kg) BMI (kg/m²) | 946 | 0.26 (0.7) ‐0.01 (2.2) | 0.09 (0.5) ‐0.06 (3.2) | 0.598 0.843 |
| Multi‐disciplinary team (hospital) | |||||
| Johansen 2004 | Mean change (SD) Weight (kg) | (total N = 212) 95 | ‐0.22 (3.9) | 0.1 (2) | NS |
| Olofsson 2007 | Mean change (SD) Weight (kg) BMI (kg/m²) | (total N = 199) 157 157 | ‐1.1 (3.6) ‐0.45 (1.3) | ‐0.7 (3.8) ‐0.3 (1.5) | 0.05 0.05 |
| Protocol‐driven pathway (hospital) | |||||
| Holyday 2012 | Mean change (SD) Weight (kg) | (total N = 143) 69 | ‐0.9 (3.6) | ‐0.9 (2.3) | 0.98 |
| Protocol‐driven pathway (residential care settings) | |||||
| Splett 2003 | Weight | 364 | No wt loss at baseline: 95% maintained wt. Wt loss at baseline: 48% maintained or gained wt. | No wt loss at baseline: 58% maintained wt. Wt loss at baseline: 57% maintained or gained wt. | |
| Telemedicine (free‐living individuals) | |||||
| Kraft 2012 | Mean change (SD) Weight (kg) BMI (kg/m²) | 26 14 | ‐4.5 (7.9) Baseline 24.5 (5.1) Follow‐up 23.0 (4.2) | ‐3 (6.2) Baseline 23.9 (4.4) Follow‐up 22.8 (4.3) | NS NS |
BMI: body mass index; IQR: interquartile range; MAC: mid‐arm circumference; MAMC: mid‐arm muscle circumference; NS: not significant; SD: standard deviation; TSF: triceps skinfold thickness; wt: weight
| Outcome | (N) | Results | P Value | ||
| Intervention | Control | ||||
| Handgrip strength | |||||
| Dietetic assistants (Hospital) | |||||
| Duncan 2006 | Mean change (SD) | 126 (total N = 302) | 2.2 (10.7) | 0.16 (11.8) | 0.32 |
| Hickson 2004 | Median change (IQR) (kg) | (total N = 592) | 0.8 (‐1.4 to 2.5) | 0.7 (‐1.5 to 3) | 0.85 |
IQR: interquartile range; SD: standard deviation
| Outcome | (N) | Results | P Value | ||
| Intervention | Control | ||||
| Mortality | |||||
| Dietetic assistants (Hospital) | |||||
| Duncan 2006 | 4‐month mortality | (total N = 302) | 19/145 (13%) | 36/157 (23%) | 0.036 |
| Hickson 2004 | In‐hospital mortality | (total N = 592) | 31/292 (11%) | 35/300 (12%) | 0.69 |
| Specialist training (free‐living individuals) | |||||
| Salva 2011 | 12‐month mortality | 946 | 43/448 (10%) | 29/498 (6%) | NR |
| Multi‐disciplinary team (hospital) | |||||
| Olofsson 2007 | 4‐month mortality | 199 | 9/102 (9%) | 13/97 (13%) | NR |
| Protocol‐driven pathway (hospital) | |||||
| Holyday 2012 | Not reported | 143 | 1/72 (1%) | 4/71 (6%) | 0.21 |
| Length of stay in hospital | |||||
| Dietetic assistants (hospital) | |||||
| Duncan 2006 | Median (IQR) (days) | 167 | 34 (48) | 32 (49) | 0.81 |
| Hickson 2004 | Median (IQR) (days) | 592 | 21(13‐36) | 23(14‐39) | 0.41 |
| Multi‐disciplinary team (hospital) | |||||
| Johansen 2004 | Mean (SD) LOS to 28 days | 197 | 11.6 (8) | 11.5( 8) | NS |
| Olofsson 2007 | Mean (SD) (days) | 157 | 27.4 (15.9) | 39.8 (41.9) | < 0.05 |
| Protocol‐driven pathway (hospital) | |||||
| Holyday 2012 | Mean (SD) (days) | 143 | 13.7 (11.8) | 13.5 (11) | 0.85 |
| Hospital readmissions | |||||
| Protocol‐driven pathway (hospital) | |||||
| Holyday 2012 | Number of readmissions at 6 months | 30/71 | 37/72 | NR | |
IQR: interquartile range; LOS: length of stay; SD: standard deviation
| Outcome | (N) | Results | P Value | |||
| Intervention | Control | |||||
| Changes to the dining room environment | ||||||
| Mathey 2001 | Mean change (SD) energy intake (kcal) | 22 | 199 (406) | 185( 247) | NR | |
| Nijs 2006 | Mean change (SD) energy intake (kcal) | 178 | 116 (456) | ‐100 (357) | ||
| Mean difference (95% CI) | 178 | 235 (83‐268) | Described as significantly different but no P value reported | |||
| Remsburg 2001 | NR | |||||
| Sensory stimulation | ||||||
| Brouillette 1991 | Mean change (SD) in intake of lunch meal (kcal) | 16 | ‐1.6 (450) | 11.14 (360) | 0.49 | |
CI: confidence interval; NR: not reported; SD: standard deviation
| Outcome | (N) | Results | P Value | ||
| Intervention | Control | ||||
| Changes to the dining room environment | |||||
| Mathey 2001a | Sickness Impact Profile, mean change (SD) in score | 16/2 | ‐2 (11) | ‐13 (12) | NR |
| Nijs 2006 | Overall QOL mean change (95% CI) in score | 178 | 0.4 (‐1.8 to 2.5) | ‐5 (‐9.4 to ‐0.6) | NR |
| Mean difference (95% CI) | 178 | 6.1 (2.1 to 10.3) | Described as significantly different but no P value reported | ||
| Physical performance, mean change (95% CI) in score | 178 | 0.2 (‐2.3 to 2.7) | ‐2.2 (‐4.1 to ‐0.4) | NR | |
| Mean difference (95% CI) | 178 | 3.2 0.9 to 5.5) | Described as significantly different but no P value reported | ||
CI: confidence interval; NR: not reported; QOL: quality of life; SD: standard deviation
| Outcome | (N) | Results | P Value | ||
| Intervention | Control | ||||
| Weight | |||||
| Changes to the dining room environment | |||||
| Mathey 2001a | Mean change (SD) (kg) | 22 | 3.3 (5) | ‐0.4 (4) | I: < 0.05; C: 0.78 |
| Nijs 2006 | Mean change (SD) (kg) | 178 | 0.5 (3.9) | ‐1.1 (3.7) | NR |
| Mean difference (95% CI) | 178 | 1.5 (0.6 to 2.4) | Described as significantly different but no P value reported | ||
| Remsburg 2001 | Mean change (SD) (kg) | 39 | ‐0.11 (3.1) | 0.32 (2.2) | 0.638 |
C: control; I: intervention; NR: not recorded; SD: standard deviation
| Outcome | (N) | Results | P Value | ||
| Intervention | Control | ||||
| Changes to the dining room environment | |||||
| Mathey 2001a | Mortality | 38 | 7/21 (33%) | 5/17 (29%) | NR |
| Nijs 2006 | Mortality | 178 | 18/112 (16%) | 16/133 (12%) | NR |
| Sensory stimulation | |||||
| Brouillette 1991 | Mortality | 20 | 1/10 (10%) | 0/10 (0%) | NR |
NR: not reported
| Outcome | (N) | Results | P Value | ||||
| Intervention | Control | ||||||
| Fortification of food (studies in hospital) | |||||||
| Barton 2000 | Total energy intake (kcal/d) | 36 | 1711 (195) | 1425 (136) | < 0.001 | ||
| Munk 2014 | Mean (SD) intake (kj/d) | 81 | 5843 (1660) | 5149 (1832) | |||
| Mean (95% CI) difference between groups | 693 (‐80 to 1466) | 0.08 | |||||
| Fortification of food (studies in residential care homes) | |||||||
| Leslie 2012 | mean (SEM) change in energy intake (baseline to week 12) (kcal/d) | 16 | 133 (89) | ‐36 (84) | 0.154 | ||
| Food fortification (studies in free‐living individuals) | |||||||
| Silver 2008 | Total energy intake (kcal/d) | 45 | 1876 (543) | 1423 (422) | < 0.001 | ||
| Modifications to meal composition (studies in intermediate care) | |||||||
| Bouillane 2013 | Change in energy intake (kcal) | 63 | 50.9 (458) | 39.2 (401) | NR | ||
| Modifications to meal delivery (studies in residential care homes) | |||||||
| Germain 2006 | Change in energy intake (kcal) | 15 | 611 (408) | 81 (169) | 0.03 | ||
| Taylor 2006 | Total energy intake (kcal/d) | 31 | 1342 (177) | 1325 (207) | 0.565 | ||
| Modifications to flavour (studies in residential care homes) | |||||||
| Essed 2007 | Change in energy intake (kcal) | 83 | Flavour: ‐17 (445) Flavour + MSG: 78 (352) MSG: ‐32 (28) | 102 (452) | NR | ||
| Essed 2009 | Energy intake from modified meal (kcal) | 53 | 420 (211) | 424 (216) | 0.896 | ||
| Mathey 2001b | Change in energy intake (kcal) | 67 | ‐50 (267) | ‐115 (298) | Baseline to end of intervention I: NR, C: < 0.05 | ||
C: control; I: intervention; MSG: monosodium glutamate; NR: not recorded; SD standard deviation; SEM standard error of the mean; CI confidence interval
| Outcome | (N) | Results | P Value | ||
| Intervention | Control | ||||
| Weight and BMI (mean change (SD)) | |||||
| Fortification of food (studies in hospital) | |||||
| Munk 2014 | Mean (SD) within‐group change in weight (kg) | 66 | 0.4 (2.6) | ‐0.4 (1.8) | 0.17 |
| Mean (95% CI) between‐group difference in weight (kg) | ‐0.8 (‐1.9 to 0.3) | ||||
| Fortification of food (studies in residential care homes) | |||||
| Leslie 2012 | Mean (SD) within‐group weight change (kg) | 31 | 1.3 (0.53)* | ‐0.2 (1.5)** | *0.03 **0.536 |
| Mean (SD) within‐group change in BMI (kg/m2) | 31 | 0.5 (0.25)* | ‐0.1 (0.4)** | *0.042 **0.517 | |
| Mean (SD) within‐group change in MUAC (mm) | 32 | 0.4 (0.16)* | ‐0.1 (0.3)** | *0.019 **0.691 | |
| Smolliner 2008 | Mean (SD) change weight (kg) | 52 | 2 (2.1) | 1.6 (2) | NS |
| BMI change (kg/m²) | 52 | 0.77 (1.5) | 0.45 (1.1) | Between‐group difference NS | |
| Modifications to meal composition (studies in intermediate care) | |||||
| Bouillanne 2013 | Mean (SD) change weight (kg) | 63 | 0.4 (2.3) | ‐0.7 (3.1) | NR |
| Modifications to meal delivery (studies in residential care homes) | |||||
| Germain 2006 | Mean (SD) change weight (kg) | 15 | 3.9 (2.3) | ‐0.8 (4.2) | 0.02 |
| BMI change (kg/m²) | 15 | 1.51 (1.16) | 0.27 (1.46) | Data provided by study author P value NR | |
| Modifications to flavour (studies in residential care homes) | |||||
| Essed 2007 | Mean (SD) change weight (kg) | 83 | Flavour: 0.1 (2.4) Flavour + MSG: ‐ 0.8 (3.3) MSG: ‐ 0.7 (3.6) | 0.1 (3.8) | NR |
| Mathey 2001b | Mean (SD) change weight (kg) | 67 | 1.1 (1.3) | ‐0.3 (1.6) | < 0.05 |
BMI: body mass index; CI: confidence interval; MSG: monosodium glutamate; MUAC: mid‐upper arm circumference; NR: not reported; NS: not significant; SD: standard deviation
| Outcome | (N) | Results | P Value | ||
| Intervention | Control | ||||
| Mortality | |||||
| Fortification of food (studies in hospital) | |||||
| Munk 2014 | Mortality | 81 | 1/44 | 1/40 | NR |
| Fortification of food (studies in residential care homes) | |||||
| Leslie 2012 | Mortality | 32 | 2/19 | 5/22 | NR |
| Smolliner 2008 | Mortality | 65 | 2/31 | 1/34 | NR |
| Modifications to meal composition (studies in intermediate care) | |||||
| Bouillane 2013 | Mortality | 66 | 1/30 (3%) | 1/36 (3%) | NR |
| Length of hospital stay | |||||
| Fortification of food (studies in hospital) | |||||
| Munk 2014 | Days from study inclusion to discharge | 81 | 10 (8) | 10 (8) | 0.73 |
| Handgrip strength | |||||
| Fortification of food (studies in hospital) | |||||
| Munk 2014 | Mean change (SD) baseline to day 3 (kg) | 76 | ‐0.1 (2.9) | ‐0.4 (4.3) | 0.76 |
| Mean difference (95% CI) between I & C | ‐0.3 (‐1.9 to ‐1.4) | 0.95 | |||
| Fortification of food (studies in residential care homes) | |||||
| Smolliner 2008 | Mean change (SD) (kg) | 61 | ‐0.81 (3.12) | ‐1.29 (3) | NR |
| Modifications to meal composition (studies in intermediate care) | |||||
| Bouillane 2013 | Mean change (SD) (N) | 63 | ‐0.5 (41.7) | 14 (45.1) | 0.411 (ANCOVA 0.271) |
| Bouillane 2013 | Change in ADL score (mean (SD) | 63 | ‐0.02 (1.6) | 0.54 (1.7) | 0.125 (ANCOVA 0.118) |
ADL: activities of daily living; ANCOVA: analysis of covariance; N: Newtons; NR: not reported; SD: standard deviation
I: intervention; C: control
| Outcome | (N) | Results | P Value | ||
| Intervention | Control | ||||
| Supplementation with food (residential care homes) | |||||
| Beck 2002 | Change in energy intake (kcal/d) (median 95% CI) | 16 | ‐24 (‐454 to 860) | 24 (‐167 to 478) | NS |
| Simmons 2008 | Change in energy intake kcal/ (mean SD) | 64 | 302 (450) | 127 (360) | Baseline to 6 months I: = 0.000; C: NS |
| Simmons 2010 | Change in energy intake (mean SD) | 43 | ‐65 (450) | 67 (360) | NS |
| Supplementation with ONS (in hospital) (reported as mean (SD) | |||||
| Bourdel‐Marchasson 2000 | Total energy intake (kcal/d) | 672 | 1188 (613) | 1102 (503) | 0.13 |
| Faxen‐Irving 2011 | Change in energy intake (kcal/d) | 38 | 94 (350) | 6.5 (358) | NR |
| Potter 2001 | Total energy intake (kcal/d) | 381 | 1409 (448) | 1090 (417) | S |
| Van den Berg 2015 | Mean (SD) energy intake from ONS (kcal/d) | 192 | I1:343 (172)* I2: 469 (111)** | 389 (162) | *0.289 **0.006 |
| Supplementation with ONS (long‐term/residential care settings) | |||||
| Hankey 1993 | Total energy intake (kcal/d) | 21 | 1747 (273) | 1147 (310) | Baseline to wk 8, I: 0.01; C: NS |
| Simmons 2010 | Change in energy intake | 42 | 28 (450) | 67 (360) | 0.14 |
C: control; CI: confidence interval; I: intervention; NS: not significant; NR: not reported; ONS: oral nutritional supplement; S: significant; SD: standard deviation; wk: week
| Outcome | (N) | Results | P Value | ||
| Intervention | Control | ||||
| Incidence of pressure ulcers | |||||
| Supplementation with ONS (in hospital) | |||||
| Bourdel‐Marchasson 2000 | Cumulative incidence at end of follow‐up (%) Number of participants with pressure ulcers at day 15 | 672 | 40 101/295 | 48 164/37 | NR NR |
| Dennis 2005 | Number of participants with pressure ulcers | 4023 | 15/2016 | 26/2007 | 0.0507 |
| Total complications | |||||
| Supplementation with ONS (in hospital) | |||||
| Dennis 2005 | All in‐hospital complications | 4023 | 515/2014 (26%) | 448/2001 (22%) | NR |
| Health‐related quality of life | |||||
| Supplementation with ONS (in hospital) | |||||
| Dennis 2005 | Utilitiy (median (IQR)) (EUROQoL) | 3086 | Median group difference 0.52 (0.03 to 0.74) | 0.96 | |
EUROQol: European Quality of Life Scale; IQR: interquartile range; NR: not reported; ONS: oral nutritional supplement
| Outcome | (N) | Results | P Value | ||
| Intervention | Control | ||||
| Supplementation with food (residential care homes) | |||||
| Beck 2002 | Change in weight (median 95% CI) | 16 | 1.3 (‐1 to 3) | 1.5 (‐2.3 to 9) | NS |
| Simmonds 2008 | Mean change (SD) weight (kg) Mean (SD) change in BMI | 64 | The intervention group gained 4 lbs more The intervention group gained 0.72 kg/m2 than the usual care | NR NR | 0.009 0.009 |
| Simmonds 2010 | Mean change (SD) weight (kg) | 43 | 0.02 (1.1) | 0.21 (1.7) | NS |
| Supplementation with ONS (in hospital) | |||||
| Faxen‐Irving 2011 | Mean change (SD) weight (kg) Mean (SD) BMI at follow‐up (kg/m2) | 38 38 | 0.13 (2.2) 20.4 (3.7) | ‐0.95 (2.3) 20.4 (3.7) 21.9 (3.8) | NR 0.17 |
| Potter 2001 | Mean change in weight (kg) Mean change (SD) MAC (cm) | 381 381 | 0.4 (2.6) ‐0.1 (1.3) | ‐0.5 (2.9) ‐0.4 (1.2) | 0.003 NS |
| Supplementation with ONS (long‐term care settings) | |||||
| Hankey 1993 | Mean change (SD) weight (kg) Mean change (SD) MAC | 21 21 | 2.83 (10) ‐1 (10) | ‐0.53 (10) 0.6 (10) | NR ‐ data from Milne 2009 NR data from Milne 2009 |
| Simmons 2010 | Mean change in weight (kg) | 42 | 0.91 (2.3) | 0.24 (1.96) | NS |
BMI: body mass index; CI: confidence interval; MAC: mid‐arm circumference; NR: not reported; NS: not significant; ONS: oral nutritional supplement; SD: standard deviation
| Outcome | (N) | Results | P Value | ||
| Intervention | Control | ||||
| Mortality | |||||
| Supplementation with ONS (in hospital) | |||||
| Bourdel‐Marchasson 2000 | Mortality | 672 | 25/295 (8%) | 22/377 (6%) | 0.18 |
| Dennis 2005 | Mortality | 4023 | 241/2016 (12%) | 253/2007 (13%) | 0.7 |
| Potter 2001 | Mortality | 381 | 21/186 (11%) | 33/195 (17%) | 0.117 |
| Supplementation with ONS (long‐term care settings) | |||||
| Larsson 1990 | Mortality | 435 | 29/197 (15%) | 56/238 (24%) | 0.13 |
| Length of stay | |||||
| Supplementation with ONS (in hospital) | |||||
| Faxen‐Irving 2011 | Length of hospital stay (days) | 51 | 10.5 (SD 5.6) | 10.3 (SD 4.9) | NS |
| Dennis 2005 | Length of hospital stay (days) Median (IQR) | 4023 | 16 (IQR 7–44) | 16 (IQR 7–41) | NS |
| Potter 2001 | Length of hospital stay (median (range)) | 381 | 16 (3‐141) | 18 (2‐76) | 0.31 |
| Van den Berg 2015 | Length of hospital stay (median (range)) | 234 | I1: 10 (3‐63) I2: 10 (3‐27) | 11 (4‐71) | NR |
| Hospital readmissions & discharge destination | |||||
| Supplementation with ONS (in‐hospital) | |||||
| Potter 2001 | Discharge to home Discharge to institution | 381 381 | 131/186 31/186 | 127/195 33/195 | NS |
| Van den Berg 2015 | Hospital readmissions | 246 | I1: 13 I2: 24 | 15 | NR |
IQR: interquartile range; NR not reported; NS: not significant; ONS: oral nutritional supplement
| Outcome | (N) | Results | P Value | ||
| Intervention | Control | ||||
| Weight change | |||||
| Kretser 2003 | Mean change in weight (kg) | 163 | 1.86 (5.3) | ‐1,04 (5.2) | 0.0062 |
| Mortality | |||||
| Kretser 2003 | Mortality | 203 | 3/102 (3%) | 9/101 (9%) | NR |
NR: not reported
We sent an email request to authors of included trials to enquire whether they were willing to answer questions regarding their trials. Appendix 11 shows the results of this survey. Thereafter, we sought relevant missing information on the trial from the trial authors of the article, if required.
Dealing with duplicate publications
In the case of duplicate publications and companion papers of a primary trial, we have tried to maximise yield of information by inclusion of and simultaneous evaluation of all available data.
Assessment of risk of bias in included studies
Two review authors (CB and CEW) assessed each trial independently. We resolved possible disagreements by discussion amongst the three authors and made a judgement based on consensus.
We assessed risk of bias using the Cochrane tool for assessing risk of bias (Higgins 2011a; Higgins 2011b). We used the following risk of bias criteria.
-
Random sequence generation (selection bias)
-
Allocation concealment (selection bias)
-
Blinding (performance bias and detection bias), separated for blinding of participants and personnel and blinding of outcome assessment
-
Incomplete outcome data (attrition bias)
-
Selective reporting (reporting bias)
-
Other bias
We assessed risk of bias for each component of each trial as 'low risk', 'high risk' or 'unclear risk' as described in the Cochrane Handbook for Systematic Reviews of Interventions (Higgins 2011a).
Measures of treatment effect
We expressed dichotomous data as risk ratios (RRs) with 95% confidence intervals (CIs) and continuous data as mean differences (MDs) with 95% CIs.
Unit of analysis issues
We planned to take into account the level at which randomisation occurred, such as cross‐over trials, cluster‐randomised trials and multiple observations for the same outcome. For cross‐over trials data had to be available from baseline to the end of phase 1 of the cross‐over trial to be included in meta‐analyses. The cross‐over design as such was not feasible for our research question because of anticipated substantial carryover effects.
We could not recalculate data taking into account the design effect for cluster‐RCTs because we did not have reliable information about intracluster correlation coefficients for our substantial heterogeneous populations in the included trials. Therefore, we did not establish meta‐analyses by using both parallel and cluster‐RCTs but excluded the cluster‐RCTs from all meta‐analyses.
Dealing with missing data
Where feasible, we obtained relevant missing data from study authors. We investigated attrition rates, for example number of dropouts, losses to follow‐up and withdrawals, and critically appraised issues of missing data and imputation methods (e.g. last‐observation‐carried‐forward (LOCF)).
Assessment of heterogeneity
In the event of substantial clinical, methodological or statistical heterogeneity, we did not report trial results as the pooled effect estimate in a meta‐analysis. We identified heterogeneity (inconsistency) through visual inspection of the forest plots and by using a standard Chi² test with a significance level of α = 0.1. In view of the low power of this test, we also considered the I² statistic, which quantifies inconsistency across trials to assess the impact of heterogeneity on the meta‐analysis (Higgins 2002; Higgins 2003); where an I² statistic of 75% or more indicates a considerable level of heterogeneity (Deeks 2011).
When we found heterogeneity, we attempted to determine possible reasons for it by examining individual trial and subgroup characteristics.
Assessment of reporting biases
If we included 10 trials or more investigating a particular outcome and intervention, we planned to use funnel plots to assess small study effects. Several explanations can be offered for the asymmetry of a funnel plot, including true heterogeneity of effect with respect to trial size, poor methodological design (and hence bias of small trials) and publication bias. Therefore we interpreted results carefully (Sterne 2011).
Data synthesis
Prior to undertaking any data synthesis, two authors (CB, CEW) considered the clinical heterogeneity of the trials. The likelihood of clinical heterogeneity amongst trials was judged to be high in many cases, as trials were in populations with widely different clinical backgrounds, conducted in different healthcare settings, and despite some grouping of similar interventions, involved interventions that varied considerably. We undertook data synthesis, therefore, for some outcome measures only, by means of a random‐effects model.
Quality of evidence
We presented the overall quality of the evidence for each outcome according to the GRADE approach, which takes into account issues not only related to internal validity (risk of bias, inconsistency, imprecision, publication bias) but also to external validity such as directness of results. We presented a summary of the evidence in summary of findings Table for the main comparison. This provides key information about the best estimate of the magnitude of the effect, in relative terms and absolute differences, for each relevant comparison of alternative management strategies, numbers of participants and trials addressing each important outcome and the rating of the overall confidence in effect estimates for each outcome. We created the 'Summary of findings' table based on the methods described in the Cochrane Handbook for Systematic Reviews of Interventions (Schünemann 2011) by means of the Review Manager (RevMan) table editor (RevMan 2014). We included the Appendix 11 'Checklist to aid consistency and reproducibility of GRADE assessments' (Meader 2014) to help with standardisation of the 'Summary of findings' tables. We presented the results for the outcomes as described in the Types of outcome measures section. If meta‐analysis was not possible, we presented results in a narrative format in the 'Summary of findings' table. We justified all decisions to downgrade the quality of trials using footnotes, and we made comments to aid the reader's understanding of the review where necessary.
Subgroup analysis and investigation of heterogeneity
We undertook the following subgroup analysis.
-
Intervention category (e.g. changes to the organisation of nutritional care, changes to the feeding environment, modification of meal profile or pattern, additional supplementation of meals, congregate and home meal delivery systems)
Insufficient data were available to undertake the following subgroup analyses.
-
Intervention format (e.g. interventions given to individuals or groups of individuals)
-
Baseline nutritional status (e.g. judged to be malnourished or at risk of malnutrition)
-
Mean age of participants (e.g. below 65 years and 65 years or over)
-
Intervention setting (e.g. home, hospital, long‐term care facility, other community setting)
-
Intervention duration (e.g. short term (less than 3 months), medium term (3 to 6 months) or long term (above 6 months))
-
Intensity of intervention (e.g. number of visits/consults; considerations will be given to a post hoc analysis if sufficient data are available, as the intensity of intervention is very likely to differ according to care setting)
-
Effects beyond the cessation of intervention (e.g. maintenance of weight gain, continued improvements in health‐related quality of life)
-
Change in outcome versus no change in outcome for nutritional status and intake
Sensitivity analysis
We planned to perform sensitivity analyses to explore the influence of the following factors (when applicable) on effect sizes by restricting the analysis to the following.
-
Published trials
-
Taking into account risk of bias, as specified in the Assessment of risk of bias in included studies section
-
Very long or large trials to establish the extent to which they dominate the results
-
Trials using the following filters: diagnostic criteria, imputation, language of publication, source of funding (industry versus other), or country
We also planned to test the robustness of the results by repeating the analysis using different measures of effect size (RRs, ORs etc.) and different statistical models (fixed‐effect and random‐effects models).
Due to lack of data we only performed sensitivity analyses on some risk of bias.
Results
Description of studies
See: Characteristics of included studies; Characteristics of excluded studies; Characteristics of studies awaiting classification.
Results of the search
The electronic searches identified 29,155 records. An additional 1107 records were identified from searches of conference abstracts/proceedings, systematic reviews and reference lists of included trials. We screened a total of 30,262 records after removal of duplicates. Three review authors (MG, CEW and CB) independently scanned titles and abstracts from the first two searches and the Co‐ordinating Editor (Bernd Richter (BR)) and one review author (CB) screened titles and abstracts from the third search and fourth search. We did not identify any ongoing trials.
Three review authors (CB, CEW and MG) and the Co‐ordinating Editor (BR) assessed eligibility of trials against the inclusion criteria and grouped trials according to similar intervention categories. We identified a total of 41 randomised controlled trials (RCTs) for inclusion in the review (see Characteristics of included studies). The number of trials identified for each intervention category were as follows.
-
Changes to the organisation of nutritional care (N = 13)
-
Changes to the feeding environment (N = 5)
-
Modification of meal profile or pattern (N = 12)
-
Additional supplementation of meals (N = 10)
-
Congregate and home meal delivery systems (N = 1)
A PRISMA flow‐diagram of trial selection is shown in Figure 2.
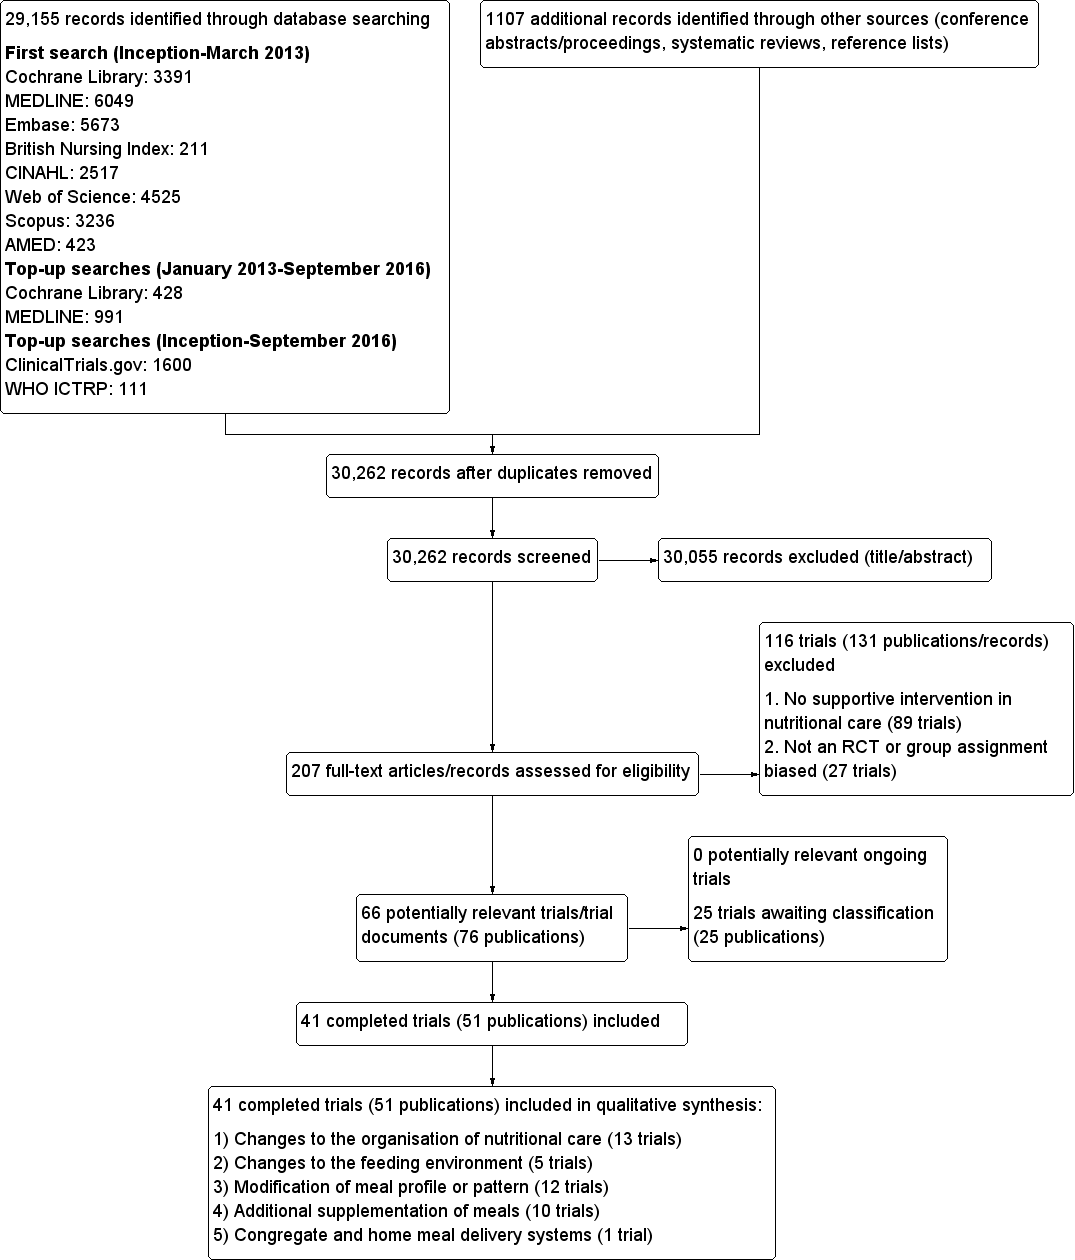
Study flow diagram
Contact with authors
Of the 41 included trials, we requested additional information on outcomes of interest and quality from the authors of 31 trials, and obtained it for 15 (Barton 2000; Beck 2002, Bouillanne 2013; Bourdel‐Marchasson 2000; Dennis 2005; Duncan 2006; Faxen‐Irving 2011; Gaskill 2009; Germain 2006; Hickson 2004; Holyday 2012; Olofsson 2007; Simmons 2008; Simmons 2010; Smoliner 2008). For six of the 15 trials where the study authors responded, they were unable to provide the data requested, or the data were not usable in a meta‐analysis (Barton 2000; Beck 2002; Bourdel‐Marchasson 2000; Gaskill 2009; Simmons 2008; Simmons 2010). The authors of the remaining 16 trials did not respond (Castellanos 2009; Chang 2005; Essed 2007; Essed 2009; Hankey 1993; Johansen 2004; Kraft 2012; Larsson 1990; Lin 2010; Mathey 2001a; Mathey 2001b; Pivi 2011; Potter 2001; Salva 2011; Splett 2003; Van Ort 1995).
Missing data
Despite the comprehensive search strategies used to identify trials in this review, it is possible that we have missed additional trials (e.g. unpublished trials, those published in obscure places, or those inappropriately indexed in databases).
The largest source of missing data in this review arose from data on outcomes that were measured but reported in such a way that they were unusable for entry into a meta‐analysis, because the data were reported as a median and interquartile range or were expressed as kcal/kg or the standard deviation (SD ) of change was not reported. The details of the amount of missing data according to intervention group are given in Table 3; Table 4; Table 5; Table 6 and Table 7. We contacted study authors in an attempt to obtain any missing data. The reasons for contacting authors and the outcome of contacts are described in Table 8 and Appendix 11.
Where it was not possible to obtain original data from study authors, we either imputed data, for example, standard deviations, using methods described in the Cochrane Handbook for Systematic Reviews of Interventions (Higgins 2011c), or used formulae for combining groups as outlined in Table 8.
The majority of included trials did not report intention‐to‐treat analyses.
Dealing with duplicate publications/companion papers
Six trials included in this review had duplicate or companion publications (Essed 2007; Hickson 2004; Larsson 1990; Lin 2010; Nijs 2006; Potter 2001).
Included studies
This systematic review identified 41 randomised controlled trials, with a total of 10,681 randomised participants (ranging from 8 (Van Ort 1995) to 4023 (Dennis 2005)). One included trial is awaiting clarification of participant numbers from the study authors (Larsson 1990). This trial had several publications, which stated varying numbers of participants (435 to 501). The primary reference reported data on 435 participants and this is the number that we would use in any meta‐analysis (Larsson 1990).
Participants were from a variety of countries including Australia, Brazil, CanadaDenmark, France, Germany, Netherlands, Spain, Sweden, Taiwan, , UK, and USA. Approximately 70% of participants were female (no information was provided for gender in three trials (Chang 2005; Larsson 1990; Simmons 2008). In those trials that reported ages in the intervention and usual care groups separately (N = 23), the mean age ranged from 62 to 87 years. Where the age of participants was reported for intervention and comparison groups separately, the mean age ranged from 75.2 to 87.3 (N = 11) (no data were provided for mean age in three trials (Kretser 2003; Potter 2001; Simmons 2008).
Altogether seven of the 41 included RCTs had a cross‐over design (Barton 2000; Castellanos 2009; Essed 2009; Lin 2011; Silver 2008; Simmons 2008; Taylor 2006), 12 a cluster‐randomised design (Bourdel‐Marchasson 2000; Chang 2005; Gaskill 2009; Leslie 2012; Lin 2010; Lin 2011; Mathey 2001a; Nijs 2006; Salva 2011; Simmons 2008; Smoliner 2008; Splett 2003) and one was a factorial RCT (Essed 2007). Two trials had both a cluster‐randomised and a cross‐over design (Lin 2011; Simmons 2008). One large trial investigating a normal hospital diet plus oral nutritional supplements versus a normal hospital diet in participants with a recent stroke randomised 38% participants (4023/10,681) of all individuals in the 41 included trials (Dennis 2005).
Interventions were carried out in the hospital setting (described as elderly rehabilitation wards, intermediate care units, geriatric units, acute trauma wards, geriatric acute wards, geriatric orthopaedic wards, medicine for the elderly units and acute medical admissions) (N = 15), residential care homes (N = 21) and free‐living or outpatient settings (N = 5) including neurology outpatients, and those enrolled at hospital discharge (see Table 9).
Nutritional status was reported in 27 trials, either because it was assessed at baseline or it was one of the criteria for inclusion in the trial (Beck 2002; Bouillanne 2013; Essed 2007; Essed 2009; Faxen‐Irving 2011; Gaskill 2009; Germain 2006; Hickson 2004; Holyday 2012; Johansen 2004; Kraft 2012; Kretser 2003; Larsson 1990; Leslie 2012; Lin 2010; Lin 2011; Munk 2014; Nijs 2006; Mathey 2001b; Olofsson 2007; Potter 2001; Remsburg 2001; Salva 2011; Silver 2008; Smoliner 2008; Taylor 2006; Van den Berg 2015). The remaining trials did not assess nutritional status at trial inclusion but we judged them appropriate to be included in this review as the clinical background of trial participants meant that they could be considered to be at risk of malnutrition or the patients were described as frail or vulnerable. Ten of 16 trials used a score from the Mini Nutritional Assessment (MNA) tool of 17 to 23.5 or less than 17 (Beck 2002; Essed 2007; Essed 2009; Holyday 2012; Kretser 2003; Nijs 2006; Olofsson 2007; Salva 2011; Smoliner 2008; Taylor 2006), to indicate risk of malnutrition, one trial used the Subjective Global Assessment score (SGA) (Gaskill 2009), two used the Nutritional Risk Screening 2002 (NRS‐2002) tool (Johansen 2004; Munk 2014), eight used only body mass index (BMI) (Faxen‐Irving 2011; Hickson 2004; Leslie 2012; Lin 2010; Lin 2011; Mathey 2001b; Remsburg 2001; Silver 2008), four used a combination of indices with variable cut‐offs (Bouillanne 2013; Germain 2006; Kraft 2012; Larsson 1990) and one used their own classification scoring system (Potter 2001). The average BMI measurements, in the trials that clearly reported BMI in all participants, ranged from less than 18.5 kg/m² (Kretser 2003) to 28.7 kg/m² (Nijs 2006)
The most commonly reported outcomes of interest to this review were nutritional intake (predominantly energy and protein), weight and mortality. These were reported in 27, 28 and 18 trials respectively. The three primary outcomes in the review, nutritional intake, health‐related quality of life and morbidity and complications, were reported in 27, 5, and 5 trials respectively. Patient satisfaction, hospital admission and costs were reported for a limited number of trials (2, 2 and 3 respectively). Six trials reported no usable data for potential combination in a meta‐analysis (Beck 2002; Castellanos 2009; Chang 2005; Gaskill 2009; Splett 2003; Van Ort 1995). We contacted the study authors who either were unable to provide the data requested, or failed to respond (see Table 8 and Appendix 11).
The outcomes reported in all intervention groups and those of use in this review, are summarised in Table 7.
Length of intervention and follow‐up
Length of intervention and follow‐up ranged from ‘length of hospital stay’ to 12 months in the included trials. In one trial, the length of intervention was unclear (Gaskill 2009). In 7 of 38 trials (Brouillette 1991; Dennis 2005; Duncan 2006; Gaskill 2009; Holyday 2012; Johansen 2004; Olofsson 2007) the follow‐up period extended beyond the intervention from two weeks to six months.
Further results of the included trials are given in their individual intervention categories (see Appendix 3 for description of interventions).
Changes to the organisation of nutritional care
We identified 13 trials for this category (Chang 2005; Duncan 2006; Gaskill 2009; Hickson 2004; Holyday 2012; Johansen 2004; Kraft 2012; Lin 2010; Lin 2011; Olofsson 2007; Pivi 2011; Salva 2011; Splett 2003), (N = 3426, 32.4% of review participants). Participants either had dementia, hip fractures or were from a range of clinical backgrounds, living in residential care homes, hospital or their own homes. Interventions consisted of the use of dietetic assistants (Duncan 2006; Hickson 2004), multidisciplinary team care (Johansen 2004), specialised teaching and training (Chang 2005; Gaskill 2009; Lin 2010; Lin 2011; Pivi 2011; Salva 2011), protocol‐driven nutrition care pathways (Holyday 2012; Splett 2003), multicomponent intervention (Olofsson 2007) and monitoring by telemedicine (Kraft 2012). Duration ranged from a few days of hospital stay to 12 months, and follow‐up from 28 days to 12 months. We have summarised the outcomes reported, and those usable for this review, Table 4.
Changes to the feeding environment
We identified five trials for this category (Brouillette 1991; Mathey 2001a; Nijs 2006; Remsburg 2001; Van Ort 1995), (N = 351, 3.3% of review participants). All trials were conducted in elderly participants living in residential care homes. Interventions consisted of the use of osmotherapy (pre‐meal sensory stimulation) (Brouillette 1991), improving mealtime ambience (Mathey 2001a), using family style meals (Nijs 2006), a buffet‐style meal service (Remsburg 2001), and a contextual/behavioural intervention (Van Ort 1995). Duration of intervention ranged from 3 weeks to 12 months, and follow‐up ranged from 4 weeks to 12 months. We have summarised the outcomes reported, and those usable for this review, in Table 4.
Modification of meal profile or pattern
We identified 12 trials for this category (Barton 2000; Bouillanne 2013; Castellanos 2009; Essed 2007; Essed 2009; Germain 2006; Leslie 2012; Mathey 2001b; Munk 2014; Silver 2008; Smoliner 2008; Taylor 2006), (N = 649, 6% of review participants). The trial by Barton 2000 included three groups, two of which were randomised to treatment or control and one other where it was unclear whether there was randomisation. Data have therefore only been included for those participants who were randomised to the treatment and usual care groups (N = 27). The trials included people from a range of clinical backgrounds who were in hospital (Barton 2000; Bouillanne 2013; Munk 2014), residential care homes (Castellanos 2009; Essed 2007; Essed 2009; Germain 2006; Leslie 2012; Mathey 2001b; Smoliner 2008; Taylor 2006), and free‐living participants in receipt of home‐delivered lunch meals (Silver 2008). Interventions consisted of altering portion sizes or fortifying meals, or both (Barton 2000; Castellanos 2009; Leslie 2012; Silver 2008), providing 78% of daily protein requirements at the lunch time meal, rather than spread evenly throughout the day (Bouillanne 2013), modifying the taste of foods previously identified as preferred (Essed 2007; Essed 2009; Mathey 2001b), modification of the appearance and presentation of pureed foods, thickened beverages, and dietary supplements (Germain 2006), the provision of an a la carte menu of enriched meals (Munk 2014) and altering meal pattern (Taylor 2006). We have summarised the outcomes reported, and those of use in this review, in Table 5.
Additional supplementation of meals
We identified 10 trials for this category (Beck 2002; Bourdel‐Marchasson 2000; Dennis 2005; Faxen‐Irving 2011; Hankey 1993; Larsson 1990; Potter 2001; Simmons 2008; Simmons 2010; Van den Berg 2015) (N = 6022, 56.4% of review participants). One trial did not state clearly the number of participants as additional publications appeared to include different numbers (Larsson 1990). As stated in the primary reference, 435 participants were therefore included in this review. The trial by Simmons 2008 was a two‐phase crossover and cluster‐randomised trial where residents were randomised only if they had a low oral food and fluid intake and were responsive to one of two feeding‐assistance interventions. This randomised sub‐group of intervention and control participants were then crossed over. We used data from the intervention and comparison groups prior to cross‐over in this review, as additional participants were added to the trial at the crossover.
One trial (Dennis 2005) included only people who had had a stroke . Other trials included either mixed participants, or did not report diagnoses. The majority of participants were from the hospital setting (Bourdel‐Marchasson 2000; Dennis 2005; Faxen‐Irving 2011; Hankey 1993; Larsson 1990; Potter 2001; Van den Berg 2015), and only 168 were from residential care homes (Beck 2002; Simmons 2008; Simmons 2010). In nine RCTs participants were offered between 400 kcal/day to 685 kcal/day in the form of a protein‐energy oral nutritional supplement, in addition to usual diet. In the other RCT participants were offered up to 420 kcal extra using 90 mL of fat emulsion/day (Faxen‐Irving 2011). We have summarised the outcomes reported, and those of use in this review, in Table 6.
Congregate and home meal delivery systems
We identified one trial for this category (Kretser 2003), including 203 free‐living participants (2% of review participants). Participants were offered modified home‐delivered meals with a daily follow‐up phone call. The outcomes of interest reported in this review included weight, clinical function, Activities of Daily Living score and number of deaths.
Excluded studies
Of the 182 trials/trial records after eligibility assessment, we excluded 27 trials as they were non‐randomised controlled trials or the group assignment was made after randomisation, and 89 trials that did not describe supportive interventions in nutritional care. It was necessary for all four review authors to participate in discussion about the reasons for exclusion of trials from intervention category four, ‘additional supplementation of meals’. Trials were excluded in this group for the following reasons.
-
Participants were not from an institutionalised setting; therefore it was considered that they would have been given individualised advice on taking oral nutritional supplements.
-
No clear organisational component to the intervention was described (for example when supplements were given without a clear description of delivery (i.e. administered at the same time as medication, or in place of usual morning/afternoon tea), or frequency of delivery).
-
Trials with multi component interventions where it was not possible to extract data relating to the specific effect of nutritional intervention.
Twenty‐four trials are awaiting assessment.
Risk of bias in included studies
The judgements made about risk of bias for individual trials are detailed in the 'risk of bias' section (Characteristics of included studies). A ‘Risk of bias summary’, and ‘Risk of bias graph’ are shown in Figure 3 and Figure 4. We judged the majority of criteria used in the assessment of risk of bias as unclear, indicating insufficient information to permit a full assessment of the risk of bias. The exceptions were attrition bias and reporting bias, where we judged the majority of trials (61% and 76% respectively) as being at low risk of bias (Figure 4).
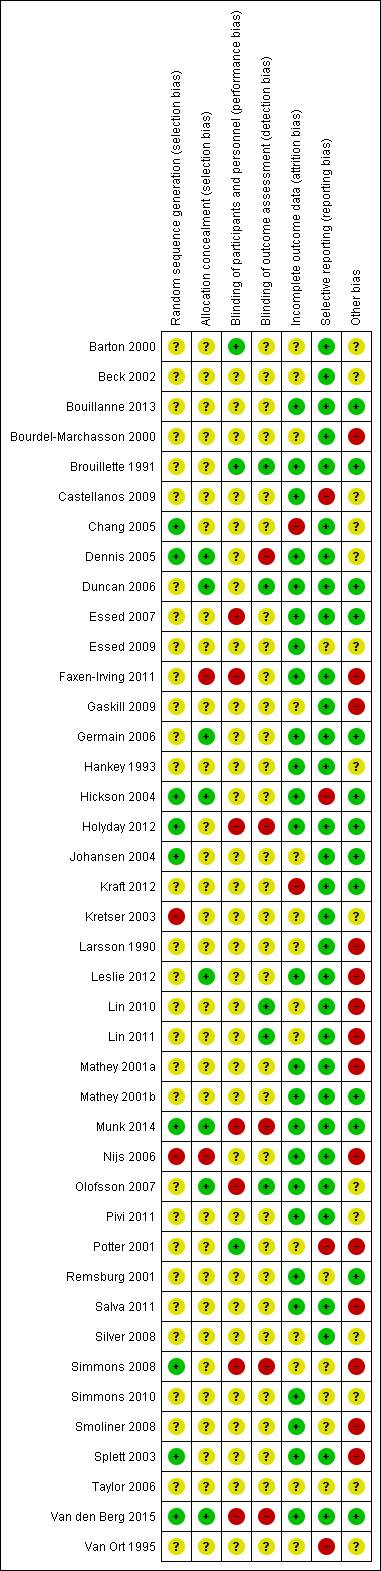
Risk of bias summary: review authors' judgements about each risk of bias item for each included trial.
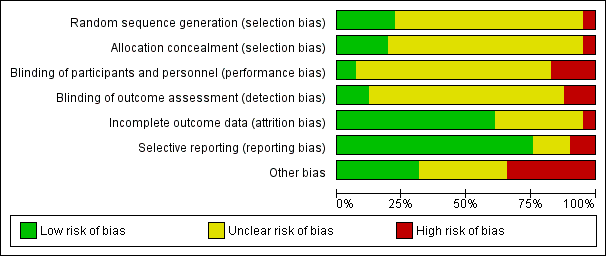
Risk of bias graph: review authors' judgements about each risk of bias item presented as percentages across all included trials.
Allocation
Generation of sequence
We assessed nine of 41 trials (Chang 2005; Dennis 2005; Hickson 2004; Holyday 2012; Johansen 2004; Munk 2014; Simmons 2008; Splett 2003; Van den Berg 2015), as being at low risk of bias for the method of random sequence generation. Two of these trials used the toss of a coin as a method of randomisation (Chang 2005; Simmons 2008), one used a sequence generated by a member of staff not involved in the trial (Munk 2014) and another used a random number table (Splett 2003). The other trials in this group used computer‐generated randomisation methods.
Two of 41 trials ( Kretser 2003; Nijs 2006) used inadequate methods of randomisation and we consequently gave them a high risk of bias. In another trial (Kretser 2003) the authors stated "randomised treatment assignment was followed with a few exceptions". When the participants were randomised to receive the new meals on wheels and refused, they were automatically placed on the traditional meals on wheels model. We therefore considered that allocation was made by preference of the participant. In the trial by Nijs 2006 the investigators described a non‐random component in the sequence generation process, based on the name of the ward. This was therefore given a high risk of bias score.
One trial did not detail whether the third intervention group was randomised, and subsequently received an unclear risk of bias (Barton 2000). The remaining trials in the review provided insufficient information about the sequence generation process to permit judgement of low or high risk of bias. We therefore categorised them as unclear risk of bias.
Allocation concealment
We assessed eight of 41 trials (Dennis 2005; Duncan 2006; Germain 2006; Hickson 2004; Leslie 2012; Munk 2014; Olofsson 2007; Van den Berg 2015), as being at low risk of bias for allocation concealment , as they used sequentially numbered or opaque sealed envelopes opened by a member of staff not involved in the trial, or allocation was made by a statistician having no other contact with the participants. The trial by Faxen‐Irving 2011 was considered to be at a high risk of allocation concealment, as they used sealed envelopes without describing the appropriate safeguards, for example, not sequentially numbered, or opaque. This suggested that participants, or investigators enrolling participants, could predict assignments, and thus introduce selection bias. Another trial used no concealment and therefore we judged it to be at a high risk of bias (Nijs 2006). The remaining trials included in the review we categorised as unclear risk of bias, as they provided insufficient information to permit a full assessment of the risk of bias.
Blinding
Blinding of participants and personnel (performance bias)
We judged three of 41 trials (Barton 2000; Brouillette 1991; Potter 2001) to be at a low risk of bias, as the trial participants were blind to group allocation or to what treatment they were receiving. We also judged that blinding was unlikely to have been broken throughout the trials. To give examples, in the trial by Barton 2000 the participants and staff were blinded to which menu they were following. In the trial by Brouillette 1991, the research assistant was unaware of group assignment. We awarded Potter 2001 a low risk of bias score, as researchers who knew the randomisation codes were not involved in outcome data collection or data entry.
We judged seven of 41 trials (Essed 2007; Faxen‐Irving 2011; Holyday 2012; Munk 2014; Olofsson 2007; Simmons 2008; Van den Berg 2015) to be at high risk of bias, predominantly due to a lack of blinding of key trial personnel. In the trial by Essed 2007 there was incomplete blinding, as participants were blinded but the research personnel were not. In the trial by Faxen‐Irving 2011, study nurses opened sealed envelopes, therefore would have been aware of group allocation. In the trial by Holyday 2012, the authors stated it was not possible to blind the clinical dietitian to group allocation. We therefore judged that the outcome was likely to be influenced by a lack of blinding of key trial personnel. Additionally, the trial by Olofsson 2007 stated that staff on the usual care ward were aware of a programme being implemented on another ward in the hospital. It was therefore judged that outcome assessment was likely to be influenced by lack of blinding to these key trial personnel. The remaining trials in the review we categorised as unclear risk of bias, as insufficient information was provided to permit judgement.
Blinding of outcome assessment (detection bias)
We judged five of 41 trials (Brouillette 1991; Duncan 2006; Lin 2010; Lin 2011; Olofsson 2007) to be at low risk of bias. Researchers assessing outcomes were unaware of treatment allocation; therefore we judged that the blinding was unlikely to have been broken. We judged five of 41 trials (Dennis 2005; Holyday 2012; Munk 2014; Simmons 2008; Van den Berg 2015) as at high risk of bias, as outcome assessment was not blinded, and the outcome measurement was likely to be influenced by the lack of blinding. One trial stated, “as the outcomes are primarily objective measures, they are mostly not open to the influence of bias” (Holyday 2012). Additionally, the trial by Dennis 2005 stated “follow up was masked to treatment allocation except when patients or carers inadvertently divulged it to an interviewer, which was usually, but not systematically recorded”. In the trial by Simmons 2008 outcomes were not assessed blinded to treatment and the outcomes were judged to be susceptible to detection bias. In the trial by Van Ort 1995, the research staff who observed videotapes were unaware of the trial hypothesis, but were aware of group allocation. We gave this trial, and the remaining 28 trials, an unclear risk of bias, as insufficient information was provided to permit judgement of the risk of bias.
Incomplete outcome data
The numbers of participants excluded from trials, along with reasons, were fully reported in 25 out of 41 trials and we judged these to have a low risk of bias. The number of participant exclusions ranged from 0% to 81%. The trial by Chang 2005 we judged to be at high risk of bias, because data were presented on only 20 of the 36 participants, without explanation. We judged another trial as high risk due to the high attrition rate in the intervention group (Kraft 2012). Here, eight participants out of 13 in the intervention group withdrew, and three out of 13 in the usual care group withdrew.
We included a total of 14 trials in the unclear risk of bias category. Three trials did not report exclusions (Barton 2000; Beck 2002; Simmons 2008). One of these is awaiting clarification from the trial author (Beck 2002), and another only reported participant exclusions in one of the intervention groups (Barton 2000). In a further three trials, the numbers of exclusions were unclear (Bourdel‐Marchasson 2000; Gaskill 2009; Larsson 1990). Six trials only reported a total number finishing the trial, rather than a breakdown for the intervention and usual care groups separately (Johansen 2004; Kretser 2003; Lin 2010; Silver 2008; Taylor 2006; Van Ort 1995). Each of these trials stated why participants dropped out, however it was unclear which group they were allocated to. Simmons 2008 reported dropouts from each group, however only described mortality as the primary reason (58%). One trial did not describe attrition (Lin 2011), and another trial reported outcome in relation to BMI and triceps skinfold thickness (TSF), but not BMI and TSF alone (Potter 2001).
Selective reporting
Thirty‐one of the 41 trials reported all outcomes as stated in the trial methodology, and we therefore judged them to be at low risk of bias. We categorised four trials as high risk of bias (Castellanos 2009; Hickson 2004; Potter 2001; Van Ort 1995). In the trial by Potter 2001, one or more outcomes of interest to the review were described as collected but were incompletely reported. In another trial, results for the whole group were not reported according to the initial randomisation (Castellanos 2009). In the trial by Hickson 2004, no data were reported on: use of service questionnaires, referral rate to therapists, readmission within six months, laxative use, pressure sores and economic analysis. In the trial by Van Ort 1995, outcomes were described in the methodology, however no quantitative data were reported. We categorised the remaining six trials as unclear risk of bias (Essed 2009; Remsburg 2001; Simmons 2008; Simmons 2010; Smoliner 2008; Taylor 2006), as insufficient information was provided in order to make a judgement on risk of bias.
Other potential sources of bias
We judged 13 of the 41 trials as low risk of bias, as intervention and usual care groups were comparable at baseline (Bouillanne 2013; Brouillette 1991; Duncan 2006; Essed 2007; Germain 2006; Hickson 2004; Holyday 2012; Johansen 2004; Kraft 2012; Mathey 2001b; Munk 2014; Remsburg 2001; Van den Berg 2015). In Hickson 2004, there were significantly more women in the intervention compared with the usual care group, but otherwise groups were comparable. Three parallel RCTs were judged at high risk of bias (Faxen‐Irving 2011; Larsson 1990; Potter 2001). Faxen‐Irving 2011 provided data only from those who completed the trial, potentially missing valuable data for those who dropped out. In the trial by Larsson 1990, there were significant differences between groups at baseline. TSF and weight index in men, and mid‐arm circumference (MAC) in women were significantly lower in the intervention group than the control. The intervention group also had a significantly poorer mental condition as assessed using the modified Norton score on admission. In the trial by Potter 2001, only half of those in the ‘well nourished’ group were randomised, therefore bias was likely to have occurred. We categorised 14 trials as unclear risk of bias, as there was insufficient information to assess whether an important risk of bias existed.
We considered the following risk of bias criteria for the 12 cluster‐RCTs (Bourdel‐Marchasson 2000; Chang 2005; Gaskill 2009; Leslie 2012; Lin 2010; Lin 2011; Mathey 2001a; Nijs 2006; Salva 2011; Simmons 2008; Smoliner 2008; Splett 2003): (a) recruitment bias, (b) baseline imbalance, (c) loss of clusters, (d) incorrect analysis, and (e) comparability with individually randomised trials or different types of clusters as described in the Cochrane Handbook for Systematic Reviews of Interventions (Higgins 2011c). If any of the aforementioned criteria applied, we assigned a high risk of 'other bias'. Consequently, all included cluster RCTs had a high risk of bias. In the trial by Chang 2005 it was unclear whether randomisation occurred at the unit level (more probable) or the individual level. We therefore judged this trial to be an unclear risk of other bias.
Effects of interventions
We could not recalculate data taking into account the design effect for the 12 cluster RCTs (Bourdel‐Marchasson 2000; Chang 2005; Gaskill 2009; Leslie 2012; Lin 2010; Lin 2011; Mathey 2001a; Nijs 2006; Salva 2011; Simmons 2008; Smoliner 2008; Splett 2003) because we did not have reliable information about intracluster correlation coefficients for our substantial heterogeneous populations in the included trials. Therefore, we did not establish meta‐analyses by using both parallel and cluster RCTs but excluded the cluster RCTs from all meta‐analyses. Also, cross‐over trials did not contribute to the effect estimates established by meta‐analyses.
Overview of all trials combined
Primary Outcomes
Nutritional intake
Data on this outcome were reported in 27 of 41 trials (Barton 2000; Beck 2002; Bouillanne 2013; Bourdel‐Marchasson 2000; Brouillette 1991; Castellanos 2009; Chang 2005; Duncan 2006; Essed 2007; Essed 2009; Faxen‐Irving 2011; Germain 2006; Hankey 1993; Hickson 2004; Johansen 2004; Leslie 2012; Lin 2010; Mathey 2001a; Mathey 2001b; Munk 2014; Nijs 2006; Potter 2001; Silver 2008; Simmons 2008; Simmons 2010; Taylor 2006; Van den Berg 2015).
The trials reporting on change in energy intake were in participants from a range of clinical backgrounds and healthcare settings and there were differences between trials in how energy intake was assessed (from observations of amounts eaten to detailed weighing and analysis). The majority of trials found no marked difference in energy intake between groups. One trial of assistance at mealtimes in hospitalised patients with hip fracture (Duncan 2006) reported a greater energy intake in the intervention group than in the usual care group (1105 kcal (SD 361) versus 759 (SD 399), P < 0.001) and a trial of a multidisciplinary team intervention in hospitalised patients (Johansen 2004) reported a higher intake in the intervention group than in the control group (Table 10). Two trials of fortification of meals (Barton 2000; Silver 2008) reported greater energy intakes in participants receiving the fortification than those receiving usual care (Table 15) and one trial of modifications to the appearance and presentation of foods to individuals with dysphagia (Germain 2006) reported a greater energy intake in the participants receiving the intervention (Table 15). Two of 10 trials of supplementation of meals with oral nutritional supplements (Hankey 1993; Van den Berg 2015) reported a higher energy intake in groups receiving the supplement, however the between‐group differences were not reported (Table 19).
Health‐related quality of life and patient satisfaction
Data on health‐related quality of life were reported in five of 41 trials (Dennis 2005; Johansen 2004; Mathey 2001a; Nijs 2006; Smoliner 2008). Data were collected using different quality‐of‐life instruments; two trials used the Short Form‐36 (SF‐36) (Johansen 2004; Smoliner 2008), one trial used the Dutch quality of life of somatic nursing home residents questionnaire (Nijs 2006), one used the European Quality of Life Scale (EuroQOL‐5D or EQ‐5D) (Dennis 2005) and the final trial (Mathey 2001a) used the Sickness Impact Profile (SIP) and Philadelphia Geriatric Center Morale Scale (PGCMS, 17 items). The trials reporting on health‐related quality of life included participants from a wide range of different clinical backgrounds. No marked differences between groups were found in four trials (Dennis 2005; Johansen 2004; Mathey 2001a; Smoliner 2008) (Table 11; Table 16; Table 23), the overall quality of evidence was low and two trials were cluster‐randomised trials and therefore at high risk of bias (Mathey 2001a; Smoliner 2008). Nijs 2006 assessed health‐related quality of life using a validated Dutch questionnaire (Van Campen 1998). This questionnaire consists of five sub‐scales, each representing a quality‐of‐life dimension: sensory functioning (focusing on pain); physical functioning (perceived performance and self care); psychosocial functioning (depression or loneliness); perceived autonomy (freedom of movement); and perceived safety (feeling at home in the institution). The number of statements in the five sub‐scales is not equal. The questionnaire consists of 50 statements, scored on a dichotomous scale (yes or no). Each sub‐scale and the total questionnaire is computed to achieve a score from 0 to 100. A high score represents a high quality of life. The results were presented as difference in changes in overall quality of life between the groups and were reported as statistically significant (6.1 units, 95% confidence interval (CI) 2.1 to 10.3). The intervention group remained stable (0.4 units, 95% CI 1.8 to 2.5), whereas the usual care group declined (‐0.5 units, 95% CI ‐9.4 to 0.6), although the overall changes were small and it is unclear if the observed differences were likely to be noticeable to participants (Table 16). Moreover, this trial was at high risk of bias. Therefore, all reported outcome measures of this trial must be interpreted with caution.
Data on patient satisfaction were reported in two trials (Duncan 2006; Salva 2011). Duncan 2006 assessed patient satisfaction using an unvalidated questionnaire with 10 questions about aspects of meals, diet and feeding. Participants answered yes or no, where yes = 1, no = ‐1 and NA = 0. Those participants who had received the support of the dietetic assistants showed greater satisfaction, with a median score of 6.5 (interquartile range (IQR) 2) compared to 3 (IQR 4) for participants receiving usual care (P < 0.0001) (Table 11). In the trial by Salva 2011 satisfaction of participants and their families was assessed by an unvalidated questionnaire which asked about the use of and perceived usefulness of five aspects of the overall programme. Families and carers were asked to indicate whether they had used the service and whether they had found it very useful, useful or not very useful. Information cards were used by 94.5% of families and rated the service as very useful (26%) or useful (67%). The nutrition course was used by 66% of families and rated as very useful (24%) and useful (65%). Weight curves were sent to 88% of families and rated as very useful (13%) and useful (78%). Information sessions were attended by 75% of families and rated as very useful (32%) and useful (61.5%). The hot line was used by 33% of families and rated as very useful (17%) and useful (51%).
Morbidity/complications
Data on this outcome were reported in seven of 41 trials (Bouillanne 2013; Bourdel‐Marchasson 2000; Dennis 2005; Duncan 2006; Hickson 2004; Johansen 2004; Olofsson 2007). Complications were reported as either the number of participants experiencing any complication (Bouillanne 2013; Dennis 2005; Duncan 2006; Johansen 2004; Olofsson 2007), number of participants with pressure ulcers (Bourdel‐Marchasson 2000; Dennis 2005) or the number of participants needing oral antibiotics (Hickson 2004). Trials were in participants from different clinical backgrounds, in different healthcare settings and receiving interventions that aimed to be supportive of improved nutritional intake, and varied widely. There were no marked differences in complication rates between groups reported in any trial (Table 11).
Meta‐analysis of trials reporting number of participants experiencing any complication showed considerable inconsistency (I² = 91%). Risk ratios ranged between 0.59 indicating benefit for supportive interventions, to 1.42 indicating benefit of control interventions (5 trials; 4015 participants; very low‐quality evidence; Analysis 1.1).
Secondary Outcomes
Nutritional status
Weight change
Data on this outcome were reported in 28 of 41 trials (Beck 2002; Bouillanne 2013; Chang 2005; Duncan 2006; Essed 2007; Faxen‐Irving 2011; Germain 2006; Hankey 1993; Hickson 2004; Holyday 2012; Johansen 2004; Kraft 2012; Kretser 2003; Larsson 1990; Leslie 2012; Lin 2010; Mathey 2001a; Mathey 2001b; Munk 2014; Nijs 2006; Olofsson 2007; Pivi 2011; Potter 2001; Remsburg 2001; Salva 2011; Simmons 2008; Simmons 2010; Smoliner 2008). Trials were in participants from different clinical backgrounds, in different healthcare settings and receiving interventions which, although aiming to support improved nutritional intake, varied from one another in the nature of the intervention.
Meta‐analysis across 17 trials with adequate data on weight change revealed an overall improvement in weight in favour of supportive interventions versus control: mean difference (MD) 0.6 kg (95% CI 0.21 to 1.02); P = 0.003; 2024 participants; moderate‐quality evidence; Analysis 1.2. However, heterogeneity was moderate (I² = 51%). We excluded the trial by Pivi 2011 from this meta‐analysis because missing SDs for weight change could not be reliably imputed. Trial authors reported a significant difference between intervention groups using a P value < 0.001. Using a P value of 0.0005 for imputation of SDs resulted in an SD of 3.3. Using these data did not substantially alter the effect estimate. Some other trials showed bias from different sources, however, exclusion of these trials did not substantially change the overall effect estimate. Also, elimination of any subtype of supportive intervention did not change the overall effect estimate in a substantial way. The body of evidence for this outcome consisted mainly of trials on change to the organisation of nutritional care (6 trials). However, the interaction test for subgroup differences was significant indicating the need to further investigate the various types of supportive interventions in future trials (Figure 5).
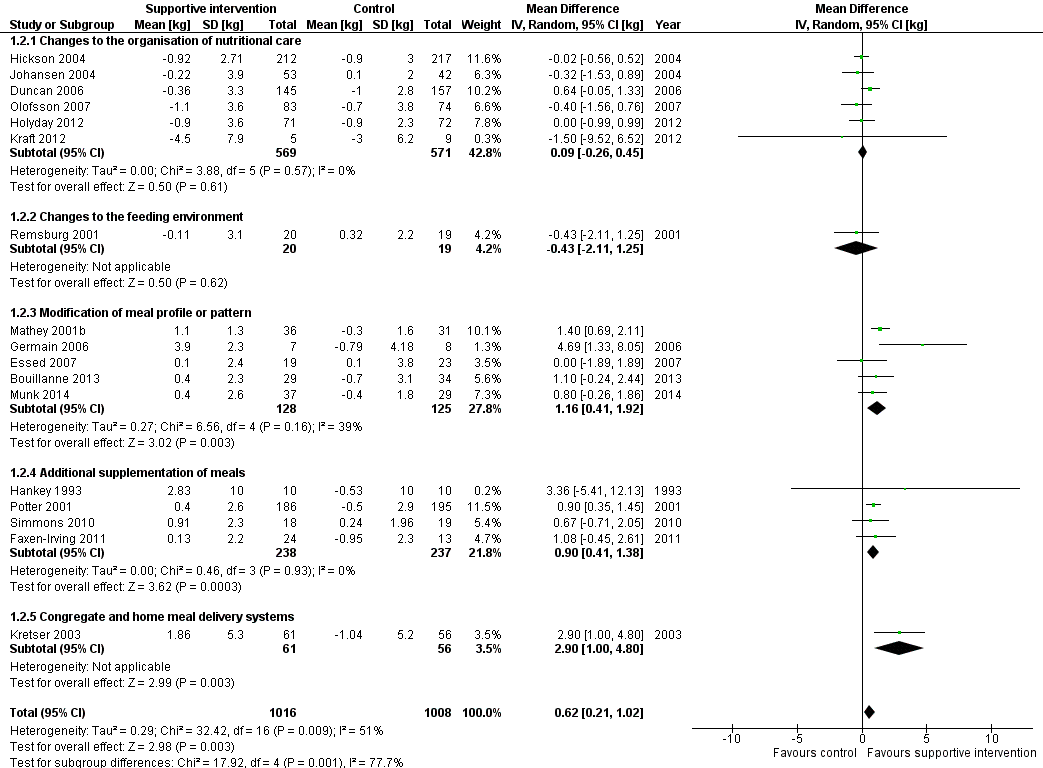
Forest plot of comparison: 1 Supportive interventions for enhancing dietary intake versus comparators, outcome: 1.2 Nutritional status (weight change) (kg)
Change in BMI
Data on change in BMI were reported in 12 of 41 trials (Faxen‐Irving 2011; Germain 2006; Hickson 2004; Kraft 2012; Leslie 2012; Lin 2010; Lin 2011; Olofsson 2007; Pivi 2011; Salva 2011; Simmons 2008; Smoliner 2008). Trials were in participants from different clinical backgrounds, in different healthcare settings and receiving interventions that aimed to support improved nutritional intake but varied from one another. The majority of trials reported no marked difference in BMI between groups. In the trial by Pivi 2011 participants receiving specialist training experienced an increase in BMI (1.2 kg/m² (SD 1)) and participants in the usual care group experienced a reduction in BMI (‐2.2 kg/m² (SD 1)). However, the between‐group difference and statistical tests were not reported. The trial by Germain 2006, which examined the effects of modifications to the presentation of meals to participants with dysphagia, and in the trial by Leslie 2012 of food fortification in residential care homes, the intervention group had a greater gain in BMI than the usual care group (Table 17). However, between‐group differences with statistical tests were not reported. In the trial by Faxen‐Irving 2011 BMI was reported according to group at the end of the intervention and there was no marked difference between groups, change from baseline and between‐group differences were not reported. In the trial by Simmons 2008 the intervention group gained 0.7 kg/m² more than the usual care group (P < 0.009) (Table 24).
Change in TSF
Data on this outcome were reported in five of 41 trials (Duncan 2006; Hankey 1993; Hickson 2004; Larsson 1990; Pivi 2011). Trials were in participants receiving assistance during mealtimes (Duncan 2006; Hickson 2004), specialist training (Pivi 2011) and supplementation with oral nutritional supplement (Hankey 1993; Larsson 1990) in different healthcare settings. There were no marked differences in TSF reported between groups in the trials by Duncan 2006, Hickson 2004 and Pivi 2011. In the trials by Hankey 1993 and Pivi 2011 data were presented in figures with minimal description in the text. In the trial by Hankey 1993 the intervention group was described as experiencing a smaller decrease in TSF than the usual care group (6.6% versus 15.8%). In the trial by Larsson 1990 TSF decreased over the 26 weeks of follow‐up in both groups with the greatest decrease occurring in the usual care group.
Change in MAC
Data on this outcome were reported in eight of 41 trials (Duncan 2006; Hankey 1993; Hickson 2004; Larsson 1990; Leslie 2012; Nijs 2006; Pivi 2011; Potter 2001). Trials were in participants from different clinical backgrounds, in different healthcare settings and receiving interventions which aimed to support improved nutritional intake but varied from one another. Three trials reported no marked difference in MAC between groups (Hickson 2004; Nijs 2006; Potter 2001). In the trial by Duncan 2006, the group that received assistance with eating had a smaller reduction in MAC of ‐0.9 cm (SD 2.2) compared with the group that received usual care, ‐1.3 (SD 1.5) (P = 0.002). One trial evaluating the impact of specialist training in free‐living individuals (Pivi 2011) reported improvements in MAC in the intervention group of 1.9 cm (SD 2) compared with a reduction of ‐0.4 cm (SD 0.5) in the group receiving usual care. In the trial by Leslie 2012 of food fortification in residential care homes, participants in the intervention group had a greater improvement in MUAC than those in the control group but the between‐group differences and statistical tests were not reported (Table 20) In the trial by Hankey 1993, the data were unavailable from the original trial report but we obtained them from a systematic review by Milne 2009. We read the figures for change from a graph, and we assumed the SD of change to be 10 cm for each group. MAC was described as improving in the intervention group (P < 0.05) but remaining unchanged in the usual care group. The changes were small and no between‐group differences were reported (Table 24). In the trial by Larsson 1990 the data are presented in a figure with some description in the text, participants who were well nourished at the start of the trial and received supplementation of meals experienced less decrease in MAC at 26 weeks (P < 0.05) than those receiving usual care. In participants who were malnourished at the start of the trial both groups experienced a decrease in MAC at 26 weeks.
Clinical function
Data on this outcome were reported in nine of 41 trials (Bouillanne 2013; Duncan 2006; Faxen‐Irving 2011; Hickson 2004; Kretser 2003; Munk 2014; Potter 2001; Salva 2011; Smoliner 2008). Trials were in participants from a variety of different clinical backgrounds, in different healthcare settings and were assessed using a variety of methods including handgrip strength, Barthel score, Activities of Daily Living (ADL), instrumental ADL (iADL) and peak flow.
Three trials assessed functional recovery using the Barthel score (Hickson 2004; Smoliner 2008; Potter 2001). The Barthel index consists of 10 items that measure a person's daily functioning, specifically the activities of daily living and mobility (Mahoney 1965). The items include feeding, moving from wheelchair to bed and return, grooming, transferring to and from a toilet, bathing, walking on level surface, going up and down stairs, dressing, continence of bowels and bladder. The items are weighted according to a scheme developed by the authors. The person receives a score based on whether they have received help while doing the task. The scores for each of the items are summed to create a total score. The higher the score the more 'independent' the person. Independence means that the person needs no assistance with any part of the task. There were no marked differences between groups in any trial. In the trial by Potter 2001 there was no marked difference in numbers achieving functional recovery assessed using the Barthel index in the group receiving supplementation compared with the usual care group (102/149 intervention versus 100/157 control, P = 0.38). However, more participants classified as severely undernourished experienced an improvement in their Barthel scores on supplementation compared with those that received usual care (17/25 intervention versus 11/28 control, P < 0.04).
Four trials assessed clinical function using the ADL and iADL scores (Bouillanne 2013; Faxen‐Irving 2011; Kretser 2003; Salva 2011). Two main types of abilities are measured by these functional assessment scales. Basic ADL consist of activities that are performed daily, habitually and universally, such as dressing, bathing, and eating. In contrast, iADL requires organisation and planning, and includes such tasks as shopping, using transportation, preparing meals, handling finances, keeping the house, and using a telephone. The scores range from 0 to 100 and amount of functional impairment is then rated as ‘‘none to mild’’ (0 to 33), ‘‘moderate’’ (34 to 66), or ‘‘severe’’ (> 66). All trials reported no marked differences in ADL between the intervention and usual care groups. One trial used the iADL (Kretser 2003) to measure clinical function. There was a greater decline in iADL in those receiving traditional meals on wheels compared with those receiving modified meals on wheels at six months (P = 0.0494).
Five trials assessed clinical function using handgrip strength (Bouillanne 2013; Duncan 2006; Hickson 2004; Munk 2014; Smoliner 2008), and there were no marked differences in any trial between the groups receiving the intervention and those receiving usual care (Table 13; Table 21).
In the trial by Smoliner 2008 clinical function was also measured using peak flow. Peak expiratory flow is the maximum flow generated during expiration performed with maximal force and started after a full inspiration. A decrease in peak flow rates indicates a deterioration in clinical function and vice versa. The peak flow in the intervention group increased from baseline to follow‐up (12 weeks) (mean 152 mL/min (SD 105) to 186 mL/min (SD 140) whereas the usual care showed a decline (151 mL/min (SD90) to 150 mL/min (SD 67). The between‐group difference was statistically significant (P = 0.039).
Hospitalisation and institutionalisation
Data on length of hospital stay were reported in 10 of 41 trials (Dennis 2005; Duncan 2006; Faxen‐Irving 2011; Hickson 2004; Holyday 2012; Johansen 2004; Munk 2014; Olofsson 2007; Potter 2001; Van den Berg 2015). The trials were either of changes to the organisation of nutritional care (Duncan 2006; Hickson 2004; Holyday 2012; Johansen 2004; Olofsson 2007 ), fortification of meals in hospital (Munk 2014) or of supplementation of meals with oral nutritional supplements (Dennis 2005; Faxen‐Irving 2011; Potter 2001: Van den Berg 2015 ). Nine trials reported no marked difference in length of hospital stay between groups (Dennis 2005; Duncan 2006; Faxen‐Irving 2011; Hickson 2004; Holyday 2012; Johansen 2004; Munk 2014; Potter 2001; Van den Berg 2015). In the trial by Olofsson 2007 groups receiving a multidisciplinary team intervention had a shorter mean length of hospital stay (27.4 days (SD 15.9)) than groups receiving usual care (39.8 days (SD 41.9)) (P < 0.05) (Table 14).
Meta‐analysis across five trials with adequate data on length of hospital stay showed a MD between intervention and comparator groups of ‐0.5 days (95% CI ‐2.6 to 1.6); P = 0.56; 667 participants; very low‐quality evidence; Analysis 1.3.
Data on hospital readmissions were reported in two of 41 trials (Holyday 2012; Van den Berg 2015). In the trial by Holyday 2012 the groups receiving a protocol‐driven pathway for the management of nutrition whilst in hospital had fewer hospital readmissions than the group receiving usual care (30/71 versus 37/72 respectively). However the between‐group difference was not statistically significant. In the trial by Van den Berg 2015 there were more hospital readmissions in the group receiving an oral nutritional supplement four times daily than the groups receiving the supplement twice daily or the usual care group (24 versus 13 versus 15 respectively).
The trial by Potter 2001 reported the destination of participants at discharge according to group allocation. There was no marked difference between groups in the numbers of participants returning to their own home and those being discharged to an institution (Table 25).
Adverse events
Three of 41 trials (Dennis 2005; Faxen‐Irving 2011; Hankey 1993) reported on adverse events, all trials evaluating the impact of supplementation of meals with oral nutritional supplements. The overall quality of the evidence was very low. The trial by Faxen‐Irving 2011 reported that 5 of 34 (15%) participants experienced intolerance to the supplement assessed as diarrhoea and vomiting. In the trial by Dennis 2005 565 of 2017 (28%) of participants stopped taking the oral nutritional supplement due to individuals' refusal or dislike of taste, unwanted weight gain, or feelings of nausea. The trials by Potter 2001 and Van den Berg 2015 reported that no adverse events occurred.
All‐cause mortality
Adequate data were reported on this outcome in 12 out of 41 trials (Bouillanne 2013; Brouillette 1991; Dennis 2005; Duncan 2006; Hickson 2004; Holyday 2012; Kretser 2003; Larsson 1990; Munk 2014; Olofsson 2007; Potter 2001; Van den Berg 2015). Six cluster‐RCTs could not be included in the meta‐analysis (Bourdel‐Marchasson 2000; Leslie 2012; Mathey 2001a; Nijs 2006; Salva 2011; Smoliner 2008).
Trials were in participants from a variety of clinical backgrounds and in a range of different healthcare settings, receiving interventions which were all supportive of improved nutritional intake but varied widely. Meta‐analysis showed a RR of 0.78 (95% CI 0.66 to 0.92); P = 0.004; 12 trials; 6683 participants; moderate‐quality evidence; Analysis 1.4 in favour of supportive interventions (Figure 6). The test for subgroup differences of the various supportive interventions did not indicate interaction. Subgroup analysis of longer‐term trials (four months to one year) showed a RR of 0.73 (95% CI 0.55 to 0.98); 6 trials; 5200 participants. The sensitivity analysis after exclusion of the biggest trial, Dennis 2005, showed a RR of 0.67 (95% CI 0.54 to 0.82); 11 trials; 2660 participants.
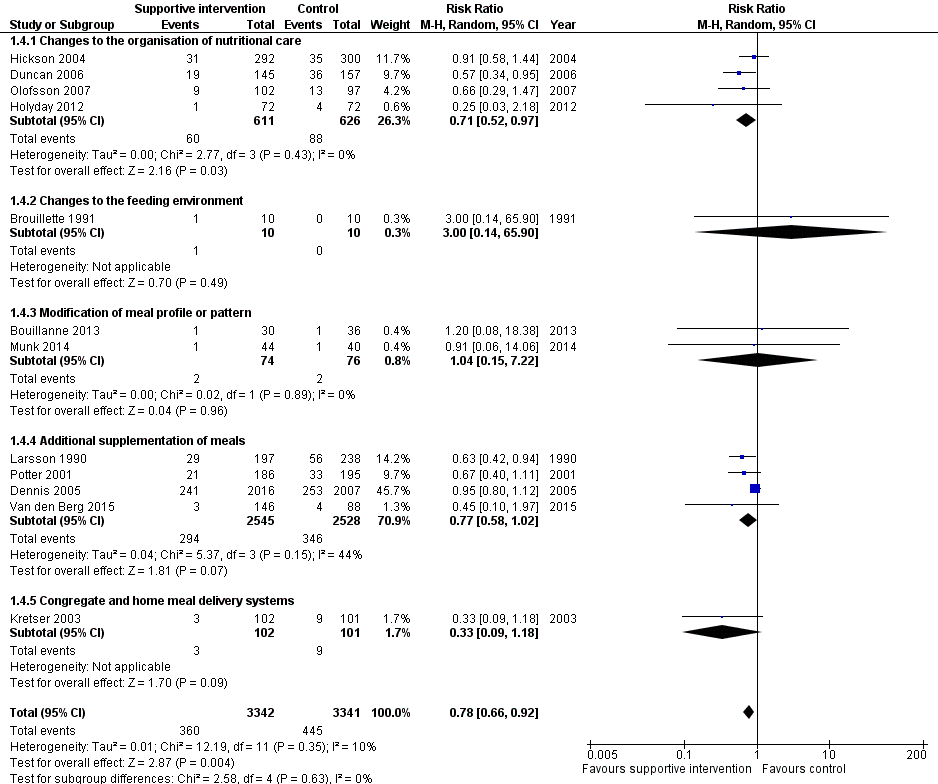
Forest plot of comparison: 1 Supportive interventions for enhancing dietary intake versus comparators, outcome: 1.4 All‐cause mortality
Economic costs
Data on this outcome were reported in three of 41 trials (Holyday 2012; Salva 2011; Simmons 2010). The overall quality of the evidence was very low. The trial by Holyday 2012 evaluated the impact of a protocol‐driven pathway for the management of nutritional care in hospital patients and the trial by Salva 2011 evaluated the impact of specialist training for carers of free‐living individuals with dementia. In the trial by Holyday 2012 the data on cost savings were based on reductions in the length of hospital stay. There was no marked difference in overall length of stay between groups. There was a shorter length of stay by eight days in the subgroup of 32 malnourished participants (12 days in the intervention group and 20 days in the usual care group). These data were used to estimate a cost saving of AUD 63,360 from treating malnutrition in the group of 12 malnourished participants based on the cost per hospital bed per day, the cost of the dietitians' time and the average cost of a commercial oral nutritional supplement. The trial by Salva 2011 collected data on resource utilisation but the data were not reported. The trial by Simmons 2010 evaluated the impact of a food‐based and oral nutritional supplement‐based intervention. In this trial a formal cost effectiveness analysis was not undertaken and reporting of the impact of the interventions on costs was limited to a report of the cost per serving of the oral nutritional supplement or food provided and an estimate of staff time required to encourage and assist consumption. The average costs (per person per day in USD) were significantly higher in groups receiving supplements and snacks compared with those in the usual care group (USD 2.10 versus, USD 2.06). None of the trials used accepted health economic methods and the reported data on both costs and effectiveness were generally poor.
Subgroup analyses
We carried out the first planned subgroup analysis 'intervention category'. Trials were grouped according to similar interventions into five categories. There were insufficient data to undertake further subgroup analyses.
Sensitivity analyses
We did not do any sensitivity analyses because of insufficient data.
Changes to the organisation of nutritional care
Primary outcomes
Nutritional intake
Data on energy intake were reported in five of 13 trials (Chang 2005; Duncan 2006; Hickson 2004; Johansen 2004; Lin 2010) (Table 10). Two trials used dietetic assistants in a hospital setting: one found a greater energy intake in groups receiving assistance than those receiving usual care (1105 kcal (SD 361) versus 759 kcal (SD 399), P < 0.001) (Duncan 2006), whereas in the other trial (Hickson 2004), which assessed between‐group difference in intake in 37 of 592 participants, the difference in energy intake between the groups was 89 kcal, P < 0.538. Of the four trials that implemented specialist training in long‐term care facilities, two reported data on energy intake as percentage of meals consumed (Chang 2005;Lin 2010). In one trial (Chang 2005), the intervention group experienced a reduction in percentage of meals consumed and the group receiving usual care increased their intake (P < 0.49). In the other trial (Lin 2010) there were small increases in percentage of meals consumed in all groups (Table 10). One trial providing multi‐disciplinary team care in a hospital setting reported a greater energy intake in the intervention group compared with usual care (30 kcal/kg/d (standard error (SE) 1) versus 25 kcal/kg/d (SE 1) (Johansen 2004).
Health‐related quality of life and patient satisfaction
Data on health‐related quality of life were reported in one of 13 trials (Johansen 2004). Quality of life was assessed using the SF36 questionnaire (Ware 1992) which was completed by 57% participants. A dropout analysis showed responders and non‐responders were similar in terms of baseline characteristics. There were no marked differences between the groups in both the physical and mental summary scores from baseline to follow‐up (physical score mean 2.4 (SE 1.3) in the intervention versus mean 0.2 (SE 1.5) in the control; mental score mean 2.2 (SE 2.5) in the intervention versus mean 3.3 (SE 2) in the usual care) (Table 11).
Data on patient satisfaction were reported in two of 13 trials (Duncan 2006; Salva 2011). In the trial by Duncan 2006 patient satisfaction was assessed using an unvalidated questionnaire with 10 questions about aspects of meals, diet and feeding. Patients answered yes or no where yes = 1, no = ‐1 and NA = 0. Those participants who had received the support of the dietetic assistants showed greater satisfaction with a median score of 6.5 (IQR 2) compared to 3 (IQR 4) for participants receiving usual care (P < 0.0001) (Table 11). In the trial by Salva 2011 satisfaction of participants and their families was assessed using an unvalidated questionnaire which asked about the use of and perceived usefulness of five aspects of the overall programme. Families and carers were asked to indicate whether they had used the service and whether they had found it very useful, useful or not very useful. Information cards were used by 94.5% of families and rated as very useful (26%) and useful (67%). The nutrition course was used by 66% of families and rated as very useful (24%) and useful (65%). Weight curves were sent to 88% of families and rated as very useful (13%) and useful (78%). Information sessions were attended by 75% of families and rated as very useful (32%) and useful (62%). The hot line was used by 33% of families and rated as very useful (17%) and useful (51%).
Morbidity/complications
Data on complications were reported in four of 13 trials (Duncan 2006; Hickson 2004; Johansen 2004; Olofsson 2007), three of which reported the number of participants experiencing any complications (Dennis 2005; Johansen 2004; Olofsson 2007) and one trial (Hickson 2004) reported the number of participants receiving oral antibiotics. There were no marked between‐group differences in any of the trials (Table 11).
Secondary outcomes
Nutritional status
Weight change
Data on this outcome were reported in 10 of 13 trials (Duncan 2006; Hickson 2004; Holyday 2012; Johansen 2004; Kraft 2012; Lin 2010; Olofsson 2007; Pivi 2011; Salva 2011; Splett 2003) (Table 12).
Two trials evaluated the impact of dietetic assistants in a hospital setting (Duncan 2006; Hickson 2004) and there were no marked differences in mean weight change between groups in either trial. One trial used specialist training in a residential care setting (Lin 2010) and there was no marked difference in mean weight change between the two groups. Two trials looked at specialist training for carers of free‐living individuals with dementia (Pivi 2011; Salva 2011). In one trial the intervention group experienced a small weight gain of 1.2 kg whereas the usual care experienced a small weight loss of 2.2 kg (Pivi 2011). In the other trial (Salva 2011) there was no marked difference between the two groups in mean weight change. Two trials reported weight change for interventions consisting of a multi‐disciplinary team approach to nutritional care (Johansen 2004; Olofsson 2007) and reported no marked differences between groups receiving intervention and those receiving usual care in either trial. One trial described a protocol‐driven pathway of nutritional care in hospital (Holyday 2012) and reported no marked differences in weight change between the groups receiving the intervention and usual care. Another trial reported data using a protocol‐driven care in a care home setting (Splett 2003). The authors did not report mean weight change but provided a narrative description of the proportions of participants maintaining or gaining weight. The percentage of participants maintaining or gaining weight during the trial was greater in the usual care group (57%) than in the intervention group (48%). One trial evaluated the impact of telemedicine in free‐living individuals and reported no marked difference between the groups in mean weight change (Kraft 2012).
Change in BMI
Data on this outcome were reported in seven of 13 trials (Hickson 2004; Kraft 2012; Lin 2010; Lin 2011; Olofsson 2007; Pivi 2011; Salva 2011): two trials of specialist training in a residential care setting (Lin 2010; Lin 2011), two of specialist training of free‐living individuals (Pivi 2011; Salva 2011), one of additional nutritional care from a trained health care assistant (Hickson 2004), one of multi‐disciplinary team care in hospital (Olofsson 2007) and one of telemedicine (Kraft 2012). There were no marked differences in BMI change between groups in six of the seven trials (Table 12). In one trial (Pivi 2011) participants receiving specialist training experienced an increase in BMI (1.2 kg/m² (SD 1) and participants in the usual care group experienced a reduction in BMI (‐2.2 kg/m2 (SD 1). However, the between‐group difference and statistical tests were not reported.
Change in TSF, MAMC and MUAC
Data on this outcome were reported in three of 13 trials (Duncan 2006; Hickson 2004; Pivi 2011). In the two trials that assessed the effects of using dietetic assistants in hospital (Duncan 2006; Hickson 2004) there were no marked differences in either TSF or MAMC between groups. In one trial (Hickson 2004) there was no marked difference in MAC between groups receiving assistance with eating and those receiving usual care, whereas in the other trial (Duncan 2006) the group that received assistance with eating had a smaller reduction in MAC (‐0.9 cm (SD 2.2)) compared with the group that received usual care (‐1.3 (SD 1.5), P < 0.002). One trial used specialist training in free‐living individuals (Pivi 2011) and reported improvements in MAC in the intervention group of 1.9 cm (SD 2) compared with a reduction of 0.4 cm (SD 0.5) in the group receiving usual care, and no marked difference between the groups in TSF.
Overall the data across all interventions suggest that there is minimal impact on weight change and body composition from changes to the organisation of nutritional care across different healthcare settings.
Clinical function
Data on this outcome were reported in three of 13 trials (Duncan 2006; Hickson 2004; Salva 2011). The trials by Duncan 2006 and Hickson 2004 both assessed the effect of assistance with eating in people in hospital on handgrip strength. There were no marked differences in handgrip strength between the intervention and usual care groups in either trial (Table 13). The trial by Hickson 2004 also assessed functional recovery in participants using the Barthel score. There was no marked difference between groups' initial assessment to discharge from hospital (median score 2.0 (IQR 0 to 5) in the group receiving feeding assistance and 1.0 (IQR 0 to 4), P = 0.23 in the group receiving usual care). The trial by Salva 2011 measured change in ADL (Katz 1963), and iADL (Lawton 1969) in free‐living individuals with dementia who had received specialist training on nutrition. There were no marked differences between the groups in either ADL or iADL at six and 24 months' follow‐up.
Hospitalisation and institutionalisation
Data were reported on length of hospital stay in five of 13 trials (Duncan 2006; Hickson 2004; Holyday 2012; Johansen 2004; Olofsson 2007). Two trials evaluated the impact of dietetic assistants in a hospital setting (Duncan 2006; Hickson 2004), two evaluated a multi‐disciplinary team intervention in hospital (Olofsson 2007; Johansen 2004) and one evaluated a protocol‐driven pathway in hospital (Holyday 2012). There were no marked differences between groups in length of hospital stay in four trials (Duncan 2006; Hickson 2004; Holyday 2012; Johansen 2004). In the other trial (Olofsson 2007) the group receiving a multidisciplinary team intervention had a shorter mean length of hospital stay than the group receiving usual care (27.4 days (SD 15.9) in the intervention group and 39.8 days (SD 41.9) in the usual care group (P < 0.05) (Table 14). Data on hospital readmissions were reported in one of 13 trials (Holyday 2012). The group receiving a protocol‐driven pathway for the management of nutrition whilst in hospital had fewer hospital readmissions than the group receiving usual care (30/71 (42%) versus 37/72 (51%) respectively) but the difference between the groups was not statistically significant.
Adverse events
No trial reported data on this outcome.
All‐cause mortality
Data were reported on this outcome in five of 13 trials (Duncan 2006; Hickson 2004; Holyday 2012; Olofsson 2007; Salva 2011). Two trials evaluated the impact of dietetic assistants in a hospital setting (Duncan 2006; Hickson 2004), one evaluated specialist training for free‐living individuals with dementia (Salva 2011), one evaluated a multi‐disciplinary team intervention in hospital (Olofsson 2007) and one evaluated a protocol‐driven pathway in hospital (Holyday 2012). There were no marked differences between groups in mortality in four trials (Hickson 2004; Holyday 2012; Olofsson 2007; Salva 2011), whereas in the other trial (Duncan 2006) there was a lower mortality at four months in the group receiving the intervention from dietetic assistants compared with the group receiving usual care (19/145 (13%) versus 36/157 (23%), P = 0.036) (Table 14).
Economic costs
Data on this outcome were reported in two of 13 trials (Holyday 2012; Salva 2011). One trial (Holyday 2012) evaluated the impact of a protocol‐driven pathway for the management of nutritional care in hospital patients and the other trial (Salva 2011) evaluated specialist training for carers of free‐living individuals with dementia. In one trial (Holyday 2012) the data on cost savings are based on reductions in length of stay achieved. There was no marked difference in length of stay overall between groups. There was a shorter length of stay by eight days in the subgroup of 32 malnourished participants (12 in the intervention group and 20 in the usual care group). These data were used to estimate a cost savings of AUD 63,360 from treating malnutrition in the group of 12 malnourished participants based on the cost per hospital bed per day, the cost of the dietitians' time and the average cost of a commercial oral nutritional supplement. The trial by Salva 2011 collected data on resource utilisation but the data were not reported. Neither trial used accepted health economic methods and the reported data on both costs and effectiveness were generally poor.
Changes to the feeding environment
Primary outcomes
Nutritional intake
Data were reported on energy intake in three of five trials (Brouillette 1991; Mathey 2001a; Nijs 2006). Two trials evaluated the impact of changes to the dining room environment (Mathey 2001a; Nijs 2006) and one evaluated a pre‐meal sensory stimulation intervention (Brouillette 1991). All trials assessed energy intake and were conducted in people in residential care. There were no marked between‐group differences in energy intake in any trial (Table 15).
Health‐related quality of life and patient satisfaction
Data were reported on health‐related quality of life in two of five trials (Mathey 2001a; Nijs 2006). One trial (Mathey 2001a) used the Sickness Impact Profile (SIP) (Gilson 1975), and Philadelphia Geriatric Center Morale Scale (PGCMS, 17 items) (Lawton 1972) to assess health‐related quality of life.The SIP is a validated generic health status measure of change in behaviour as a consequence of illness . It includes 136 items describing activities of daily living (ADL), divided into 12 categories: sleep and rest, eating, work, home management, recreation and pastimes, ambulation, mobility, body care and movement, social interaction, alertness behaviour, emotional behaviour, and communication. Patients endorse statements that best describe them that day and are related to their health. Items are scored on a numeric scale, with higher scores reflecting greater dysfunction. The mean SIP score in the usual care declined more (‐13% (SD 12), P < 0.05) than in the experimental group (‐2% (SD 11)). The PGCMS is a multidimensional approach to assessing the state of psychological well‐being of older people. It measures perceived morale in elderly people through three factors: agitation, attitude toward own aging and 'lonely satisfaction'. Each high‐morale response receives a score of '1' and each low‐morale response a score of '0', so that the total score ranges from 0 to17. As a general guideline, scores between 13 to17 would be considered high scores on the morale scale, 10 to 12 fall within the mid‐range and scores under 9 are at the lower end. Mean changes in the PGCMS scores were relatively stable for both groups with ‐2% (SD 19) for the usual care, and ‐3% (SD 20) for the experimental group. In the trial by Nijs 2006, health‐related quality of life was assessed in a face‐to‐face interview using the Dutch health‐related quality of life of somatic nursing home residents questionnaire which is a validated questionnaire consisting of five sub‐scales, each representing a quality of life dimension: sensory functioning (focusing on pain); physical functioning (perceived performance and self‐care); psychosocial functioning (depression or loneliness); perceived autonomy (freedom of movement); and perceived safety (feeling at home in the institution). The number of statements in the five sub‐scales is not equal. The questionnaire consists of 50 statements, scored on a dichotomous scale (yes or no). Each sub‐scale and the total questionnaire is computed to achieve a score from 0 to 100. A high score represents a high quality of life. There was a difference between groups in overall quality of life (6.1 units, 95% CI 2.1 to 10.3). The intervention group remained stable (0.4 units, 95% CI 1.8 to 2.5), whereas the usual care declined (‐0.5 units, 95% CI ‐9.4 to 0.6), although the overall changes were small (Table 16).
No trial reported data on patient satisfaction.
Morbidity/complications
No trial reported data on this outcome.
Secondary outcomes
Nutritional status
Weight change
Data were reported on this outcome in three of five trials (Mathey 2001a; Nijs 2006; Remsburg 2001), all of which were trials evaluating the impact of changes to the dining environment. There were no marked differences between intervention and usual care groups in mean weight change in any of the trials (Table 17).
Change in BMI
No trial reported data on this outcome.
Change in TSF
No trial reported data on this outcome.
Change in MAC
Data were reported on this outcome in one of five trials (Nijs 2006). The trial evaluated the impact of providing family‐style meals in residential care homes. There was no marked difference in change in MAC between the groups, MD between groups was 0.5 cm (95% CI ‐0.2 to 1.3)
Clinical function
No trial reported data on this outcome.
Hospitalisation and institutionalisation
No trial reported data on this outcome.
Adverse events
No trial reported data on this outcome.
All‐cause mortality
Data were reported on this outcome in three of five trials (Brouillette 1991; Mathey 2001a; Nijs 2006). Two evaluated the impact of changes to the dining room environment (Mathey 2001a; Nijs 2006) and one of pre‐meal sensory stimulation (Brouillette 1991). There were no marked differences between groups in death from any cause in any trial (Table 18).
Economic costs
No trial reported data on this outcome.
Modification of meal profile or pattern
Primary outcomes
Nutritional intake
Data were reported on energy intake in 11 of 12 trials (Barton 2000; Bouillanne 2013; Castellanos 2009; Essed 2007; Essed 2009; Germain 2006; Leslie 2012; Mathey 2001b; Munk 2014; Silver 2008; Taylor 2006). Four trials evaluated the impact of food fortification, two in hospital (Barton 2000; Munk 2014), one in a care home (Leslie 2012) and one in free‐living individuals receiving home‐delivered meals (Silver 2008), one trial evaluated the impact of modifications to meal delivery in an intermediate care home (Bouillanne 2013), two trials evaluated modifications to meal delivery in residential care homes (Germain 2006; Taylor 2006), and three evaluated flavour modification in residential care homes (Essed 2007; Essed 2009; Mathey 2001b). There were no marked differences in mean change in energy intake between groups in five trials (Bouillanne 2013; Essed 2007; Essed 2009; Mathey 2001b; Taylor 2006). Three trials reported higher energy intakes in the intervention group of between 300 to 500 kcal/day, two of which were trials of food fortification in either hospital or in free‐living individuals (Barton 2000; Silver 2008) and one was of a modification to meal delivery involving improved presentation of pureed foods to participants with dysphagia (Germain 2006). In the randomised cross‐over trial by Castellanos 2009, between‐group differences were not reported however data were presented for a post hoc analysis of 'big' eaters (overall intake 1150 kcal or more a day) and 'small' eaters (overall intake less than 1150 kcal a day) (data not reported in the table). Data were presented as mean intake from both fortified and non‐fortified food items at each meal under each of three menu conditions (Table 19).
Health‐related quality of life and patient satisfaction
Data on health‐related quality of life were reported in one trial (Smoliner 2008). The physical functioning component of the validated medical outcomes Study 36‐item Short Form (SF‐36 ) were reported (Ware 1992). The SF‐36 is a participant‐completed validated questionnaire to assess eight different domains of health (vitality, physical functioning, bodily pain, general health perception, physical function, emotional role function, social role function and mental health). The SF‐36 consists of eight scaled scores, which are the weighted sums of the questions in their section. Each scale is directly transformed into a 0 to 100 scale on the assumption that each question carries equal weight. The lower the score the poorer the quality of life. The higher the score the better the quality of life, that is, a score of zero is equivalent to poorest quality of life and a score of 100 is equivalent to optimal quality of life.
Baseline to follow‐up (12 weeks) score in the intervention group receiving the fortified diet changed from a mean of 17.1 (SD 22.7) at baseline to a mean of 10.7 (SD 15.6) at 12 weeks (P = 0.047), and in the usual care from 24 (SD 24.3) at baseline to 13.6 (SD 13.9) at 12 weeks (P < 0.0001), however the between‐group differences were not statistically significant.
No trial reported data on patient satisfaction.
Morbidity/complications
Data on the number of participants experiencing complications were reported in one of twelve trials (Bouillanne 2013) which evaluated the impact of modifications to meal composition in people in intermediate care. There was no marked difference between the intervention and usual care in the number of infectious complications experienced by participants included in the intention‐to‐treat analysis (1 of 29 participants in the intervention group and 2 of 34 participants in the usual care group).
Secondary outcomes
Nutritional status
Weight change
Data on this outcome were reported in seven of 12 trials (Bouillanne 2013; Essed 2007; Germain 2006; Leslie 2012; Mathey 2001b; Munk 2014; Smoliner 2008). Three trials evaluated the impact of food fortification, one in hospital (Munk 2014) and two in a residential care home (Leslie 2012; Smoliner 2008), one evaluated modification to meal composition in an intermediate care setting (Bouillanne 2013), one evaluated modifications to the presentation of food in a residential care home (Germain 2006) and two evaluated flavour modifications in residential care homes (Essed 2007; Mathey 2001b). There were no marked differences in mean weight change between groups reported in three trials (Bouillanne 2013; Essed 2007; Smoliner 2008). Three trials reported higher weight gain in the intervention group compared with the usual care. One was a trial of food fortification in residential care (Leslie 2012) (1.3 kg (SE 0.53) in the intervention group versus ‐0.2 kg (SE 1.5) in the control group, P = 0.03. The second was a trial of modification to meal presentation (Germain 2006) (3.9 kg (SD 2.3) in the intervention group versus ‐0.8 kg (SD 4.2) in the usual care. The other trial evaluated the impact of flavour enhancement in people in a residential care home (Mathey 2001b) (1.1 kg (SD 1.3) in the intervention group versus ‐0.3 (1.6) in the usual care, P < 0.05) (Table 20).
Change in BMI
Data on this outcome were reported in three of 12 trials (Germain 2006; Leslie 2012; Smoliner 2008). One evaluated the impact of modification to meal presentation in people in residential care (Germain 2006) and the others evaluated food fortification in people in residential care (Leslie 2012; Smoliner 2008). In one trial (Smoliner 2008) there was no marked difference between the groups in change in BMI. The group receiving modification to the presentation of meals in Germain 2006 and the group receiving fortified meals in Leslie 2012 experienced a greater increase in BMI than those receiving usual care but the between‐group difference was not reported (Table 20).
Change in TSF
No trial reported data on this outcome.
Change in MAC
One trial of meal fortification in people in residential care reported data on this outcome (Leslie 2012). Participants in the intervention group experienced a greater improvement in MUAC than those in the control group (mean change 0.4 mm (SE 0.16) in the intervention group and ‐0.1 mm (SE 0.3) in the control group, P = 0.019.
Clinical function
Data on handgrip strength were reported in three of 12 trials (Bouillanne 2013; Munk 2014; Smoliner 2008). One trial evaluated the impact of modification to meal composition in people in intermediate care (Bouillanne 2013) and the others evaluated food fortification in people in hospital (Munk 2014) and in residential care (Smoliner 2008). There were no differences between the intervention and usual care groups in either trial (Table 21). The trial by Bouillanne 2013 also assessed change in ADL score (Sonn 1996) and there was no marked difference between the groups (Table 21). In the trial by Smoliner 2008 clinical function was also assessed by peak flow and the Barthel index .The peak flow (L/min) in the intervention group increased from baseline to follow‐up (12 weeks) in the intervention group (mean 152 (SD 105) to 186 (SD 140)) whereas the usual care group showed a decline (mean 151 (SD 90) to 150 (SD 67)). The differences observed between groups were statistically significant (P = 0.039). The mean change in Barthel score was ‐15.2 (SD 18.5) in the group receiving fortification of food and ‐7.5 (SD 10.4) in the group receiving usual care. The between‐group differences were not statistically significant.
Hospitalisation and institutionalisation
One trial of food fortification of menu items provided via an a la carte menu reported data on length of hospital stay (Munk 2014). There were no differences in mean length of stay between groups in from trial inclusion to discharge from hospital (mean 10 days (SD 8) in the intervention group and mean 10 days (SD 8) in the control group, between‐group difference, 0.6 days (95% CI ‐3 to 4, P = 0.73).
Adverse events
No trial reported data on this outcome.
All‐cause mortality
Data on this outcome were reported in four of 12 trials (Bouillanne 2013; Leslie 2012; Munk 2014; Smoliner 2008). The number of deaths were small in each trial and there were no marked differences between groups (Table 21).
Economic costs
No trial reported data on this outcome.
Additional supplementation of meals
Primary outcomes
Nutritional intake
Data were reported on energy intake in eight of 10 trials (Beck 2002; Bourdel‐Marchasson 2000; Faxen‐Irving 2011; Hankey 1993; Potter 2001; Simmons 2008; Simmons 2010; Van den Berg 2015). Three trials evaluated the impact of supplementation with food in residential care homes (Beck 2002; Simmons 2008; Simmons 2010), four evaluated supplementation with oral nutritional supplements in hospital (Bourdel‐Marchasson 2000; Faxen‐Irving 2011; Potter 2001; Van den Berg 2015) and two evaluated supplementation with oral nutritional supplements in residential care homes (Hankey 1993; Simmons 2010). One trial provided both a food‐based intervention and oral nutritional supplements in participants in residential care homes (Simmons 2010). There were no marked differences reported in energy intake between groups in either the trials of food‐based interventions or the trials of oral nutritional supplement‐based interventions (Table 22). In the trial by (Hankey 1993) the group receiving oral nutritional supplements had an energy intake 600 kcal greater than the usual care group (1747 kcal (SD 273) versus 1147 kcal (SD 310) respectively), However, between‐group statistical tests were not reported. In the trial by Van den Berg 2015 participants receiving oral nutritional supplements in four 62 mL portions during the drug round had a significantly higher energy intake than those receiving supplements in the conventional, between‐meal style.
Health‐related quality of life and patient satisfaction
Data on health‐related quality of life were reported in one trial (Dennis 2005) undertaken in people with stroke supplemented with oral nutritional supplements during hospitalisation. Health‐related quality of life was measured in 77% (N = 3086) of participants using EUROQoL score (EQ‐5D) (EuroQol group 1990). The questionnaire comprises five questions on mobility, self‐care, pain, usual activities and psychological status with three possible answers for each item (1 = no problems, 2 = moderate problems, 3 = severe problems). An overall utility score is calculated based on these domains, with a range score from 0 (worse health scenario) to a maximum of 1.0 (best health scenario). An additional visual analogue scale (VAS, scale 0 to 100) was used to assess general health status with 100 indicating the best health status. No marked differences were identified between the intervention and usual care groups (Table 23).
No trial reported data on patient satisfaction.
Morbidity/complications
The incidence of, and number of people with, pressure ulcers was reported in two trials (Bourdel‐Marchasson 2000; Dennis 2005) and the total number of complications was reported in one trial (Dennis 2005). Both trials were of supplementation of participants with oral nutritional supplements in hospital. There was no marked difference between groups in cumulative incidence of, or number of participants with, pressure ulcers in either trial (Table 23). In the trial by Dennis 2005 there was no marked difference in total complications between groups (Table 23).
Secondary outcomes
Nutritional status
Weight change
Data on this outcome were reported in seven of 10 trials (Beck 2002; Faxen‐Irving 2011; Hankey 1993; Larsson 1990; Potter 2001; Simmons 2008; Simmons 2010). Three trials evaluated the impact of supplementation with food in residential care settings (Beck 2002; Simmons 2008; Simmons 2010), two evaluated supplementation with oral nutritional supplements in hospital (Faxen‐Irving 2011; Potter 2001) and three evaluated supplementation with oral nutritional supplements in long‐term care settings (Hankey 1993; Larsson 1990; Simmons 2010), with the trial by Simmons 2010 providing data on both food and oral nutritional supplements. There were no marked differences in weight change between groups receiving food‐based or oral nutritional supplement‐based interventions in six trials (Beck 2002; Faxen‐Irving 2011; Hankey 1993; Larsson 1990; Potter 2001; Simmons 2010). In two trials (Faxen‐Irving 2011; Hankey 1993), the groups receiving oral nutritional supplements gained weight and the usual care group lost weight overall. However, the between‐group differences and the results of statistical tests were not reported. In one trial (Simmons 2008) the intervention group gained 4 lbs more in weight than the group receiving usual care (P = 0.009) (Table 24).
Change in BMI
Data on this outcome were reported in two of 10 trials (Faxen‐Irving 2011; Simmons 2008), both trials evaluated the impact of supplementation with oral nutritional supplements in hospital. In one trial (Faxen‐Irving 2011) BMI was reported according to group at the end of the intervention and there was no marked difference between groups. Change from baseline and between‐group differences were not reported. In the other trial by (Simmons 2008) the intervention group gained 0.72 kg/m² more than the group receiving usual care (P < 0.009) (Table 24).
Change in TSF
Data on this outcome were reported in two of 10 trials (Hankey 1993; Larsson 1990), both of which evaluated the impact of supplementation with oral nutritional supplements in long‐term care settings. In each trial data were presented in figures with minimal description in the text. In one trial (Hankey 1993) the intervention group was described as experiencing a smaller decrease in TSF than the usual care group (6.6% versus 15.8%). In the other trial (Larsson 1990) TSF decreased over the 26 weeks of follow‐up with the greatest decrease occurring in the usual care group. In another trial (Potter 2001) TSF is described as an outcome but the data were not reported.
Change in MACe
Data on this outcome were reported in three of 10 trials (Hankey 1993; Larsson 1990; Potter 2001), all of which evaluated the impact of supplementation with oral nutritional supplements in either hospital or long‐term care settings. In one trial (Hankey 1993), the data were unavailable from the original trial report but we have obtained them from a systematic review by Milne 2009. We read the figures for change from a graph and assumed SD of change to be 10 cm for each group. MAC is described as improving statistically significantly in the intervention group (P < 0.05) but remaining unchanged in the usual care group. The changes are small and no between‐group differences were reported (Table 24). In the trial by Larsson 1990 the data were presented in a figure with some description in the text, participants who were well nourished at the start of the trial and received supplementation of meals experienced less of a decrease in MAC at 26 weeks (P < 0.05) than those receiving usual care. In participants who were malnourished at the start of the trial both groups experienced a decrease in MAC to 26 weeks. In the final trial (Potter 2001), there was no marked difference between groups in MAC (Table 24).
Clinical function
Data on clinical function were reported in two of ten trials (Faxen‐Irving 2011; Potter 2001), both evaluating the impact of supplementation with oral nutritional supplements in hospital. In one trial (Faxen‐Irving 2011) the group receiving oral nutritional supplements changed from being dependent in all five functions to being dependent in only one function as assessed by ADL (Katz 1963). However, no marked change was identified in those receiving usual care (P = 0.011). Mean change (SD) in ADL score according to group was not markedly different between groups (2.95 (SD 2.2) intervention and 4.1 (SD 2.2) control, P = 0.09). In the other trial (Potter 2001) there was no statistically significant difference in numbers achieving functional recovery assessed using the Barthel index in the group receiving supplementation compared with the usual care group (102/149 (68%) intervention versus 100/157 (64%) control, P = 0.38). However, significantly more participants classified as severely undernourished experienced an improvement in their Barthel scores on supplementation compared with those who received usual care (17/25 (68%) intervention versus 11/28 (39%) control, P < 0.04).
Hospitalisation and institutionalisation
Data on length of hospital stay were reported in four of 10 trials (Dennis 2005; Faxen‐Irving 2011; Potter 2001; Van den Berg 2015) all of which evaluated the impact of supplementation of meals with oral nutritional supplements in hospital. There were no marked differences in length of hospital stay between groups in any trial (Table 25).
One trial of supplementation with oral nutritional supplements in hospital reported data on hospital re‐admissions (Van den Berg 2015). The number of re‐admissions to hospital were higher in intervention group 2, but these data were not commented on by the trial authors (13 participants in intervention group 1, 24 participants in intervention group 2 and 15 participants in the control group being readmitted to hospital). One trial reported on the destination of participants at discharge according to group allocation (Potter 2001). There was no marked difference between groups in numbers of participants returning to their own home and those being discharged to an institution (Table 25).
Adverse events
Data on this outcome were reported in three of nine trials (Faxen‐Irving 2011; Hankey 1993; Dennis 2005), one of which reported intolerance to the oral nutritional supplement (e.g. diarrhoea or vomiting, N = 5) (Faxen‐Irving 2011). Another trial (Dennis 2005) reported that 28% stopped taking the oral nutritional supplement due to participant refusal or because of dislike of taste, unwanted weight gain, or feelings of nausea. The trials by Potter 2001 and Van den Berg 2015 reported no adverse events.
All‐cause mortality
Data on this outcome were reported in five of 10 trials (Bourdel‐Marchasson 2000; Dennis 2005; Larsson 1990; Potter 2001: Van den Berg 2015). Four trials evaluated the impact of supplementation with oral nutritional supplements in hospital (Bourdel‐Marchasson 2000; Dennis 2005; Potter 2001; Van den Berg 2015 ) and one evaluated supplementation with oral nutritional supplements in a long‐term care setting (Larsson 1990;). There was no marked difference in death from any cause between groups in any of the trials (Table 25).
Economic costs
Data on this outcome were reported in one trial (Simmons 2010). The cost effectiveness of the intervention was determined from data on cost per serving of the oral nutritional supplement or food provided and staff time to encourage and assist consumption. The average costs (per person per day) were significantly higher in groups receiving supplements and snacks compared with those in the usual care group (USD 2.10 versus USD 2.06 versus USD ‐0.03 respectively). The trial did not use accepted health economic methods and the reported data on both costs and effectiveness were generally poor.
Home meal delivery systems
Primary outcomes
Nutritional intake
No trial data were reported on this outcome.
Health‐related quality of life and patient satisfaction
No trial data were reported on this outcome.
Morbidity/complications
No trial data were reported on this outcome.
Secondary outcomes
Nutritional status
Weight change
Data on this outcome were reported in the one trial in this group (Kretser 2003). The group receiving modified meals‐on‐wheels experienced a weight gain of 1.6 kg (SD 4.6) compared to the group receiving standard meals‐on‐wheels who had an overall weight gain of 0.7 kg (SD 3.3) (Table 26). No statistical tests were conducted on the between‐group differences.
Change in BMI
No trial data were reported on this outcome.
Change in TSF
No trial data were reported on this outcome.
Change in MAC
No trial data were reported on this outcome.
Clinical function
The one trial in this group reported data on ADL and iADL (Kretser 2003). No marked differences were identified in the number experiencing a decline (4/22 versus 8/24) or improvement (3/22 versus 2/24) in ADL between groups receiving modified meals‐on‐wheels, and groups receiving traditional meals‐on‐wheels. However, there was a greater number of participants experiencing a decline in iADL in those receiving traditional meals on wheels (16/24 ) compared with those receiving modified meals on wheels (8/22) at six months (P = 0.0494).
Hospitalisation and institutionalisation
No trial data were reported on this outcome.
Adverse events
No trial data were reported on this outcome.
All‐cause mortality
Data on this outcome were reported in the one trial in this group (Kretser 2003). The number of deaths from any cause were similar in each group (Table 26 ). No statistical tests were conducted on the between‐group differences.
Economic costs
No trial reported data on this outcome.
Discussion
Summary of main results
The aim of this review was to look for an effect of supportive interventions to enhance dietary intake in nutritionally vulnerable adults on patient‐centred, nutritional, clinical and economic outcome. We identified 41 trials and categorised them into five broadly similar types of intervention. Meta‐analysis was only possible for the outcome measures all‐cause mortality, hospitalisation and nutritional status (weight change) showing a possible effect in favour of supportive dietary interventions for all‐cause mortality and nutritional status. These findings should be interpreted with caution as few trials reported data on the outcomes of interest, and the quality of the evidence was between moderate to very low, depending on the outcome measurement. A number of patient‐important outcomes were measured by just a few trials, for example, health‐related quality of life and patient satisfaction. With regard to health‐related quality of life only one of the five trials that reported this outcome suggested benefits associated with the intervention. Although the two trials that measured patient satisfaction reported benefits in those receiving the intervention it should be noted that both trials used unvalidated questionnaires and are potentially subject to the limitations inherent in collecting these types of data, for example, participants need to be literate to complete the questionnaire, blinding may not be possible.
Until there are more large trials of higher methodological quality, evaluating the impact of similar interventions in similar patient groups, the effects of supportive interventions on nutritional, clinical, patient‐centred and healthcare outcomes cannot be fully evaluated.
Overall completeness and applicability of evidence
The trials identified for this review represent a wide range of interventions given with the aim of improving intake in nutritionally vulnerable individuals. Interventions took place in a variety of settings, residential care, hospital and outpatients. Although 21 of 41 included trials took place in residential care, the results of the meta‐analyses were dominated by large trials conducted in hospitals. It is particularly important to consider that the relevance of different outcomes are likely to differ between settings; most of the data for the outcome of all‐cause mortality came from trials recruiting hospital inpatients. Many of the interventions identified were similar to those recommended in policy and guideline documents on the prevention and management of malnutrition (BAPEN 2012; RCON 2008; The Malnutrition Task Force 2013). Despite the comprehensive range of interventions identified in this review, no RCTs were found for some widely used interventions, specifically protected meal times and the use of red trays to identify those requiring mealtime assistance. Examples of good practice reported in these key documents (BAPEN 2012; RCON 2008; The Malnutrition Task Force 2013) are frequently justified on the basis of their potential impact on patient experience and on staff awareness and motivation. These sorts of outcomes are rarely reported in trials, and therefore are not included in systematic reviews and meta‐analyses. The key finding of this review is that there is a lack of evidence to support these interventions and good quality RCTs are urgently needed to inform the widespread implementation of these initiatives. While there is limited evidence on adverse events, nutritional interventions are generally assumed to be safe. However, the impact of implementing and maintaining such interventions at an organisational and unit level has not been evaluated. For example, there are likely to be significant costs in terms of finance, time and resources associated with setting up and maintaining a staff training programme, yet these data are rarely reported. In this review we found very limited data on costs and no formal health economic analyses from which to draw conclusions.
During searching for this review a number of trials were identified that met the inclusion criteria for types of participants and interventions, however they were non‐randomised trials. The reasons for the weaker methodology used in many trials can only be speculated on, and may result from lack of funding, lack of research expertise, concern about the ethics of not providing all participants with an intervention perceived as 'beneficial', and practicalities related to the care setting. This underlines the need for adequate funding of trials with more robust designs (e.g. cluster‐randomised controlled trials with adequate planning, analysis and data especially on intracluster correlation coefficients) to enable a fuller understanding of the potential impact of supportive interventions.
Quality of the evidence
The quality of evidence in this review is between moderate to very low, depending on the outcome measurement. The main issue regarding risk of bias was that although attrition was usually reported clearly and there was little evidence of selective reporting, random sequence generation, concealment of allocation and blinding were frequently unclear. Most trials were small and inadequately powered to answer the question. Although there was significant performance bias, the nature of the included interventions and the settings in which they were undertaken, primarily care homes and hospital wards, means that it is unlikely that participants in the usual care arms were able to get access to the intervention. The possible exceptions to this are the trials by Pivi 2011 and Salva 2011, where a training intervention was provided to carers of people with Alzheimers disease living at home. In this case, it might have been possible for the carers allocated to the usual care group to seek out the information provided to those in the intervention group. Interestingly, the effect size in the trial by Pivi 2011, was significantly different from others in that grouping.
A meta‐analysis and GRADE approach was only possible for the outcome measures all‐cause mortality, length of hospital stay and weight change. These outcomes showed moderate‐quality evidence (all‐cause mortality, nutritional status) and very low‐quality evidence (hospitalisation), mainly because of the small number of included trials and issues of imprecision and indirectness, as well as inconsistency.
Potential biases in the review process
The protocol developed prior to undertaking this review was followed closely, throughout the process and particularly during the trial selection stage when three review authors were involved in detailed discussion. The original search strategy for this review was comprehensive in that we searched 10 databases, including databases other than those most commonly used (Avenell 2001) and we did not place any language restrictions on searches. We undertook additional searching, for example hand searching of the abstracts of meetings, reference lists of identified trials and extensive searching of the reference lists of relevant systematic reviews. In addition, we made considerable efforts to contact authors of included studies, where clarification of data or methodology were required. However, we did not survey study authors to identify additional reports of trials that may have been missed, which has to be acknowledged as a potential source of bias.
There was considerable clinical heterogeneity across all trials contributing to the findings in this review. At the trial selection stage and during categorisation of trials into sub‐groups, care was taken to group trials with similar interventions and populations together. It is possible that interventions judged to be similar, varied according to factors that are currently impossible to identify. For example, the trials evaluating the training of carers or dietetic assistants to deliver improved nutritional care resulted in different effects which may be attributable to a number of factors such as the quality of training, the level of attention provided by individual carers, constraints of the care setting, or indeed to the clinical characteristics of the trial populations. It was not possible to undertake many of the proposed subgroup analyses due to an absence of data. In addition, 12 of 41 (30%) trials included in this review were cluster‐randomised trials. Inadequate analysis methods used in these trials, which failed to account for the likelihood of similarity of participants within clusters and correlation of observations within clusters meant that these trials were excluded from the meta‐analyses. We cannot rule out the possibility that inclusion of data from these 12 trials in the meta‐analyses might change the overall findings.
Agreements and disagreements with other studies or reviews
The authors are aware of four published reviews of similar interventions (Cole 2012; Lambert 2010; Silver 2009; Weekes 2009), two of which employed systematic search strategies to identify trials (Cole 2012; Weekes 2009). All of the reviews looked at similar groupings of interventions (e.g. feeding assistance, changes to eating environment, staff training) and indeed included some of the trials identified in this review. They also included trials of weaker methodological quality (e.g. non‐randomised controlled trials), excluded from this review.
One review (Weekes 2009) arrived at a similar conclusion to this one, that there was a serious lack of evidence to support interventions designed to improve nutritional care. The other three focused on positive results from individual trials.
To the review authors’ knowledge, this is the first attempt at a systematic review with meta‐analyses, the results of which reveals lack of good evidence for supportive interventions. While the protocol specified outcome measures that are frequently assessed in nutrition intervention trials, the review authors question whether these are the most appropriate outcomes to assess the benefits of supportive interventions. Existing reports of supportive interventions similar to the ones identified in this review, have speculated on their benefits in terms of patient experience, staff awareness and motivation. These may be more relevant outcome measures for interventions of this type, which may explain the lack of trials for interventions such as the use of red trays, or protected meal times, since the primary intention was to improve the patient experience.
The review authors note however, that the explicit aim of all the trials included in this review was to increase dietary intake, and thus influence clinical outcome.


Study flow diagram

Risk of bias summary: review authors' judgements about each risk of bias item for each included trial.

Risk of bias graph: review authors' judgements about each risk of bias item presented as percentages across all included trials.

Forest plot of comparison: 1 Supportive interventions for enhancing dietary intake versus comparators, outcome: 1.2 Nutritional status (weight change) (kg)

Forest plot of comparison: 1 Supportive interventions for enhancing dietary intake versus comparators, outcome: 1.4 All‐cause mortality

Comparison 1 Supportive interventions for enhancing dietary intake versus comparators, Outcome 1 No. of participants with complications.

Comparison 1 Supportive interventions for enhancing dietary intake versus comparators, Outcome 2 Nutritional status (weight change).

Comparison 1 Supportive interventions for enhancing dietary intake versus comparators, Outcome 3 Hospitalisation.

Comparison 1 Supportive interventions for enhancing dietary intake versus comparators, Outcome 4 All‐cause mortality.
| Supportive interventions compared with usual care for malnourished or nutritionally at‐risk adults | ||||||
| Population: malnourished or nutritionally at‐risk adults | ||||||
| Outcomes | Illustrative comparative risks* (95% CI) | Relative effect | No of participants | Quality of the evidence | Comments | |
| Usual care | Supportive interventions | |||||
| All‐cause mortality | 133 per 1000 | 107 per 1000 (92 to 124) | RR 0.78 | 6683 (12) | ⊕⊕⊕⊝ | ‐ |
| Morbidity/complications (number of participants with any medical complication) Follow‐up: duration of hospital stay to 6 months | See comment | See comment | See comment | 4015 (5) | ⊕⊝⊝⊝ | No summary effect size calculated because of high inconsistency; RR ranged from 0.59 in favour of supportive interventions to 1.42 in favour of usual care |
| Health‐related quality of life and patient satisfaction Follow‐up: duration of hospital stay to 12 months | See comment | See comment | See comment | 4451 (5) | ⊕⊕⊝⊝ | 5/41 trials investigated health‐related quality of life using different instruments in participants from a wide range of different clinical backgrounds; overall we noted no substantial differences between intervention and comparator groups 2/41 trials investigated patient satisfaction by means of an unvalidated questionnaire |
| Hospitalisation and institutionalisation (days) | The mean hospitalisation ranged across control groups from 10 days to 40 days | The mean hospitalisation in the intervention groups was | ‐ | 667 (5) | ⊕⊝⊝⊝ | 3/5 trials with data on hospitalisation were in the group of trials of 'Changes to the organisation of nutritional care' |
| Adverse events Follow‐up: 8 days to 6 months | See comment | See comment | See comment | 4108 (3) | ⊕⊝⊝⊝ | Only 3/41 trials reported on adverse events (all evaluating the impact of supplementation of meals with oral nutritional supplements); 1 trial reported intolerance to the supplement (diarrhoea, vomiting) in 3/34 (15%) of participants. In another large trial 565/2017 (28%) of stroke patients stopped taking the oral nutritional supplements because of refusal or dislike of taste |
| Nutritional status (weight change in kg) | The mean weight change ranged across control groups from ‐3.0 kg to +0.3 kg | The mean weight change in the intervention groups was +0.6 kg higher (0.2 kg to 1.0 kg higher) | ‐ | 2024 (17) | ⊕⊕⊕⊝ | ‐ |
| Economic costs Follow‐up: duration of hospital stay to 12 months | See comment | See comment | See comment | 1152 (3) | ⊕⊝⊝⊝ | 3/41 trials evaluated and 2/41 trials reported some data on economic costs; none of the trials used accepted health economic methods and the reported data on both costs and effectiveness were generally poor |
| *The basis for the assumed risk (e.g. the median control group risk across trials) is provided in footnotes. The corresponding risk (and its 95% confidence interval) is based on the assumed risk in the comparison group and the relative effect of the intervention (and its 95% CI). | ||||||
| GRADE Working Group grades of evidence | ||||||
| *aAssumed risk was derived from the event rates in the comparator groups (usual care) aDowngraded by one level because of risk of bias in several risk of bias domains | ||||||
| Supportive nutritional care intervention Broad intervention category | Examples |
| 1. Changes to the organisation of nutritional care |
|
| 2. Changes to the feeding environment |
|
| 3. Modification of meal profile or pattern |
|
| 4. Additional supplementation of meals |
|
| 5. Congregate and home meal delivery systems |
|
| Intervention(s) and comparator(s) | Screened/eligible | Randomised | ITT | Finishing trial | Randomised finishing trial | Follow‐up | |
| Barton 2000a2 | I1: reduced portion size, fortified menu | ‐ | 13 | ‐ | b | 70c | 56 days |
| I2: cooked breakfast | (8 not randomised) | ||||||
| C: normal hospital diet with usual portion size | 14 | ||||||
| total: | 27a | ‐ | ‐ | ||||
| Beck 2002a1 | I1: homemade oral supplement (A) | ‐ | ‐ | ‐ | ‐ | ‐ | 2 months |
| I2: homemade oral supplement (B) | |||||||
| C: usual diet | |||||||
| total: | 36 | ‐ | ‐ | ||||
| Bouillane 2013a1 | I: 78% protein at lunch | ‐ | 30 | ‐ | 30 | 88 | 6 weeks |
| C: usual diet (protein distributed between meals) | 36 | 23 | 79 | ||||
| total: | 66 | 63 | 96 | ||||
| Bourdel‐Marchasson 2000a3 | I: 2 oral nutritional supplements | 295 | ‐ | ‐ | ‐ | 15 days or until hospital discharge | |
| C: usual care | 377 | ||||||
| total: | 672 | ‐ | ‐ | ||||
| Brouillette1991a1 | I: osmotherapy + activities | ‐ | 10 | ‐ | 9 | 90 | 4 weeks |
| C: activities only | 10 | 7 | 70 | ||||
| total: | 20 | 16 | 80 | ||||
| Castellanos 2009a2 | I1: fortified breakfast and lunch menu | 39 | d | e | 2 days of the study | ||
| I2: fortified lunch menu | 39 | ||||||
| C: usual menu | 39 | ||||||
| total: | 39a | 33 | 85 | ||||
| Chang 2005a3 | I: training in feeding skills | ‐ | 31 | ‐ | 12 | 60 | Quote: "Data collection was from February 2004 to May 2004" Comment: implies 4 months of data collection, following training but not clearly stated |
| C: no training | 36 | 8 | 50 | ||||
| total: | 67 | 20f | 56 | ||||
| Dennis 2005a1 | I: oral nutritional supplement + normal diet | 2016 | ‐ | ‐ | ‐ | 6 months | |
| C: normal hospital diet | 2007 | ||||||
| total: | 4023 | ‐ | ‐ | ||||
| Duncan 2006a1 | I: dietetic assistant | 363 | 153 | ‐ | 145 | 95 | 4 months |
| C: usual care | 165 | 157 | 95 | ||||
| total: | 318 | 302 | 95 | ||||
| Essed 2007a4 | I1: monosodium glutamate | ‐ | ‐ | ‐ | 19 | N/A | 16 weeks |
| I2: flavour | 19 | ||||||
| I3: monosodium glutamate + flavour | 22 | ||||||
| C: maltodextrin (placebo) | 23 | ||||||
| total: | 97 | 83 | 86 | ||||
| Essed 2009a2 | I: monosodium glutamate + NaCl | ‐ | 59 | ‐ | 53 | 90 | 4 weeks |
| C: usual hot meal | 59 | 53 | 90 | ||||
| total: | 59a | 53 | 90 | ||||
| Faxen‐Irving 2011a1 | I: 30 mL of fat emulsion 3 x per day | 107 | 34 | ‐ | 24 | 71 | Median 8 days |
| C: usual care | 37 | 27 | 73 | ||||
| total: | 71 | 51 | 72 | ||||
| Gaskill 2009a3 | I: nutrition education programme | 377 | ‐ | ‐ | ‐ | ‐ | 6 months |
| C: usual care | |||||||
| total: | 352 | ‐ | ‐ | ||||
| Germain 2006a1 | I: re‐formed foods | 93 | 8 | ‐ | 7 | 88 | 12 weeks |
| C: usual diet | 9 | 8 | 89 | ||||
| total: | 17 | 15 | 88 | ||||
| Hankey 1993a1 | I: supplemented with nutritionally complete drink | ‐ | 10 | ‐ | 7 | 70 | 8 weeks |
| C: standard hospital food | 10 | 7 | 70 | ||||
| total: | 20 | 14 | 70 | ||||
| Hickson 2004a1 | I: feeding assistance | 1776 | 292 | 292 | 250 | 86 | Duration of hospital stay |
| C: usual care | 300 | 300 | 259 | 86 | |||
| total: | 592 | 592 | 509 | 86 | |||
| Holyday 2012a1 | I: malnutrition care plan | ‐ | 71 | 71 | 71 | 100 | Duration of hospital stay |
| C: usual care | 72 | 72 | 72 | 100 | |||
| total: | 143 | 143 | 143 | 100 | |||
| Johansen 2004a1 | I: nutrition team | 7468 | ‐ | ‐ | 108 | N/A | Duration of hospital stay |
| C: usual care | 104 | ||||||
| total: | 215 | 212 | 99 | ||||
| Kraft 2012a1 | I: oral nutritional supplement + telemedicine monitoring | 87/50 | 13 | 5 | 1 | 8 | 6 months |
| C: usual care | 13 | 9 | 4 | 31 | |||
| total: | 26 | 14 | 5 | 19 | |||
| Kretser 2003a1 | I: modified meals on wheels | 324 | 102 | ‐ | ‐ | ‐ | 26 weeks |
| C: traditional meals on wheels | 101 | ||||||
| total: | 203 | 60 | 30 | ||||
| Larsson 1990a1 | I: oral nutritional supplement + normal hospital diet | ‐ | 197 | ‐ | ‐ | ‐ | 26 weeks |
| C: normal hospital diet | 238 | ||||||
| total: | 435 | ‐ | ‐ | ||||
| Leslie 2012a3 | I: energy enriched usual meals | 445 | 22 | 16 | 73 | 12 weeks | |
| C: usual care | 19 | 16 | 84 | ||||
| total: | 41 | ||||||
| Lin 2010a3 | I1: spaced‐retrievalg | ‐ | 32 | ‐ | ‐ | ‐ | 8 weeks |
| I2: Montessorih | 29 | ||||||
| C: usual care | 24 | ||||||
| total: | 85 | 82 | 97 | ||||
| Lin 2011a2, a3 | I: Montessori | ‐ | ‐ | ‐ | ‐ | 8 weeks | |
| C: usual care | |||||||
| total: | 29a | 29 | 100 | ||||
| Mathey 2001aa3 | I: improved meal ambiance | 60 | 21 | ‐ | 12 | 57 | 12 months |
| C: usual care | 17 | 10 | 59 | ||||
| total: | 38 | 22 | 58 | ||||
| Mathey 2001ba1 | I: flavour enhancement | ‐ | ‐ | ‐ | 31 | N/A | 16 weeks |
| C: usual care | 36 | ||||||
| total: | 71 | 67 | 94 | ||||
| Munk 2014a1 | I: energy and protein enriched foods provided via a la carte menu in addition to hospital food | 44 | 41 | 96 | Duration of hospital stay | ||
| C: usual care | 40 | 40 | |||||
| total: | 84 | ||||||
| Nijs 2006a3 | I: family‐style meals | 282 | 133 | ‐ | 95 | 71 | 6 months |
| C: usual care | 112 | 83 | 74 | ||||
| total: | 245 | 178 | 73 | ||||
| Olofsson 2007a1 | I: multi‐component intervention (including nutrition) | 353 | 102 | ‐ | 83 | 81 | 4 months |
| C: usual care | 97 | 74 | 76 | ||||
| total: | 199 | 157 | 79 | ||||
| Pivi 2011a1 | I1: nutrition education | ‐ | ‐ | ‐ | 25 | N/A | 6 months |
| I2: oral nutritional supplements | 26 | ||||||
| C: usual care | 27 | ||||||
| total: | 90 | 78 | 87 | ||||
| Potter 2001a1 | I: oral nutritional supplement + normal hospital diet | 618 | 186 | ‐ | 186 | 100 | Duration of hospital stay |
| C: normal hospital diet | 195 | 195 | 100 | ||||
| total: | 381 | 381 | 100 | ||||
| Remsburg 2001a1 | I: buffet‐style meals | 62 | 20 | ‐ | 20 | 100 | 3 months |
| C: usual care | 20 | 19 | 95 | ||||
| total: | 40 | 39 | 98 | ||||
| Salva 2011a3 | I: teaching and training | ‐ | 448 | 448 | 300 | 67 | 12 months |
| C: usual care | 498 | 498 | 368 | 74 | |||
| total: | 946 | 946 | 668 | 71 | |||
| Silver 2008a2 | I: fortified home‐delivered lunch | ‐ | ‐ | ‐ | ‐ | ‐ | 7 months |
| C: usual home‐delivered lunch | |||||||
| total: | 52 | 45 | 87 | ||||
| Simmons 2008a2, a3 | I: feeding assistance and/or snacks | 173 | 30 | ‐ | 28 | 88 | 24 weeks |
| C: usual diet | 34 | 32 | 94 | ||||
| total: | 64a | ‐ | 60 | 94 | |||
| Simmons 2010a1 | I1: snacks | 280 | ‐ | ‐ | 25 | N/A | 6 weeks |
| I2: additional supplementation of meals | 18 | ||||||
| C: usual care | 20 | ||||||
| total: | 86 | 63 | 73 | ||||
| Smolliner 2008a3 | I: fortified meals and snacks | 295/92 | ‐ | ‐ | 22 | N/A | 12 weeks |
| C: usual diet | 30 | ||||||
| total: | 65 | 52 | 80 | ||||
| Splett 2003a3 | I: medical nutrition therapy | 394 | 223 | ‐ | 200 | 90 | 19‐180 days |
| C: usual care | 171 | 164 | 96 | ||||
| total: | 394 | 364 | 92 | ||||
| Taylor 2006a2 | I: 5‐meal menu | 66 | ‐ | ‐ | ‐ | ‐ | 2 periods of 4 days |
| C: usual (3‐meal menu) | |||||||
| total: | 31a | 31 | 100 | ||||
| Van den Berg 2015a1 | I1: offered 125 mL ONS daily with medication rounds | 885 | 88 | 75 | 85 | Maximum period 30 days | |
| I2: offered 62 mL ONS daily with medication rounds | 66 | 51 | 77 | ||||
| C: offered 125 mL ONS twice daily in between meals | 80 | 66 | 83 | ||||
| total: | 234 | ||||||
| Van Ort 1995a1 | I: contextual and behavioural intervention | 8 | ‐ | ‐ | ‐ | ‐ | 1 month to 6 weeks |
| C: usual care | |||||||
| total: | 8 | 7 | 88 | ||||
| Grand total | All interventionsj | ||||||
| All controlsj | |||||||
| All interventions and controls | 10,681 | ||||||
| a1Parallel RCT; a2cross‐over RCT; a3cluster RCT; a4 factorial RCT C: comparator; I: intervention; ITT: intention‐to‐treat | |||||||
| Outcome measure | No. of studies | No. of participants | Studies potentially with data for meta‐analysis |
| Energy intake | 5 | 666 | 1 |
| Health‐related quality of life | 1 | 220 | 0 |
| Patient satisfaction | 2 | 1105 | 0 |
| Complications | 4 | 1263 | 3 |
| Nutritional status: weight | 10 | 2184 | 9 |
| BMI | 7 | 1537 | 6 |
| TSF | 3 | 536 | 3 |
| MAC | 3 | 568 | 3 |
| Length of stay | 5 | 1256 | 3 |
| Hospital admission | 1 | 143 | 1 |
| Mortality | 5 | 2182 | 5 |
| Costs | 2 | 1089 | 0 |
| BMI: body mass index; MAC: mid‐arm circumference; TSF: triceps skinfold thickness | |||
| Outcome measure | No. of studies | No. of participants | Studies with data for meta‐analysis |
| Energy intake | 3 | 216 | 3 |
| Health‐related quality of life | 2 | 200 | 0 |
| Nutritional status: weight | 3 | 239 | 3 |
| MAC | 1 | 178 | 1 |
| Clinical function | 3 | 1664 | 2 |
| Mortality | 3 | 236 | 3 |
| MAC: mid‐arm circumference | |||
| Outcome measure | No. of studies | No. of participants | Studies potentially with data for meta‐analysis |
| Energy intake | 11 | 506 | 7 |
| Health‐related quality of life | 1 | 52 | 0 |
| Complications | 1 | 66 | 1 |
| Nutritional status: weight | 7 | 387 | 7 |
| BMI | 3 | 98 | 3 |
| MAC | 1 | 32 | 1 |
| Clinical function | 3 | 200 | 3 |
| Length of stay | 1 | 81 | 1 |
| Mortality | 4 | 243 | 4 |
| BMI: body mass index; MAC: mid‐arm circumference | |||
| Outcome measure | No. of studies | No. of participants | Studies potentially with data for meta‐analysis |
| Energy intake | 8 | 1469 | 7 |
| Health‐related quality of life | 1 | 4023 | 0 |
| Complications | 2 | 4695 | 1 |
| Nutritional status: weight | 7 | 605 | 4 |
| BMI | 2 | 102 | 1 |
| TSF | 2 | 0 | |
| MAC | 3 | 1 | |
| Clinical function | 2 | 618 | 0 |
| Length of stay | 4 | 4689 | 1 |
| Mortality | 5 | 5745 | 5 |
| Costs | 1 | 63 | 0 |
| BMI: body mass index; MAC: mid‐arm circumference; TSF: triceps skinfold thickness | |||
| Outcome measure | No. of studies | No. of participants | Studies included in the meta‐analysis |
| Energy intake | 27 | 2857 | 0 |
| Health‐related quality of life | 5 | 4495 | 0 |
| Patient satisfaction | 2 | 1105 | 0 |
| Complications | 7 | 6024 | 5 |
| Nutritional status: weight | 28 | 3618 | 24 |
| BMI | 12 | 1737 | 0 |
| TSF | 5 | ‐ | 0 |
| MAC | 8 | ‐ | 0 |
| Clinical function | 9 | 2746 | 0 |
| Length of hospital stay | 10 | 6026 | 5 |
| Hospital admissions | 2 | 389 | 0 |
| Mortality | 18 | 8690 | 17 |
| Economic costs | 3 | 1152 | 0 |
| BMI: body mass index; MAC: mid‐arm circumference; TSF: triceps skinfold thickness | |||
| Outcome | Reason the data were not usable | Contact with author | Outcome of contact with author | Action taken | |
| 1. Organisational change | |||||
| Chang 2005 | Energy intake | Data reported as amount eaten in ¼, ½, ¾ | Yes | No response | Data reported in structured narrative summary |
| Duncan 2006 | Complications | Reported as a median and IQR | Yes | Data provided | Data used |
| Length of stay | Reported as median and IQR | Yes | Confirmed data skewed | Data reported in structured narrative summary | |
| Gaskill 2009 | Measured prevalence of malnutrition with SGA | Not an outcome of interest for this review | Yes, to request weight data (a component of SGA) | Unable to provide data | Data not reported |
| Hickson 2004 | Energy intake | Not measured at baseline, only at follow‐up | Yes, to confirm interpretation of data | Data not measured at baseline | Data reported in structured narrative summary |
| Complications (antibiotic prescription) | Reported as median and IQR | Yes, to request complications according to group allocation | No. complications according to group allocation was provided | Data reported in structured narrative summary | |
| Hospital admission | States in protocol these are collected, but not reported | Yes, to request data | Author unable to recall what happened with data | Data not reported | |
| Holyday 2012 | Costs | An estimate based on local prices, not a complete cost analysis | No, judged unlikely to be available | N/A | Data not reported |
| Hospital admission | Presented as a frequency | Yes, to request total number of readmissions | Data provided | Data reported in structured narrative summary | |
| Johansen 2004 | Energy intake | Reported as kJ/kg/day | Yes, for mean change | No response | Data not reported |
| Kraft 2012 | BMI | Presented as mean and SD at baseline and follow‐up, but no mean change | Yes | No response | Data not reported |
| Lin 2010 | Energy intake | 'Amount of each meal consumed' was reported as % eaten | Yes | No response | Data reported in structured narrative summary |
| Weight | Reported as mean and SD pre and post intervention/control | Yes, to request mean change | No response | Calculated mean change, and imputed the SD of change from Salva 2011 | |
| BMI | Reported as mean and SD pre and post intervention/control | Yes, to request mean change | No response | Calculated mean change, and imputed the SD of change from Salva 2011 | |
| Olofsson 2007 | Weight | Reported as mean and SD pre and post intervention/control | Yes, to request mean change and SD | Data provided | Data reported in structured narrative summary |
| BMI | Reported as mean and SD pre and post intervention/control | Yes, to request mean change and SD | Data provided | Data reported in structured narrative summary | |
| Complications | Reported as no. falls in men and women | Yes, to request total complications per group | Data provided | Data reported in structured narrative summary | |
| Pivi 2011 | Weight | Reported as mean and SD pre and post intervention/control | Yes, to request mean change | No response | Calculated mean change, and imputed the SD of change using the P value |
| BMI | Reported as mean and SD pre and post intervention/control | Yes, to request mean change | No response | Calculated mean change, and imputed the SD of change from Salva 2011 | |
| TSF | Reported as mean and SD pre and post intervention/control | Yes, to request mean change | No response | Calculated mean change, and imputed the SD of change from Salva 2011 | |
| MAC | Reported as mean and SD pre and post intervention/control | Yes, to request mean change | No response | Calculated mean change, and imputed the SD of change | |
| Salva 2011 | MAC | Methodology reported this was an outcome measured, but not reported in results | Yes | No response | Data not used |
| Costs | Described as data to be collected, but reported that analysis was not undertaken | No | Not reported | ||
| Splett 2003 | Intake | Food intake is documented as a nutrition assessment activity | Yes, to request mean energy intake per group | Unable to provide data | Not reported |
| Weight | Methodology reports this was an outcome measured, but reported in a format not usable | Yes | Unable to provide data | Not reported | |
| 2. Feeding environment | |||||
| Brouilette 1991 | Energy | Reported pre and post intervention data, but no SD of change | No, as no author contact details and study published in 1991 | N/A | Imputed the SD from Nijs 2006 |
| Van Ort 1995 | Weight change | No figures reported | Yes, to request data on mean and SD of change for each group | Waiting response | Not used |
| Intervention group clarification | Were the behavioural and contextual intervention received at the same time | Yes, to request this detail | Waiting response | Assumed the two interventions were given at the same time | |
| 3. Meal modification | |||||
| Bouillanne 2013 | Weight | Did not report weight, but assumed they had the data as Full Body Composition was used | Yes, to request data | Data provided | Data reported |
| Energy intake | Reported as kcal/kg/day | Yes, to request data | Data provided | Data reported | |
| Hand grip strength | Reported data as mean/median and 95% CI of the median | Yes, to request data | Provided mean and SD of change | Data reported | |
| ADL | Reported data as mean/median and 95% CI of the median | Yes, to request data | Data provided | Data reported | |
| Castellanos 2009 | Energy intake | Results were not analysed according to groups randomised, but regrouped subjects into small eaters and large eaters | Yes, to ask for data on mean and SD of change for each group | No response | Data reported |
| Germain 2006 | BMI | They reported the mean BMI rather than mean change | Yes, for mean and SD of change | Data provided | Data reported |
| Smolliner 2008 | Weight change | Reported mean and SD at baseline and end of intervention | Yes, for mean change and SD | Data provided | Data reported |
| BMI | Reported mean and SD at baseline and end of intervention | Yes, for mean change and SD | Data provided | Data reported | |
| Handgrip strength | Reported mean and SD at baseline and end of intervention | Yes, for mean change and SD | Data provided | Data reported | |
| health‐related quality of life | Reported mean and SD at baseline and end of intervention | Yes, for mean change and SD | Data provided | Data reported | |
| 4. Supplementation of meals | |||||
| Beck 2002 | Weight | Reported as median change with 95% CI | Yes, for mean change and SD | Response received but data not available | Data reported in structured narrative summary |
| Energy intake | Reported as median change with 95% CI | Yes, for mean change and SD | Response received but data not available | Data reported in structured narrative summary | |
| Bourdel‐ Marchasson 2000 | Pressure ulcers | Data given as percentage per group | Yes, for number per group | Data provided | Data reported in structured narrative summary |
| Weight | Data given for baseline only | Yes, for change in weight from baseline to follow‐up | Yes, author stated she did not find the analysis of discharge weight, probably due to the low quality of this data (too many missing data) | Data not reported | |
| Dennis 2005 | Complications | Data given as percentages | Yes for data on total complications per group | Data provided | Data reported in structured narrative summary |
| Health‐related quality of life score | Differences between means provided | Yes, to request mean and SD of changes | Unable to provide data, as EuroQol was only measured at follow‐up | Data reported in structured narrative summary | |
| Faxen‐Irving 2011 | Energy intake | Data given in a graph, no numbers available | Yes, for mean and SD of change in energy intake, between the control and intervention groups from baseline to the 2nd registration | Data provided | Data reported in structured narrative summary |
| Length of stay | Data provided at baseline, not follow‐up | Yes, for mean and SD | Data provided | Data reported in structured narrative summary | |
| Infection | Data provided at baseline, not follow‐up | Yes, for mean and SD | Unable to provide data | Data not reported | |
| BMI | Data provided at baseline, not follow‐up | Yes, for mean and SD | Data provided | Not reported in the summary because few studies measured this outcome | |
| ADL | Data provided at baseline, not follow‐up | Yes, for mean and SD | Data provided | Not reported in the summary because few studies measured this outcome | |
| Hankey 1993 | Weight | Presented in graphs, no numbers given | Yes, for mean and SD | Unable to provide data but suggested using data from the review by Milne 2009 which included these data | Data obtained from systematic review by Milne 2009 |
| MAC | Presented in graphs, no numbers given | Yes, for mean and SD | Unable to provide data but suggested using data from the review by Milne 2009 which included these data | Data obtained from systematic review by Milne 2009 but not reported as few studies measured this outcome | |
| TSF | Presented in graphs, no numbers given | Yes, for mean and SD | Unable to provide data but suggested using data from the review by Milne 2009 which included these data | Not reported in the summary because few studies measured this outcome | |
| Energy and protein intake | Presented in graphs, no numbers given | Yes, for mean and SD | Unable to provide data | Data not reported | |
| Larsson 1990 | Energy intake | Data included in Modified Norton Scale | Yes, data for change in energy intake between groups (mean and SD) | No response | Data not reported |
| Weight | Data provided as ‘weight index’ | Yes, for change in weight between groups (mean and SD) | No response | Data not reported | |
| TSF | Data provided as differences between men and women, and non‐PEM and PEM groups | Yes, for change between groups (mean and SD) | No response | Data not reported | |
| MAC | Data provided as differences between men and women, and non‐PEM and PEM groups | Yes, for change between groups (mean and SD) | No response | Data not reported | |
| Length of stay | Not given | Yes, for mean and SD between groups | No response | Data not reported | |
| Total number of eligible participants | Unclear across all 4 duplicates of this study | Yes, for a clear number of randomised participants, no finishing study, and deaths | No response | Data not reported | |
| Potter 2001 | Length of stay | Provided as median with a range | Yes, for mean and SD between groups | No response | Data reported in structured narrative summary |
| ADL | Stated as an outcome measure in methodology, then not reported in results | Yes, for mean and SD between groups | No response | Not reported in the summary because few studies measured this outcome | |
| BMI | Stated as an outcome measure in methodology, then not reported in results | Yes, for mean and SD between groups | No response | Not reported in the summary because few studies measured this outcome | |
| TSF | Stated as an outcome measure in methodology, then not reported in results | Yes, for mean and SD between groups | No response | Not reported in the summary because few studies measured this outcome | |
| Simmons 2008 | Weight | Data presented as phase 1 and 2 cross‐over combined. The data from phase 1 was needed for this review | Yes, for the phase 1 data | Yes, responded but unable to provide data | Data reported in structured narrative summary |
| BMI | Data presented as phase 1 and 2 cross‐over combined. The data from phase 1 was needed for this review | Yes, for the phase 1 data | Yes, responded but unable to provide data | Not reported in the summary because few studies measured this outcome | |
| Energy intake | Presented as pre‐ and post intervention | Yes, for mean and SD of change | Yes, responded but unable to provide data | Imputed SD from Nijs 2006 | |
| Simmons 2010 | Energy | Reported as mean difference without the SD | Yes, requested SD for mean change | Yes, responded but unable to provide data | Imputed SD from Nijs 2006 |
| 5. Home meal delivery systems | |||||
| Kretser 2003 | Weight | Reported separately for participants at risk of malnutrition, and those malnourished | No, failed to find contact information for the author | N/A | Combined the mean change data using the formulae for combining groups |
| ADL: activities of daily living; BMI: body mass index; CI: confidence interval; EuroQol: European Quality of Life Scale; IQR: interquartile range; MAC: midarm muscle circumference; N/A: not applicable; PEM: protein‐energy malnutrition; SD: standard deviation; SGA: subjective global assessment; TSF: triceps skinfold thickness | |||||
| Setting | No. participants | No. studies |
| Hospital | 7591/10,681 (71.1) | 15 |
| Residential care home | 1731/10,681 (16.2) | 21 |
| Free‐living/outpatient setting | 1305/10,681 (12.2) | 5 |
| Outcome | (N) | Results | P Value | ||
| Intervention | Control | ||||
| Dietetic assistants (Hospital) | |||||
| Duncan 2006 | Mean (SD) energy intake (kcal/day) | 275 (total N = 302) | 1105 (361) | 756 (399) | < 0.001 |
| Hickson 2004 | Between‐group difference (kcal) | 37 (total N = 592) | 89 | 0.538 | |
| Specialist training (residential care settings) | |||||
| Chang 2005 | % (SD) meals consumed | 67 | Pre: 90 % (22) Post: 85 (25) | Pre: 78 % (34) Post: 94 % (18) | 0.49 |
| Lin 2010 | % (SD) meals consumed | 85 | Spaced retrieval (SR) Pre: 85 % (11) Post: 91 % (9) Montessori (MON) Pre: 75 % (23) Post 78 % (10) | Pre: 79 % (19) Post: 88 % (18) | SR vs control = NS MON vs control < 0.05 |
| Multi‐disciplinary team (hospital) | |||||
| Johansen 2004 | kcal/kg body weight per day (SE) | 202 (total N = 212) | 30 (SE 1) | 25 (SE 1) | < 0.005 |
| kcal: kilocalorie; SD: standard deviation; SE: standard error | |||||
| Outcome | (N) | Results | P Value | ||
| Intervention | Control | ||||
| Patient satisfaction | |||||
| Dietetic assistants (hospital) | |||||
| Duncan 2006 | Median score (IQR) | 159 | 6.5 (2) | 3.0 (4) | 0.0001 |
| Health‐related quality of life | |||||
| Multi‐disciplinary team (hospital) | |||||
| Johansen 2004 | Change in physical score (SF‐36) | 110 | 2.4 (1.3) | 0.2 (1.5) | NS |
| Change in mental score (SF‐36) | 110 | 2.2 (2.5) | 3.3 (2) | NS | |
| Number of complications | |||||
| Dietetic assistants (hospital) | |||||
| Duncan 2006 | Total number of participants with complications | 302 | 84/125 (67%) | 79/130 (61%) | 0.29 |
| Hickson 2004 | Number of participants receiving oral antibiotics | 592 | 142/292 (49%) | 150/300 (50%) | 0.67 |
| Multi‐disciplinary team (hospital) | |||||
| Johansen 2004 | Total number of participants with complications | 212 | 34/108 (31%) | 23/104 22%) | NS |
| Olofsson 2007 | Total number of participants with complications | 157 | 81/83 (98%) | 74/74 (100%) | |
| IQR: interquartile range; NS: not significant; SF‐36: short form‐36 | |||||
| Outcome | (N) | Results | P Value | ||
| Intervention | Control | ||||
| Dietetic assistants (hospital) | |||||
| Duncan 2006 | Mean change (SD) Weight (kg) MAC (cm) TSF (mm) | (total N = 302) 170 230 205 | ‐0.36 (3.3) ‐0.9 (2.2) ‐0.88 (2.6) | ‐1.0 (2.8) ‐1.3 (1.5) ‐1.23 (3.2) | 0.16 0.002 0.087 |
| Hickson 2004 | Mean change (SD) Weight (kg) MAC (cm) TSF (mm) Median (IQR) MAMC BMI (kg/m²) | (total N = 592) 191 286 279 429 254 | ‐0.92 (2.71) ‐0.3 (1) ‐0.4 (1.8) ‐0.1 (‐0.8‐0.4) ‐0.04 (1.1) | ‐0.9 (3) ‐0.3 (1) ‐0.4 (1.7) ‐0.1 (‐0.5‐0.3) ‐0.25 (1.18) | 0.23 0.65 0.86 0.84 0.68 |
| Specialist training (residential care settings) | |||||
| Lin 2010 | Mean change (SD) Weight (kg) BMI (kg/m²) | 85 | Spaced retrieval ‐0.07 (0.57) Montessori ‐0.15 (0.57) Spaced retrieval 0.1 (1.0) Montessori ‐0.06 (1.0) | ‐0.09 (0.57) ‐0.03 (1) | NS NS |
| Lin 2011 | BMI | 29 | ‐0.26 (0.73) | ‐0.09 (0.85) | 0.245 |
| Specialist training (free‐living individuals) | |||||
| Pivi 2011 | Mean change (SD) Weight (kg) MAC (cm) TSF (mm) BMI (kg/m²) | 52 | 1.19 (imputed SD: 3.3) 1.87 (2) 2.3 (5.4) 1.19 (1) | ‐2.2 (imputed SD: 3.3) ‐0.4 (0.46) 2.2 (5.3) ‐2.21 (1) | Reported as between‐group differences for 4 groups |
| Salva 2011 | Mean change (SD) Weight (kg) BMI (kg/m²) | 946 | 0.26 (0.7) ‐0.01 (2.2) | 0.09 (0.5) ‐0.06 (3.2) | 0.598 0.843 |
| Multi‐disciplinary team (hospital) | |||||
| Johansen 2004 | Mean change (SD) Weight (kg) | (total N = 212) 95 | ‐0.22 (3.9) | 0.1 (2) | NS |
| Olofsson 2007 | Mean change (SD) Weight (kg) BMI (kg/m²) | (total N = 199) 157 157 | ‐1.1 (3.6) ‐0.45 (1.3) | ‐0.7 (3.8) ‐0.3 (1.5) | 0.05 0.05 |
| Protocol‐driven pathway (hospital) | |||||
| Holyday 2012 | Mean change (SD) Weight (kg) | (total N = 143) 69 | ‐0.9 (3.6) | ‐0.9 (2.3) | 0.98 |
| Protocol‐driven pathway (residential care settings) | |||||
| Splett 2003 | Weight | 364 | No wt loss at baseline: 95% maintained wt. Wt loss at baseline: 48% maintained or gained wt. | No wt loss at baseline: 58% maintained wt. Wt loss at baseline: 57% maintained or gained wt. | |
| Telemedicine (free‐living individuals) | |||||
| Kraft 2012 | Mean change (SD) Weight (kg) BMI (kg/m²) | 26 14 | ‐4.5 (7.9) Baseline 24.5 (5.1) Follow‐up 23.0 (4.2) | ‐3 (6.2) Baseline 23.9 (4.4) Follow‐up 22.8 (4.3) | NS NS |
| BMI: body mass index; IQR: interquartile range; MAC: mid‐arm circumference; MAMC: mid‐arm muscle circumference; NS: not significant; SD: standard deviation; TSF: triceps skinfold thickness; wt: weight | |||||
| Outcome | (N) | Results | P Value | ||
| Intervention | Control | ||||
| Handgrip strength | |||||
| Dietetic assistants (Hospital) | |||||
| Duncan 2006 | Mean change (SD) | 126 (total N = 302) | 2.2 (10.7) | 0.16 (11.8) | 0.32 |
| Hickson 2004 | Median change (IQR) (kg) | (total N = 592) | 0.8 (‐1.4 to 2.5) | 0.7 (‐1.5 to 3) | 0.85 |
| IQR: interquartile range; SD: standard deviation | |||||
| Outcome | (N) | Results | P Value | ||
| Intervention | Control | ||||
| Mortality | |||||
| Dietetic assistants (Hospital) | |||||
| Duncan 2006 | 4‐month mortality | (total N = 302) | 19/145 (13%) | 36/157 (23%) | 0.036 |
| Hickson 2004 | In‐hospital mortality | (total N = 592) | 31/292 (11%) | 35/300 (12%) | 0.69 |
| Specialist training (free‐living individuals) | |||||
| Salva 2011 | 12‐month mortality | 946 | 43/448 (10%) | 29/498 (6%) | NR |
| Multi‐disciplinary team (hospital) | |||||
| Olofsson 2007 | 4‐month mortality | 199 | 9/102 (9%) | 13/97 (13%) | NR |
| Protocol‐driven pathway (hospital) | |||||
| Holyday 2012 | Not reported | 143 | 1/72 (1%) | 4/71 (6%) | 0.21 |
| Length of stay in hospital | |||||
| Dietetic assistants (hospital) | |||||
| Duncan 2006 | Median (IQR) (days) | 167 | 34 (48) | 32 (49) | 0.81 |
| Hickson 2004 | Median (IQR) (days) | 592 | 21(13‐36) | 23(14‐39) | 0.41 |
| Multi‐disciplinary team (hospital) | |||||
| Johansen 2004 | Mean (SD) LOS to 28 days | 197 | 11.6 (8) | 11.5( 8) | NS |
| Olofsson 2007 | Mean (SD) (days) | 157 | 27.4 (15.9) | 39.8 (41.9) | < 0.05 |
| Protocol‐driven pathway (hospital) | |||||
| Holyday 2012 | Mean (SD) (days) | 143 | 13.7 (11.8) | 13.5 (11) | 0.85 |
| Hospital readmissions | |||||
| Protocol‐driven pathway (hospital) | |||||
| Holyday 2012 | Number of readmissions at 6 months | 30/71 | 37/72 | NR | |
| IQR: interquartile range; LOS: length of stay; SD: standard deviation | |||||
| Outcome | (N) | Results | P Value | |||
| Intervention | Control | |||||
| Changes to the dining room environment | ||||||
| Mathey 2001 | Mean change (SD) energy intake (kcal) | 22 | 199 (406) | 185( 247) | NR | |
| Nijs 2006 | Mean change (SD) energy intake (kcal) | 178 | 116 (456) | ‐100 (357) | ||
| Mean difference (95% CI) | 178 | 235 (83‐268) | Described as significantly different but no P value reported | |||
| Remsburg 2001 | NR | |||||
| Sensory stimulation | ||||||
| Brouillette 1991 | Mean change (SD) in intake of lunch meal (kcal) | 16 | ‐1.6 (450) | 11.14 (360) | 0.49 | |
| CI: confidence interval; NR: not reported; SD: standard deviation | ||||||
| Outcome | (N) | Results | P Value | ||
| Intervention | Control | ||||
| Changes to the dining room environment | |||||
| Mathey 2001a | Sickness Impact Profile, mean change (SD) in score | 16/2 | ‐2 (11) | ‐13 (12) | NR |
| Nijs 2006 | Overall QOL mean change (95% CI) in score | 178 | 0.4 (‐1.8 to 2.5) | ‐5 (‐9.4 to ‐0.6) | NR |
| Mean difference (95% CI) | 178 | 6.1 (2.1 to 10.3) | Described as significantly different but no P value reported | ||
| Physical performance, mean change (95% CI) in score | 178 | 0.2 (‐2.3 to 2.7) | ‐2.2 (‐4.1 to ‐0.4) | NR | |
| Mean difference (95% CI) | 178 | 3.2 0.9 to 5.5) | Described as significantly different but no P value reported | ||
| CI: confidence interval; NR: not reported; QOL: quality of life; SD: standard deviation | |||||
| Outcome | (N) | Results | P Value | ||
| Intervention | Control | ||||
| Weight | |||||
| Changes to the dining room environment | |||||
| Mathey 2001a | Mean change (SD) (kg) | 22 | 3.3 (5) | ‐0.4 (4) | I: < 0.05; C: 0.78 |
| Nijs 2006 | Mean change (SD) (kg) | 178 | 0.5 (3.9) | ‐1.1 (3.7) | NR |
| Mean difference (95% CI) | 178 | 1.5 (0.6 to 2.4) | Described as significantly different but no P value reported | ||
| Remsburg 2001 | Mean change (SD) (kg) | 39 | ‐0.11 (3.1) | 0.32 (2.2) | 0.638 |
| C: control; I: intervention; NR: not recorded; SD: standard deviation | |||||
| Outcome | (N) | Results | P Value | ||
| Intervention | Control | ||||
| Changes to the dining room environment | |||||
| Mathey 2001a | Mortality | 38 | 7/21 (33%) | 5/17 (29%) | NR |
| Nijs 2006 | Mortality | 178 | 18/112 (16%) | 16/133 (12%) | NR |
| Sensory stimulation | |||||
| Brouillette 1991 | Mortality | 20 | 1/10 (10%) | 0/10 (0%) | NR |
| NR: not reported | |||||
| Outcome | (N) | Results | P Value | ||||
| Intervention | Control | ||||||
| Fortification of food (studies in hospital) | |||||||
| Barton 2000 | Total energy intake (kcal/d) | 36 | 1711 (195) | 1425 (136) | < 0.001 | ||
| Munk 2014 | Mean (SD) intake (kj/d) | 81 | 5843 (1660) | 5149 (1832) | |||
| Mean (95% CI) difference between groups | 693 (‐80 to 1466) | 0.08 | |||||
| Fortification of food (studies in residential care homes) | |||||||
| Leslie 2012 | mean (SEM) change in energy intake (baseline to week 12) (kcal/d) | 16 | 133 (89) | ‐36 (84) | 0.154 | ||
| Food fortification (studies in free‐living individuals) | |||||||
| Silver 2008 | Total energy intake (kcal/d) | 45 | 1876 (543) | 1423 (422) | < 0.001 | ||
| Modifications to meal composition (studies in intermediate care) | |||||||
| Bouillane 2013 | Change in energy intake (kcal) | 63 | 50.9 (458) | 39.2 (401) | NR | ||
| Modifications to meal delivery (studies in residential care homes) | |||||||
| Germain 2006 | Change in energy intake (kcal) | 15 | 611 (408) | 81 (169) | 0.03 | ||
| Taylor 2006 | Total energy intake (kcal/d) | 31 | 1342 (177) | 1325 (207) | 0.565 | ||
| Modifications to flavour (studies in residential care homes) | |||||||
| Essed 2007 | Change in energy intake (kcal) | 83 | Flavour: ‐17 (445) Flavour + MSG: 78 (352) MSG: ‐32 (28) | 102 (452) | NR | ||
| Essed 2009 | Energy intake from modified meal (kcal) | 53 | 420 (211) | 424 (216) | 0.896 | ||
| Mathey 2001b | Change in energy intake (kcal) | 67 | ‐50 (267) | ‐115 (298) | Baseline to end of intervention I: NR, C: < 0.05 | ||
| C: control; I: intervention; MSG: monosodium glutamate; NR: not recorded; SD standard deviation; SEM standard error of the mean; CI confidence interval | |||||||
| Outcome | (N) | Results | P Value | ||
| Intervention | Control | ||||
| Weight and BMI (mean change (SD)) | |||||
| Fortification of food (studies in hospital) | |||||
| Munk 2014 | Mean (SD) within‐group change in weight (kg) | 66 | 0.4 (2.6) | ‐0.4 (1.8) | 0.17 |
| Mean (95% CI) between‐group difference in weight (kg) | ‐0.8 (‐1.9 to 0.3) | ||||
| Fortification of food (studies in residential care homes) | |||||
| Leslie 2012 | Mean (SD) within‐group weight change (kg) | 31 | 1.3 (0.53)* | ‐0.2 (1.5)** | *0.03 **0.536 |
| Mean (SD) within‐group change in BMI (kg/m2) | 31 | 0.5 (0.25)* | ‐0.1 (0.4)** | *0.042 **0.517 | |
| Mean (SD) within‐group change in MUAC (mm) | 32 | 0.4 (0.16)* | ‐0.1 (0.3)** | *0.019 **0.691 | |
| Smolliner 2008 | Mean (SD) change weight (kg) | 52 | 2 (2.1) | 1.6 (2) | NS |
| BMI change (kg/m²) | 52 | 0.77 (1.5) | 0.45 (1.1) | Between‐group difference NS | |
| Modifications to meal composition (studies in intermediate care) | |||||
| Bouillanne 2013 | Mean (SD) change weight (kg) | 63 | 0.4 (2.3) | ‐0.7 (3.1) | NR |
| Modifications to meal delivery (studies in residential care homes) | |||||
| Germain 2006 | Mean (SD) change weight (kg) | 15 | 3.9 (2.3) | ‐0.8 (4.2) | 0.02 |
| BMI change (kg/m²) | 15 | 1.51 (1.16) | 0.27 (1.46) | Data provided by study author P value NR | |
| Modifications to flavour (studies in residential care homes) | |||||
| Essed 2007 | Mean (SD) change weight (kg) | 83 | Flavour: 0.1 (2.4) Flavour + MSG: ‐ 0.8 (3.3) MSG: ‐ 0.7 (3.6) | 0.1 (3.8) | NR |
| Mathey 2001b | Mean (SD) change weight (kg) | 67 | 1.1 (1.3) | ‐0.3 (1.6) | < 0.05 |
| BMI: body mass index; CI: confidence interval; MSG: monosodium glutamate; MUAC: mid‐upper arm circumference; NR: not reported; NS: not significant; SD: standard deviation | |||||
| Outcome | (N) | Results | P Value | ||
| Intervention | Control | ||||
| Mortality | |||||
| Fortification of food (studies in hospital) | |||||
| Munk 2014 | Mortality | 81 | 1/44 | 1/40 | NR |
| Fortification of food (studies in residential care homes) | |||||
| Leslie 2012 | Mortality | 32 | 2/19 | 5/22 | NR |
| Smolliner 2008 | Mortality | 65 | 2/31 | 1/34 | NR |
| Modifications to meal composition (studies in intermediate care) | |||||
| Bouillane 2013 | Mortality | 66 | 1/30 (3%) | 1/36 (3%) | NR |
| Length of hospital stay | |||||
| Fortification of food (studies in hospital) | |||||
| Munk 2014 | Days from study inclusion to discharge | 81 | 10 (8) | 10 (8) | 0.73 |
| Handgrip strength | |||||
| Fortification of food (studies in hospital) | |||||
| Munk 2014 | Mean change (SD) baseline to day 3 (kg) | 76 | ‐0.1 (2.9) | ‐0.4 (4.3) | 0.76 |
| Mean difference (95% CI) between I & C | ‐0.3 (‐1.9 to ‐1.4) | 0.95 | |||
| Fortification of food (studies in residential care homes) | |||||
| Smolliner 2008 | Mean change (SD) (kg) | 61 | ‐0.81 (3.12) | ‐1.29 (3) | NR |
| Modifications to meal composition (studies in intermediate care) | |||||
| Bouillane 2013 | Mean change (SD) (N) | 63 | ‐0.5 (41.7) | 14 (45.1) | 0.411 (ANCOVA 0.271) |
| Bouillane 2013 | Change in ADL score (mean (SD) | 63 | ‐0.02 (1.6) | 0.54 (1.7) | 0.125 (ANCOVA 0.118) |
| ADL: activities of daily living; ANCOVA: analysis of covariance; N: Newtons; NR: not reported; SD: standard deviation I: intervention; C: control | |||||
| Outcome | (N) | Results | P Value | ||
| Intervention | Control | ||||
| Supplementation with food (residential care homes) | |||||
| Beck 2002 | Change in energy intake (kcal/d) (median 95% CI) | 16 | ‐24 (‐454 to 860) | 24 (‐167 to 478) | NS |
| Simmons 2008 | Change in energy intake kcal/ (mean SD) | 64 | 302 (450) | 127 (360) | Baseline to 6 months I: = 0.000; C: NS |
| Simmons 2010 | Change in energy intake (mean SD) | 43 | ‐65 (450) | 67 (360) | NS |
| Supplementation with ONS (in hospital) (reported as mean (SD) | |||||
| Bourdel‐Marchasson 2000 | Total energy intake (kcal/d) | 672 | 1188 (613) | 1102 (503) | 0.13 |
| Faxen‐Irving 2011 | Change in energy intake (kcal/d) | 38 | 94 (350) | 6.5 (358) | NR |
| Potter 2001 | Total energy intake (kcal/d) | 381 | 1409 (448) | 1090 (417) | S |
| Van den Berg 2015 | Mean (SD) energy intake from ONS (kcal/d) | 192 | I1:343 (172)* I2: 469 (111)** | 389 (162) | *0.289 **0.006 |
| Supplementation with ONS (long‐term/residential care settings) | |||||
| Hankey 1993 | Total energy intake (kcal/d) | 21 | 1747 (273) | 1147 (310) | Baseline to wk 8, I: 0.01; C: NS |
| Simmons 2010 | Change in energy intake | 42 | 28 (450) | 67 (360) | 0.14 |
| C: control; CI: confidence interval; I: intervention; NS: not significant; NR: not reported; ONS: oral nutritional supplement; S: significant; SD: standard deviation; wk: week | |||||
| Outcome | (N) | Results | P Value | ||
| Intervention | Control | ||||
| Incidence of pressure ulcers | |||||
| Supplementation with ONS (in hospital) | |||||
| Bourdel‐Marchasson 2000 | Cumulative incidence at end of follow‐up (%) Number of participants with pressure ulcers at day 15 | 672 | 40 101/295 | 48 164/37 | NR NR |
| Dennis 2005 | Number of participants with pressure ulcers | 4023 | 15/2016 | 26/2007 | 0.0507 |
| Total complications | |||||
| Supplementation with ONS (in hospital) | |||||
| Dennis 2005 | All in‐hospital complications | 4023 | 515/2014 (26%) | 448/2001 (22%) | NR |
| Health‐related quality of life | |||||
| Supplementation with ONS (in hospital) | |||||
| Dennis 2005 | Utilitiy (median (IQR)) (EUROQoL) | 3086 | Median group difference 0.52 (0.03 to 0.74) | 0.96 | |
| EUROQol: European Quality of Life Scale; IQR: interquartile range; NR: not reported; ONS: oral nutritional supplement | |||||
| Outcome | (N) | Results | P Value | ||
| Intervention | Control | ||||
| Supplementation with food (residential care homes) | |||||
| Beck 2002 | Change in weight (median 95% CI) | 16 | 1.3 (‐1 to 3) | 1.5 (‐2.3 to 9) | NS |
| Simmonds 2008 | Mean change (SD) weight (kg) Mean (SD) change in BMI | 64 | The intervention group gained 4 lbs more The intervention group gained 0.72 kg/m2 than the usual care | NR NR | 0.009 0.009 |
| Simmonds 2010 | Mean change (SD) weight (kg) | 43 | 0.02 (1.1) | 0.21 (1.7) | NS |
| Supplementation with ONS (in hospital) | |||||
| Faxen‐Irving 2011 | Mean change (SD) weight (kg) Mean (SD) BMI at follow‐up (kg/m2) | 38 38 | 0.13 (2.2) 20.4 (3.7) | ‐0.95 (2.3) 20.4 (3.7) 21.9 (3.8) | NR 0.17 |
| Potter 2001 | Mean change in weight (kg) Mean change (SD) MAC (cm) | 381 381 | 0.4 (2.6) ‐0.1 (1.3) | ‐0.5 (2.9) ‐0.4 (1.2) | 0.003 NS |
| Supplementation with ONS (long‐term care settings) | |||||
| Hankey 1993 | Mean change (SD) weight (kg) Mean change (SD) MAC | 21 21 | 2.83 (10) ‐1 (10) | ‐0.53 (10) 0.6 (10) | NR ‐ data from Milne 2009 NR data from Milne 2009 |
| Simmons 2010 | Mean change in weight (kg) | 42 | 0.91 (2.3) | 0.24 (1.96) | NS |
| BMI: body mass index; CI: confidence interval; MAC: mid‐arm circumference; NR: not reported; NS: not significant; ONS: oral nutritional supplement; SD: standard deviation | |||||
| Outcome | (N) | Results | P Value | ||
| Intervention | Control | ||||
| Mortality | |||||
| Supplementation with ONS (in hospital) | |||||
| Bourdel‐Marchasson 2000 | Mortality | 672 | 25/295 (8%) | 22/377 (6%) | 0.18 |
| Dennis 2005 | Mortality | 4023 | 241/2016 (12%) | 253/2007 (13%) | 0.7 |
| Potter 2001 | Mortality | 381 | 21/186 (11%) | 33/195 (17%) | 0.117 |
| Supplementation with ONS (long‐term care settings) | |||||
| Larsson 1990 | Mortality | 435 | 29/197 (15%) | 56/238 (24%) | 0.13 |
| Length of stay | |||||
| Supplementation with ONS (in hospital) | |||||
| Faxen‐Irving 2011 | Length of hospital stay (days) | 51 | 10.5 (SD 5.6) | 10.3 (SD 4.9) | NS |
| Dennis 2005 | Length of hospital stay (days) Median (IQR) | 4023 | 16 (IQR 7–44) | 16 (IQR 7–41) | NS |
| Potter 2001 | Length of hospital stay (median (range)) | 381 | 16 (3‐141) | 18 (2‐76) | 0.31 |
| Van den Berg 2015 | Length of hospital stay (median (range)) | 234 | I1: 10 (3‐63) I2: 10 (3‐27) | 11 (4‐71) | NR |
| Hospital readmissions & discharge destination | |||||
| Supplementation with ONS (in‐hospital) | |||||
| Potter 2001 | Discharge to home Discharge to institution | 381 381 | 131/186 31/186 | 127/195 33/195 | NS |
| Van den Berg 2015 | Hospital readmissions | 246 | I1: 13 I2: 24 | 15 | NR |
| IQR: interquartile range; NR not reported; NS: not significant; ONS: oral nutritional supplement | |||||
| Outcome | (N) | Results | P Value | ||
| Intervention | Control | ||||
| Weight change | |||||
| Kretser 2003 | Mean change in weight (kg) | 163 | 1.86 (5.3) | ‐1,04 (5.2) | 0.0062 |
| Mortality | |||||
| Kretser 2003 | Mortality | 203 | 3/102 (3%) | 9/101 (9%) | NR |
| NR: not reported | |||||
| Outcome or subgroup title | No. of studies | No. of participants | Statistical method | Effect size |
| 1 No. of participants with complications Show forest plot | 5 | 4702 | Risk Ratio (M‐H, Random, 95% CI) | 1.11 [0.86, 1.42] |
| 1.1 Changes to the organisation of nutritional care | 3 | 624 | Risk Ratio (M‐H, Random, 95% CI) | 1.12 [0.76, 1.67] |
| 1.2 Modification of meal profile or pattern | 1 | 63 | Risk Ratio (M‐H, Random, 95% CI) | 0.59 [0.06, 6.14] |
| 1.3 Additional supplementation of meals | 1 | 4015 | Risk Ratio (M‐H, Random, 95% CI) | 1.14 [1.02, 1.28] |
| 2 Nutritional status (weight change) Show forest plot | 17 | 2024 | Mean Difference (IV, Random, 95% CI) | 0.62 [0.21, 1.02] |
| 2.1 Changes to the organisation of nutritional care | 6 | 1140 | Mean Difference (IV, Random, 95% CI) | 0.09 [‐0.26, 0.45] |
| 2.2 Changes to the feeding environment | 1 | 39 | Mean Difference (IV, Random, 95% CI) | ‐0.43 [‐2.11, 1.25] |
| 2.3 Modification of meal profile or pattern | 5 | 253 | Mean Difference (IV, Random, 95% CI) | 1.16 [0.41, 1.92] |
| 2.4 Additional supplementation of meals | 4 | 475 | Mean Difference (IV, Random, 95% CI) | 0.90 [0.41, 1.38] |
| 2.5 Congregate and home meal delivery systems | 1 | 117 | Mean Difference (IV, Random, 95% CI) | 2.90 [1.00, 4.80] |
| 3 Hospitalisation Show forest plot | 5 | 667 | Mean Difference (IV, Random, 95% CI) | ‐0.48 [‐2.56, 1.59] |
| 3.1 Changes to the organisation of nutritional care | 3 | 515 | Mean Difference (IV, Random, 95% CI) | ‐2.08 [‐6.75, 2.58] |
| 3.2 Modification of meal profile or pattern | 1 | 81 | Mean Difference (IV, Random, 95% CI) | 0.0 [‐3.48, 3.48] |
| 3.3 Additional supplementation of meals | 1 | 71 | Mean Difference (IV, Random, 95% CI) | 0.20 [‐2.26, 2.66] |
| 4 All‐cause mortality Show forest plot | 12 | 6683 | Risk Ratio (M‐H, Random, 95% CI) | 0.78 [0.66, 0.92] |
| 4.1 Changes to the organisation of nutritional care | 4 | 1237 | Risk Ratio (M‐H, Random, 95% CI) | 0.71 [0.52, 0.97] |
| 4.2 Changes to the feeding environment | 1 | 20 | Risk Ratio (M‐H, Random, 95% CI) | 3.00 [0.14, 65.90] |
| 4.3 Modification of meal profile or pattern | 2 | 150 | Risk Ratio (M‐H, Random, 95% CI) | 1.04 [0.15, 7.22] |
| 4.4 Additional supplementation of meals | 4 | 5073 | Risk Ratio (M‐H, Random, 95% CI) | 0.77 [0.58, 1.02] |
| 4.5 Congregate and home meal delivery systems | 1 | 203 | Risk Ratio (M‐H, Random, 95% CI) | 0.33 [0.09, 1.18] |