Intervenciones de apoyo para la mejoría de la ingesta de alimentos en adultos con desnutrición o en riesgo nutricional
Resumen
Antecedentes
Las intervenciones de apoyo, como servir las comidas en el comedor o el uso de ayudantes para alimentar a los pacientes, se recomiendan con frecuencia para el tratamiento de grupos nutricionalmente vulnerables. Dichas intervenciones están incluidas en muchos documentos sobre políticas y normativos y tienen implicaciones relacionadas con el tiempo del personal ya que pueden dar lugar a costos adicionales, aunque parece haber una falta de pruebas de su eficacia.
Objetivos
Evaluar los efectos de las intervenciones de apoyo para la mejoría de la ingesta de alimentos en adultos con desnutrición o en riesgo nutricional.
Métodos de búsqueda
Se identificaron publicaciones a partir de búsquedas exhaustivas en las bases de datos Cochrane Library, MEDLINE, Embase, AMED, British Nursing Index, CINAHL, SCOPUS, ISI Web of Science, el escrutinio de las listas de referencias de los ensayos incluidos y las revisiones sistemáticas relacionadas, y la búsqueda manual de los resúmenes de los congresos relevantes. La fecha de la última búsqueda en todas las bases de datos fue el 31 de marzo de 2013. Se hicieron búsquedas adicionales en CENTRAL, MEDLINE, ClinicalTrials.gov y en WHO ICTRP hasta septiembre 2016. La fecha de la última búsqueda en estas bases de datos fue el 14 de septiembre 2016.
Criterios de selección
Ensayos controlados aleatorios de intervenciones de apoyo proporcionadas con la intención de mejorar la ingesta de alimentos en adultos nutricionalmente vulnerables en comparación con atención habitual.
Obtención y análisis de los datos
Tres autores de la revisión y para la búsqueda final, el editor, seleccionaron los ensayos a partir de los títulos y resúmenes y, de forma independiente, evaluaron la elegibilidad de los ensayos seleccionados. Dos revisores de forma independiente extrajeron los datos y evaluaron el riesgo de sesgo además de evaluar la calidad general de las pruebas mediante el instrumento GRADE, y luego acordaron cómo introducir los datos en la revisión. La probabilidad de heterogeneidad clínica entre los ensayos se consideró alta ya que los ensayos se realizaron en poblaciones con antecedentes clínicos muy diferentes, en contextos de atención sanitaria diferentes y, a pesar de algún agrupamiento de intervenciones similares, incluyeron intervenciones que variaron de manera considerable. Por lo tanto, sólo fue posible realizar metanálisis de las medidas de resultado "mortalidad por todas las causas", "hospitalización" y "estado nutricional (cambio en el peso)".
Resultados principales
Cumplieron los criterios de inclusión 41 ensayos (10 681 participantes). Los ensayos se agruparon según la similitud de las intervenciones (cambios en la organización de la atención nutricional (N = 13; 3456 participantes), cambios en el contexto de alimentación (N = 5; 351 participantes), modificación del perfil o el patrón de las comidas (N = 12; 649 participantes), administración adicional de suplementos a las comidas (N = 10; 6022 participantes) y sistemas de entrega de comidas a domicilio (N = 1; 203 participantes). El seguimiento varió desde "duración de la estancia hospitalaria" hasta 12 meses.
La calidad general de las pruebas fue moderada a muy baja, ya que la mayoría de los ensayos se consideraron con riesgo incierto de sesgo en varios dominios del riesgo de sesgo. El cociente de riesgos (CR) de la mortalidad por todas las causas fue 0,78 (intervalo de confianza [IC] del 95%: 0,66 a 0,92); P = 0,004; 12 ensayos; 6683 participantes; pruebas de calidad moderada. Lo anterior se traduce en 26 casos menos (IC 95%: 9 a 41) de muertes por 1000 participantes a favor de las intervenciones de apoyo. El CR del número de participantes con cualquier complicación médica varió de 1,42 a favor del control en comparación con 0,59 a favor de las intervenciones de apoyo (pruebas de muy baja calidad). Sólo cinco ensayos (4451 participantes) investigaron la calidad de vida relacionada con la salud y no mostraron diferencias significativas entre los grupos de intervención y de comparación. La información sobre la satisfacción del paciente fue poco fiable. Los efectos de las intervenciones de apoyo versus los comparadores sobre la hospitalización mostraron una diferencia de medias (DM) de ‐0,5 días (IC del 95%: ‐2,6 a 1,6); P = 0,65; cinco ensayos; 667 participantes; pruebas de muy baja calidad. Sólo tres de los 41 ensayos incluidos (4108 participantes; pruebas de muy baja calidad). informaron los eventos adversos y describieron la intolerancia al suplemento (diarrea, vómitos; 5/34 participantes) y la interrupción de los suplementos nutricionales orales debido a rechazo o aversión al sabor (567/2017 participantes). El metanálisis de los 17 ensayos con datos adecuados sobre el cambio en el peso mostró una mejoría general en el peso a favor de las intervenciones de apoyo versus el control: DM 0,6 kg (IC del 95%: 0,21 a 1,02); 2024 participantes; pruebas de calidad moderada. Un total de 27 ensayos investigaron la ingesta nutricional y la mayoría no encontró diferencias pronunciadas en el aporte calórico entre los grupos de intervención y de comparación. Sólo tres ensayos (1152 participantes) informaron algunos datos sobre los costos económicos, pero no utilizaron métodos económicos de salud aceptados (pruebas de muy baja calidad).
Conclusiones de los autores
Hay pruebas de calidad moderada a muy baja que indican que las intervenciones de apoyo para mejorar la atención nutricional dan lugar a un aumento mínimo de peso. La mayoría de las pruebas de un menor riesgo de mortalidad por todas las causas para las intervenciones de apoyo provienen de ensayos realizados en hospitales y se necesitan más estudios de investigación para confirmar este efecto. Hay pruebas de muy baja calidad con respecto a los efectos adversos; por lo tanto, aunque algunas de estas intervenciones se recomiendan a nivel nacional los médicos deben reconocer la falta de pruebas claras para apoyar su función. Esta revisión destaca la importancia de evaluar resultados importantes para los pacientes en los estudios de investigación futuros.
PICO
Resumen en términos sencillos
Intervenciones de apoyo para mejorar la ingesta de alimentos en grupos nutricionalmente vulnerables
Pregunta de la revisión
¿Son efectivas las intervenciones de apoyo para mejorar la ingesta de alimentos en grupos nutricionalmente vulnerables (pacientes con desnutrición o en riesgo nutricional)?
Antecedentes
Las comidas servidas en el comedor o el uso de ayudas para apoyar la alimentación de los pacientes necesitados, así como otros métodos similares, se recomiendan a menudo para ayudar especialmente a los pacientes enfermos y de edad avanzada que han perdido o tienen la probabilidad de perder peso (grupos nutricionalmente vulnerables). Dichas intervenciones de apoyo se implementan en la atención sanitaria en muchos países pero sus efectos no se han investigado bien.
Características de los estudios
Se encontraron 41 ensayos controlados aleatorios (estudios clínicos en los que los participantes se asignan al azar a uno de dos o más grupos de tratamiento) con un total de 10 681 participantes. Hubo cinco intervenciones diferentes que se denominaron "intervenciones de apoyo": cambios en la organización de la atención nutricional (13 estudios, 3456 pacientes), cambios en el contexto de alimentación (cinco estudios, 351 pacientes), modificación del perfil o el patrón de las comidas (12 estudios, 649 pacientes), administración adicional de suplementos a las comidas (diez estudios, 6022 pacientes) y sistemas de entrega de comidas a domicilio (un estudio, 203 pacientes). La monitorización de los participantes con el transcurso del tiempo (seguimiento) varió desde "duración de la estancia hospitalaria" hasta 12 meses. Los grupos de comparación recibieron la atención "habitual". Más de la mitad de todos los participantes participaron en estudios que investigaron la administración adicional de suplementos a las comidas (por ejemplo, un suplemento nutricional oral calórico proteico además de la dieta habitual).
Resultados clave
Es posible que las intervenciones de apoyo para la mejoría de la ingesta de alimentos en los grupos nutricionalmente vulnerables reduzcan la muerte por cualquier causa (aproximadamente 23 casos menos de muerte por 1000 participantes a favor de las intervenciones de apoyo). Sin embargo, este supuesto se debe confirmar mediante más pruebas de estudios controlados aleatorios de alta calidad. El número de participantes que presentaron cualquier complicación médica no difirió de manera significativa entre los grupos de intervenciones de apoyo y de comparación. El mismo resultado se encontró para la calidad de vida relacionada con la salud (es decir, la salud física, mental, emocional y social atribuida a la salud), la satisfacción del paciente, el aporte nutricional o calórico y los días de estancia hospitalaria. Los costos económicos no se investigaron bien.
Sólo tres estudios informaron sobre los efectos secundarios y describieron la intolerancia al suplemento nutricional (como diarrea o vómitos en cinco de 34 participantes) y la interrupción de los suplementos nutricionales orales debido a rechazo o a aversión al sabor (567 de 2017 participantes).
Después de analizar 15 estudios con 1945 participantes se encontró un efecto beneficioso de las intervenciones de apoyo en comparación con los comparadores sobre el peso: como promedio los pacientes en los grupos de intervenciones de apoyo aumentaron el peso 0,6 kg más que los pacientes en los grupos de comparación.
Estas pruebas están actualizadas hasta septiembre 2016.
Calidad de la evidencia
La calidad general de las pruebas varió entre moderada a muy baja, principalmente porque en la mayoría de los resultados se contó sólo con un número pequeño de estudios y participantes para lograr información fidedigna, o porque el riesgo de sesgo hizo que los resultados fueran inciertos. Sin embargo, si se realizaran algunos estudios controlados aleatorios con bajo riesgo de sesgo en resultados importantes para los pacientes y un buen número de participantes, esta revisión podría proporcionar rápidamente una buena orientación para una mejor asistencia sanitaria.
Conclusiones de los autores
Summary of findings
| Supportive interventions compared with usual care for malnourished or nutritionally at‐risk adults | ||||||
| Population: malnourished or nutritionally at‐risk adults | ||||||
| Outcomes | Illustrative comparative risks* (95% CI) | Relative effect | No of participants | Quality of the evidence | Comments | |
| Usual care | Supportive interventions | |||||
| All‐cause mortality | 133 per 1000 | 107 per 1000 (92 to 124) | RR 0.78 | 6683 (12) | ⊕⊕⊕⊝ | ‐ |
| Morbidity/complications (number of participants with any medical complication) Follow‐up: duration of hospital stay to 6 months | See comment | See comment | See comment | 4015 (5) | ⊕⊝⊝⊝ | No summary effect size calculated because of high inconsistency; RR ranged from 0.59 in favour of supportive interventions to 1.42 in favour of usual care |
| Health‐related quality of life and patient satisfaction Follow‐up: duration of hospital stay to 12 months | See comment | See comment | See comment | 4451 (5) | ⊕⊕⊝⊝ | 5/41 trials investigated health‐related quality of life using different instruments in participants from a wide range of different clinical backgrounds; overall we noted no substantial differences between intervention and comparator groups 2/41 trials investigated patient satisfaction by means of an unvalidated questionnaire |
| Hospitalisation and institutionalisation (days) | The mean hospitalisation ranged across control groups from 10 days to 40 days | The mean hospitalisation in the intervention groups was | ‐ | 667 (5) | ⊕⊝⊝⊝ | 3/5 trials with data on hospitalisation were in the group of trials of 'Changes to the organisation of nutritional care' |
| Adverse events Follow‐up: 8 days to 6 months | See comment | See comment | See comment | 4108 (3) | ⊕⊝⊝⊝ | Only 3/41 trials reported on adverse events (all evaluating the impact of supplementation of meals with oral nutritional supplements); 1 trial reported intolerance to the supplement (diarrhoea, vomiting) in 3/34 (15%) of participants. In another large trial 565/2017 (28%) of stroke patients stopped taking the oral nutritional supplements because of refusal or dislike of taste |
| Nutritional status (weight change in kg) | The mean weight change ranged across control groups from ‐3.0 kg to +0.3 kg | The mean weight change in the intervention groups was +0.6 kg higher (0.2 kg to 1.0 kg higher) | ‐ | 2024 (17) | ⊕⊕⊕⊝ | ‐ |
| Economic costs Follow‐up: duration of hospital stay to 12 months | See comment | See comment | See comment | 1152 (3) | ⊕⊝⊝⊝ | 3/41 trials evaluated and 2/41 trials reported some data on economic costs; none of the trials used accepted health economic methods and the reported data on both costs and effectiveness were generally poor |
| *The basis for the assumed risk (e.g. the median control group risk across trials) is provided in footnotes. The corresponding risk (and its 95% confidence interval) is based on the assumed risk in the comparison group and the relative effect of the intervention (and its 95% CI). | ||||||
| GRADE Working Group grades of evidence | ||||||
| *aAssumed risk was derived from the event rates in the comparator groups (usual care) aDowngraded by one level because of risk of bias in several risk of bias domains | ||||||
Antecedentes
La desnutrición de los pacientes ingresados en el hospital se reconoció por primera vez en los años setenta (Butterworth 1974 ; McWhirter 1994). En años recientes también se ha informado la desnutrición en la comunidad (Elia 2009). Ya sea en el hospital o en la comunidad, la desnutrición se asocia con un resultado clínico deficiente, una disminución en la calidad de vida relacionada con la salud y un aumento en la mortalidad (Kubrak 2007; Norman 2008; Stratton 2003).
La desnutrición es causa y consecuencia de una salud deficiente (Lean 2008) y tiene una etiología compleja. Predispone a la enfermedad, pero también es una consecuencia de la enfermedad (NCCAC 2006), lo que crea un ciclo vicioso autoperpetuado de desnutrición e infección (Scrimshaw 2003). Los pacientes que presentan desnutrición al ingreso al hospital y que no reciben una atención nutricional adecuada, presentan una disminución en el estado nutricional (McWhirter 1994). Mientras están en el hospital, las causas de las ingestas adicionales deficientes y de la pérdida de peso subsiguiente pueden incluir la inanición temporal por procedimientos médicos, la dificultad para la alimentación, la falta de supervisión del personal de enfermería durante las horas de comida, la depresión, los alimentos con sabor desagradable y la anorexia inducida por la enfermedad o los fármacos (Kelly 2000; Lennard‐Jones 1992). En el domicilio, además de los efectos de la enfermedad y el tratamiento, el estado nutricional subóptimo se puede deber a desafíos prácticos como la falta de transporte, las dificultades para la compra de productos alimenticios o las dificultades para utilizar las instalaciones para cocinar, lo que da lugar a dietas con una calidad nutricional deficiente. Los aspectos sociales y psicológicos también tienen una repercusión significativa. Los factores que contribuyen a la desnutrición de los pacientes en el hospital y en la comunidad se han descrito ampliamente en (Lennard‐Jones 1992; NCCAC 2006).
La intervención nutricional y el tratamiento de la desnutrición se han recomendado en las guías clínicas de muchos países sobre la base de las asociaciones entre una mejor ingesta de alimentos y el estado nutricional, la calidad de vida relacionada con la salud y los resultados funcionales (Mueller 2011; NCCAC 2006). Por lo tanto, se recomienda que al primer signo de desnutrición o riesgo de desnutrición, le deben seguir una evaluación nutricional completa y una intervención nutricional apropiada (Mueller 2011; NCCAC 2006). Como las causas de la desnutrición son multifactoriales, es probable que las intervenciones diseñadas para tratar la desnutrición sean complejas. Lo anterior merece la comprensión de las causas multidimensionales de la desnutrición y las estrategias complejas de apoyo necesarias a través de un rango de servicios de atención sanitaria desde el nivel de políticas estratégicas hasta la alimentación individual de un paciente (Weekes 2009).
Descripción de la afección
A pesar de la falta de criterios diagnósticos universalmente aceptados, una definición muy citada describe la desnutrición como el estado nutricional en el que una deficiencia, un exceso o un desequilibrio calórico, proteico o nutricional, provoca efectos adversos sobre la constitución (forma, tamaño y composición corporal) y la función del cuerpo o los tejidos, así como sobre los resultados clínicos (Elia 2003). El International Guideline Consensus Committee recientemente convocado clasificó la desnutrición como, la "desnutrición relacionada con inanición" en los casos de inanición crónica sin inflamación, la "desnutrición relacionada con enfermedades crónicas" dónde existe una inflamación crónica pero leve a moderada y, "desnutrición relacionada con enfermedades agudas o lesiones" cuando existe inflamación aguda grave (Jensen 2010). Aunque proporciona una clasificación etiológica útil de la desnutrición y reconoce el efecto de la enfermedad sobre el estado nutricional, aún no existe un criterio claro sobre cómo se puede identificar cada categoría en la práctica. El cribado nutricional se utiliza a menudo para detectar factores de riesgo que se sabe se asocian con complicaciones nutricionales (McMahon 2000) como la pérdida de peso no intencional reciente; el consumo insuficiente de alimentos; la anorexia relacionada con enfermedad; el peso corporal bajo, el índice de masa corporal (IMC) o la masa corporal magra; para decidir si se indica una evaluación nutricional completa (Elia 2003). Las herramientas de cribado nutricional habitualmente emplean una proforma estándar para determinar el riesgo nutricional. Los parámetros incluidos tienen como objetivo determinar si un individuo está en riesgo nutricional sobre la base de una puntuación, lo que determina el curso de acción (Green 2006; Jones 2002). Muchas herramientas indican planes de acción apropiados que pueden incluir la intervención nutricional. La evaluación nutricional es una investigación más integral que incluye mediciones antropométricas, pruebas bioquímicas, el examen clínico y la monitorización de la ingesta de alimentos, usadas para determinar si un individuo presenta desnutrición o probabilidad de desnutrición (en riesgo de desnutrición) (Corish 2000a; McMahon 2000). La evaluación nutricional generalmente está seguida de la intervención nutricional apropiada (Corish 2000a; McMahon 2000).
La falta de criterios claros y universalmente aceptados para el diagnóstico de la desnutrición complica aún más la interpretación de los datos de prevalencia y los ensayos de intervención. Los ensayos clásicos principales y más recientes que evaluaron la prevalencia de la desnutrición en los hospitales han calculado una prevalencia entre el 11% y el 50% según los criterios utilizados (Bistrian 1974; Corish 2000a; Corish 2000b; Edington 2000; Hill 1977; Kelly 2000; McWhirter 1994; Naber 1997). La variación en los informes de la prevalencia se originó mayoritariamente a partir de las diferencias en las definiciones utilizadas para identificar la desnutrición entre los ensayos. En 2008, la semana de cribado nutricional realizada por la British Association for Parenteral and Enteral Nutrition (BAPEN), que utilizó una herramienta estandarizada para evaluar el estado de riesgo nutricional, demostró que la desnutrición estuvo presente en casi un tercio de los pacientes que ingresaron al hospital, en un poco más de un tercio de los pacientes ingresados en residencias geriátricas y en un quinto de los pacientes ingresados en unidades de salud mental (Elia 2009). Además, se ha calculado que en cualquier momento determinado más de 3 000 000 de personas en el Reino Unido se piensa que presentan desnutrición o están en riesgo de desnutrición, y la gran mayoría (93%) vive en un domicilio (Elia 2009). En Australia, una encuesta que utilizó una herramienta diferente de cribado nutricional en 3122 participantes en el contexto de un hospital para enfermedades agudas, mostró que el 41% de los participantes estuvieron "en riesgo" de desnutrición, con una prevalencia general de desnutrición del 32% (Agarwal 2011).
Se cree que las consecuencias clínicas de la desnutrición incluyen reducción en la fuerza muscular; fallo de los sistemas respiratorio, termorregulador, pancreático, gastrointestinal, mental, endocrino y cardiovascular; así como un deterioro en la curación de las heridas y resultados clínicos deficientes de los procedimientos quirúrgicos o de las enfermedades (Allison 2000; Corish 2000a; Lennard‐Jones 1992). Las heridas que cicatrizan más lentamente se vuelven mucho más vulnerables a la infección. La función inmunitaria se deteriora, lo que agrava las limitaciones de otros estados de la enfermedad sobre el cuerpo y da lugar a una mayor reducción de la resistencia a la infección (Corish 2000a). La emaciación de los músculos respiratorios también puede predisponer a las infecciones si los pacientes no pueden toser y expectorar de forma eficaz (Lennard‐Jones 1992). Se pueden presentar úlceras por compresión cuando la movilidad se reduce (Lennard‐Jones 1992) y el cuerpo se torna más delgado y emaciado. Posiblemente, los efectos de la desnutrición sobre el sistema musculoesquelético se extienden más allá de la obtención o la pérdida de tejido corporal magro, pero pueden incurrir cambios metabólicos en los electrólitos celulares que incluyen la acumulación de calcio, lo que puede impedir la función muscular óptima (Jeejeebhoy 1986). Además, los sistemas excretores pueden no lograr regular eficientemente el equilibrio corporal de sodio‐agua, lo que puede dar lugar a la retención excesiva de líquido y a edema (Allison 2000), que se ha detectado supuestamente en el 17% de los pacientes con desnutrición ingresados en el hospital (Weekes 1999). Como la enfermedad incide de forma adicional en el apetito (Allison 2000), la desnutrición progresará y las implicaciones clínicas ya mencionadas ocurrirán mucho más rápidamente en las personas enfermas que en los individuos sanos (Corish 2000a).
Además de las consecuencias clínicas y sociales, la repercusión económica de la desnutrición es considerable. El aumento de los costos se ha convertido en una carga económica para los sistemas de atención sanitaria en muchos países. Datos recientes del Reino Unido indican que los costos de desnutrición han excedido las GBP 7 300 000 000 cada año (EURO 8 740 000 000/año ‐ conversión de diciembre de 2011) (DOH 2007; Russell 2007). Resultados clínicos deficientes como las estancias prolongadas en el hospital, el aumento en las complicaciones médicas, la reducción en la calidad de vida relacionada con la salud y el retraso en la recuperación de las enfermedades, contribuyeron a la elevación de los costos de la atención hospitalaria y domiciliaria (Gallagher 1996; Russell 2007; Stratton 2003). Los pacientes con desnutrición permanecen en el hospital por un tiempo más prolongado, tienen tres veces más probabilidades de desarrollar complicaciones durante la cirugía y tienen una mortalidad mayor que los pacientes con una nutrición adecuada (DOH 2007). Además, los pacientes considerados en riesgo de desnutrición tienen muchas más probabilidades de requerir servicios domiciliarios de atención sanitaria después del alta hospitalaria que los pacientes no considerados con riesgo (Chima 1997). La desnutrición en la comunidad también ha mostrado aumentar la necesidad de recursos sanitarios como las visitas de los médicos generales (MG), los ingresos hospitalarios y las nuevas prescripciones, además de contribuir con un aumento en el riesgo de mortalidad (Martyn 1998). Por lo tanto, si se considera la economía en la atención sanitaria, un paciente con desnutrición representa una mayor carga económica para los servicios sanitarios que un paciente cuyo estado nutricional está bien conservado (Lennard‐Jones 1992).
Descripción de la intervención
Esta revisión intenta determinar si el tratamiento clínico efectivo de la desnutrición en el ámbito hospitalario y en la comunidad requiere más que sólo la provisión de nutrientes, el asesoramiento dietético o una combinación de los anteriores, y si vale la pena considerar estrategias adicionales para apoyar estos enfoques existentes y asegurar una atención nutricional general óptima. Los tipos específicos de intervenciones consideradas se enumeran en la Tabla 1. Las intervenciones relacionadas incluyen el uso de suplementos nutricionales orales solos, la asesoría o las estrategias dietéticas, o una combinación, para tratar la desnutrición.
Existen guías para la identificación, la monitorización regular y el comienzo del apoyo nutricional en los individuos que pueden presentar desnutrición o estar en riesgo nutricional. Entre estas guías se incluyen las guías clínicas del Reino Unido para el cribado y el apoyo nutricional en adultos (NCCAC 2006), las referencias Essence of Care para la alimentación y la nutrición del Department of Health del Reino Unido (DOH 2003), y las guías de la American Society for Parenteral and Enteral Nutrition (ASPEN) para el cribado, la evaluación y la intervención nutricional en adultos (Mueller 2011).
Las estrategias utilizadas con mayor frecuencia para tratar la desnutrición en los individuos que requieren apoyo nutricional intentan aumentar la ingesta calórica y de nutrientes por medio de las siguientes intervenciones.
-
Asesoría dietética ‐ provisión de asesoría nutricional para aumentar la ingesta de nutrientes, que requiere que el individuo comprenda y actúe según determinadas instrucciones. Este enfoque puede incluir proporcionar asesoría sobre la fortificación de los alimentos, aumentar la densidad calórica de los alimentos sin aumentar la cantidad, o la fortificación dietética, para aumentar la densidad calórica de la dieta al agregar aperitivos o bebidas extra entre las comidas.
-
Suplementos nutricionales orales ‐ disponibles en formas líquidas o sólidas. Generalmente proporcionan una mezcla de macro y micronutrientes, pueden estar nutricionalmente completos en un volumen específico y suelen estar disponibles en forma de productos de suplementos comerciales.
-
Apoyo nutricional artificial ‐ incluye la alimentación enteral por sonda y la nutrición parenteral que se utilizan cuando no es posible la ingesta oral.
La eficacia de las intervenciones de apoyo nutricional ha sido el tema de muchos estudios de investigación anteriores, pero hasta el presente se ha centrado principalmente en la administración de suplementos nutricionales orales, lo que puede ser aplicable a sólo una minoría de los pacientes (Weekes 2009). Hay más de 20 revisiones sistemáticas en la bibliografía de las intervenciones nutricionales orales con suplementos para el tratamiento de la desnutrición (Stratton 2007). Los resultados son variables y algunas revisiones muestran efectos beneficiosos clínicos y nutricionales (Stratton 2007). Sin embargo, estos resultados no son consistentes y aún no se han caracterizado los grupos de pacientes con mayores probabilidades de beneficiarse de este tipo de intervención (Stratton 2007). A pesar de lo anterior, ha habido una tendencia consistente a utilizar suplementos nutricionales orales en la práctica clínica, pero las implicaciones de los costos elevados de este enfoque especialmente en la comunidad, como se señaló recientemente en un informe del Reino Unido (LPP 2009), hace que sea de valor considerar enfoques alternativos. Ha habido un mayor énfasis en la provisión habitual de alimentos y bebidas como parte de la atención nutricional desde que se publicaron las diez características clave de la buena atención nutricional en el hospital (COE 2003). Cuarenta y cinco ensayos han examinado la función de las intervenciones basadas en la alimentación con o sin suplementos nutricionales orales para el tratamiento de la ingesta deficiente de alimentos (Baldwin 2011). Los resultados indicaron que, aunque la asesoría dietética puede dar lugar a mejorías en el peso, la composición corporal y la función muscular, los ensayos fueron heterogéneos y de calidad variable, sin pruebas de un efecto beneficioso sobre la mortalidad (Baldwin 2011). Estos ensayos se han concentrado en intervenciones que dependen de que los pacientes reciban instrucciones y actúen según dichas instrucciones para mejorar su ingesta nutricional (es decir, asesoría dietética). A pesar del grupo de pruebas clínicas que apoyan el uso apropiado de los suplementos nutricionales orales y los estudios de investigación anteriores sobre la asesoría dietética, aún no se conoce si las intervenciones de apoyo adicionales son clínicamente efectivas para tratar la desnutrición o el riesgo de desnutrición.
El Council of Europe y el Department of Health del Reino Unido destacaron la importancia de la atención nutricional general que incluía, entre otras iniciativas de apoyo: el cribado nutricional obligatorio, la provisión adecuada de alimentos y bebidas, los suplementos orales, las dietas modificadas, la ayuda con la alimentación y los cambios en el contexto de alimentación (COE 2003; DOH 2007). Estas intervenciones se han incorporado en las guías y las políticas de atención sanitaria y se dirigen a mejorar la ingesta nutricional al modificar aspectos de la provisión de alimentos (p.ej. el uso de horarios de comida protegidos, las iniciativas de señales de alerta [para identificar los que requieren ayuda durante las horas de comida] y la ayuda para la alimentación), o al ajustar el tamaño de las porciones y el contenido nutricional de los alimentos y mejorar el sabor; sin embargo, hay falta de pruebas del efecto beneficioso de dichas iniciativas.
Efectos adversos de la intervención
Los posibles efectos adversos de las intervenciones de atención nutricional de apoyo consideradas en esta revisión pueden incluir, pero no se limitan a, los siguientes eventos: provisión de suplementos nutricionales incorrectos, provisión de aperitivos incorrectos entre las comidas, efectos gastrointestinales debido a la intolerancia a los suplementos/aperitivos adicionales/bebidas (p.ej. timpanismo abdominal, vómitos o diarreas), posibles accidentes que ocurren como resultado de la intervención como la caída del paciente en el camino hacia el área de comida en una intervención de cambio en el contexto de alimentación, la movilización y la manipulación inapropiadas por parte de personal no adiestrado que trata de obtener una medida de peso o talla, un cribado o una intervención inapropiados (p.ej. durante el final de la vida).
De qué manera podría funcionar la intervención
Como se recomienda en la declaración PRISMA (Liberati 2009), se ilustra un marco conceptual que destaca los participantes, las intervenciones, las comparaciones, los resultados y el diseño de los ensayos (PICOS) considerados en esta revisión (Figura 1).
El tratamiento de la desnutrición intenta revertir sus efectos, que incluyen deficiencias físicas y funcionales, y la provisión de atención nutricional apropiada puede incluir varios enfoques. Los factores que influyen sobre las experiencias con los alimentos son complejos y es posible que las intervenciones de atención nutricional dirigidas al tratamiento de la desnutrición o del riesgo nutricional necesiten abordar otros aspectos además de la provisión de energía (calorías). Las dimensiones biológicas y simbólicas de los alimentos son inseparables y una perspectiva socioantropológica indica una relación íntima, pero dinámica, entre el consumo de alimentos y las autopercepciones (Lupton 1996). El significado de los alimentos se extiende más allá de su mero valor nutricional ya que pueden tener una extraordinaria repercusión sobre el sentido de independencia, la autoestima, el bienestar y la calidad de vida relacionada con la salud de las personas, especialmente en los pacientes de edad avanzada (Donini 2003). De hecho, las experiencias con los alimentos tienen implicaciones importantes para el bienestar emocional y psicológico de un individuo que se sitúan dentro de un contexto de tradiciones, cultural, socioeconómico y religioso y determina al final las preferencias alimentarias (Donini 2003; Khan 1981; Lupton 1996). En la enfermedad grave, los mecanismos de afrontamiento, el sentido de la imagen corporal, el valor de las redes sociales y del apoyo, y el simbolismo personal pueden estar afectados y los alimentos pueden tomar un nuevo significado (McQuestion 2011). En general, lo anterior representa un reto para los profesionales sanitarios y merecen una comprensión más profunda de lo que realmente repercute en las experiencias con los alimentos. Si se considera lo anterior, las intervenciones que mejoran las experiencias alimentarias de los individuos con desnutrición o en riesgo de desnutrición al apoyar su capacidad para recibir la intervención y de esa manera mejorar el cumplimiento, teóricamente deben dar lugar a un incremento en la ingesta de alimentos y a mejores resultados. Además, los efectos beneficiosos de dichas intervenciones se pueden extender más allá de los resultados clínicos, nutricionales o funcionales convencionales y también es concebible que mejoren la satisfacción y la calidad de vida relacionada con la salud percibidas por el paciente. De hecho, después de las mejorías en la ingesta nutricional también puede haber efectos beneficiosos psicológicos y sociales en los individuos con desnutrición o en riesgo de desnutrición (NCCAC 2006). Para resumir el mecanismo de acción, las intervenciones de atención de apoyo nutricional teóricamente deben aumentar la ingesta de micro y macronutrientes y a su vez mejorar el estado nutricional y la función clínica de los individuos en riesgo nutricional. Por lo tanto, es de esperar que disminuyan la mortalidad, la morbilidad y la hospitalización. Si se consideran los efectos beneficiosos sobre la salud física y las dimensiones simbólicas de los alimentos, también debe mejorar la calidad de vida relacionada con la salud.
Por qué es importante realizar esta revisión
Una revisión sistemática Cochrane de la administración de suplementos proteicos y calóricos en individuos de más de 65 años en riesgo de desnutrición contiene 62 ensayos con 10 187 participantes asignados al azar y los autores concluyeron que la administración de suplementos dio lugar a un aumento de peso pequeño pero consistente en los pacientes de edad más avanzada, y a reducciones en la mortalidad en los pacientes con desnutrición (Milne 2009). No hubo pruebas de un efecto beneficioso en cuanto a las complicaciones, el estado funcional o la duración de la estancia hospitalaria (Milne 2009). Las intervenciones consideradas se centraron principalmente en la administración de suplementos dietéticos con los alimentos comerciales que se toman con absorbentes, los suplementos con leche y a través de la fortificación de las fuentes normales de alimentos (Milne 2009), en lugar de en la variedad de intervenciones de atención de apoyo nutricional de interés para la presente revisión. Además, la revisión incluyó ensayos aleatorios y cuasialeatorios (p.ej. asignación por alternancia, día de la semana, fecha de nacimiento) (Milne 2009). Se reconoce que la naturaleza compleja de las intervenciones en esta área puede dar lugar a que los ensayos carezcan de un diseño consistente y su inclusión puede representar mejor el grupo de pruebas disponibles. Sin embargo, puede ser más difícil establecer conclusiones significativas, por lo que esta revisión sistemática de ensayos controlados netamente aleatorios destacará mejor las necesidades de estudios de investigación y las brechas del conocimiento en esta área. Además, en esta revisión se consideró un rango mayor de intervenciones y de ensayos que incluyeron adultos de todas las edades.
Hay una necesidad urgente de identificar las estrategias efectivas de tratamiento para los pacientes con desnutrición en los hospitales y otros contextos de atención sanitaria y social. Lo anterior no se ha destacado solamente en los informes del Council of Europe (COE 2003) y del Department of Health del Reino Unido (DOH 2007), sino también por organismos profesionales como el Royal College of Nursing, la British Association for Parenteral and Enteral Nutrition (BAPEN) y organizaciones centradas en los pacientes como Age UK (BAPEN 2009; RCON 2008). Numerosas estrategias encaminadas a influir en el tratamiento nutricional y mejorar la provisión de atención nutricional en los hospitales, las residencias geriátricas y otros contextos de atención sanitaria y social, se han adoptado e incorporado en las políticas nacionales y las guías internacionales. Además, en el Reino Unido los horarios de comida protegidos y el uso de señales de alerta se han extendido muy recientemente dentro del National Health Service, y las intervenciones aplicables a varios contextos de asistencia sanitaria como el uso de ayuda para la alimentación, el ajuste del tamaño de las porciones y el contenido nutricional de los alimentos y la mejoría en el sabor de los alimentarios, se utilizan cada vez más. Estos avances en los servicios han recibido el apoyo generalizado de organizaciones locales y nacionales y del gobierno. Ha habido una tendencia consistente a recomendar la implementación de políticas diseñadas para influir en la atención nutricional y el contexto en el cual se proporciona la nutrición, sin una síntesis de las pruebas de los efectos beneficiosos o perjudiciales potenciales de estas intervenciones. De forma crucial, la incorporación de dichas iniciativas en la atención habitual tiene implicaciones para el personal y el financiamiento de la asistencia sanitaria, así como la posible necesidad de adiestramiento adicional en los servicios. Hasta el momento no se ha realizado una síntesis de las pruebas para apoyar los posibles efectos beneficiosos de su implementación. Además, se necesita un enfoque de equipo multidisciplinario de apoyo para la provisión de una atención nutricional adecuada (Jefferies 2011). Debido a la prevalencia generalizada de la desnutrición y con tantos pacientes en riesgo, la posible repercusión de esta revisión sistemática en cuanto a la información sobre el tratamiento nutricional de los pacientes es considerable y, por lo tanto, la necesidad de esta revisión fue muy importante.
Dos revisiones bibliográficas examinaron varias intervenciones de atención de apoyo nutricional (Silver 2009; Weekes 2009) pero ninguna fue sistemática y ambas presentaron una síntesis narrativa sin metanálisis. Además, la revisión realizada por Weekes y colegas (Weekes 2009) incluyó ensayos no aleatorios y sólo buscó en fuentes electrónicas, mientras que la revisión realizada por Silver (Silver 2009) sólo consideró ensayos con personas de edad avanzada. A pesar de su utilidad al presentar parte de la bibliografía disponible en esta área, aún no se conoce el verdadero efecto de las intervenciones de apoyo para mejorar la ingesta de alimentos al modificar el contenido nutricional de los alimentos servidos o los aspectos del sistema de servicio o del contexto de alimentación. Por lo tanto, esta revisión representa un primer intento sistemático de reunir las pruebas sobre la repercusión de las intervenciones de apoyo sobre resultados nutricionales, clínicos, económicos y centrados en el paciente.
Objetivos
Evaluar los efectos de las intervenciones de apoyo para la mejoría de la ingesta de alimentos en adultos con desnutrición o en riesgo nutricional.
Métodos
Criterios de inclusión de estudios para esta revisión
Tipos de estudios
Se incluyeron ensayos clínicos controlados con asignación aleatoria (ECA).
Tipos de participantes
Adultos (edad mayor de 18 años) con desnutrición, que se consideró estaban en riesgo nutricional o que de otra manera se beneficiarían potencialmente de una mejoría en la atención nutricional. Por lo tanto, la población se describe como nutricionalmente vulnerable.
Criterios diagnósticos (adultos con desnutrición o en riesgo nutricional)
El término desnutrición utilizado en esta revisión se refiere a una nutrición inadecuada por defecto, considerada como un estado nutricional deficiente como resultado de una ingesta insuficiente de nutrientes o de deterioro metabólico, así como el estado de aumento del riesgo nutricional y desnutrición inminente (Corish 2000a; Reilly 1995).
La Malnutrition Universal Screening Tool (MUST) publicada por BAPEN (Elia 2003), así como las guías clínicas del Reino Unido y de Europa publicadas por la European Society for Parenteral and Enteral Nutrition (ESPEN) (Volkert 2006) y el National Institute for Health and Care Excellence (NICE) (NCCAC 2006), permiten la identificación de los individuos con desnutrición y en riesgo de desnutrición en la práctica clínica y se pueden utilizar para clasificar a los participantes en los ensayos. Estos criterios son:
Con desnutrición
NICE (NCCAC 2006)
-
Índice de masa corporal (IMC) por debajo de 18,5 kg/m²
-
Pérdida de peso no intencional mayor del 10% en el transcurso de los últimos tres a seis meses
-
IMC por debajo de 20 kg/m² y pérdida de peso no intencional mayor del 5% en el transcurso de los últimos tres a seis meses
ESPEN (Volkert 2006)
-
Pérdida de peso no intencional del 5% en los últimos tres meses e IMC por debajo de 20 kg/m²
-
Pérdida de peso no intencional del 10% en los últimos seis meses e IMC por debajo de 20 kg/m²
En riesgo de desnutrición
NICE (NCCAC 2006)
-
Haber comido poco o nada durante más de cinco días, tener probabilidades de comer poco o nada durante los próximos cinco días o más, o ambos
-
Tener una capacidad de absorción deficiente, tener pérdidas nutricionales altas, haber aumentado las necesidades nutricionales por causas como catabolismo, o una combinación
ESPEN (Volkert 2006)
-
Pérdida del apetito
-
Reducción de la ingesta de alimentos
-
Estrés físico o psicológico
MUST (Elia 2003)
-
Enfermedad aguda actual más ninguna (o probablemente ninguna) ingesta nutricional por más de cinco días
A falta de criterios de diagnóstico claros internacionalmente aceptados para la desnutrición clínica, en muchos casos la decisión de un profesional sanitario de iniciar la derivación dietética para evaluación nutricional o la decisión de un médico de comenzar la intervención nutricional se basan en criterios subjetivos y en el juicio clínico (McCarron 2010). Por lo tanto, se supuso que el investigador consideró que los participantes reclutados en los ensayos de intervención presentaban desnutrición o riesgo de desnutrición, o que por otra parte tenían la posibilidad de beneficiarse de una mejor atención nutricional según sus antecedentes clínicos o la edad.
Tipos de intervenciones
Intervención
Intervenciones que intentaron mejorar el consumo de alimentos al mejorar la propia comida (p.ej. fortificación de los alimentos), los aspectos del contexto de las horas de comida (p.ej. perfeccionamiento del contexto de alimentación), los aspectos de la provisión de las comidas, la administración adicional de suplementos a las comidas o las estrategias de apoyo indirectas (p.ej. adiestramiento del personal o los cuidadores). Las estrategias previstas antes de la búsqueda incluyeron los ejemplos enumerados dentro de las cinco categorías mostradas en la Tabla 1. Sin embargo, se reconoce que puede hacerse necesario crear categorías adicionales según sea necesario después de la búsqueda.
Una revisión sistemática anterior (Baldwin 2011) incluyó ensayos de intervenciones basadas en la asesoría dietética que exigió que el paciente recibiera instrucciones sobre la modificación de los alimentos, suplementos nutricionales orales o ambos y tuviera la capacidad y la voluntad de actuar según las instrucciones para mejorar su ingesta nutricional. Aunque esta revisión se relaciona estrechamente con la revisión anterior, se planificó excluir los ensayos en los que la asesoría dietética o los suplementos nutricionales orales, o ambos, se ofrecieron de manera individualizada. Esta revisión sólo consideró las intervenciones sobre los alimentos o los suplementos nutricionales orales cuando se proporcionaron según una intervención dirigida por una institución sin que el paciente necesitara comprender y actuar según instrucciones para tomar los ítems adicionales (p.ej. ofrecerles de manera habitual aperitivos o suplementos a personas de edad avanzada frágiles en un contexto institucional, o el uso de las estructuras institucionales para apoyar la administración de suplementos nutricionales orales). Se observa una superposición inevitable con las revisiones de suplementos nutricionales orales en la atención de la desnutrición, pero la inclusión de dichos ensayos en esta revisión contribuye a una comprensión más precisa de los efectos beneficiosos que se derivan de estos productos.
Comparador
Todas las intervenciones se compararon con la atención habitual.
Resumen de los criterios de exclusión específicos
Se excluyeron los siguientes ensayos de intervención de esta revisión.
-
Ensayos en niños, embarazadas, pacientes con trastornos en los hábitos alimentarios o desnutrición en condiciones de insuficiencia de alimentos y pobreza. Estos ensayos se excluyeron porque la desnutrición en estos casos es resultado de diferentes etiologías y los tipos de intervenciones y las respuestas a dichas intervenciones también difieren.
-
Ensayos de apoyo nutricional artificial a través de una vía no oral (es decir, alimentación con sonda enteral y nutrición parenteral).
-
Ensayos de apoyo nutricional individualizado que incluyeron cualquier asesoría dietética (es decir, en los que se exigió que el individuo comprendiera la asesoría nutricional específica y actuara según dicha asesoría, lo que tiene grandes probabilidades de ocurrir en contextos de pacientes ambulatorios). En los casos en los que la asesoría dietética se proporcionó en combinación con una intervención de apoyo, el ensayo sólo se incluyó si fue posible evaluar la repercusión de la intervención de apoyo por separado.
-
Ensayos de suplementos nutricionales orales prescritos de manera individual.
-
Ensayos en voluntarios sanos.
Tipos de medida de resultado
Se registraron las siguientes medidas de resultado como cambio desde el inicio hasta el final de la intervención, a menos que se indique lo contrario.
Resultados primarios
-
Ingesta nutricional (real o cambio porcentual en la ingesta de macro y micronutrientes)
-
Calidad de vida relacionada con la salud (evaluada con puntuaciones validadas) y satisfacción del paciente
-
Morbilidad / complicaciones (número de participantes con complicaciones médicas)
Resultados secundarios
-
Estado nutricional (cambio en el peso, el índice de masa corporal [IMC], la circunferencia del brazo mediosuperior [en inglés, MUAC], el espesor del pliegue cutáneo del tríceps [en inglés, TSF] o informado de otra manera)
-
Función clínica (cambio en el estado funcional clínico [p.ej. la fuerza muscular esquelética], la función respiratoria y cardíaca, la función cognitiva y conductual, las actividades cotidianas)
-
Hospitalización e ingreso a un centro de cuidados
-
Eventos adversos
-
Mortalidad por todas las causas
-
Costes económicos
Momento de la medición de los resultados
Se extrajeron los datos sobre los resultados medidos en cada ensayo desde el inicio hasta el final del período de intervención. En los ensayos con períodos de seguimiento que se extendieron más allá del final de la intervención, también se extrajeron los datos al final de la intervención y hasta el momento del seguimiento final. A partir de la experiencia de una revisión anterior de asesoría dietética con o sin administración de suplementos nutricionales orales para la desnutrición relacionada con enfermedades en adultos (Baldwin 2011), se previó que la duración, la intensidad y el tipo de intervención variarían considerablemente en la presente revisión debido a su mayor alcance. Por lo tanto, no se estableció la duración de la intervención y sólo se agruparon las intervenciones según el punto temporal si se identificó un número suficiente de ensayos que lo permitiera.
Resumen de los hallazgos
Se presenta una tabla "Resumen de los hallazgos" que informa los siguientes resultados, enumerados según la prioridad.
-
Mortalidad por todas las causas
-
Morbilidad / complicaciones
-
Calidad de vida relacionada con la salud y satisfacción del paciente
-
Hospitalización e ingreso a un centro de cuidados
-
Eventos adversos
-
Estado nutricional
-
Costes económicos
Debido a la falta de datos y a la heterogeneidad clínica y metodológica significativas sólo se realizaron metanálisis sobre la mortalidad por todas las causas, el número de participantes con complicaciones y el estado nutricional (cambio en el peso).
Results
Description of studies
See: Characteristics of included studies; Characteristics of excluded studies; Characteristics of studies awaiting classification.
Results of the search
The electronic searches identified 29,155 records. An additional 1107 records were identified from searches of conference abstracts/proceedings, systematic reviews and reference lists of included trials. We screened a total of 30,262 records after removal of duplicates. Three review authors (MG, CEW and CB) independently scanned titles and abstracts from the first two searches and the Co‐ordinating Editor (Bernd Richter (BR)) and one review author (CB) screened titles and abstracts from the third search and fourth search. We did not identify any ongoing trials.
Three review authors (CB, CEW and MG) and the Co‐ordinating Editor (BR) assessed eligibility of trials against the inclusion criteria and grouped trials according to similar intervention categories. We identified a total of 41 randomised controlled trials (RCTs) for inclusion in the review (see Characteristics of included studies). The number of trials identified for each intervention category were as follows.
-
Changes to the organisation of nutritional care (N = 13)
-
Changes to the feeding environment (N = 5)
-
Modification of meal profile or pattern (N = 12)
-
Additional supplementation of meals (N = 10)
-
Congregate and home meal delivery systems (N = 1)
A PRISMA flow‐diagram of trial selection is shown in Figure 2.
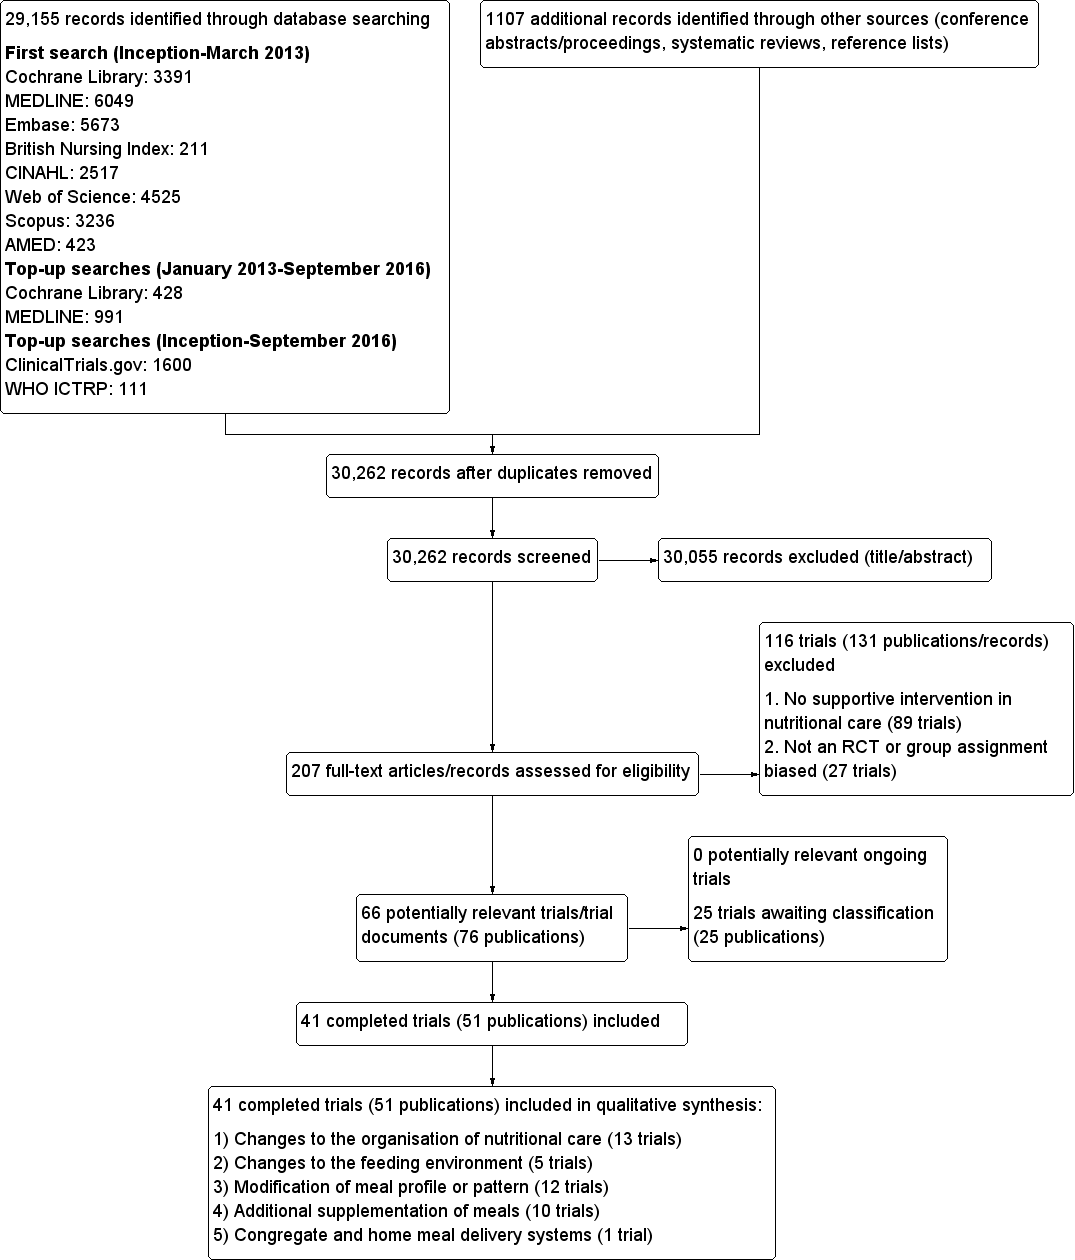
Study flow diagram
Contact with authors
Of the 41 included trials, we requested additional information on outcomes of interest and quality from the authors of 31 trials, and obtained it for 15 (Barton 2000; Beck 2002, Bouillanne 2013; Bourdel‐Marchasson 2000; Dennis 2005; Duncan 2006; Faxen‐Irving 2011; Gaskill 2009; Germain 2006; Hickson 2004; Holyday 2012; Olofsson 2007; Simmons 2008; Simmons 2010; Smoliner 2008). For six of the 15 trials where the study authors responded, they were unable to provide the data requested, or the data were not usable in a meta‐analysis (Barton 2000; Beck 2002; Bourdel‐Marchasson 2000; Gaskill 2009; Simmons 2008; Simmons 2010). The authors of the remaining 16 trials did not respond (Castellanos 2009; Chang 2005; Essed 2007; Essed 2009; Hankey 1993; Johansen 2004; Kraft 2012; Larsson 1990; Lin 2010; Mathey 2001a; Mathey 2001b; Pivi 2011; Potter 2001; Salva 2011; Splett 2003; Van Ort 1995).
Missing data
Despite the comprehensive search strategies used to identify trials in this review, it is possible that we have missed additional trials (e.g. unpublished trials, those published in obscure places, or those inappropriately indexed in databases).
The largest source of missing data in this review arose from data on outcomes that were measured but reported in such a way that they were unusable for entry into a meta‐analysis, because the data were reported as a median and interquartile range or were expressed as kcal/kg or the standard deviation (SD ) of change was not reported. The details of the amount of missing data according to intervention group are given in Table 3; Table 4; Table 5; Table 6 and Table 7. We contacted study authors in an attempt to obtain any missing data. The reasons for contacting authors and the outcome of contacts are described in Table 8 and Appendix 11.
Where it was not possible to obtain original data from study authors, we either imputed data, for example, standard deviations, using methods described in the Cochrane Handbook for Systematic Reviews of Interventions (Higgins 2011c), or used formulae for combining groups as outlined in Table 8.
The majority of included trials did not report intention‐to‐treat analyses.
Dealing with duplicate publications/companion papers
Six trials included in this review had duplicate or companion publications (Essed 2007; Hickson 2004; Larsson 1990; Lin 2010; Nijs 2006; Potter 2001).
Included studies
This systematic review identified 41 randomised controlled trials, with a total of 10,681 randomised participants (ranging from 8 (Van Ort 1995) to 4023 (Dennis 2005)). One included trial is awaiting clarification of participant numbers from the study authors (Larsson 1990). This trial had several publications, which stated varying numbers of participants (435 to 501). The primary reference reported data on 435 participants and this is the number that we would use in any meta‐analysis (Larsson 1990).
Participants were from a variety of countries including Australia, Brazil, CanadaDenmark, France, Germany, Netherlands, Spain, Sweden, Taiwan, , UK, and USA. Approximately 70% of participants were female (no information was provided for gender in three trials (Chang 2005; Larsson 1990; Simmons 2008). In those trials that reported ages in the intervention and usual care groups separately (N = 23), the mean age ranged from 62 to 87 years. Where the age of participants was reported for intervention and comparison groups separately, the mean age ranged from 75.2 to 87.3 (N = 11) (no data were provided for mean age in three trials (Kretser 2003; Potter 2001; Simmons 2008).
Altogether seven of the 41 included RCTs had a cross‐over design (Barton 2000; Castellanos 2009; Essed 2009; Lin 2011; Silver 2008; Simmons 2008; Taylor 2006), 12 a cluster‐randomised design (Bourdel‐Marchasson 2000; Chang 2005; Gaskill 2009; Leslie 2012; Lin 2010; Lin 2011; Mathey 2001a; Nijs 2006; Salva 2011; Simmons 2008; Smoliner 2008; Splett 2003) and one was a factorial RCT (Essed 2007). Two trials had both a cluster‐randomised and a cross‐over design (Lin 2011; Simmons 2008). One large trial investigating a normal hospital diet plus oral nutritional supplements versus a normal hospital diet in participants with a recent stroke randomised 38% participants (4023/10,681) of all individuals in the 41 included trials (Dennis 2005).
Interventions were carried out in the hospital setting (described as elderly rehabilitation wards, intermediate care units, geriatric units, acute trauma wards, geriatric acute wards, geriatric orthopaedic wards, medicine for the elderly units and acute medical admissions) (N = 15), residential care homes (N = 21) and free‐living or outpatient settings (N = 5) including neurology outpatients, and those enrolled at hospital discharge (see Table 9).
Nutritional status was reported in 27 trials, either because it was assessed at baseline or it was one of the criteria for inclusion in the trial (Beck 2002; Bouillanne 2013; Essed 2007; Essed 2009; Faxen‐Irving 2011; Gaskill 2009; Germain 2006; Hickson 2004; Holyday 2012; Johansen 2004; Kraft 2012; Kretser 2003; Larsson 1990; Leslie 2012; Lin 2010; Lin 2011; Munk 2014; Nijs 2006; Mathey 2001b; Olofsson 2007; Potter 2001; Remsburg 2001; Salva 2011; Silver 2008; Smoliner 2008; Taylor 2006; Van den Berg 2015). The remaining trials did not assess nutritional status at trial inclusion but we judged them appropriate to be included in this review as the clinical background of trial participants meant that they could be considered to be at risk of malnutrition or the patients were described as frail or vulnerable. Ten of 16 trials used a score from the Mini Nutritional Assessment (MNA) tool of 17 to 23.5 or less than 17 (Beck 2002; Essed 2007; Essed 2009; Holyday 2012; Kretser 2003; Nijs 2006; Olofsson 2007; Salva 2011; Smoliner 2008; Taylor 2006), to indicate risk of malnutrition, one trial used the Subjective Global Assessment score (SGA) (Gaskill 2009), two used the Nutritional Risk Screening 2002 (NRS‐2002) tool (Johansen 2004; Munk 2014), eight used only body mass index (BMI) (Faxen‐Irving 2011; Hickson 2004; Leslie 2012; Lin 2010; Lin 2011; Mathey 2001b; Remsburg 2001; Silver 2008), four used a combination of indices with variable cut‐offs (Bouillanne 2013; Germain 2006; Kraft 2012; Larsson 1990) and one used their own classification scoring system (Potter 2001). The average BMI measurements, in the trials that clearly reported BMI in all participants, ranged from less than 18.5 kg/m² (Kretser 2003) to 28.7 kg/m² (Nijs 2006)
The most commonly reported outcomes of interest to this review were nutritional intake (predominantly energy and protein), weight and mortality. These were reported in 27, 28 and 18 trials respectively. The three primary outcomes in the review, nutritional intake, health‐related quality of life and morbidity and complications, were reported in 27, 5, and 5 trials respectively. Patient satisfaction, hospital admission and costs were reported for a limited number of trials (2, 2 and 3 respectively). Six trials reported no usable data for potential combination in a meta‐analysis (Beck 2002; Castellanos 2009; Chang 2005; Gaskill 2009; Splett 2003; Van Ort 1995). We contacted the study authors who either were unable to provide the data requested, or failed to respond (see Table 8 and Appendix 11).
The outcomes reported in all intervention groups and those of use in this review, are summarised in Table 7.
Length of intervention and follow‐up
Length of intervention and follow‐up ranged from ‘length of hospital stay’ to 12 months in the included trials. In one trial, the length of intervention was unclear (Gaskill 2009). In 7 of 38 trials (Brouillette 1991; Dennis 2005; Duncan 2006; Gaskill 2009; Holyday 2012; Johansen 2004; Olofsson 2007) the follow‐up period extended beyond the intervention from two weeks to six months.
Further results of the included trials are given in their individual intervention categories (see Appendix 3 for description of interventions).
Changes to the organisation of nutritional care
We identified 13 trials for this category (Chang 2005; Duncan 2006; Gaskill 2009; Hickson 2004; Holyday 2012; Johansen 2004; Kraft 2012; Lin 2010; Lin 2011; Olofsson 2007; Pivi 2011; Salva 2011; Splett 2003), (N = 3426, 32.4% of review participants). Participants either had dementia, hip fractures or were from a range of clinical backgrounds, living in residential care homes, hospital or their own homes. Interventions consisted of the use of dietetic assistants (Duncan 2006; Hickson 2004), multidisciplinary team care (Johansen 2004), specialised teaching and training (Chang 2005; Gaskill 2009; Lin 2010; Lin 2011; Pivi 2011; Salva 2011), protocol‐driven nutrition care pathways (Holyday 2012; Splett 2003), multicomponent intervention (Olofsson 2007) and monitoring by telemedicine (Kraft 2012). Duration ranged from a few days of hospital stay to 12 months, and follow‐up from 28 days to 12 months. We have summarised the outcomes reported, and those usable for this review, Table 4.
Changes to the feeding environment
We identified five trials for this category (Brouillette 1991; Mathey 2001a; Nijs 2006; Remsburg 2001; Van Ort 1995), (N = 351, 3.3% of review participants). All trials were conducted in elderly participants living in residential care homes. Interventions consisted of the use of osmotherapy (pre‐meal sensory stimulation) (Brouillette 1991), improving mealtime ambience (Mathey 2001a), using family style meals (Nijs 2006), a buffet‐style meal service (Remsburg 2001), and a contextual/behavioural intervention (Van Ort 1995). Duration of intervention ranged from 3 weeks to 12 months, and follow‐up ranged from 4 weeks to 12 months. We have summarised the outcomes reported, and those usable for this review, in Table 4.
Modification of meal profile or pattern
We identified 12 trials for this category (Barton 2000; Bouillanne 2013; Castellanos 2009; Essed 2007; Essed 2009; Germain 2006; Leslie 2012; Mathey 2001b; Munk 2014; Silver 2008; Smoliner 2008; Taylor 2006), (N = 649, 6% of review participants). The trial by Barton 2000 included three groups, two of which were randomised to treatment or control and one other where it was unclear whether there was randomisation. Data have therefore only been included for those participants who were randomised to the treatment and usual care groups (N = 27). The trials included people from a range of clinical backgrounds who were in hospital (Barton 2000; Bouillanne 2013; Munk 2014), residential care homes (Castellanos 2009; Essed 2007; Essed 2009; Germain 2006; Leslie 2012; Mathey 2001b; Smoliner 2008; Taylor 2006), and free‐living participants in receipt of home‐delivered lunch meals (Silver 2008). Interventions consisted of altering portion sizes or fortifying meals, or both (Barton 2000; Castellanos 2009; Leslie 2012; Silver 2008), providing 78% of daily protein requirements at the lunch time meal, rather than spread evenly throughout the day (Bouillanne 2013), modifying the taste of foods previously identified as preferred (Essed 2007; Essed 2009; Mathey 2001b), modification of the appearance and presentation of pureed foods, thickened beverages, and dietary supplements (Germain 2006), the provision of an a la carte menu of enriched meals (Munk 2014) and altering meal pattern (Taylor 2006). We have summarised the outcomes reported, and those of use in this review, in Table 5.
Additional supplementation of meals
We identified 10 trials for this category (Beck 2002; Bourdel‐Marchasson 2000; Dennis 2005; Faxen‐Irving 2011; Hankey 1993; Larsson 1990; Potter 2001; Simmons 2008; Simmons 2010; Van den Berg 2015) (N = 6022, 56.4% of review participants). One trial did not state clearly the number of participants as additional publications appeared to include different numbers (Larsson 1990). As stated in the primary reference, 435 participants were therefore included in this review. The trial by Simmons 2008 was a two‐phase crossover and cluster‐randomised trial where residents were randomised only if they had a low oral food and fluid intake and were responsive to one of two feeding‐assistance interventions. This randomised sub‐group of intervention and control participants were then crossed over. We used data from the intervention and comparison groups prior to cross‐over in this review, as additional participants were added to the trial at the crossover.
One trial (Dennis 2005) included only people who had had a stroke . Other trials included either mixed participants, or did not report diagnoses. The majority of participants were from the hospital setting (Bourdel‐Marchasson 2000; Dennis 2005; Faxen‐Irving 2011; Hankey 1993; Larsson 1990; Potter 2001; Van den Berg 2015), and only 168 were from residential care homes (Beck 2002; Simmons 2008; Simmons 2010). In nine RCTs participants were offered between 400 kcal/day to 685 kcal/day in the form of a protein‐energy oral nutritional supplement, in addition to usual diet. In the other RCT participants were offered up to 420 kcal extra using 90 mL of fat emulsion/day (Faxen‐Irving 2011). We have summarised the outcomes reported, and those of use in this review, in Table 6.
Congregate and home meal delivery systems
We identified one trial for this category (Kretser 2003), including 203 free‐living participants (2% of review participants). Participants were offered modified home‐delivered meals with a daily follow‐up phone call. The outcomes of interest reported in this review included weight, clinical function, Activities of Daily Living score and number of deaths.
Excluded studies
Of the 182 trials/trial records after eligibility assessment, we excluded 27 trials as they were non‐randomised controlled trials or the group assignment was made after randomisation, and 89 trials that did not describe supportive interventions in nutritional care. It was necessary for all four review authors to participate in discussion about the reasons for exclusion of trials from intervention category four, ‘additional supplementation of meals’. Trials were excluded in this group for the following reasons.
-
Participants were not from an institutionalised setting; therefore it was considered that they would have been given individualised advice on taking oral nutritional supplements.
-
No clear organisational component to the intervention was described (for example when supplements were given without a clear description of delivery (i.e. administered at the same time as medication, or in place of usual morning/afternoon tea), or frequency of delivery).
-
Trials with multi component interventions where it was not possible to extract data relating to the specific effect of nutritional intervention.
Twenty‐four trials are awaiting assessment.
Risk of bias in included studies
The judgements made about risk of bias for individual trials are detailed in the 'risk of bias' section (Characteristics of included studies). A ‘Risk of bias summary’, and ‘Risk of bias graph’ are shown in Figure 3 and Figure 4. We judged the majority of criteria used in the assessment of risk of bias as unclear, indicating insufficient information to permit a full assessment of the risk of bias. The exceptions were attrition bias and reporting bias, where we judged the majority of trials (61% and 76% respectively) as being at low risk of bias (Figure 4).
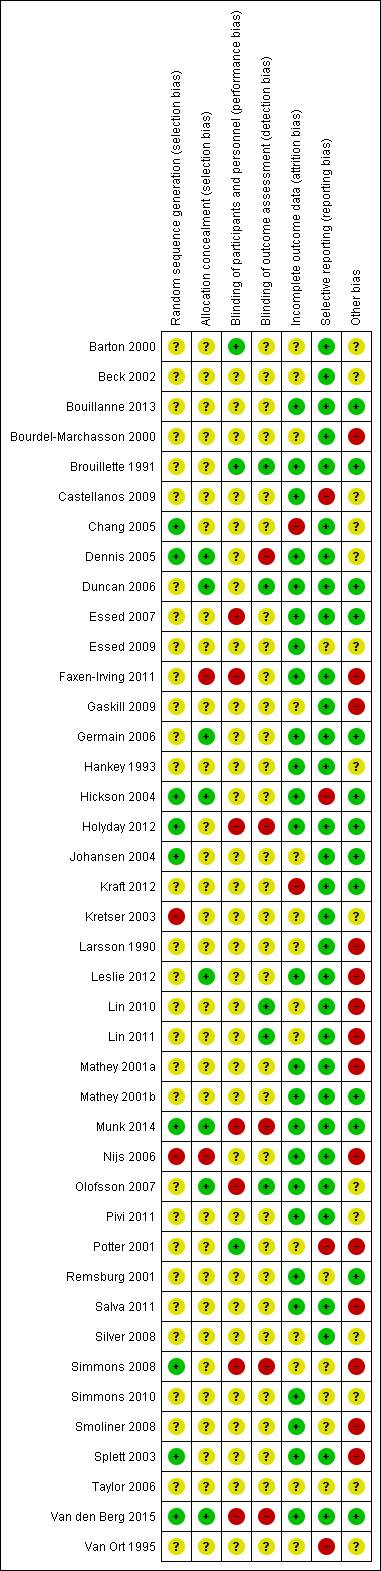
Risk of bias summary: review authors' judgements about each risk of bias item for each included trial.
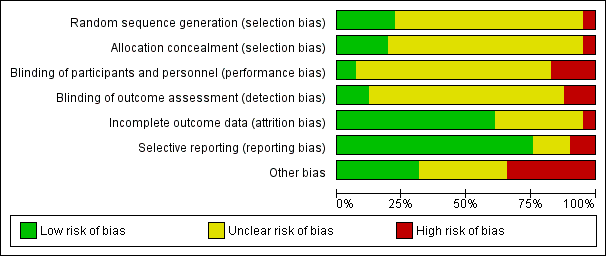
Risk of bias graph: review authors' judgements about each risk of bias item presented as percentages across all included trials.
Allocation
Generation of sequence
We assessed nine of 41 trials (Chang 2005; Dennis 2005; Hickson 2004; Holyday 2012; Johansen 2004; Munk 2014; Simmons 2008; Splett 2003; Van den Berg 2015), as being at low risk of bias for the method of random sequence generation. Two of these trials used the toss of a coin as a method of randomisation (Chang 2005; Simmons 2008), one used a sequence generated by a member of staff not involved in the trial (Munk 2014) and another used a random number table (Splett 2003). The other trials in this group used computer‐generated randomisation methods.
Two of 41 trials ( Kretser 2003; Nijs 2006) used inadequate methods of randomisation and we consequently gave them a high risk of bias. In another trial (Kretser 2003) the authors stated "randomised treatment assignment was followed with a few exceptions". When the participants were randomised to receive the new meals on wheels and refused, they were automatically placed on the traditional meals on wheels model. We therefore considered that allocation was made by preference of the participant. In the trial by Nijs 2006 the investigators described a non‐random component in the sequence generation process, based on the name of the ward. This was therefore given a high risk of bias score.
One trial did not detail whether the third intervention group was randomised, and subsequently received an unclear risk of bias (Barton 2000). The remaining trials in the review provided insufficient information about the sequence generation process to permit judgement of low or high risk of bias. We therefore categorised them as unclear risk of bias.
Allocation concealment
We assessed eight of 41 trials (Dennis 2005; Duncan 2006; Germain 2006; Hickson 2004; Leslie 2012; Munk 2014; Olofsson 2007; Van den Berg 2015), as being at low risk of bias for allocation concealment , as they used sequentially numbered or opaque sealed envelopes opened by a member of staff not involved in the trial, or allocation was made by a statistician having no other contact with the participants. The trial by Faxen‐Irving 2011 was considered to be at a high risk of allocation concealment, as they used sealed envelopes without describing the appropriate safeguards, for example, not sequentially numbered, or opaque. This suggested that participants, or investigators enrolling participants, could predict assignments, and thus introduce selection bias. Another trial used no concealment and therefore we judged it to be at a high risk of bias (Nijs 2006). The remaining trials included in the review we categorised as unclear risk of bias, as they provided insufficient information to permit a full assessment of the risk of bias.
Blinding
Blinding of participants and personnel (performance bias)
We judged three of 41 trials (Barton 2000; Brouillette 1991; Potter 2001) to be at a low risk of bias, as the trial participants were blind to group allocation or to what treatment they were receiving. We also judged that blinding was unlikely to have been broken throughout the trials. To give examples, in the trial by Barton 2000 the participants and staff were blinded to which menu they were following. In the trial by Brouillette 1991, the research assistant was unaware of group assignment. We awarded Potter 2001 a low risk of bias score, as researchers who knew the randomisation codes were not involved in outcome data collection or data entry.
We judged seven of 41 trials (Essed 2007; Faxen‐Irving 2011; Holyday 2012; Munk 2014; Olofsson 2007; Simmons 2008; Van den Berg 2015) to be at high risk of bias, predominantly due to a lack of blinding of key trial personnel. In the trial by Essed 2007 there was incomplete blinding, as participants were blinded but the research personnel were not. In the trial by Faxen‐Irving 2011, study nurses opened sealed envelopes, therefore would have been aware of group allocation. In the trial by Holyday 2012, the authors stated it was not possible to blind the clinical dietitian to group allocation. We therefore judged that the outcome was likely to be influenced by a lack of blinding of key trial personnel. Additionally, the trial by Olofsson 2007 stated that staff on the usual care ward were aware of a programme being implemented on another ward in the hospital. It was therefore judged that outcome assessment was likely to be influenced by lack of blinding to these key trial personnel. The remaining trials in the review we categorised as unclear risk of bias, as insufficient information was provided to permit judgement.
Blinding of outcome assessment (detection bias)
We judged five of 41 trials (Brouillette 1991; Duncan 2006; Lin 2010; Lin 2011; Olofsson 2007) to be at low risk of bias. Researchers assessing outcomes were unaware of treatment allocation; therefore we judged that the blinding was unlikely to have been broken. We judged five of 41 trials (Dennis 2005; Holyday 2012; Munk 2014; Simmons 2008; Van den Berg 2015) as at high risk of bias, as outcome assessment was not blinded, and the outcome measurement was likely to be influenced by the lack of blinding. One trial stated, “as the outcomes are primarily objective measures, they are mostly not open to the influence of bias” (Holyday 2012). Additionally, the trial by Dennis 2005 stated “follow up was masked to treatment allocation except when patients or carers inadvertently divulged it to an interviewer, which was usually, but not systematically recorded”. In the trial by Simmons 2008 outcomes were not assessed blinded to treatment and the outcomes were judged to be susceptible to detection bias. In the trial by Van Ort 1995, the research staff who observed videotapes were unaware of the trial hypothesis, but were aware of group allocation. We gave this trial, and the remaining 28 trials, an unclear risk of bias, as insufficient information was provided to permit judgement of the risk of bias.
Incomplete outcome data
The numbers of participants excluded from trials, along with reasons, were fully reported in 25 out of 41 trials and we judged these to have a low risk of bias. The number of participant exclusions ranged from 0% to 81%. The trial by Chang 2005 we judged to be at high risk of bias, because data were presented on only 20 of the 36 participants, without explanation. We judged another trial as high risk due to the high attrition rate in the intervention group (Kraft 2012). Here, eight participants out of 13 in the intervention group withdrew, and three out of 13 in the usual care group withdrew.
We included a total of 14 trials in the unclear risk of bias category. Three trials did not report exclusions (Barton 2000; Beck 2002; Simmons 2008). One of these is awaiting clarification from the trial author (Beck 2002), and another only reported participant exclusions in one of the intervention groups (Barton 2000). In a further three trials, the numbers of exclusions were unclear (Bourdel‐Marchasson 2000; Gaskill 2009; Larsson 1990). Six trials only reported a total number finishing the trial, rather than a breakdown for the intervention and usual care groups separately (Johansen 2004; Kretser 2003; Lin 2010; Silver 2008; Taylor 2006; Van Ort 1995). Each of these trials stated why participants dropped out, however it was unclear which group they were allocated to. Simmons 2008 reported dropouts from each group, however only described mortality as the primary reason (58%). One trial did not describe attrition (Lin 2011), and another trial reported outcome in relation to BMI and triceps skinfold thickness (TSF), but not BMI and TSF alone (Potter 2001).
Selective reporting
Thirty‐one of the 41 trials reported all outcomes as stated in the trial methodology, and we therefore judged them to be at low risk of bias. We categorised four trials as high risk of bias (Castellanos 2009; Hickson 2004; Potter 2001; Van Ort 1995). In the trial by Potter 2001, one or more outcomes of interest to the review were described as collected but were incompletely reported. In another trial, results for the whole group were not reported according to the initial randomisation (Castellanos 2009). In the trial by Hickson 2004, no data were reported on: use of service questionnaires, referral rate to therapists, readmission within six months, laxative use, pressure sores and economic analysis. In the trial by Van Ort 1995, outcomes were described in the methodology, however no quantitative data were reported. We categorised the remaining six trials as unclear risk of bias (Essed 2009; Remsburg 2001; Simmons 2008; Simmons 2010; Smoliner 2008; Taylor 2006), as insufficient information was provided in order to make a judgement on risk of bias.
Other potential sources of bias
We judged 13 of the 41 trials as low risk of bias, as intervention and usual care groups were comparable at baseline (Bouillanne 2013; Brouillette 1991; Duncan 2006; Essed 2007; Germain 2006; Hickson 2004; Holyday 2012; Johansen 2004; Kraft 2012; Mathey 2001b; Munk 2014; Remsburg 2001; Van den Berg 2015). In Hickson 2004, there were significantly more women in the intervention compared with the usual care group, but otherwise groups were comparable. Three parallel RCTs were judged at high risk of bias (Faxen‐Irving 2011; Larsson 1990; Potter 2001). Faxen‐Irving 2011 provided data only from those who completed the trial, potentially missing valuable data for those who dropped out. In the trial by Larsson 1990, there were significant differences between groups at baseline. TSF and weight index in men, and mid‐arm circumference (MAC) in women were significantly lower in the intervention group than the control. The intervention group also had a significantly poorer mental condition as assessed using the modified Norton score on admission. In the trial by Potter 2001, only half of those in the ‘well nourished’ group were randomised, therefore bias was likely to have occurred. We categorised 14 trials as unclear risk of bias, as there was insufficient information to assess whether an important risk of bias existed.
We considered the following risk of bias criteria for the 12 cluster‐RCTs (Bourdel‐Marchasson 2000; Chang 2005; Gaskill 2009; Leslie 2012; Lin 2010; Lin 2011; Mathey 2001a; Nijs 2006; Salva 2011; Simmons 2008; Smoliner 2008; Splett 2003): (a) recruitment bias, (b) baseline imbalance, (c) loss of clusters, (d) incorrect analysis, and (e) comparability with individually randomised trials or different types of clusters as described in the Cochrane Handbook for Systematic Reviews of Interventions (Higgins 2011c). If any of the aforementioned criteria applied, we assigned a high risk of 'other bias'. Consequently, all included cluster RCTs had a high risk of bias. In the trial by Chang 2005 it was unclear whether randomisation occurred at the unit level (more probable) or the individual level. We therefore judged this trial to be an unclear risk of other bias.
Effects of interventions
We could not recalculate data taking into account the design effect for the 12 cluster RCTs (Bourdel‐Marchasson 2000; Chang 2005; Gaskill 2009; Leslie 2012; Lin 2010; Lin 2011; Mathey 2001a; Nijs 2006; Salva 2011; Simmons 2008; Smoliner 2008; Splett 2003) because we did not have reliable information about intracluster correlation coefficients for our substantial heterogeneous populations in the included trials. Therefore, we did not establish meta‐analyses by using both parallel and cluster RCTs but excluded the cluster RCTs from all meta‐analyses. Also, cross‐over trials did not contribute to the effect estimates established by meta‐analyses.
Overview of all trials combined
Primary Outcomes
Nutritional intake
Data on this outcome were reported in 27 of 41 trials (Barton 2000; Beck 2002; Bouillanne 2013; Bourdel‐Marchasson 2000; Brouillette 1991; Castellanos 2009; Chang 2005; Duncan 2006; Essed 2007; Essed 2009; Faxen‐Irving 2011; Germain 2006; Hankey 1993; Hickson 2004; Johansen 2004; Leslie 2012; Lin 2010; Mathey 2001a; Mathey 2001b; Munk 2014; Nijs 2006; Potter 2001; Silver 2008; Simmons 2008; Simmons 2010; Taylor 2006; Van den Berg 2015).
The trials reporting on change in energy intake were in participants from a range of clinical backgrounds and healthcare settings and there were differences between trials in how energy intake was assessed (from observations of amounts eaten to detailed weighing and analysis). The majority of trials found no marked difference in energy intake between groups. One trial of assistance at mealtimes in hospitalised patients with hip fracture (Duncan 2006) reported a greater energy intake in the intervention group than in the usual care group (1105 kcal (SD 361) versus 759 (SD 399), P < 0.001) and a trial of a multidisciplinary team intervention in hospitalised patients (Johansen 2004) reported a higher intake in the intervention group than in the control group (Table 10). Two trials of fortification of meals (Barton 2000; Silver 2008) reported greater energy intakes in participants receiving the fortification than those receiving usual care (Table 15) and one trial of modifications to the appearance and presentation of foods to individuals with dysphagia (Germain 2006) reported a greater energy intake in the participants receiving the intervention (Table 15). Two of 10 trials of supplementation of meals with oral nutritional supplements (Hankey 1993; Van den Berg 2015) reported a higher energy intake in groups receiving the supplement, however the between‐group differences were not reported (Table 19).
Health‐related quality of life and patient satisfaction
Data on health‐related quality of life were reported in five of 41 trials (Dennis 2005; Johansen 2004; Mathey 2001a; Nijs 2006; Smoliner 2008). Data were collected using different quality‐of‐life instruments; two trials used the Short Form‐36 (SF‐36) (Johansen 2004; Smoliner 2008), one trial used the Dutch quality of life of somatic nursing home residents questionnaire (Nijs 2006), one used the European Quality of Life Scale (EuroQOL‐5D or EQ‐5D) (Dennis 2005) and the final trial (Mathey 2001a) used the Sickness Impact Profile (SIP) and Philadelphia Geriatric Center Morale Scale (PGCMS, 17 items). The trials reporting on health‐related quality of life included participants from a wide range of different clinical backgrounds. No marked differences between groups were found in four trials (Dennis 2005; Johansen 2004; Mathey 2001a; Smoliner 2008) (Table 11; Table 16; Table 23), the overall quality of evidence was low and two trials were cluster‐randomised trials and therefore at high risk of bias (Mathey 2001a; Smoliner 2008). Nijs 2006 assessed health‐related quality of life using a validated Dutch questionnaire (Van Campen 1998). This questionnaire consists of five sub‐scales, each representing a quality‐of‐life dimension: sensory functioning (focusing on pain); physical functioning (perceived performance and self care); psychosocial functioning (depression or loneliness); perceived autonomy (freedom of movement); and perceived safety (feeling at home in the institution). The number of statements in the five sub‐scales is not equal. The questionnaire consists of 50 statements, scored on a dichotomous scale (yes or no). Each sub‐scale and the total questionnaire is computed to achieve a score from 0 to 100. A high score represents a high quality of life. The results were presented as difference in changes in overall quality of life between the groups and were reported as statistically significant (6.1 units, 95% confidence interval (CI) 2.1 to 10.3). The intervention group remained stable (0.4 units, 95% CI 1.8 to 2.5), whereas the usual care group declined (‐0.5 units, 95% CI ‐9.4 to 0.6), although the overall changes were small and it is unclear if the observed differences were likely to be noticeable to participants (Table 16). Moreover, this trial was at high risk of bias. Therefore, all reported outcome measures of this trial must be interpreted with caution.
Data on patient satisfaction were reported in two trials (Duncan 2006; Salva 2011). Duncan 2006 assessed patient satisfaction using an unvalidated questionnaire with 10 questions about aspects of meals, diet and feeding. Participants answered yes or no, where yes = 1, no = ‐1 and NA = 0. Those participants who had received the support of the dietetic assistants showed greater satisfaction, with a median score of 6.5 (interquartile range (IQR) 2) compared to 3 (IQR 4) for participants receiving usual care (P < 0.0001) (Table 11). In the trial by Salva 2011 satisfaction of participants and their families was assessed by an unvalidated questionnaire which asked about the use of and perceived usefulness of five aspects of the overall programme. Families and carers were asked to indicate whether they had used the service and whether they had found it very useful, useful or not very useful. Information cards were used by 94.5% of families and rated the service as very useful (26%) or useful (67%). The nutrition course was used by 66% of families and rated as very useful (24%) and useful (65%). Weight curves were sent to 88% of families and rated as very useful (13%) and useful (78%). Information sessions were attended by 75% of families and rated as very useful (32%) and useful (61.5%). The hot line was used by 33% of families and rated as very useful (17%) and useful (51%).
Morbidity/complications
Data on this outcome were reported in seven of 41 trials (Bouillanne 2013; Bourdel‐Marchasson 2000; Dennis 2005; Duncan 2006; Hickson 2004; Johansen 2004; Olofsson 2007). Complications were reported as either the number of participants experiencing any complication (Bouillanne 2013; Dennis 2005; Duncan 2006; Johansen 2004; Olofsson 2007), number of participants with pressure ulcers (Bourdel‐Marchasson 2000; Dennis 2005) or the number of participants needing oral antibiotics (Hickson 2004). Trials were in participants from different clinical backgrounds, in different healthcare settings and receiving interventions that aimed to be supportive of improved nutritional intake, and varied widely. There were no marked differences in complication rates between groups reported in any trial (Table 11).
Meta‐analysis of trials reporting number of participants experiencing any complication showed considerable inconsistency (I² = 91%). Risk ratios ranged between 0.59 indicating benefit for supportive interventions, to 1.42 indicating benefit of control interventions (5 trials; 4015 participants; very low‐quality evidence; Analysis 1.1).
Secondary Outcomes
Nutritional status
Weight change
Data on this outcome were reported in 28 of 41 trials (Beck 2002; Bouillanne 2013; Chang 2005; Duncan 2006; Essed 2007; Faxen‐Irving 2011; Germain 2006; Hankey 1993; Hickson 2004; Holyday 2012; Johansen 2004; Kraft 2012; Kretser 2003; Larsson 1990; Leslie 2012; Lin 2010; Mathey 2001a; Mathey 2001b; Munk 2014; Nijs 2006; Olofsson 2007; Pivi 2011; Potter 2001; Remsburg 2001; Salva 2011; Simmons 2008; Simmons 2010; Smoliner 2008). Trials were in participants from different clinical backgrounds, in different healthcare settings and receiving interventions which, although aiming to support improved nutritional intake, varied from one another in the nature of the intervention.
Meta‐analysis across 17 trials with adequate data on weight change revealed an overall improvement in weight in favour of supportive interventions versus control: mean difference (MD) 0.6 kg (95% CI 0.21 to 1.02); P = 0.003; 2024 participants; moderate‐quality evidence; Analysis 1.2. However, heterogeneity was moderate (I² = 51%). We excluded the trial by Pivi 2011 from this meta‐analysis because missing SDs for weight change could not be reliably imputed. Trial authors reported a significant difference between intervention groups using a P value < 0.001. Using a P value of 0.0005 for imputation of SDs resulted in an SD of 3.3. Using these data did not substantially alter the effect estimate. Some other trials showed bias from different sources, however, exclusion of these trials did not substantially change the overall effect estimate. Also, elimination of any subtype of supportive intervention did not change the overall effect estimate in a substantial way. The body of evidence for this outcome consisted mainly of trials on change to the organisation of nutritional care (6 trials). However, the interaction test for subgroup differences was significant indicating the need to further investigate the various types of supportive interventions in future trials (Figure 5).
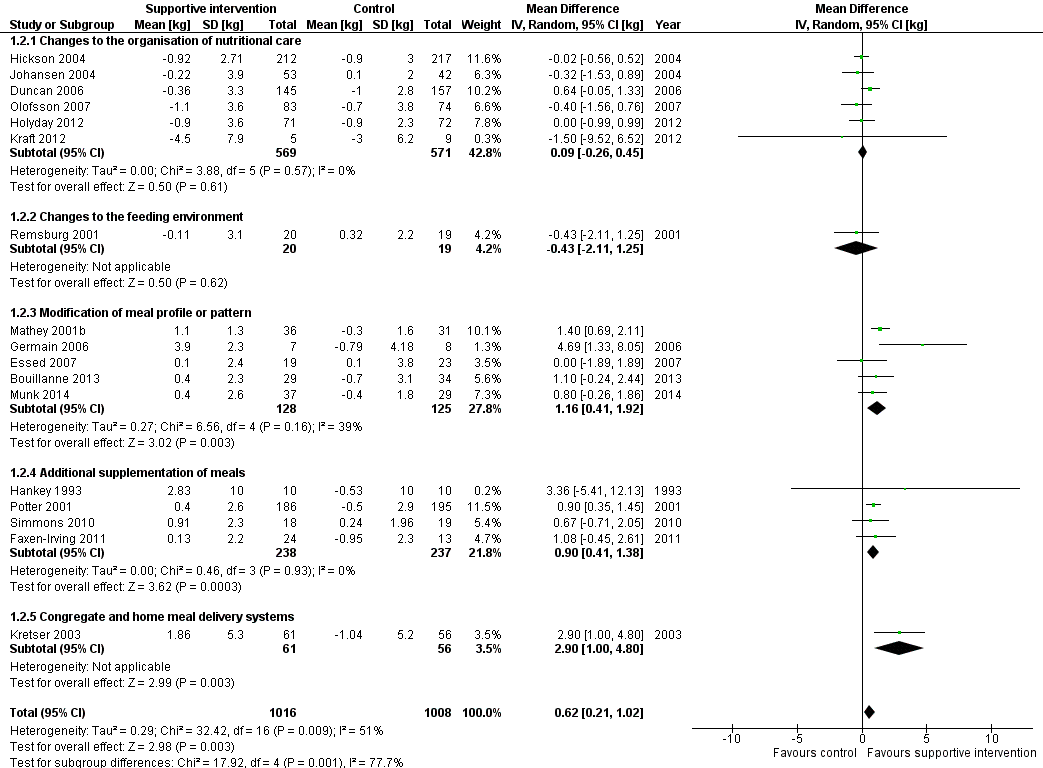
Forest plot of comparison: 1 Supportive interventions for enhancing dietary intake versus comparators, outcome: 1.2 Nutritional status (weight change) (kg)
Change in BMI
Data on change in BMI were reported in 12 of 41 trials (Faxen‐Irving 2011; Germain 2006; Hickson 2004; Kraft 2012; Leslie 2012; Lin 2010; Lin 2011; Olofsson 2007; Pivi 2011; Salva 2011; Simmons 2008; Smoliner 2008). Trials were in participants from different clinical backgrounds, in different healthcare settings and receiving interventions that aimed to support improved nutritional intake but varied from one another. The majority of trials reported no marked difference in BMI between groups. In the trial by Pivi 2011 participants receiving specialist training experienced an increase in BMI (1.2 kg/m² (SD 1)) and participants in the usual care group experienced a reduction in BMI (‐2.2 kg/m² (SD 1)). However, the between‐group difference and statistical tests were not reported. The trial by Germain 2006, which examined the effects of modifications to the presentation of meals to participants with dysphagia, and in the trial by Leslie 2012 of food fortification in residential care homes, the intervention group had a greater gain in BMI than the usual care group (Table 17). However, between‐group differences with statistical tests were not reported. In the trial by Faxen‐Irving 2011 BMI was reported according to group at the end of the intervention and there was no marked difference between groups, change from baseline and between‐group differences were not reported. In the trial by Simmons 2008 the intervention group gained 0.7 kg/m² more than the usual care group (P < 0.009) (Table 24).
Change in TSF
Data on this outcome were reported in five of 41 trials (Duncan 2006; Hankey 1993; Hickson 2004; Larsson 1990; Pivi 2011). Trials were in participants receiving assistance during mealtimes (Duncan 2006; Hickson 2004), specialist training (Pivi 2011) and supplementation with oral nutritional supplement (Hankey 1993; Larsson 1990) in different healthcare settings. There were no marked differences in TSF reported between groups in the trials by Duncan 2006, Hickson 2004 and Pivi 2011. In the trials by Hankey 1993 and Pivi 2011 data were presented in figures with minimal description in the text. In the trial by Hankey 1993 the intervention group was described as experiencing a smaller decrease in TSF than the usual care group (6.6% versus 15.8%). In the trial by Larsson 1990 TSF decreased over the 26 weeks of follow‐up in both groups with the greatest decrease occurring in the usual care group.
Change in MAC
Data on this outcome were reported in eight of 41 trials (Duncan 2006; Hankey 1993; Hickson 2004; Larsson 1990; Leslie 2012; Nijs 2006; Pivi 2011; Potter 2001). Trials were in participants from different clinical backgrounds, in different healthcare settings and receiving interventions which aimed to support improved nutritional intake but varied from one another. Three trials reported no marked difference in MAC between groups (Hickson 2004; Nijs 2006; Potter 2001). In the trial by Duncan 2006, the group that received assistance with eating had a smaller reduction in MAC of ‐0.9 cm (SD 2.2) compared with the group that received usual care, ‐1.3 (SD 1.5) (P = 0.002). One trial evaluating the impact of specialist training in free‐living individuals (Pivi 2011) reported improvements in MAC in the intervention group of 1.9 cm (SD 2) compared with a reduction of ‐0.4 cm (SD 0.5) in the group receiving usual care. In the trial by Leslie 2012 of food fortification in residential care homes, participants in the intervention group had a greater improvement in MUAC than those in the control group but the between‐group differences and statistical tests were not reported (Table 20) In the trial by Hankey 1993, the data were unavailable from the original trial report but we obtained them from a systematic review by Milne 2009. We read the figures for change from a graph, and we assumed the SD of change to be 10 cm for each group. MAC was described as improving in the intervention group (P < 0.05) but remaining unchanged in the usual care group. The changes were small and no between‐group differences were reported (Table 24). In the trial by Larsson 1990 the data are presented in a figure with some description in the text, participants who were well nourished at the start of the trial and received supplementation of meals experienced less decrease in MAC at 26 weeks (P < 0.05) than those receiving usual care. In participants who were malnourished at the start of the trial both groups experienced a decrease in MAC at 26 weeks.
Clinical function
Data on this outcome were reported in nine of 41 trials (Bouillanne 2013; Duncan 2006; Faxen‐Irving 2011; Hickson 2004; Kretser 2003; Munk 2014; Potter 2001; Salva 2011; Smoliner 2008). Trials were in participants from a variety of different clinical backgrounds, in different healthcare settings and were assessed using a variety of methods including handgrip strength, Barthel score, Activities of Daily Living (ADL), instrumental ADL (iADL) and peak flow.
Three trials assessed functional recovery using the Barthel score (Hickson 2004; Smoliner 2008; Potter 2001). The Barthel index consists of 10 items that measure a person's daily functioning, specifically the activities of daily living and mobility (Mahoney 1965). The items include feeding, moving from wheelchair to bed and return, grooming, transferring to and from a toilet, bathing, walking on level surface, going up and down stairs, dressing, continence of bowels and bladder. The items are weighted according to a scheme developed by the authors. The person receives a score based on whether they have received help while doing the task. The scores for each of the items are summed to create a total score. The higher the score the more 'independent' the person. Independence means that the person needs no assistance with any part of the task. There were no marked differences between groups in any trial. In the trial by Potter 2001 there was no marked difference in numbers achieving functional recovery assessed using the Barthel index in the group receiving supplementation compared with the usual care group (102/149 intervention versus 100/157 control, P = 0.38). However, more participants classified as severely undernourished experienced an improvement in their Barthel scores on supplementation compared with those that received usual care (17/25 intervention versus 11/28 control, P < 0.04).
Four trials assessed clinical function using the ADL and iADL scores (Bouillanne 2013; Faxen‐Irving 2011; Kretser 2003; Salva 2011). Two main types of abilities are measured by these functional assessment scales. Basic ADL consist of activities that are performed daily, habitually and universally, such as dressing, bathing, and eating. In contrast, iADL requires organisation and planning, and includes such tasks as shopping, using transportation, preparing meals, handling finances, keeping the house, and using a telephone. The scores range from 0 to 100 and amount of functional impairment is then rated as ‘‘none to mild’’ (0 to 33), ‘‘moderate’’ (34 to 66), or ‘‘severe’’ (> 66). All trials reported no marked differences in ADL between the intervention and usual care groups. One trial used the iADL (Kretser 2003) to measure clinical function. There was a greater decline in iADL in those receiving traditional meals on wheels compared with those receiving modified meals on wheels at six months (P = 0.0494).
Five trials assessed clinical function using handgrip strength (Bouillanne 2013; Duncan 2006; Hickson 2004; Munk 2014; Smoliner 2008), and there were no marked differences in any trial between the groups receiving the intervention and those receiving usual care (Table 13; Table 21).
In the trial by Smoliner 2008 clinical function was also measured using peak flow. Peak expiratory flow is the maximum flow generated during expiration performed with maximal force and started after a full inspiration. A decrease in peak flow rates indicates a deterioration in clinical function and vice versa. The peak flow in the intervention group increased from baseline to follow‐up (12 weeks) (mean 152 mL/min (SD 105) to 186 mL/min (SD 140) whereas the usual care showed a decline (151 mL/min (SD90) to 150 mL/min (SD 67). The between‐group difference was statistically significant (P = 0.039).
Hospitalisation and institutionalisation
Data on length of hospital stay were reported in 10 of 41 trials (Dennis 2005; Duncan 2006; Faxen‐Irving 2011; Hickson 2004; Holyday 2012; Johansen 2004; Munk 2014; Olofsson 2007; Potter 2001; Van den Berg 2015). The trials were either of changes to the organisation of nutritional care (Duncan 2006; Hickson 2004; Holyday 2012; Johansen 2004; Olofsson 2007 ), fortification of meals in hospital (Munk 2014) or of supplementation of meals with oral nutritional supplements (Dennis 2005; Faxen‐Irving 2011; Potter 2001: Van den Berg 2015 ). Nine trials reported no marked difference in length of hospital stay between groups (Dennis 2005; Duncan 2006; Faxen‐Irving 2011; Hickson 2004; Holyday 2012; Johansen 2004; Munk 2014; Potter 2001; Van den Berg 2015). In the trial by Olofsson 2007 groups receiving a multidisciplinary team intervention had a shorter mean length of hospital stay (27.4 days (SD 15.9)) than groups receiving usual care (39.8 days (SD 41.9)) (P < 0.05) (Table 14).
Meta‐analysis across five trials with adequate data on length of hospital stay showed a MD between intervention and comparator groups of ‐0.5 days (95% CI ‐2.6 to 1.6); P = 0.56; 667 participants; very low‐quality evidence; Analysis 1.3.
Data on hospital readmissions were reported in two of 41 trials (Holyday 2012; Van den Berg 2015). In the trial by Holyday 2012 the groups receiving a protocol‐driven pathway for the management of nutrition whilst in hospital had fewer hospital readmissions than the group receiving usual care (30/71 versus 37/72 respectively). However the between‐group difference was not statistically significant. In the trial by Van den Berg 2015 there were more hospital readmissions in the group receiving an oral nutritional supplement four times daily than the groups receiving the supplement twice daily or the usual care group (24 versus 13 versus 15 respectively).
The trial by Potter 2001 reported the destination of participants at discharge according to group allocation. There was no marked difference between groups in the numbers of participants returning to their own home and those being discharged to an institution (Table 25).
Adverse events
Three of 41 trials (Dennis 2005; Faxen‐Irving 2011; Hankey 1993) reported on adverse events, all trials evaluating the impact of supplementation of meals with oral nutritional supplements. The overall quality of the evidence was very low. The trial by Faxen‐Irving 2011 reported that 5 of 34 (15%) participants experienced intolerance to the supplement assessed as diarrhoea and vomiting. In the trial by Dennis 2005 565 of 2017 (28%) of participants stopped taking the oral nutritional supplement due to individuals' refusal or dislike of taste, unwanted weight gain, or feelings of nausea. The trials by Potter 2001 and Van den Berg 2015 reported that no adverse events occurred.
All‐cause mortality
Adequate data were reported on this outcome in 12 out of 41 trials (Bouillanne 2013; Brouillette 1991; Dennis 2005; Duncan 2006; Hickson 2004; Holyday 2012; Kretser 2003; Larsson 1990; Munk 2014; Olofsson 2007; Potter 2001; Van den Berg 2015). Six cluster‐RCTs could not be included in the meta‐analysis (Bourdel‐Marchasson 2000; Leslie 2012; Mathey 2001a; Nijs 2006; Salva 2011; Smoliner 2008).
Trials were in participants from a variety of clinical backgrounds and in a range of different healthcare settings, receiving interventions which were all supportive of improved nutritional intake but varied widely. Meta‐analysis showed a RR of 0.78 (95% CI 0.66 to 0.92); P = 0.004; 12 trials; 6683 participants; moderate‐quality evidence; Analysis 1.4 in favour of supportive interventions (Figure 6). The test for subgroup differences of the various supportive interventions did not indicate interaction. Subgroup analysis of longer‐term trials (four months to one year) showed a RR of 0.73 (95% CI 0.55 to 0.98); 6 trials; 5200 participants. The sensitivity analysis after exclusion of the biggest trial, Dennis 2005, showed a RR of 0.67 (95% CI 0.54 to 0.82); 11 trials; 2660 participants.
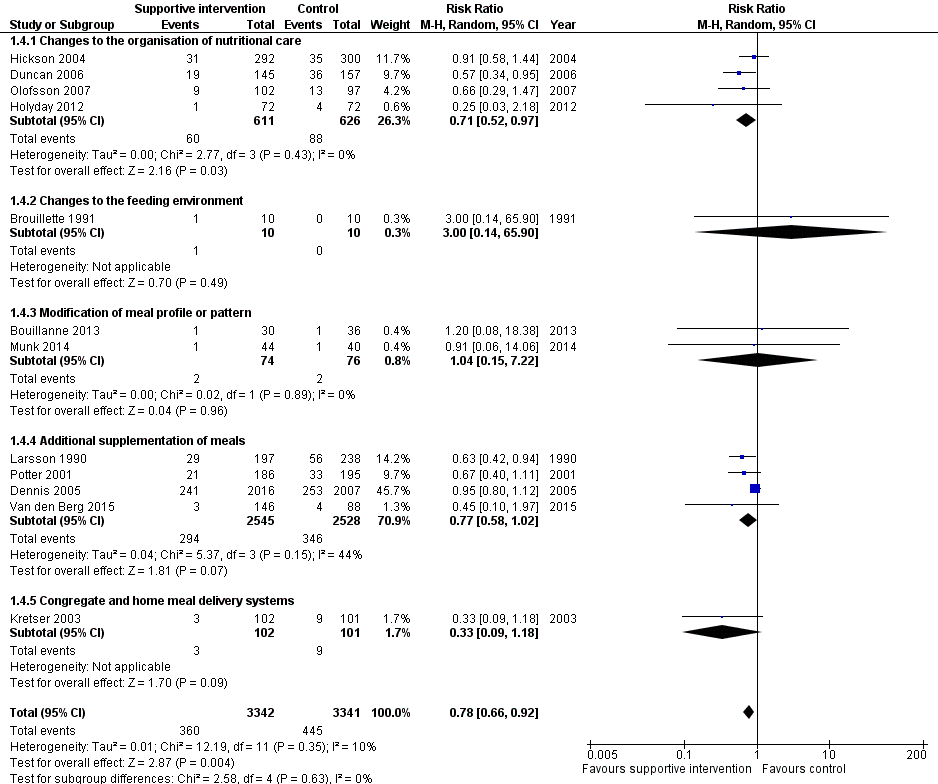
Forest plot of comparison: 1 Supportive interventions for enhancing dietary intake versus comparators, outcome: 1.4 All‐cause mortality
Economic costs
Data on this outcome were reported in three of 41 trials (Holyday 2012; Salva 2011; Simmons 2010). The overall quality of the evidence was very low. The trial by Holyday 2012 evaluated the impact of a protocol‐driven pathway for the management of nutritional care in hospital patients and the trial by Salva 2011 evaluated the impact of specialist training for carers of free‐living individuals with dementia. In the trial by Holyday 2012 the data on cost savings were based on reductions in the length of hospital stay. There was no marked difference in overall length of stay between groups. There was a shorter length of stay by eight days in the subgroup of 32 malnourished participants (12 days in the intervention group and 20 days in the usual care group). These data were used to estimate a cost saving of AUD 63,360 from treating malnutrition in the group of 12 malnourished participants based on the cost per hospital bed per day, the cost of the dietitians' time and the average cost of a commercial oral nutritional supplement. The trial by Salva 2011 collected data on resource utilisation but the data were not reported. The trial by Simmons 2010 evaluated the impact of a food‐based and oral nutritional supplement‐based intervention. In this trial a formal cost effectiveness analysis was not undertaken and reporting of the impact of the interventions on costs was limited to a report of the cost per serving of the oral nutritional supplement or food provided and an estimate of staff time required to encourage and assist consumption. The average costs (per person per day in USD) were significantly higher in groups receiving supplements and snacks compared with those in the usual care group (USD 2.10 versus, USD 2.06). None of the trials used accepted health economic methods and the reported data on both costs and effectiveness were generally poor.
Subgroup analyses
We carried out the first planned subgroup analysis 'intervention category'. Trials were grouped according to similar interventions into five categories. There were insufficient data to undertake further subgroup analyses.
Sensitivity analyses
We did not do any sensitivity analyses because of insufficient data.
Changes to the organisation of nutritional care
Primary outcomes
Nutritional intake
Data on energy intake were reported in five of 13 trials (Chang 2005; Duncan 2006; Hickson 2004; Johansen 2004; Lin 2010) (Table 10). Two trials used dietetic assistants in a hospital setting: one found a greater energy intake in groups receiving assistance than those receiving usual care (1105 kcal (SD 361) versus 759 kcal (SD 399), P < 0.001) (Duncan 2006), whereas in the other trial (Hickson 2004), which assessed between‐group difference in intake in 37 of 592 participants, the difference in energy intake between the groups was 89 kcal, P < 0.538. Of the four trials that implemented specialist training in long‐term care facilities, two reported data on energy intake as percentage of meals consumed (Chang 2005;Lin 2010). In one trial (Chang 2005), the intervention group experienced a reduction in percentage of meals consumed and the group receiving usual care increased their intake (P < 0.49). In the other trial (Lin 2010) there were small increases in percentage of meals consumed in all groups (Table 10). One trial providing multi‐disciplinary team care in a hospital setting reported a greater energy intake in the intervention group compared with usual care (30 kcal/kg/d (standard error (SE) 1) versus 25 kcal/kg/d (SE 1) (Johansen 2004).
Health‐related quality of life and patient satisfaction
Data on health‐related quality of life were reported in one of 13 trials (Johansen 2004). Quality of life was assessed using the SF36 questionnaire (Ware 1992) which was completed by 57% participants. A dropout analysis showed responders and non‐responders were similar in terms of baseline characteristics. There were no marked differences between the groups in both the physical and mental summary scores from baseline to follow‐up (physical score mean 2.4 (SE 1.3) in the intervention versus mean 0.2 (SE 1.5) in the control; mental score mean 2.2 (SE 2.5) in the intervention versus mean 3.3 (SE 2) in the usual care) (Table 11).
Data on patient satisfaction were reported in two of 13 trials (Duncan 2006; Salva 2011). In the trial by Duncan 2006 patient satisfaction was assessed using an unvalidated questionnaire with 10 questions about aspects of meals, diet and feeding. Patients answered yes or no where yes = 1, no = ‐1 and NA = 0. Those participants who had received the support of the dietetic assistants showed greater satisfaction with a median score of 6.5 (IQR 2) compared to 3 (IQR 4) for participants receiving usual care (P < 0.0001) (Table 11). In the trial by Salva 2011 satisfaction of participants and their families was assessed using an unvalidated questionnaire which asked about the use of and perceived usefulness of five aspects of the overall programme. Families and carers were asked to indicate whether they had used the service and whether they had found it very useful, useful or not very useful. Information cards were used by 94.5% of families and rated as very useful (26%) and useful (67%). The nutrition course was used by 66% of families and rated as very useful (24%) and useful (65%). Weight curves were sent to 88% of families and rated as very useful (13%) and useful (78%). Information sessions were attended by 75% of families and rated as very useful (32%) and useful (62%). The hot line was used by 33% of families and rated as very useful (17%) and useful (51%).
Morbidity/complications
Data on complications were reported in four of 13 trials (Duncan 2006; Hickson 2004; Johansen 2004; Olofsson 2007), three of which reported the number of participants experiencing any complications (Dennis 2005; Johansen 2004; Olofsson 2007) and one trial (Hickson 2004) reported the number of participants receiving oral antibiotics. There were no marked between‐group differences in any of the trials (Table 11).
Secondary outcomes
Nutritional status
Weight change
Data on this outcome were reported in 10 of 13 trials (Duncan 2006; Hickson 2004; Holyday 2012; Johansen 2004; Kraft 2012; Lin 2010; Olofsson 2007; Pivi 2011; Salva 2011; Splett 2003) (Table 12).
Two trials evaluated the impact of dietetic assistants in a hospital setting (Duncan 2006; Hickson 2004) and there were no marked differences in mean weight change between groups in either trial. One trial used specialist training in a residential care setting (Lin 2010) and there was no marked difference in mean weight change between the two groups. Two trials looked at specialist training for carers of free‐living individuals with dementia (Pivi 2011; Salva 2011). In one trial the intervention group experienced a small weight gain of 1.2 kg whereas the usual care experienced a small weight loss of 2.2 kg (Pivi 2011). In the other trial (Salva 2011) there was no marked difference between the two groups in mean weight change. Two trials reported weight change for interventions consisting of a multi‐disciplinary team approach to nutritional care (Johansen 2004; Olofsson 2007) and reported no marked differences between groups receiving intervention and those receiving usual care in either trial. One trial described a protocol‐driven pathway of nutritional care in hospital (Holyday 2012) and reported no marked differences in weight change between the groups receiving the intervention and usual care. Another trial reported data using a protocol‐driven care in a care home setting (Splett 2003). The authors did not report mean weight change but provided a narrative description of the proportions of participants maintaining or gaining weight. The percentage of participants maintaining or gaining weight during the trial was greater in the usual care group (57%) than in the intervention group (48%). One trial evaluated the impact of telemedicine in free‐living individuals and reported no marked difference between the groups in mean weight change (Kraft 2012).
Change in BMI
Data on this outcome were reported in seven of 13 trials (Hickson 2004; Kraft 2012; Lin 2010; Lin 2011; Olofsson 2007; Pivi 2011; Salva 2011): two trials of specialist training in a residential care setting (Lin 2010; Lin 2011), two of specialist training of free‐living individuals (Pivi 2011; Salva 2011), one of additional nutritional care from a trained health care assistant (Hickson 2004), one of multi‐disciplinary team care in hospital (Olofsson 2007) and one of telemedicine (Kraft 2012). There were no marked differences in BMI change between groups in six of the seven trials (Table 12). In one trial (Pivi 2011) participants receiving specialist training experienced an increase in BMI (1.2 kg/m² (SD 1) and participants in the usual care group experienced a reduction in BMI (‐2.2 kg/m2 (SD 1). However, the between‐group difference and statistical tests were not reported.
Change in TSF, MAMC and MUAC
Data on this outcome were reported in three of 13 trials (Duncan 2006; Hickson 2004; Pivi 2011). In the two trials that assessed the effects of using dietetic assistants in hospital (Duncan 2006; Hickson 2004) there were no marked differences in either TSF or MAMC between groups. In one trial (Hickson 2004) there was no marked difference in MAC between groups receiving assistance with eating and those receiving usual care, whereas in the other trial (Duncan 2006) the group that received assistance with eating had a smaller reduction in MAC (‐0.9 cm (SD 2.2)) compared with the group that received usual care (‐1.3 (SD 1.5), P < 0.002). One trial used specialist training in free‐living individuals (Pivi 2011) and reported improvements in MAC in the intervention group of 1.9 cm (SD 2) compared with a reduction of 0.4 cm (SD 0.5) in the group receiving usual care, and no marked difference between the groups in TSF.
Overall the data across all interventions suggest that there is minimal impact on weight change and body composition from changes to the organisation of nutritional care across different healthcare settings.
Clinical function
Data on this outcome were reported in three of 13 trials (Duncan 2006; Hickson 2004; Salva 2011). The trials by Duncan 2006 and Hickson 2004 both assessed the effect of assistance with eating in people in hospital on handgrip strength. There were no marked differences in handgrip strength between the intervention and usual care groups in either trial (Table 13). The trial by Hickson 2004 also assessed functional recovery in participants using the Barthel score. There was no marked difference between groups' initial assessment to discharge from hospital (median score 2.0 (IQR 0 to 5) in the group receiving feeding assistance and 1.0 (IQR 0 to 4), P = 0.23 in the group receiving usual care). The trial by Salva 2011 measured change in ADL (Katz 1963), and iADL (Lawton 1969) in free‐living individuals with dementia who had received specialist training on nutrition. There were no marked differences between the groups in either ADL or iADL at six and 24 months' follow‐up.
Hospitalisation and institutionalisation
Data were reported on length of hospital stay in five of 13 trials (Duncan 2006; Hickson 2004; Holyday 2012; Johansen 2004; Olofsson 2007). Two trials evaluated the impact of dietetic assistants in a hospital setting (Duncan 2006; Hickson 2004), two evaluated a multi‐disciplinary team intervention in hospital (Olofsson 2007; Johansen 2004) and one evaluated a protocol‐driven pathway in hospital (Holyday 2012). There were no marked differences between groups in length of hospital stay in four trials (Duncan 2006; Hickson 2004; Holyday 2012; Johansen 2004). In the other trial (Olofsson 2007) the group receiving a multidisciplinary team intervention had a shorter mean length of hospital stay than the group receiving usual care (27.4 days (SD 15.9) in the intervention group and 39.8 days (SD 41.9) in the usual care group (P < 0.05) (Table 14). Data on hospital readmissions were reported in one of 13 trials (Holyday 2012). The group receiving a protocol‐driven pathway for the management of nutrition whilst in hospital had fewer hospital readmissions than the group receiving usual care (30/71 (42%) versus 37/72 (51%) respectively) but the difference between the groups was not statistically significant.
Adverse events
No trial reported data on this outcome.
All‐cause mortality
Data were reported on this outcome in five of 13 trials (Duncan 2006; Hickson 2004; Holyday 2012; Olofsson 2007; Salva 2011). Two trials evaluated the impact of dietetic assistants in a hospital setting (Duncan 2006; Hickson 2004), one evaluated specialist training for free‐living individuals with dementia (Salva 2011), one evaluated a multi‐disciplinary team intervention in hospital (Olofsson 2007) and one evaluated a protocol‐driven pathway in hospital (Holyday 2012). There were no marked differences between groups in mortality in four trials (Hickson 2004; Holyday 2012; Olofsson 2007; Salva 2011), whereas in the other trial (Duncan 2006) there was a lower mortality at four months in the group receiving the intervention from dietetic assistants compared with the group receiving usual care (19/145 (13%) versus 36/157 (23%), P = 0.036) (Table 14).
Economic costs
Data on this outcome were reported in two of 13 trials (Holyday 2012; Salva 2011). One trial (Holyday 2012) evaluated the impact of a protocol‐driven pathway for the management of nutritional care in hospital patients and the other trial (Salva 2011) evaluated specialist training for carers of free‐living individuals with dementia. In one trial (Holyday 2012) the data on cost savings are based on reductions in length of stay achieved. There was no marked difference in length of stay overall between groups. There was a shorter length of stay by eight days in the subgroup of 32 malnourished participants (12 in the intervention group and 20 in the usual care group). These data were used to estimate a cost savings of AUD 63,360 from treating malnutrition in the group of 12 malnourished participants based on the cost per hospital bed per day, the cost of the dietitians' time and the average cost of a commercial oral nutritional supplement. The trial by Salva 2011 collected data on resource utilisation but the data were not reported. Neither trial used accepted health economic methods and the reported data on both costs and effectiveness were generally poor.
Changes to the feeding environment
Primary outcomes
Nutritional intake
Data were reported on energy intake in three of five trials (Brouillette 1991; Mathey 2001a; Nijs 2006). Two trials evaluated the impact of changes to the dining room environment (Mathey 2001a; Nijs 2006) and one evaluated a pre‐meal sensory stimulation intervention (Brouillette 1991). All trials assessed energy intake and were conducted in people in residential care. There were no marked between‐group differences in energy intake in any trial (Table 15).
Health‐related quality of life and patient satisfaction
Data were reported on health‐related quality of life in two of five trials (Mathey 2001a; Nijs 2006). One trial (Mathey 2001a) used the Sickness Impact Profile (SIP) (Gilson 1975), and Philadelphia Geriatric Center Morale Scale (PGCMS, 17 items) (Lawton 1972) to assess health‐related quality of life.The SIP is a validated generic health status measure of change in behaviour as a consequence of illness . It includes 136 items describing activities of daily living (ADL), divided into 12 categories: sleep and rest, eating, work, home management, recreation and pastimes, ambulation, mobility, body care and movement, social interaction, alertness behaviour, emotional behaviour, and communication. Patients endorse statements that best describe them that day and are related to their health. Items are scored on a numeric scale, with higher scores reflecting greater dysfunction. The mean SIP score in the usual care declined more (‐13% (SD 12), P < 0.05) than in the experimental group (‐2% (SD 11)). The PGCMS is a multidimensional approach to assessing the state of psychological well‐being of older people. It measures perceived morale in elderly people through three factors: agitation, attitude toward own aging and 'lonely satisfaction'. Each high‐morale response receives a score of '1' and each low‐morale response a score of '0', so that the total score ranges from 0 to17. As a general guideline, scores between 13 to17 would be considered high scores on the morale scale, 10 to 12 fall within the mid‐range and scores under 9 are at the lower end. Mean changes in the PGCMS scores were relatively stable for both groups with ‐2% (SD 19) for the usual care, and ‐3% (SD 20) for the experimental group. In the trial by Nijs 2006, health‐related quality of life was assessed in a face‐to‐face interview using the Dutch health‐related quality of life of somatic nursing home residents questionnaire which is a validated questionnaire consisting of five sub‐scales, each representing a quality of life dimension: sensory functioning (focusing on pain); physical functioning (perceived performance and self‐care); psychosocial functioning (depression or loneliness); perceived autonomy (freedom of movement); and perceived safety (feeling at home in the institution). The number of statements in the five sub‐scales is not equal. The questionnaire consists of 50 statements, scored on a dichotomous scale (yes or no). Each sub‐scale and the total questionnaire is computed to achieve a score from 0 to 100. A high score represents a high quality of life. There was a difference between groups in overall quality of life (6.1 units, 95% CI 2.1 to 10.3). The intervention group remained stable (0.4 units, 95% CI 1.8 to 2.5), whereas the usual care declined (‐0.5 units, 95% CI ‐9.4 to 0.6), although the overall changes were small (Table 16).
No trial reported data on patient satisfaction.
Morbidity/complications
No trial reported data on this outcome.
Secondary outcomes
Nutritional status
Weight change
Data were reported on this outcome in three of five trials (Mathey 2001a; Nijs 2006; Remsburg 2001), all of which were trials evaluating the impact of changes to the dining environment. There were no marked differences between intervention and usual care groups in mean weight change in any of the trials (Table 17).
Change in BMI
No trial reported data on this outcome.
Change in TSF
No trial reported data on this outcome.
Change in MAC
Data were reported on this outcome in one of five trials (Nijs 2006). The trial evaluated the impact of providing family‐style meals in residential care homes. There was no marked difference in change in MAC between the groups, MD between groups was 0.5 cm (95% CI ‐0.2 to 1.3)
Clinical function
No trial reported data on this outcome.
Hospitalisation and institutionalisation
No trial reported data on this outcome.
Adverse events
No trial reported data on this outcome.
All‐cause mortality
Data were reported on this outcome in three of five trials (Brouillette 1991; Mathey 2001a; Nijs 2006). Two evaluated the impact of changes to the dining room environment (Mathey 2001a; Nijs 2006) and one of pre‐meal sensory stimulation (Brouillette 1991). There were no marked differences between groups in death from any cause in any trial (Table 18).
Economic costs
No trial reported data on this outcome.
Modification of meal profile or pattern
Primary outcomes
Nutritional intake
Data were reported on energy intake in 11 of 12 trials (Barton 2000; Bouillanne 2013; Castellanos 2009; Essed 2007; Essed 2009; Germain 2006; Leslie 2012; Mathey 2001b; Munk 2014; Silver 2008; Taylor 2006). Four trials evaluated the impact of food fortification, two in hospital (Barton 2000; Munk 2014), one in a care home (Leslie 2012) and one in free‐living individuals receiving home‐delivered meals (Silver 2008), one trial evaluated the impact of modifications to meal delivery in an intermediate care home (Bouillanne 2013), two trials evaluated modifications to meal delivery in residential care homes (Germain 2006; Taylor 2006), and three evaluated flavour modification in residential care homes (Essed 2007; Essed 2009; Mathey 2001b). There were no marked differences in mean change in energy intake between groups in five trials (Bouillanne 2013; Essed 2007; Essed 2009; Mathey 2001b; Taylor 2006). Three trials reported higher energy intakes in the intervention group of between 300 to 500 kcal/day, two of which were trials of food fortification in either hospital or in free‐living individuals (Barton 2000; Silver 2008) and one was of a modification to meal delivery involving improved presentation of pureed foods to participants with dysphagia (Germain 2006). In the randomised cross‐over trial by Castellanos 2009, between‐group differences were not reported however data were presented for a post hoc analysis of 'big' eaters (overall intake 1150 kcal or more a day) and 'small' eaters (overall intake less than 1150 kcal a day) (data not reported in the table). Data were presented as mean intake from both fortified and non‐fortified food items at each meal under each of three menu conditions (Table 19).
Health‐related quality of life and patient satisfaction
Data on health‐related quality of life were reported in one trial (Smoliner 2008). The physical functioning component of the validated medical outcomes Study 36‐item Short Form (SF‐36 ) were reported (Ware 1992). The SF‐36 is a participant‐completed validated questionnaire to assess eight different domains of health (vitality, physical functioning, bodily pain, general health perception, physical function, emotional role function, social role function and mental health). The SF‐36 consists of eight scaled scores, which are the weighted sums of the questions in their section. Each scale is directly transformed into a 0 to 100 scale on the assumption that each question carries equal weight. The lower the score the poorer the quality of life. The higher the score the better the quality of life, that is, a score of zero is equivalent to poorest quality of life and a score of 100 is equivalent to optimal quality of life.
Baseline to follow‐up (12 weeks) score in the intervention group receiving the fortified diet changed from a mean of 17.1 (SD 22.7) at baseline to a mean of 10.7 (SD 15.6) at 12 weeks (P = 0.047), and in the usual care from 24 (SD 24.3) at baseline to 13.6 (SD 13.9) at 12 weeks (P < 0.0001), however the between‐group differences were not statistically significant.
No trial reported data on patient satisfaction.
Morbidity/complications
Data on the number of participants experiencing complications were reported in one of twelve trials (Bouillanne 2013) which evaluated the impact of modifications to meal composition in people in intermediate care. There was no marked difference between the intervention and usual care in the number of infectious complications experienced by participants included in the intention‐to‐treat analysis (1 of 29 participants in the intervention group and 2 of 34 participants in the usual care group).
Secondary outcomes
Nutritional status
Weight change
Data on this outcome were reported in seven of 12 trials (Bouillanne 2013; Essed 2007; Germain 2006; Leslie 2012; Mathey 2001b; Munk 2014; Smoliner 2008). Three trials evaluated the impact of food fortification, one in hospital (Munk 2014) and two in a residential care home (Leslie 2012; Smoliner 2008), one evaluated modification to meal composition in an intermediate care setting (Bouillanne 2013), one evaluated modifications to the presentation of food in a residential care home (Germain 2006) and two evaluated flavour modifications in residential care homes (Essed 2007; Mathey 2001b). There were no marked differences in mean weight change between groups reported in three trials (Bouillanne 2013; Essed 2007; Smoliner 2008). Three trials reported higher weight gain in the intervention group compared with the usual care. One was a trial of food fortification in residential care (Leslie 2012) (1.3 kg (SE 0.53) in the intervention group versus ‐0.2 kg (SE 1.5) in the control group, P = 0.03. The second was a trial of modification to meal presentation (Germain 2006) (3.9 kg (SD 2.3) in the intervention group versus ‐0.8 kg (SD 4.2) in the usual care. The other trial evaluated the impact of flavour enhancement in people in a residential care home (Mathey 2001b) (1.1 kg (SD 1.3) in the intervention group versus ‐0.3 (1.6) in the usual care, P < 0.05) (Table 20).
Change in BMI
Data on this outcome were reported in three of 12 trials (Germain 2006; Leslie 2012; Smoliner 2008). One evaluated the impact of modification to meal presentation in people in residential care (Germain 2006) and the others evaluated food fortification in people in residential care (Leslie 2012; Smoliner 2008). In one trial (Smoliner 2008) there was no marked difference between the groups in change in BMI. The group receiving modification to the presentation of meals in Germain 2006 and the group receiving fortified meals in Leslie 2012 experienced a greater increase in BMI than those receiving usual care but the between‐group difference was not reported (Table 20).
Change in TSF
No trial reported data on this outcome.
Change in MAC
One trial of meal fortification in people in residential care reported data on this outcome (Leslie 2012). Participants in the intervention group experienced a greater improvement in MUAC than those in the control group (mean change 0.4 mm (SE 0.16) in the intervention group and ‐0.1 mm (SE 0.3) in the control group, P = 0.019.
Clinical function
Data on handgrip strength were reported in three of 12 trials (Bouillanne 2013; Munk 2014; Smoliner 2008). One trial evaluated the impact of modification to meal composition in people in intermediate care (Bouillanne 2013) and the others evaluated food fortification in people in hospital (Munk 2014) and in residential care (Smoliner 2008). There were no differences between the intervention and usual care groups in either trial (Table 21). The trial by Bouillanne 2013 also assessed change in ADL score (Sonn 1996) and there was no marked difference between the groups (Table 21). In the trial by Smoliner 2008 clinical function was also assessed by peak flow and the Barthel index .The peak flow (L/min) in the intervention group increased from baseline to follow‐up (12 weeks) in the intervention group (mean 152 (SD 105) to 186 (SD 140)) whereas the usual care group showed a decline (mean 151 (SD 90) to 150 (SD 67)). The differences observed between groups were statistically significant (P = 0.039). The mean change in Barthel score was ‐15.2 (SD 18.5) in the group receiving fortification of food and ‐7.5 (SD 10.4) in the group receiving usual care. The between‐group differences were not statistically significant.
Hospitalisation and institutionalisation
One trial of food fortification of menu items provided via an a la carte menu reported data on length of hospital stay (Munk 2014). There were no differences in mean length of stay between groups in from trial inclusion to discharge from hospital (mean 10 days (SD 8) in the intervention group and mean 10 days (SD 8) in the control group, between‐group difference, 0.6 days (95% CI ‐3 to 4, P = 0.73).
Adverse events
No trial reported data on this outcome.
All‐cause mortality
Data on this outcome were reported in four of 12 trials (Bouillanne 2013; Leslie 2012; Munk 2014; Smoliner 2008). The number of deaths were small in each trial and there were no marked differences between groups (Table 21).
Economic costs
No trial reported data on this outcome.
Additional supplementation of meals
Primary outcomes
Nutritional intake
Data were reported on energy intake in eight of 10 trials (Beck 2002; Bourdel‐Marchasson 2000; Faxen‐Irving 2011; Hankey 1993; Potter 2001; Simmons 2008; Simmons 2010; Van den Berg 2015). Three trials evaluated the impact of supplementation with food in residential care homes (Beck 2002; Simmons 2008; Simmons 2010), four evaluated supplementation with oral nutritional supplements in hospital (Bourdel‐Marchasson 2000; Faxen‐Irving 2011; Potter 2001; Van den Berg 2015) and two evaluated supplementation with oral nutritional supplements in residential care homes (Hankey 1993; Simmons 2010). One trial provided both a food‐based intervention and oral nutritional supplements in participants in residential care homes (Simmons 2010). There were no marked differences reported in energy intake between groups in either the trials of food‐based interventions or the trials of oral nutritional supplement‐based interventions (Table 22). In the trial by (Hankey 1993) the group receiving oral nutritional supplements had an energy intake 600 kcal greater than the usual care group (1747 kcal (SD 273) versus 1147 kcal (SD 310) respectively), However, between‐group statistical tests were not reported. In the trial by Van den Berg 2015 participants receiving oral nutritional supplements in four 62 mL portions during the drug round had a significantly higher energy intake than those receiving supplements in the conventional, between‐meal style.
Health‐related quality of life and patient satisfaction
Data on health‐related quality of life were reported in one trial (Dennis 2005) undertaken in people with stroke supplemented with oral nutritional supplements during hospitalisation. Health‐related quality of life was measured in 77% (N = 3086) of participants using EUROQoL score (EQ‐5D) (EuroQol group 1990). The questionnaire comprises five questions on mobility, self‐care, pain, usual activities and psychological status with three possible answers for each item (1 = no problems, 2 = moderate problems, 3 = severe problems). An overall utility score is calculated based on these domains, with a range score from 0 (worse health scenario) to a maximum of 1.0 (best health scenario). An additional visual analogue scale (VAS, scale 0 to 100) was used to assess general health status with 100 indicating the best health status. No marked differences were identified between the intervention and usual care groups (Table 23).
No trial reported data on patient satisfaction.
Morbidity/complications
The incidence of, and number of people with, pressure ulcers was reported in two trials (Bourdel‐Marchasson 2000; Dennis 2005) and the total number of complications was reported in one trial (Dennis 2005). Both trials were of supplementation of participants with oral nutritional supplements in hospital. There was no marked difference between groups in cumulative incidence of, or number of participants with, pressure ulcers in either trial (Table 23). In the trial by Dennis 2005 there was no marked difference in total complications between groups (Table 23).
Secondary outcomes
Nutritional status
Weight change
Data on this outcome were reported in seven of 10 trials (Beck 2002; Faxen‐Irving 2011; Hankey 1993; Larsson 1990; Potter 2001; Simmons 2008; Simmons 2010). Three trials evaluated the impact of supplementation with food in residential care settings (Beck 2002; Simmons 2008; Simmons 2010), two evaluated supplementation with oral nutritional supplements in hospital (Faxen‐Irving 2011; Potter 2001) and three evaluated supplementation with oral nutritional supplements in long‐term care settings (Hankey 1993; Larsson 1990; Simmons 2010), with the trial by Simmons 2010 providing data on both food and oral nutritional supplements. There were no marked differences in weight change between groups receiving food‐based or oral nutritional supplement‐based interventions in six trials (Beck 2002; Faxen‐Irving 2011; Hankey 1993; Larsson 1990; Potter 2001; Simmons 2010). In two trials (Faxen‐Irving 2011; Hankey 1993), the groups receiving oral nutritional supplements gained weight and the usual care group lost weight overall. However, the between‐group differences and the results of statistical tests were not reported. In one trial (Simmons 2008) the intervention group gained 4 lbs more in weight than the group receiving usual care (P = 0.009) (Table 24).
Change in BMI
Data on this outcome were reported in two of 10 trials (Faxen‐Irving 2011; Simmons 2008), both trials evaluated the impact of supplementation with oral nutritional supplements in hospital. In one trial (Faxen‐Irving 2011) BMI was reported according to group at the end of the intervention and there was no marked difference between groups. Change from baseline and between‐group differences were not reported. In the other trial by (Simmons 2008) the intervention group gained 0.72 kg/m² more than the group receiving usual care (P < 0.009) (Table 24).
Change in TSF
Data on this outcome were reported in two of 10 trials (Hankey 1993; Larsson 1990), both of which evaluated the impact of supplementation with oral nutritional supplements in long‐term care settings. In each trial data were presented in figures with minimal description in the text. In one trial (Hankey 1993) the intervention group was described as experiencing a smaller decrease in TSF than the usual care group (6.6% versus 15.8%). In the other trial (Larsson 1990) TSF decreased over the 26 weeks of follow‐up with the greatest decrease occurring in the usual care group. In another trial (Potter 2001) TSF is described as an outcome but the data were not reported.
Change in MACe
Data on this outcome were reported in three of 10 trials (Hankey 1993; Larsson 1990; Potter 2001), all of which evaluated the impact of supplementation with oral nutritional supplements in either hospital or long‐term care settings. In one trial (Hankey 1993), the data were unavailable from the original trial report but we have obtained them from a systematic review by Milne 2009. We read the figures for change from a graph and assumed SD of change to be 10 cm for each group. MAC is described as improving statistically significantly in the intervention group (P < 0.05) but remaining unchanged in the usual care group. The changes are small and no between‐group differences were reported (Table 24). In the trial by Larsson 1990 the data were presented in a figure with some description in the text, participants who were well nourished at the start of the trial and received supplementation of meals experienced less of a decrease in MAC at 26 weeks (P < 0.05) than those receiving usual care. In participants who were malnourished at the start of the trial both groups experienced a decrease in MAC to 26 weeks. In the final trial (Potter 2001), there was no marked difference between groups in MAC (Table 24).
Clinical function
Data on clinical function were reported in two of ten trials (Faxen‐Irving 2011; Potter 2001), both evaluating the impact of supplementation with oral nutritional supplements in hospital. In one trial (Faxen‐Irving 2011) the group receiving oral nutritional supplements changed from being dependent in all five functions to being dependent in only one function as assessed by ADL (Katz 1963). However, no marked change was identified in those receiving usual care (P = 0.011). Mean change (SD) in ADL score according to group was not markedly different between groups (2.95 (SD 2.2) intervention and 4.1 (SD 2.2) control, P = 0.09). In the other trial (Potter 2001) there was no statistically significant difference in numbers achieving functional recovery assessed using the Barthel index in the group receiving supplementation compared with the usual care group (102/149 (68%) intervention versus 100/157 (64%) control, P = 0.38). However, significantly more participants classified as severely undernourished experienced an improvement in their Barthel scores on supplementation compared with those who received usual care (17/25 (68%) intervention versus 11/28 (39%) control, P < 0.04).
Hospitalisation and institutionalisation
Data on length of hospital stay were reported in four of 10 trials (Dennis 2005; Faxen‐Irving 2011; Potter 2001; Van den Berg 2015) all of which evaluated the impact of supplementation of meals with oral nutritional supplements in hospital. There were no marked differences in length of hospital stay between groups in any trial (Table 25).
One trial of supplementation with oral nutritional supplements in hospital reported data on hospital re‐admissions (Van den Berg 2015). The number of re‐admissions to hospital were higher in intervention group 2, but these data were not commented on by the trial authors (13 participants in intervention group 1, 24 participants in intervention group 2 and 15 participants in the control group being readmitted to hospital). One trial reported on the destination of participants at discharge according to group allocation (Potter 2001). There was no marked difference between groups in numbers of participants returning to their own home and those being discharged to an institution (Table 25).
Adverse events
Data on this outcome were reported in three of nine trials (Faxen‐Irving 2011; Hankey 1993; Dennis 2005), one of which reported intolerance to the oral nutritional supplement (e.g. diarrhoea or vomiting, N = 5) (Faxen‐Irving 2011). Another trial (Dennis 2005) reported that 28% stopped taking the oral nutritional supplement due to participant refusal or because of dislike of taste, unwanted weight gain, or feelings of nausea. The trials by Potter 2001 and Van den Berg 2015 reported no adverse events.
All‐cause mortality
Data on this outcome were reported in five of 10 trials (Bourdel‐Marchasson 2000; Dennis 2005; Larsson 1990; Potter 2001: Van den Berg 2015). Four trials evaluated the impact of supplementation with oral nutritional supplements in hospital (Bourdel‐Marchasson 2000; Dennis 2005; Potter 2001; Van den Berg 2015 ) and one evaluated supplementation with oral nutritional supplements in a long‐term care setting (Larsson 1990;). There was no marked difference in death from any cause between groups in any of the trials (Table 25).
Economic costs
Data on this outcome were reported in one trial (Simmons 2010). The cost effectiveness of the intervention was determined from data on cost per serving of the oral nutritional supplement or food provided and staff time to encourage and assist consumption. The average costs (per person per day) were significantly higher in groups receiving supplements and snacks compared with those in the usual care group (USD 2.10 versus USD 2.06 versus USD ‐0.03 respectively). The trial did not use accepted health economic methods and the reported data on both costs and effectiveness were generally poor.
Home meal delivery systems
Primary outcomes
Nutritional intake
No trial data were reported on this outcome.
Health‐related quality of life and patient satisfaction
No trial data were reported on this outcome.
Morbidity/complications
No trial data were reported on this outcome.
Secondary outcomes
Nutritional status
Weight change
Data on this outcome were reported in the one trial in this group (Kretser 2003). The group receiving modified meals‐on‐wheels experienced a weight gain of 1.6 kg (SD 4.6) compared to the group receiving standard meals‐on‐wheels who had an overall weight gain of 0.7 kg (SD 3.3) (Table 26). No statistical tests were conducted on the between‐group differences.
Change in BMI
No trial data were reported on this outcome.
Change in TSF
No trial data were reported on this outcome.
Change in MAC
No trial data were reported on this outcome.
Clinical function
The one trial in this group reported data on ADL and iADL (Kretser 2003). No marked differences were identified in the number experiencing a decline (4/22 versus 8/24) or improvement (3/22 versus 2/24) in ADL between groups receiving modified meals‐on‐wheels, and groups receiving traditional meals‐on‐wheels. However, there was a greater number of participants experiencing a decline in iADL in those receiving traditional meals on wheels (16/24 ) compared with those receiving modified meals on wheels (8/22) at six months (P = 0.0494).
Hospitalisation and institutionalisation
No trial data were reported on this outcome.
Adverse events
No trial data were reported on this outcome.
All‐cause mortality
Data on this outcome were reported in the one trial in this group (Kretser 2003). The number of deaths from any cause were similar in each group (Table 26 ). No statistical tests were conducted on the between‐group differences.
Economic costs
No trial reported data on this outcome.
Discusión
Resumen de los resultados principales
El objetivo de esta revisión fue investigar el efecto de las intervenciones de apoyo para mejorar la ingesta de alimentos en adultos nutricionalmente vulnerables sobre resultados nutricionales, clínicos y económicos centrados en el paciente. Se identificaron 41 ensayos que se categorizaron en cinco tipos de intervenciones muy similares. El metanálisis sólo fue posible para las medidas de resultado mortalidad por todas las causas, hospitalización y estado nutricional (cambio en el peso), y mostró un posible efecto a favor de las intervenciones de apoyo nutricional en la mortalidad por todas las causas y el estado nutricional. Estos resultados se deben interpretar con cuidado porque pocos ensayos informaron datos sobre los resultados de interés, y la calidad de las pruebas fue moderada a muy baja, según la medición del resultado. Varios resultados importantes para los pacientes se midieron en sólo unos pocos ensayos, por ejemplo, la calidad de vida relacionada con la salud y la satisfacción del paciente. Con respecto a la calidad de vida relacionada con la salud sólo uno de los cinco ensayos que informaron este resultado indicó efectos beneficiosos asociados con la intervención. Aunque los dos ensayos que midieron la satisfacción del paciente informaron efectos beneficiosos en los que recibieron la intervención se debe señalar que ambos ensayos utilizaron cuestionarios no validados y están potencialmente sujetos a las limitaciones inherentes a la obtención de estos tipos de datos, por ejemplo, la necesidad de los participantes de estar alfabetizados para responder el cuestionario, y el cegamiento puede no ser posible.
Hasta que haya ensayos más grandes de mayor calidad metodológica, que evalúen la repercusión de intervenciones similares en grupos similares de pacientes, no es posible evaluar completamente los efectos de las intervenciones de apoyo sobre resultados nutricionales, clínicos, centrados en el paciente y de la asistencia sanitaria.
Compleción y aplicabilidad general de las pruebas
Los ensayos identificados en esta revisión representan una amplia variedad de intervenciones administradas con la intención de mejorar la ingesta en individuos nutricionalmente vulnerables. Las intervenciones tuvieron lugar en diversos contextos, atención residencial, en el hospital y de pacientes ambulatorios. Aunque 21 de los 41 ensayos incluidos se realizaron en la atención residencial, los resultados de los metanálisis estuvieron dominados por los ensayos grandes realizados en hospitales. Es particularmente importante considerar que es probable que la relevancia de los diferentes resultados difiera entre los contextos; la mayoría de los datos del resultado mortalidad por todas las causas provinieron de ensayos que reclutaron pacientes hospitalizados. Muchas de las intervenciones identificadas fueron similares a las que se recomiendan en los documentos sobre políticas y normativos para la prevención y el tratamiento de la desnutrición (BAPEN 2012; RCON 2008; The Malnutrition Task Force 2013). A pesar de la amplia variedad de intervenciones identificadas en esta revisión, no se encontraron ECA de algunas intervenciones ampliamente utilizadas, específicamente los horarios de comida protegidos y el uso de señales de alerta para identificar a los pacientes que requieren ayuda durante las horas de comida. Los ejemplos de buenas prácticas informadas en estos documentos clave (BAPEN 2012; RCON 2008; The Malnutrition Task Force 2013) a menudo se justifican sobre la base de su posible repercusión sobre la experiencia de los pacientes y sobre la concientización y la motivación del personal. Estos tipos de resultados muy pocas veces se informan en los ensayos, por lo que no se incluyen en las revisiones sistemáticas y los metanálisis. El hallazgo clave de esta revisión es que hay una falta de pruebas para apoyar estas intervenciones y se necesitan urgentemente ECA de buena calidad para informar la implementación generalizada de estas iniciativas. Aunque hay pruebas limitadas sobre los eventos adversos, en general se supone que las intervenciones nutricionales son seguras. Sin embargo, no se ha evaluado la repercusión de implementar y mantener dichas intervenciones a nivel institucional y de unidad. Por ejemplo, es probable que haya costos significativos en cuanto a las finanzas, el tiempo y los recursos asociados con poner en marcha y mantener un programa de entrenamiento del personal; no obstante, estos datos se informan pocas veces. En esta revisión se encontraron datos muy limitados sobre los costos y no hubo un análisis económico de salud formal a partir del cual establecer conclusiones.
Durante las búsquedas para esta revisión se identificaron varios ensayos que cumplieron los criterios de inclusión para los tipos de participantes y las intervenciones, pero que fueron ensayos no aleatorios. Las razones del uso de una metodología más débil en muchos ensayos pueden ser sólo especulativas y se puede deber a la falta de financiamiento, la falta de pericia en investigación, las inquietudes por aspectos éticos al no proporcionar a todos los pacientes una intervención que se percibe como "beneficiosa", y los aspectos prácticos relacionados con el contexto de atención. Lo anterior subraya la necesidad de un financiamiento suficiente de los ensayos con diseños más consistentes (p.ej. ensayos controlados aleatorios grupales con planificación, análisis y datos adecuados, especialmente sobre los coeficientes de correlación intragrupo) para permitir una comprensión más completa de la posible repercusión de las intervenciones de apoyo.
Calidad de la evidencia
La calidad de las pruebas en esta revisión fue moderada a muy baja, según la medición del resultado. El problema principal con respecto al riesgo de sesgo fue que, aunque en general la deserción se informó claramente y hubo pocas pruebas de informe selectivo, con frecuencia la generación de la secuencia aleatoria, la ocultación de la asignación y el cegamiento no estuvieron claros. La mayoría de los ensayos fueron pequeños y no tuvieron un poder estadístico adecuado para responder la pregunta. Aunque el sesgo de realización fue significativo, la naturaleza de las intervenciones incluidas y los contextos en los que se realizaron, principalmente las residencias geriátricas y las salas de hospital, significa que es poco probable que los participantes de los brazos de atención habitual pudieran tener acceso a la intervención. Las posibles excepciones a lo anterior son los ensayos realizados por Pivi 2011 y Salva 2011, en los que se les proporcionó una intervención de entrenamiento a los cuidadores de los pacientes con enfermedad de Alzheimer que vivían en su domicilio. En este caso, podría haber sido posible que los cuidadores asignados al grupo de atención habitual buscaran la información proporcionada a los del grupo de intervención. Es interesante señalar que el tamaño del efecto en el ensayo realizado por Pivi 2011 fue significativamente diferente de los otros ensayos en ese grupo.
La realización de un metanálisis y del enfoque GRADE sólo fue posible para las medidas de resultado mortalidad por todas las causas, duración de la estancia hospitalaria y cambio en el peso. Estos resultados mostraron pruebas de calidad moderada (mortalidad por todas las causas, estado nutricional) y pruebas de calidad muy baja (hospitalización), principalmente debido al número pequeño de ensayos incluidos y a problemas de imprecisión e indireccionalidad, así como a la inconsistencia.
Sesgos potenciales en el proceso de revisión
El protocolo desarrollado antes de realizar esta revisión se siguió cuidadosamente durante todo el proceso y en particular durante el estadio de selección de los ensayos, en el que tres revisores participaron en la discusión detallada. La estrategia de búsqueda original para esta revisión fue exhaustiva; se efectuaron búsquedas en diez bases de datos que incluyeron bases de datos diferentes a las utilizadas con mayor frecuencia (Avenell 2001) y no hubo restricciones de idiomas en las búsquedas. Se realizaron búsquedas adicionales, por ejemplo búsquedas manuales en los resúmenes de reuniones, las listas de referencias de los ensayos identificados y búsquedas extensas en las listas de referencias de revisiones sistemáticas relevantes. Además, se hicieron esfuerzos considerables para contactar con los autores de los estudios incluidos, cuando se requirió la aclaración de datos o metodología. Sin embargo, no se realizaron encuestas a los autores de los estudios para identificar informes adicionales de ensayos que pueden haberse pasado por alto, lo que se debe reconocer como una posible fuente de sesgo.
Hubo heterogeneidad clínica considerable en todos los ensayos que contribuyeron a los hallazgos de esta revisión. En la etapa de selección de los ensayos y durante la categorización de los ensayos en subgrupos, se tomaron precauciones al agrupar los ensayos con intervenciones y poblaciones similares. Es posible que las intervenciones que se consideraron similares variaran según factores que actualmente no es posible identificar. Por ejemplo, los ensayos que evaluaron el adiestramiento de los cuidadores o los asistentes dietéticos para proporcionar una mejor asistencia nutricional dieron lugar a efectos diferentes que pueden ser atribuibles a varios factores como la calidad del adiestramiento, el nivel de atención proporcionada por los cuidadores individuales, las limitaciones en el contexto de atención, o de hecho a las características clínicas de las poblaciones de los ensayos. No fue posible realizar muchos de los análisis de subgrupos propuestos debido a la falta de datos. Además, 12 de los 41 ensayos (30%) incluidos en esta revisión fueron ensayos aleatorios grupales. Los métodos de análisis inadecuados utilizados en estos ensayos, que no lograron tomar en cuenta la probable semejanza de los participantes dentro de los grupos y la correlación de las observaciones dentro de los grupos, dio lugar a que estos ensayos se excluyeran de los metanálisis. No fue posible descartar la posibilidad de que la inclusión de los datos de estos 12 ensayos en los metanálisis pueda cambiar los resultados generales.
Acuerdos y desacuerdos con otros estudios o revisiones
Los autores están al tanto de cuatro revisiones publicadas de intervenciones similares (Cole 2012; Lambert 2010; Silver 2009; Weekes 2009), dos de los cuales utilizaron estrategias de búsqueda sistemática para identificar los ensayos (Cole 2012; Weekes 2009). Todas las revisiones consideraron grupos similares de intervenciones (p.ej. ayuda para la alimentación, cambios en el contexto de alimentación, entrenamiento del personal) y de hecho incluyeron algunos de los ensayos identificados en esta revisión. También incluyeron ensayos de calidad metodológica más deficiente (p.ej. ensayos controlados no aleatorios), que se excluyeron de esta revisión.
Una revisión (Weekes 2009) estableció conclusiones similares de que había una falta importante de pruebas para apoyar las intervenciones diseñadas para mejorar la atención nutricional. Las otras tres se centraron en los resultados positivos de los ensayos individuales.
Hasta donde se sabe, la presente revisión es el primer intento de realizar una revisión sistemática con metanálisis, y sus resultados muestran una falta de pruebas convincentes para las intervenciones de apoyo. Aunque el protocolo especificó medidas de resultado que se evalúan con frecuencia en los ensayos de intervención nutricional, los revisores se preguntan si estos son los resultados más apropiados para evaluar los efectos beneficiosos de las intervenciones de apoyo. Informes existentes de las intervenciones de apoyo similares a las identificadas en la presente revisión han especulado con respecto a los efectos beneficiosos relacionados con la experiencia del paciente y la concientización y motivación del personal. Estas pueden ser las medidas de resultado más relevantes para las intervenciones de este tipo, lo que puede explicar la falta de ensayos de intervenciones como el uso de señales de alerta o los horarios de comida protegidos, ya que la intención primaria fue mejorar la experiencia del paciente.
Sin embargo, los revisores señalan que el objetivo explícito de todos los ensayos incluidos en esta revisión fue aumentar la ingesta de alimentos, y por lo tanto influir en el resultado clínico.


Study flow diagram

Risk of bias summary: review authors' judgements about each risk of bias item for each included trial.

Risk of bias graph: review authors' judgements about each risk of bias item presented as percentages across all included trials.

Forest plot of comparison: 1 Supportive interventions for enhancing dietary intake versus comparators, outcome: 1.2 Nutritional status (weight change) (kg)

Forest plot of comparison: 1 Supportive interventions for enhancing dietary intake versus comparators, outcome: 1.4 All‐cause mortality

Comparison 1 Supportive interventions for enhancing dietary intake versus comparators, Outcome 1 No. of participants with complications.

Comparison 1 Supportive interventions for enhancing dietary intake versus comparators, Outcome 2 Nutritional status (weight change).

Comparison 1 Supportive interventions for enhancing dietary intake versus comparators, Outcome 3 Hospitalisation.

Comparison 1 Supportive interventions for enhancing dietary intake versus comparators, Outcome 4 All‐cause mortality.
| Supportive interventions compared with usual care for malnourished or nutritionally at‐risk adults | ||||||
| Population: malnourished or nutritionally at‐risk adults | ||||||
| Outcomes | Illustrative comparative risks* (95% CI) | Relative effect | No of participants | Quality of the evidence | Comments | |
| Usual care | Supportive interventions | |||||
| All‐cause mortality | 133 per 1000 | 107 per 1000 (92 to 124) | RR 0.78 | 6683 (12) | ⊕⊕⊕⊝ | ‐ |
| Morbidity/complications (number of participants with any medical complication) Follow‐up: duration of hospital stay to 6 months | See comment | See comment | See comment | 4015 (5) | ⊕⊝⊝⊝ | No summary effect size calculated because of high inconsistency; RR ranged from 0.59 in favour of supportive interventions to 1.42 in favour of usual care |
| Health‐related quality of life and patient satisfaction Follow‐up: duration of hospital stay to 12 months | See comment | See comment | See comment | 4451 (5) | ⊕⊕⊝⊝ | 5/41 trials investigated health‐related quality of life using different instruments in participants from a wide range of different clinical backgrounds; overall we noted no substantial differences between intervention and comparator groups 2/41 trials investigated patient satisfaction by means of an unvalidated questionnaire |
| Hospitalisation and institutionalisation (days) | The mean hospitalisation ranged across control groups from 10 days to 40 days | The mean hospitalisation in the intervention groups was | ‐ | 667 (5) | ⊕⊝⊝⊝ | 3/5 trials with data on hospitalisation were in the group of trials of 'Changes to the organisation of nutritional care' |
| Adverse events Follow‐up: 8 days to 6 months | See comment | See comment | See comment | 4108 (3) | ⊕⊝⊝⊝ | Only 3/41 trials reported on adverse events (all evaluating the impact of supplementation of meals with oral nutritional supplements); 1 trial reported intolerance to the supplement (diarrhoea, vomiting) in 3/34 (15%) of participants. In another large trial 565/2017 (28%) of stroke patients stopped taking the oral nutritional supplements because of refusal or dislike of taste |
| Nutritional status (weight change in kg) | The mean weight change ranged across control groups from ‐3.0 kg to +0.3 kg | The mean weight change in the intervention groups was +0.6 kg higher (0.2 kg to 1.0 kg higher) | ‐ | 2024 (17) | ⊕⊕⊕⊝ | ‐ |
| Economic costs Follow‐up: duration of hospital stay to 12 months | See comment | See comment | See comment | 1152 (3) | ⊕⊝⊝⊝ | 3/41 trials evaluated and 2/41 trials reported some data on economic costs; none of the trials used accepted health economic methods and the reported data on both costs and effectiveness were generally poor |
| *The basis for the assumed risk (e.g. the median control group risk across trials) is provided in footnotes. The corresponding risk (and its 95% confidence interval) is based on the assumed risk in the comparison group and the relative effect of the intervention (and its 95% CI). | ||||||
| GRADE Working Group grades of evidence | ||||||
| *aAssumed risk was derived from the event rates in the comparator groups (usual care) aDowngraded by one level because of risk of bias in several risk of bias domains | ||||||
| Supportive nutritional care intervention Broad intervention category | Examples |
| 1. Changes to the organisation of nutritional care |
|
| 2. Changes to the feeding environment |
|
| 3. Modification of meal profile or pattern |
|
| 4. Additional supplementation of meals |
|
| 5. Congregate and home meal delivery systems |
|
| Intervention(s) and comparator(s) | Screened/eligible | Randomised | ITT | Finishing trial | Randomised finishing trial | Follow‐up | |
| Barton 2000a2 | I1: reduced portion size, fortified menu | ‐ | 13 | ‐ | b | 70c | 56 days |
| I2: cooked breakfast | (8 not randomised) | ||||||
| C: normal hospital diet with usual portion size | 14 | ||||||
| total: | 27a | ‐ | ‐ | ||||
| Beck 2002a1 | I1: homemade oral supplement (A) | ‐ | ‐ | ‐ | ‐ | ‐ | 2 months |
| I2: homemade oral supplement (B) | |||||||
| C: usual diet | |||||||
| total: | 36 | ‐ | ‐ | ||||
| Bouillane 2013a1 | I: 78% protein at lunch | ‐ | 30 | ‐ | 30 | 88 | 6 weeks |
| C: usual diet (protein distributed between meals) | 36 | 23 | 79 | ||||
| total: | 66 | 63 | 96 | ||||
| Bourdel‐Marchasson 2000a3 | I: 2 oral nutritional supplements | 295 | ‐ | ‐ | ‐ | 15 days or until hospital discharge | |
| C: usual care | 377 | ||||||
| total: | 672 | ‐ | ‐ | ||||
| Brouillette1991a1 | I: osmotherapy + activities | ‐ | 10 | ‐ | 9 | 90 | 4 weeks |
| C: activities only | 10 | 7 | 70 | ||||
| total: | 20 | 16 | 80 | ||||
| Castellanos 2009a2 | I1: fortified breakfast and lunch menu | 39 | d | e | 2 days of the study | ||
| I2: fortified lunch menu | 39 | ||||||
| C: usual menu | 39 | ||||||
| total: | 39a | 33 | 85 | ||||
| Chang 2005a3 | I: training in feeding skills | ‐ | 31 | ‐ | 12 | 60 | Quote: "Data collection was from February 2004 to May 2004" Comment: implies 4 months of data collection, following training but not clearly stated |
| C: no training | 36 | 8 | 50 | ||||
| total: | 67 | 20f | 56 | ||||
| Dennis 2005a1 | I: oral nutritional supplement + normal diet | 2016 | ‐ | ‐ | ‐ | 6 months | |
| C: normal hospital diet | 2007 | ||||||
| total: | 4023 | ‐ | ‐ | ||||
| Duncan 2006a1 | I: dietetic assistant | 363 | 153 | ‐ | 145 | 95 | 4 months |
| C: usual care | 165 | 157 | 95 | ||||
| total: | 318 | 302 | 95 | ||||
| Essed 2007a4 | I1: monosodium glutamate | ‐ | ‐ | ‐ | 19 | N/A | 16 weeks |
| I2: flavour | 19 | ||||||
| I3: monosodium glutamate + flavour | 22 | ||||||
| C: maltodextrin (placebo) | 23 | ||||||
| total: | 97 | 83 | 86 | ||||
| Essed 2009a2 | I: monosodium glutamate + NaCl | ‐ | 59 | ‐ | 53 | 90 | 4 weeks |
| C: usual hot meal | 59 | 53 | 90 | ||||
| total: | 59a | 53 | 90 | ||||
| Faxen‐Irving 2011a1 | I: 30 mL of fat emulsion 3 x per day | 107 | 34 | ‐ | 24 | 71 | Median 8 days |
| C: usual care | 37 | 27 | 73 | ||||
| total: | 71 | 51 | 72 | ||||
| Gaskill 2009a3 | I: nutrition education programme | 377 | ‐ | ‐ | ‐ | ‐ | 6 months |
| C: usual care | |||||||
| total: | 352 | ‐ | ‐ | ||||
| Germain 2006a1 | I: re‐formed foods | 93 | 8 | ‐ | 7 | 88 | 12 weeks |
| C: usual diet | 9 | 8 | 89 | ||||
| total: | 17 | 15 | 88 | ||||
| Hankey 1993a1 | I: supplemented with nutritionally complete drink | ‐ | 10 | ‐ | 7 | 70 | 8 weeks |
| C: standard hospital food | 10 | 7 | 70 | ||||
| total: | 20 | 14 | 70 | ||||
| Hickson 2004a1 | I: feeding assistance | 1776 | 292 | 292 | 250 | 86 | Duration of hospital stay |
| C: usual care | 300 | 300 | 259 | 86 | |||
| total: | 592 | 592 | 509 | 86 | |||
| Holyday 2012a1 | I: malnutrition care plan | ‐ | 71 | 71 | 71 | 100 | Duration of hospital stay |
| C: usual care | 72 | 72 | 72 | 100 | |||
| total: | 143 | 143 | 143 | 100 | |||
| Johansen 2004a1 | I: nutrition team | 7468 | ‐ | ‐ | 108 | N/A | Duration of hospital stay |
| C: usual care | 104 | ||||||
| total: | 215 | 212 | 99 | ||||
| Kraft 2012a1 | I: oral nutritional supplement + telemedicine monitoring | 87/50 | 13 | 5 | 1 | 8 | 6 months |
| C: usual care | 13 | 9 | 4 | 31 | |||
| total: | 26 | 14 | 5 | 19 | |||
| Kretser 2003a1 | I: modified meals on wheels | 324 | 102 | ‐ | ‐ | ‐ | 26 weeks |
| C: traditional meals on wheels | 101 | ||||||
| total: | 203 | 60 | 30 | ||||
| Larsson 1990a1 | I: oral nutritional supplement + normal hospital diet | ‐ | 197 | ‐ | ‐ | ‐ | 26 weeks |
| C: normal hospital diet | 238 | ||||||
| total: | 435 | ‐ | ‐ | ||||
| Leslie 2012a3 | I: energy enriched usual meals | 445 | 22 | 16 | 73 | 12 weeks | |
| C: usual care | 19 | 16 | 84 | ||||
| total: | 41 | ||||||
| Lin 2010a3 | I1: spaced‐retrievalg | ‐ | 32 | ‐ | ‐ | ‐ | 8 weeks |
| I2: Montessorih | 29 | ||||||
| C: usual care | 24 | ||||||
| total: | 85 | 82 | 97 | ||||
| Lin 2011a2, a3 | I: Montessori | ‐ | ‐ | ‐ | ‐ | 8 weeks | |
| C: usual care | |||||||
| total: | 29a | 29 | 100 | ||||
| Mathey 2001aa3 | I: improved meal ambiance | 60 | 21 | ‐ | 12 | 57 | 12 months |
| C: usual care | 17 | 10 | 59 | ||||
| total: | 38 | 22 | 58 | ||||
| Mathey 2001ba1 | I: flavour enhancement | ‐ | ‐ | ‐ | 31 | N/A | 16 weeks |
| C: usual care | 36 | ||||||
| total: | 71 | 67 | 94 | ||||
| Munk 2014a1 | I: energy and protein enriched foods provided via a la carte menu in addition to hospital food | 44 | 41 | 96 | Duration of hospital stay | ||
| C: usual care | 40 | 40 | |||||
| total: | 84 | ||||||
| Nijs 2006a3 | I: family‐style meals | 282 | 133 | ‐ | 95 | 71 | 6 months |
| C: usual care | 112 | 83 | 74 | ||||
| total: | 245 | 178 | 73 | ||||
| Olofsson 2007a1 | I: multi‐component intervention (including nutrition) | 353 | 102 | ‐ | 83 | 81 | 4 months |
| C: usual care | 97 | 74 | 76 | ||||
| total: | 199 | 157 | 79 | ||||
| Pivi 2011a1 | I1: nutrition education | ‐ | ‐ | ‐ | 25 | N/A | 6 months |
| I2: oral nutritional supplements | 26 | ||||||
| C: usual care | 27 | ||||||
| total: | 90 | 78 | 87 | ||||
| Potter 2001a1 | I: oral nutritional supplement + normal hospital diet | 618 | 186 | ‐ | 186 | 100 | Duration of hospital stay |
| C: normal hospital diet | 195 | 195 | 100 | ||||
| total: | 381 | 381 | 100 | ||||
| Remsburg 2001a1 | I: buffet‐style meals | 62 | 20 | ‐ | 20 | 100 | 3 months |
| C: usual care | 20 | 19 | 95 | ||||
| total: | 40 | 39 | 98 | ||||
| Salva 2011a3 | I: teaching and training | ‐ | 448 | 448 | 300 | 67 | 12 months |
| C: usual care | 498 | 498 | 368 | 74 | |||
| total: | 946 | 946 | 668 | 71 | |||
| Silver 2008a2 | I: fortified home‐delivered lunch | ‐ | ‐ | ‐ | ‐ | ‐ | 7 months |
| C: usual home‐delivered lunch | |||||||
| total: | 52 | 45 | 87 | ||||
| Simmons 2008a2, a3 | I: feeding assistance and/or snacks | 173 | 30 | ‐ | 28 | 88 | 24 weeks |
| C: usual diet | 34 | 32 | 94 | ||||
| total: | 64a | ‐ | 60 | 94 | |||
| Simmons 2010a1 | I1: snacks | 280 | ‐ | ‐ | 25 | N/A | 6 weeks |
| I2: additional supplementation of meals | 18 | ||||||
| C: usual care | 20 | ||||||
| total: | 86 | 63 | 73 | ||||
| Smolliner 2008a3 | I: fortified meals and snacks | 295/92 | ‐ | ‐ | 22 | N/A | 12 weeks |
| C: usual diet | 30 | ||||||
| total: | 65 | 52 | 80 | ||||
| Splett 2003a3 | I: medical nutrition therapy | 394 | 223 | ‐ | 200 | 90 | 19‐180 days |
| C: usual care | 171 | 164 | 96 | ||||
| total: | 394 | 364 | 92 | ||||
| Taylor 2006a2 | I: 5‐meal menu | 66 | ‐ | ‐ | ‐ | ‐ | 2 periods of 4 days |
| C: usual (3‐meal menu) | |||||||
| total: | 31a | 31 | 100 | ||||
| Van den Berg 2015a1 | I1: offered 125 mL ONS daily with medication rounds | 885 | 88 | 75 | 85 | Maximum period 30 days | |
| I2: offered 62 mL ONS daily with medication rounds | 66 | 51 | 77 | ||||
| C: offered 125 mL ONS twice daily in between meals | 80 | 66 | 83 | ||||
| total: | 234 | ||||||
| Van Ort 1995a1 | I: contextual and behavioural intervention | 8 | ‐ | ‐ | ‐ | ‐ | 1 month to 6 weeks |
| C: usual care | |||||||
| total: | 8 | 7 | 88 | ||||
| Grand total | All interventionsj | ||||||
| All controlsj | |||||||
| All interventions and controls | 10,681 | ||||||
| a1Parallel RCT; a2cross‐over RCT; a3cluster RCT; a4 factorial RCT C: comparator; I: intervention; ITT: intention‐to‐treat | |||||||
| Outcome measure | No. of studies | No. of participants | Studies potentially with data for meta‐analysis |
| Energy intake | 5 | 666 | 1 |
| Health‐related quality of life | 1 | 220 | 0 |
| Patient satisfaction | 2 | 1105 | 0 |
| Complications | 4 | 1263 | 3 |
| Nutritional status: weight | 10 | 2184 | 9 |
| BMI | 7 | 1537 | 6 |
| TSF | 3 | 536 | 3 |
| MAC | 3 | 568 | 3 |
| Length of stay | 5 | 1256 | 3 |
| Hospital admission | 1 | 143 | 1 |
| Mortality | 5 | 2182 | 5 |
| Costs | 2 | 1089 | 0 |
| BMI: body mass index; MAC: mid‐arm circumference; TSF: triceps skinfold thickness | |||
| Outcome measure | No. of studies | No. of participants | Studies with data for meta‐analysis |
| Energy intake | 3 | 216 | 3 |
| Health‐related quality of life | 2 | 200 | 0 |
| Nutritional status: weight | 3 | 239 | 3 |
| MAC | 1 | 178 | 1 |
| Clinical function | 3 | 1664 | 2 |
| Mortality | 3 | 236 | 3 |
| MAC: mid‐arm circumference | |||
| Outcome measure | No. of studies | No. of participants | Studies potentially with data for meta‐analysis |
| Energy intake | 11 | 506 | 7 |
| Health‐related quality of life | 1 | 52 | 0 |
| Complications | 1 | 66 | 1 |
| Nutritional status: weight | 7 | 387 | 7 |
| BMI | 3 | 98 | 3 |
| MAC | 1 | 32 | 1 |
| Clinical function | 3 | 200 | 3 |
| Length of stay | 1 | 81 | 1 |
| Mortality | 4 | 243 | 4 |
| BMI: body mass index; MAC: mid‐arm circumference | |||
| Outcome measure | No. of studies | No. of participants | Studies potentially with data for meta‐analysis |
| Energy intake | 8 | 1469 | 7 |
| Health‐related quality of life | 1 | 4023 | 0 |
| Complications | 2 | 4695 | 1 |
| Nutritional status: weight | 7 | 605 | 4 |
| BMI | 2 | 102 | 1 |
| TSF | 2 | 0 | |
| MAC | 3 | 1 | |
| Clinical function | 2 | 618 | 0 |
| Length of stay | 4 | 4689 | 1 |
| Mortality | 5 | 5745 | 5 |
| Costs | 1 | 63 | 0 |
| BMI: body mass index; MAC: mid‐arm circumference; TSF: triceps skinfold thickness | |||
| Outcome measure | No. of studies | No. of participants | Studies included in the meta‐analysis |
| Energy intake | 27 | 2857 | 0 |
| Health‐related quality of life | 5 | 4495 | 0 |
| Patient satisfaction | 2 | 1105 | 0 |
| Complications | 7 | 6024 | 5 |
| Nutritional status: weight | 28 | 3618 | 24 |
| BMI | 12 | 1737 | 0 |
| TSF | 5 | ‐ | 0 |
| MAC | 8 | ‐ | 0 |
| Clinical function | 9 | 2746 | 0 |
| Length of hospital stay | 10 | 6026 | 5 |
| Hospital admissions | 2 | 389 | 0 |
| Mortality | 18 | 8690 | 17 |
| Economic costs | 3 | 1152 | 0 |
| BMI: body mass index; MAC: mid‐arm circumference; TSF: triceps skinfold thickness | |||
| Outcome | Reason the data were not usable | Contact with author | Outcome of contact with author | Action taken | |
| 1. Organisational change | |||||
| Chang 2005 | Energy intake | Data reported as amount eaten in ¼, ½, ¾ | Yes | No response | Data reported in structured narrative summary |
| Duncan 2006 | Complications | Reported as a median and IQR | Yes | Data provided | Data used |
| Length of stay | Reported as median and IQR | Yes | Confirmed data skewed | Data reported in structured narrative summary | |
| Gaskill 2009 | Measured prevalence of malnutrition with SGA | Not an outcome of interest for this review | Yes, to request weight data (a component of SGA) | Unable to provide data | Data not reported |
| Hickson 2004 | Energy intake | Not measured at baseline, only at follow‐up | Yes, to confirm interpretation of data | Data not measured at baseline | Data reported in structured narrative summary |
| Complications (antibiotic prescription) | Reported as median and IQR | Yes, to request complications according to group allocation | No. complications according to group allocation was provided | Data reported in structured narrative summary | |
| Hospital admission | States in protocol these are collected, but not reported | Yes, to request data | Author unable to recall what happened with data | Data not reported | |
| Holyday 2012 | Costs | An estimate based on local prices, not a complete cost analysis | No, judged unlikely to be available | N/A | Data not reported |
| Hospital admission | Presented as a frequency | Yes, to request total number of readmissions | Data provided | Data reported in structured narrative summary | |
| Johansen 2004 | Energy intake | Reported as kJ/kg/day | Yes, for mean change | No response | Data not reported |
| Kraft 2012 | BMI | Presented as mean and SD at baseline and follow‐up, but no mean change | Yes | No response | Data not reported |
| Lin 2010 | Energy intake | 'Amount of each meal consumed' was reported as % eaten | Yes | No response | Data reported in structured narrative summary |
| Weight | Reported as mean and SD pre and post intervention/control | Yes, to request mean change | No response | Calculated mean change, and imputed the SD of change from Salva 2011 | |
| BMI | Reported as mean and SD pre and post intervention/control | Yes, to request mean change | No response | Calculated mean change, and imputed the SD of change from Salva 2011 | |
| Olofsson 2007 | Weight | Reported as mean and SD pre and post intervention/control | Yes, to request mean change and SD | Data provided | Data reported in structured narrative summary |
| BMI | Reported as mean and SD pre and post intervention/control | Yes, to request mean change and SD | Data provided | Data reported in structured narrative summary | |
| Complications | Reported as no. falls in men and women | Yes, to request total complications per group | Data provided | Data reported in structured narrative summary | |
| Pivi 2011 | Weight | Reported as mean and SD pre and post intervention/control | Yes, to request mean change | No response | Calculated mean change, and imputed the SD of change using the P value |
| BMI | Reported as mean and SD pre and post intervention/control | Yes, to request mean change | No response | Calculated mean change, and imputed the SD of change from Salva 2011 | |
| TSF | Reported as mean and SD pre and post intervention/control | Yes, to request mean change | No response | Calculated mean change, and imputed the SD of change from Salva 2011 | |
| MAC | Reported as mean and SD pre and post intervention/control | Yes, to request mean change | No response | Calculated mean change, and imputed the SD of change | |
| Salva 2011 | MAC | Methodology reported this was an outcome measured, but not reported in results | Yes | No response | Data not used |
| Costs | Described as data to be collected, but reported that analysis was not undertaken | No | Not reported | ||
| Splett 2003 | Intake | Food intake is documented as a nutrition assessment activity | Yes, to request mean energy intake per group | Unable to provide data | Not reported |
| Weight | Methodology reports this was an outcome measured, but reported in a format not usable | Yes | Unable to provide data | Not reported | |
| 2. Feeding environment | |||||
| Brouilette 1991 | Energy | Reported pre and post intervention data, but no SD of change | No, as no author contact details and study published in 1991 | N/A | Imputed the SD from Nijs 2006 |
| Van Ort 1995 | Weight change | No figures reported | Yes, to request data on mean and SD of change for each group | Waiting response | Not used |
| Intervention group clarification | Were the behavioural and contextual intervention received at the same time | Yes, to request this detail | Waiting response | Assumed the two interventions were given at the same time | |
| 3. Meal modification | |||||
| Bouillanne 2013 | Weight | Did not report weight, but assumed they had the data as Full Body Composition was used | Yes, to request data | Data provided | Data reported |
| Energy intake | Reported as kcal/kg/day | Yes, to request data | Data provided | Data reported | |
| Hand grip strength | Reported data as mean/median and 95% CI of the median | Yes, to request data | Provided mean and SD of change | Data reported | |
| ADL | Reported data as mean/median and 95% CI of the median | Yes, to request data | Data provided | Data reported | |
| Castellanos 2009 | Energy intake | Results were not analysed according to groups randomised, but regrouped subjects into small eaters and large eaters | Yes, to ask for data on mean and SD of change for each group | No response | Data reported |
| Germain 2006 | BMI | They reported the mean BMI rather than mean change | Yes, for mean and SD of change | Data provided | Data reported |
| Smolliner 2008 | Weight change | Reported mean and SD at baseline and end of intervention | Yes, for mean change and SD | Data provided | Data reported |
| BMI | Reported mean and SD at baseline and end of intervention | Yes, for mean change and SD | Data provided | Data reported | |
| Handgrip strength | Reported mean and SD at baseline and end of intervention | Yes, for mean change and SD | Data provided | Data reported | |
| health‐related quality of life | Reported mean and SD at baseline and end of intervention | Yes, for mean change and SD | Data provided | Data reported | |
| 4. Supplementation of meals | |||||
| Beck 2002 | Weight | Reported as median change with 95% CI | Yes, for mean change and SD | Response received but data not available | Data reported in structured narrative summary |
| Energy intake | Reported as median change with 95% CI | Yes, for mean change and SD | Response received but data not available | Data reported in structured narrative summary | |
| Bourdel‐ Marchasson 2000 | Pressure ulcers | Data given as percentage per group | Yes, for number per group | Data provided | Data reported in structured narrative summary |
| Weight | Data given for baseline only | Yes, for change in weight from baseline to follow‐up | Yes, author stated she did not find the analysis of discharge weight, probably due to the low quality of this data (too many missing data) | Data not reported | |
| Dennis 2005 | Complications | Data given as percentages | Yes for data on total complications per group | Data provided | Data reported in structured narrative summary |
| Health‐related quality of life score | Differences between means provided | Yes, to request mean and SD of changes | Unable to provide data, as EuroQol was only measured at follow‐up | Data reported in structured narrative summary | |
| Faxen‐Irving 2011 | Energy intake | Data given in a graph, no numbers available | Yes, for mean and SD of change in energy intake, between the control and intervention groups from baseline to the 2nd registration | Data provided | Data reported in structured narrative summary |
| Length of stay | Data provided at baseline, not follow‐up | Yes, for mean and SD | Data provided | Data reported in structured narrative summary | |
| Infection | Data provided at baseline, not follow‐up | Yes, for mean and SD | Unable to provide data | Data not reported | |
| BMI | Data provided at baseline, not follow‐up | Yes, for mean and SD | Data provided | Not reported in the summary because few studies measured this outcome | |
| ADL | Data provided at baseline, not follow‐up | Yes, for mean and SD | Data provided | Not reported in the summary because few studies measured this outcome | |
| Hankey 1993 | Weight | Presented in graphs, no numbers given | Yes, for mean and SD | Unable to provide data but suggested using data from the review by Milne 2009 which included these data | Data obtained from systematic review by Milne 2009 |
| MAC | Presented in graphs, no numbers given | Yes, for mean and SD | Unable to provide data but suggested using data from the review by Milne 2009 which included these data | Data obtained from systematic review by Milne 2009 but not reported as few studies measured this outcome | |
| TSF | Presented in graphs, no numbers given | Yes, for mean and SD | Unable to provide data but suggested using data from the review by Milne 2009 which included these data | Not reported in the summary because few studies measured this outcome | |
| Energy and protein intake | Presented in graphs, no numbers given | Yes, for mean and SD | Unable to provide data | Data not reported | |
| Larsson 1990 | Energy intake | Data included in Modified Norton Scale | Yes, data for change in energy intake between groups (mean and SD) | No response | Data not reported |
| Weight | Data provided as ‘weight index’ | Yes, for change in weight between groups (mean and SD) | No response | Data not reported | |
| TSF | Data provided as differences between men and women, and non‐PEM and PEM groups | Yes, for change between groups (mean and SD) | No response | Data not reported | |
| MAC | Data provided as differences between men and women, and non‐PEM and PEM groups | Yes, for change between groups (mean and SD) | No response | Data not reported | |
| Length of stay | Not given | Yes, for mean and SD between groups | No response | Data not reported | |
| Total number of eligible participants | Unclear across all 4 duplicates of this study | Yes, for a clear number of randomised participants, no finishing study, and deaths | No response | Data not reported | |
| Potter 2001 | Length of stay | Provided as median with a range | Yes, for mean and SD between groups | No response | Data reported in structured narrative summary |
| ADL | Stated as an outcome measure in methodology, then not reported in results | Yes, for mean and SD between groups | No response | Not reported in the summary because few studies measured this outcome | |
| BMI | Stated as an outcome measure in methodology, then not reported in results | Yes, for mean and SD between groups | No response | Not reported in the summary because few studies measured this outcome | |
| TSF | Stated as an outcome measure in methodology, then not reported in results | Yes, for mean and SD between groups | No response | Not reported in the summary because few studies measured this outcome | |
| Simmons 2008 | Weight | Data presented as phase 1 and 2 cross‐over combined. The data from phase 1 was needed for this review | Yes, for the phase 1 data | Yes, responded but unable to provide data | Data reported in structured narrative summary |
| BMI | Data presented as phase 1 and 2 cross‐over combined. The data from phase 1 was needed for this review | Yes, for the phase 1 data | Yes, responded but unable to provide data | Not reported in the summary because few studies measured this outcome | |
| Energy intake | Presented as pre‐ and post intervention | Yes, for mean and SD of change | Yes, responded but unable to provide data | Imputed SD from Nijs 2006 | |
| Simmons 2010 | Energy | Reported as mean difference without the SD | Yes, requested SD for mean change | Yes, responded but unable to provide data | Imputed SD from Nijs 2006 |
| 5. Home meal delivery systems | |||||
| Kretser 2003 | Weight | Reported separately for participants at risk of malnutrition, and those malnourished | No, failed to find contact information for the author | N/A | Combined the mean change data using the formulae for combining groups |
| ADL: activities of daily living; BMI: body mass index; CI: confidence interval; EuroQol: European Quality of Life Scale; IQR: interquartile range; MAC: midarm muscle circumference; N/A: not applicable; PEM: protein‐energy malnutrition; SD: standard deviation; SGA: subjective global assessment; TSF: triceps skinfold thickness | |||||
| Setting | No. participants | No. studies |
| Hospital | 7591/10,681 (71.1) | 15 |
| Residential care home | 1731/10,681 (16.2) | 21 |
| Free‐living/outpatient setting | 1305/10,681 (12.2) | 5 |
| Outcome | (N) | Results | P Value | ||
| Intervention | Control | ||||
| Dietetic assistants (Hospital) | |||||
| Duncan 2006 | Mean (SD) energy intake (kcal/day) | 275 (total N = 302) | 1105 (361) | 756 (399) | < 0.001 |
| Hickson 2004 | Between‐group difference (kcal) | 37 (total N = 592) | 89 | 0.538 | |
| Specialist training (residential care settings) | |||||
| Chang 2005 | % (SD) meals consumed | 67 | Pre: 90 % (22) Post: 85 (25) | Pre: 78 % (34) Post: 94 % (18) | 0.49 |
| Lin 2010 | % (SD) meals consumed | 85 | Spaced retrieval (SR) Pre: 85 % (11) Post: 91 % (9) Montessori (MON) Pre: 75 % (23) Post 78 % (10) | Pre: 79 % (19) Post: 88 % (18) | SR vs control = NS MON vs control < 0.05 |
| Multi‐disciplinary team (hospital) | |||||
| Johansen 2004 | kcal/kg body weight per day (SE) | 202 (total N = 212) | 30 (SE 1) | 25 (SE 1) | < 0.005 |
| kcal: kilocalorie; SD: standard deviation; SE: standard error | |||||
| Outcome | (N) | Results | P Value | ||
| Intervention | Control | ||||
| Patient satisfaction | |||||
| Dietetic assistants (hospital) | |||||
| Duncan 2006 | Median score (IQR) | 159 | 6.5 (2) | 3.0 (4) | 0.0001 |
| Health‐related quality of life | |||||
| Multi‐disciplinary team (hospital) | |||||
| Johansen 2004 | Change in physical score (SF‐36) | 110 | 2.4 (1.3) | 0.2 (1.5) | NS |
| Change in mental score (SF‐36) | 110 | 2.2 (2.5) | 3.3 (2) | NS | |
| Number of complications | |||||
| Dietetic assistants (hospital) | |||||
| Duncan 2006 | Total number of participants with complications | 302 | 84/125 (67%) | 79/130 (61%) | 0.29 |
| Hickson 2004 | Number of participants receiving oral antibiotics | 592 | 142/292 (49%) | 150/300 (50%) | 0.67 |
| Multi‐disciplinary team (hospital) | |||||
| Johansen 2004 | Total number of participants with complications | 212 | 34/108 (31%) | 23/104 22%) | NS |
| Olofsson 2007 | Total number of participants with complications | 157 | 81/83 (98%) | 74/74 (100%) | |
| IQR: interquartile range; NS: not significant; SF‐36: short form‐36 | |||||
| Outcome | (N) | Results | P Value | ||
| Intervention | Control | ||||
| Dietetic assistants (hospital) | |||||
| Duncan 2006 | Mean change (SD) Weight (kg) MAC (cm) TSF (mm) | (total N = 302) 170 230 205 | ‐0.36 (3.3) ‐0.9 (2.2) ‐0.88 (2.6) | ‐1.0 (2.8) ‐1.3 (1.5) ‐1.23 (3.2) | 0.16 0.002 0.087 |
| Hickson 2004 | Mean change (SD) Weight (kg) MAC (cm) TSF (mm) Median (IQR) MAMC BMI (kg/m²) | (total N = 592) 191 286 279 429 254 | ‐0.92 (2.71) ‐0.3 (1) ‐0.4 (1.8) ‐0.1 (‐0.8‐0.4) ‐0.04 (1.1) | ‐0.9 (3) ‐0.3 (1) ‐0.4 (1.7) ‐0.1 (‐0.5‐0.3) ‐0.25 (1.18) | 0.23 0.65 0.86 0.84 0.68 |
| Specialist training (residential care settings) | |||||
| Lin 2010 | Mean change (SD) Weight (kg) BMI (kg/m²) | 85 | Spaced retrieval ‐0.07 (0.57) Montessori ‐0.15 (0.57) Spaced retrieval 0.1 (1.0) Montessori ‐0.06 (1.0) | ‐0.09 (0.57) ‐0.03 (1) | NS NS |
| Lin 2011 | BMI | 29 | ‐0.26 (0.73) | ‐0.09 (0.85) | 0.245 |
| Specialist training (free‐living individuals) | |||||
| Pivi 2011 | Mean change (SD) Weight (kg) MAC (cm) TSF (mm) BMI (kg/m²) | 52 | 1.19 (imputed SD: 3.3) 1.87 (2) 2.3 (5.4) 1.19 (1) | ‐2.2 (imputed SD: 3.3) ‐0.4 (0.46) 2.2 (5.3) ‐2.21 (1) | Reported as between‐group differences for 4 groups |
| Salva 2011 | Mean change (SD) Weight (kg) BMI (kg/m²) | 946 | 0.26 (0.7) ‐0.01 (2.2) | 0.09 (0.5) ‐0.06 (3.2) | 0.598 0.843 |
| Multi‐disciplinary team (hospital) | |||||
| Johansen 2004 | Mean change (SD) Weight (kg) | (total N = 212) 95 | ‐0.22 (3.9) | 0.1 (2) | NS |
| Olofsson 2007 | Mean change (SD) Weight (kg) BMI (kg/m²) | (total N = 199) 157 157 | ‐1.1 (3.6) ‐0.45 (1.3) | ‐0.7 (3.8) ‐0.3 (1.5) | 0.05 0.05 |
| Protocol‐driven pathway (hospital) | |||||
| Holyday 2012 | Mean change (SD) Weight (kg) | (total N = 143) 69 | ‐0.9 (3.6) | ‐0.9 (2.3) | 0.98 |
| Protocol‐driven pathway (residential care settings) | |||||
| Splett 2003 | Weight | 364 | No wt loss at baseline: 95% maintained wt. Wt loss at baseline: 48% maintained or gained wt. | No wt loss at baseline: 58% maintained wt. Wt loss at baseline: 57% maintained or gained wt. | |
| Telemedicine (free‐living individuals) | |||||
| Kraft 2012 | Mean change (SD) Weight (kg) BMI (kg/m²) | 26 14 | ‐4.5 (7.9) Baseline 24.5 (5.1) Follow‐up 23.0 (4.2) | ‐3 (6.2) Baseline 23.9 (4.4) Follow‐up 22.8 (4.3) | NS NS |
| BMI: body mass index; IQR: interquartile range; MAC: mid‐arm circumference; MAMC: mid‐arm muscle circumference; NS: not significant; SD: standard deviation; TSF: triceps skinfold thickness; wt: weight | |||||
| Outcome | (N) | Results | P Value | ||
| Intervention | Control | ||||
| Handgrip strength | |||||
| Dietetic assistants (Hospital) | |||||
| Duncan 2006 | Mean change (SD) | 126 (total N = 302) | 2.2 (10.7) | 0.16 (11.8) | 0.32 |
| Hickson 2004 | Median change (IQR) (kg) | (total N = 592) | 0.8 (‐1.4 to 2.5) | 0.7 (‐1.5 to 3) | 0.85 |
| IQR: interquartile range; SD: standard deviation | |||||
| Outcome | (N) | Results | P Value | ||
| Intervention | Control | ||||
| Mortality | |||||
| Dietetic assistants (Hospital) | |||||
| Duncan 2006 | 4‐month mortality | (total N = 302) | 19/145 (13%) | 36/157 (23%) | 0.036 |
| Hickson 2004 | In‐hospital mortality | (total N = 592) | 31/292 (11%) | 35/300 (12%) | 0.69 |
| Specialist training (free‐living individuals) | |||||
| Salva 2011 | 12‐month mortality | 946 | 43/448 (10%) | 29/498 (6%) | NR |
| Multi‐disciplinary team (hospital) | |||||
| Olofsson 2007 | 4‐month mortality | 199 | 9/102 (9%) | 13/97 (13%) | NR |
| Protocol‐driven pathway (hospital) | |||||
| Holyday 2012 | Not reported | 143 | 1/72 (1%) | 4/71 (6%) | 0.21 |
| Length of stay in hospital | |||||
| Dietetic assistants (hospital) | |||||
| Duncan 2006 | Median (IQR) (days) | 167 | 34 (48) | 32 (49) | 0.81 |
| Hickson 2004 | Median (IQR) (days) | 592 | 21(13‐36) | 23(14‐39) | 0.41 |
| Multi‐disciplinary team (hospital) | |||||
| Johansen 2004 | Mean (SD) LOS to 28 days | 197 | 11.6 (8) | 11.5( 8) | NS |
| Olofsson 2007 | Mean (SD) (days) | 157 | 27.4 (15.9) | 39.8 (41.9) | < 0.05 |
| Protocol‐driven pathway (hospital) | |||||
| Holyday 2012 | Mean (SD) (days) | 143 | 13.7 (11.8) | 13.5 (11) | 0.85 |
| Hospital readmissions | |||||
| Protocol‐driven pathway (hospital) | |||||
| Holyday 2012 | Number of readmissions at 6 months | 30/71 | 37/72 | NR | |
| IQR: interquartile range; LOS: length of stay; SD: standard deviation | |||||
| Outcome | (N) | Results | P Value | |||
| Intervention | Control | |||||
| Changes to the dining room environment | ||||||
| Mathey 2001 | Mean change (SD) energy intake (kcal) | 22 | 199 (406) | 185( 247) | NR | |
| Nijs 2006 | Mean change (SD) energy intake (kcal) | 178 | 116 (456) | ‐100 (357) | ||
| Mean difference (95% CI) | 178 | 235 (83‐268) | Described as significantly different but no P value reported | |||
| Remsburg 2001 | NR | |||||
| Sensory stimulation | ||||||
| Brouillette 1991 | Mean change (SD) in intake of lunch meal (kcal) | 16 | ‐1.6 (450) | 11.14 (360) | 0.49 | |
| CI: confidence interval; NR: not reported; SD: standard deviation | ||||||
| Outcome | (N) | Results | P Value | ||
| Intervention | Control | ||||
| Changes to the dining room environment | |||||
| Mathey 2001a | Sickness Impact Profile, mean change (SD) in score | 16/2 | ‐2 (11) | ‐13 (12) | NR |
| Nijs 2006 | Overall QOL mean change (95% CI) in score | 178 | 0.4 (‐1.8 to 2.5) | ‐5 (‐9.4 to ‐0.6) | NR |
| Mean difference (95% CI) | 178 | 6.1 (2.1 to 10.3) | Described as significantly different but no P value reported | ||
| Physical performance, mean change (95% CI) in score | 178 | 0.2 (‐2.3 to 2.7) | ‐2.2 (‐4.1 to ‐0.4) | NR | |
| Mean difference (95% CI) | 178 | 3.2 0.9 to 5.5) | Described as significantly different but no P value reported | ||
| CI: confidence interval; NR: not reported; QOL: quality of life; SD: standard deviation | |||||
| Outcome | (N) | Results | P Value | ||
| Intervention | Control | ||||
| Weight | |||||
| Changes to the dining room environment | |||||
| Mathey 2001a | Mean change (SD) (kg) | 22 | 3.3 (5) | ‐0.4 (4) | I: < 0.05; C: 0.78 |
| Nijs 2006 | Mean change (SD) (kg) | 178 | 0.5 (3.9) | ‐1.1 (3.7) | NR |
| Mean difference (95% CI) | 178 | 1.5 (0.6 to 2.4) | Described as significantly different but no P value reported | ||
| Remsburg 2001 | Mean change (SD) (kg) | 39 | ‐0.11 (3.1) | 0.32 (2.2) | 0.638 |
| C: control; I: intervention; NR: not recorded; SD: standard deviation | |||||
| Outcome | (N) | Results | P Value | ||
| Intervention | Control | ||||
| Changes to the dining room environment | |||||
| Mathey 2001a | Mortality | 38 | 7/21 (33%) | 5/17 (29%) | NR |
| Nijs 2006 | Mortality | 178 | 18/112 (16%) | 16/133 (12%) | NR |
| Sensory stimulation | |||||
| Brouillette 1991 | Mortality | 20 | 1/10 (10%) | 0/10 (0%) | NR |
| NR: not reported | |||||
| Outcome | (N) | Results | P Value | ||||
| Intervention | Control | ||||||
| Fortification of food (studies in hospital) | |||||||
| Barton 2000 | Total energy intake (kcal/d) | 36 | 1711 (195) | 1425 (136) | < 0.001 | ||
| Munk 2014 | Mean (SD) intake (kj/d) | 81 | 5843 (1660) | 5149 (1832) | |||
| Mean (95% CI) difference between groups | 693 (‐80 to 1466) | 0.08 | |||||
| Fortification of food (studies in residential care homes) | |||||||
| Leslie 2012 | mean (SEM) change in energy intake (baseline to week 12) (kcal/d) | 16 | 133 (89) | ‐36 (84) | 0.154 | ||
| Food fortification (studies in free‐living individuals) | |||||||
| Silver 2008 | Total energy intake (kcal/d) | 45 | 1876 (543) | 1423 (422) | < 0.001 | ||
| Modifications to meal composition (studies in intermediate care) | |||||||
| Bouillane 2013 | Change in energy intake (kcal) | 63 | 50.9 (458) | 39.2 (401) | NR | ||
| Modifications to meal delivery (studies in residential care homes) | |||||||
| Germain 2006 | Change in energy intake (kcal) | 15 | 611 (408) | 81 (169) | 0.03 | ||
| Taylor 2006 | Total energy intake (kcal/d) | 31 | 1342 (177) | 1325 (207) | 0.565 | ||
| Modifications to flavour (studies in residential care homes) | |||||||
| Essed 2007 | Change in energy intake (kcal) | 83 | Flavour: ‐17 (445) Flavour + MSG: 78 (352) MSG: ‐32 (28) | 102 (452) | NR | ||
| Essed 2009 | Energy intake from modified meal (kcal) | 53 | 420 (211) | 424 (216) | 0.896 | ||
| Mathey 2001b | Change in energy intake (kcal) | 67 | ‐50 (267) | ‐115 (298) | Baseline to end of intervention I: NR, C: < 0.05 | ||
| C: control; I: intervention; MSG: monosodium glutamate; NR: not recorded; SD standard deviation; SEM standard error of the mean; CI confidence interval | |||||||
| Outcome | (N) | Results | P Value | ||
| Intervention | Control | ||||
| Weight and BMI (mean change (SD)) | |||||
| Fortification of food (studies in hospital) | |||||
| Munk 2014 | Mean (SD) within‐group change in weight (kg) | 66 | 0.4 (2.6) | ‐0.4 (1.8) | 0.17 |
| Mean (95% CI) between‐group difference in weight (kg) | ‐0.8 (‐1.9 to 0.3) | ||||
| Fortification of food (studies in residential care homes) | |||||
| Leslie 2012 | Mean (SD) within‐group weight change (kg) | 31 | 1.3 (0.53)* | ‐0.2 (1.5)** | *0.03 **0.536 |
| Mean (SD) within‐group change in BMI (kg/m2) | 31 | 0.5 (0.25)* | ‐0.1 (0.4)** | *0.042 **0.517 | |
| Mean (SD) within‐group change in MUAC (mm) | 32 | 0.4 (0.16)* | ‐0.1 (0.3)** | *0.019 **0.691 | |
| Smolliner 2008 | Mean (SD) change weight (kg) | 52 | 2 (2.1) | 1.6 (2) | NS |
| BMI change (kg/m²) | 52 | 0.77 (1.5) | 0.45 (1.1) | Between‐group difference NS | |
| Modifications to meal composition (studies in intermediate care) | |||||
| Bouillanne 2013 | Mean (SD) change weight (kg) | 63 | 0.4 (2.3) | ‐0.7 (3.1) | NR |
| Modifications to meal delivery (studies in residential care homes) | |||||
| Germain 2006 | Mean (SD) change weight (kg) | 15 | 3.9 (2.3) | ‐0.8 (4.2) | 0.02 |
| BMI change (kg/m²) | 15 | 1.51 (1.16) | 0.27 (1.46) | Data provided by study author P value NR | |
| Modifications to flavour (studies in residential care homes) | |||||
| Essed 2007 | Mean (SD) change weight (kg) | 83 | Flavour: 0.1 (2.4) Flavour + MSG: ‐ 0.8 (3.3) MSG: ‐ 0.7 (3.6) | 0.1 (3.8) | NR |
| Mathey 2001b | Mean (SD) change weight (kg) | 67 | 1.1 (1.3) | ‐0.3 (1.6) | < 0.05 |
| BMI: body mass index; CI: confidence interval; MSG: monosodium glutamate; MUAC: mid‐upper arm circumference; NR: not reported; NS: not significant; SD: standard deviation | |||||
| Outcome | (N) | Results | P Value | ||
| Intervention | Control | ||||
| Mortality | |||||
| Fortification of food (studies in hospital) | |||||
| Munk 2014 | Mortality | 81 | 1/44 | 1/40 | NR |
| Fortification of food (studies in residential care homes) | |||||
| Leslie 2012 | Mortality | 32 | 2/19 | 5/22 | NR |
| Smolliner 2008 | Mortality | 65 | 2/31 | 1/34 | NR |
| Modifications to meal composition (studies in intermediate care) | |||||
| Bouillane 2013 | Mortality | 66 | 1/30 (3%) | 1/36 (3%) | NR |
| Length of hospital stay | |||||
| Fortification of food (studies in hospital) | |||||
| Munk 2014 | Days from study inclusion to discharge | 81 | 10 (8) | 10 (8) | 0.73 |
| Handgrip strength | |||||
| Fortification of food (studies in hospital) | |||||
| Munk 2014 | Mean change (SD) baseline to day 3 (kg) | 76 | ‐0.1 (2.9) | ‐0.4 (4.3) | 0.76 |
| Mean difference (95% CI) between I & C | ‐0.3 (‐1.9 to ‐1.4) | 0.95 | |||
| Fortification of food (studies in residential care homes) | |||||
| Smolliner 2008 | Mean change (SD) (kg) | 61 | ‐0.81 (3.12) | ‐1.29 (3) | NR |
| Modifications to meal composition (studies in intermediate care) | |||||
| Bouillane 2013 | Mean change (SD) (N) | 63 | ‐0.5 (41.7) | 14 (45.1) | 0.411 (ANCOVA 0.271) |
| Bouillane 2013 | Change in ADL score (mean (SD) | 63 | ‐0.02 (1.6) | 0.54 (1.7) | 0.125 (ANCOVA 0.118) |
| ADL: activities of daily living; ANCOVA: analysis of covariance; N: Newtons; NR: not reported; SD: standard deviation I: intervention; C: control | |||||
| Outcome | (N) | Results | P Value | ||
| Intervention | Control | ||||
| Supplementation with food (residential care homes) | |||||
| Beck 2002 | Change in energy intake (kcal/d) (median 95% CI) | 16 | ‐24 (‐454 to 860) | 24 (‐167 to 478) | NS |
| Simmons 2008 | Change in energy intake kcal/ (mean SD) | 64 | 302 (450) | 127 (360) | Baseline to 6 months I: = 0.000; C: NS |
| Simmons 2010 | Change in energy intake (mean SD) | 43 | ‐65 (450) | 67 (360) | NS |
| Supplementation with ONS (in hospital) (reported as mean (SD) | |||||
| Bourdel‐Marchasson 2000 | Total energy intake (kcal/d) | 672 | 1188 (613) | 1102 (503) | 0.13 |
| Faxen‐Irving 2011 | Change in energy intake (kcal/d) | 38 | 94 (350) | 6.5 (358) | NR |
| Potter 2001 | Total energy intake (kcal/d) | 381 | 1409 (448) | 1090 (417) | S |
| Van den Berg 2015 | Mean (SD) energy intake from ONS (kcal/d) | 192 | I1:343 (172)* I2: 469 (111)** | 389 (162) | *0.289 **0.006 |
| Supplementation with ONS (long‐term/residential care settings) | |||||
| Hankey 1993 | Total energy intake (kcal/d) | 21 | 1747 (273) | 1147 (310) | Baseline to wk 8, I: 0.01; C: NS |
| Simmons 2010 | Change in energy intake | 42 | 28 (450) | 67 (360) | 0.14 |
| C: control; CI: confidence interval; I: intervention; NS: not significant; NR: not reported; ONS: oral nutritional supplement; S: significant; SD: standard deviation; wk: week | |||||
| Outcome | (N) | Results | P Value | ||
| Intervention | Control | ||||
| Incidence of pressure ulcers | |||||
| Supplementation with ONS (in hospital) | |||||
| Bourdel‐Marchasson 2000 | Cumulative incidence at end of follow‐up (%) Number of participants with pressure ulcers at day 15 | 672 | 40 101/295 | 48 164/37 | NR NR |
| Dennis 2005 | Number of participants with pressure ulcers | 4023 | 15/2016 | 26/2007 | 0.0507 |
| Total complications | |||||
| Supplementation with ONS (in hospital) | |||||
| Dennis 2005 | All in‐hospital complications | 4023 | 515/2014 (26%) | 448/2001 (22%) | NR |
| Health‐related quality of life | |||||
| Supplementation with ONS (in hospital) | |||||
| Dennis 2005 | Utilitiy (median (IQR)) (EUROQoL) | 3086 | Median group difference 0.52 (0.03 to 0.74) | 0.96 | |
| EUROQol: European Quality of Life Scale; IQR: interquartile range; NR: not reported; ONS: oral nutritional supplement | |||||
| Outcome | (N) | Results | P Value | ||
| Intervention | Control | ||||
| Supplementation with food (residential care homes) | |||||
| Beck 2002 | Change in weight (median 95% CI) | 16 | 1.3 (‐1 to 3) | 1.5 (‐2.3 to 9) | NS |
| Simmonds 2008 | Mean change (SD) weight (kg) Mean (SD) change in BMI | 64 | The intervention group gained 4 lbs more The intervention group gained 0.72 kg/m2 than the usual care | NR NR | 0.009 0.009 |
| Simmonds 2010 | Mean change (SD) weight (kg) | 43 | 0.02 (1.1) | 0.21 (1.7) | NS |
| Supplementation with ONS (in hospital) | |||||
| Faxen‐Irving 2011 | Mean change (SD) weight (kg) Mean (SD) BMI at follow‐up (kg/m2) | 38 38 | 0.13 (2.2) 20.4 (3.7) | ‐0.95 (2.3) 20.4 (3.7) 21.9 (3.8) | NR 0.17 |
| Potter 2001 | Mean change in weight (kg) Mean change (SD) MAC (cm) | 381 381 | 0.4 (2.6) ‐0.1 (1.3) | ‐0.5 (2.9) ‐0.4 (1.2) | 0.003 NS |
| Supplementation with ONS (long‐term care settings) | |||||
| Hankey 1993 | Mean change (SD) weight (kg) Mean change (SD) MAC | 21 21 | 2.83 (10) ‐1 (10) | ‐0.53 (10) 0.6 (10) | NR ‐ data from Milne 2009 NR data from Milne 2009 |
| Simmons 2010 | Mean change in weight (kg) | 42 | 0.91 (2.3) | 0.24 (1.96) | NS |
| BMI: body mass index; CI: confidence interval; MAC: mid‐arm circumference; NR: not reported; NS: not significant; ONS: oral nutritional supplement; SD: standard deviation | |||||
| Outcome | (N) | Results | P Value | ||
| Intervention | Control | ||||
| Mortality | |||||
| Supplementation with ONS (in hospital) | |||||
| Bourdel‐Marchasson 2000 | Mortality | 672 | 25/295 (8%) | 22/377 (6%) | 0.18 |
| Dennis 2005 | Mortality | 4023 | 241/2016 (12%) | 253/2007 (13%) | 0.7 |
| Potter 2001 | Mortality | 381 | 21/186 (11%) | 33/195 (17%) | 0.117 |
| Supplementation with ONS (long‐term care settings) | |||||
| Larsson 1990 | Mortality | 435 | 29/197 (15%) | 56/238 (24%) | 0.13 |
| Length of stay | |||||
| Supplementation with ONS (in hospital) | |||||
| Faxen‐Irving 2011 | Length of hospital stay (days) | 51 | 10.5 (SD 5.6) | 10.3 (SD 4.9) | NS |
| Dennis 2005 | Length of hospital stay (days) Median (IQR) | 4023 | 16 (IQR 7–44) | 16 (IQR 7–41) | NS |
| Potter 2001 | Length of hospital stay (median (range)) | 381 | 16 (3‐141) | 18 (2‐76) | 0.31 |
| Van den Berg 2015 | Length of hospital stay (median (range)) | 234 | I1: 10 (3‐63) I2: 10 (3‐27) | 11 (4‐71) | NR |
| Hospital readmissions & discharge destination | |||||
| Supplementation with ONS (in‐hospital) | |||||
| Potter 2001 | Discharge to home Discharge to institution | 381 381 | 131/186 31/186 | 127/195 33/195 | NS |
| Van den Berg 2015 | Hospital readmissions | 246 | I1: 13 I2: 24 | 15 | NR |
| IQR: interquartile range; NR not reported; NS: not significant; ONS: oral nutritional supplement | |||||
| Outcome | (N) | Results | P Value | ||
| Intervention | Control | ||||
| Weight change | |||||
| Kretser 2003 | Mean change in weight (kg) | 163 | 1.86 (5.3) | ‐1,04 (5.2) | 0.0062 |
| Mortality | |||||
| Kretser 2003 | Mortality | 203 | 3/102 (3%) | 9/101 (9%) | NR |
| NR: not reported | |||||
| Outcome or subgroup title | No. of studies | No. of participants | Statistical method | Effect size |
| 1 No. of participants with complications Show forest plot | 5 | 4702 | Risk Ratio (M‐H, Random, 95% CI) | 1.11 [0.86, 1.42] |
| 1.1 Changes to the organisation of nutritional care | 3 | 624 | Risk Ratio (M‐H, Random, 95% CI) | 1.12 [0.76, 1.67] |
| 1.2 Modification of meal profile or pattern | 1 | 63 | Risk Ratio (M‐H, Random, 95% CI) | 0.59 [0.06, 6.14] |
| 1.3 Additional supplementation of meals | 1 | 4015 | Risk Ratio (M‐H, Random, 95% CI) | 1.14 [1.02, 1.28] |
| 2 Nutritional status (weight change) Show forest plot | 17 | 2024 | Mean Difference (IV, Random, 95% CI) | 0.62 [0.21, 1.02] |
| 2.1 Changes to the organisation of nutritional care | 6 | 1140 | Mean Difference (IV, Random, 95% CI) | 0.09 [‐0.26, 0.45] |
| 2.2 Changes to the feeding environment | 1 | 39 | Mean Difference (IV, Random, 95% CI) | ‐0.43 [‐2.11, 1.25] |
| 2.3 Modification of meal profile or pattern | 5 | 253 | Mean Difference (IV, Random, 95% CI) | 1.16 [0.41, 1.92] |
| 2.4 Additional supplementation of meals | 4 | 475 | Mean Difference (IV, Random, 95% CI) | 0.90 [0.41, 1.38] |
| 2.5 Congregate and home meal delivery systems | 1 | 117 | Mean Difference (IV, Random, 95% CI) | 2.90 [1.00, 4.80] |
| 3 Hospitalisation Show forest plot | 5 | 667 | Mean Difference (IV, Random, 95% CI) | ‐0.48 [‐2.56, 1.59] |
| 3.1 Changes to the organisation of nutritional care | 3 | 515 | Mean Difference (IV, Random, 95% CI) | ‐2.08 [‐6.75, 2.58] |
| 3.2 Modification of meal profile or pattern | 1 | 81 | Mean Difference (IV, Random, 95% CI) | 0.0 [‐3.48, 3.48] |
| 3.3 Additional supplementation of meals | 1 | 71 | Mean Difference (IV, Random, 95% CI) | 0.20 [‐2.26, 2.66] |
| 4 All‐cause mortality Show forest plot | 12 | 6683 | Risk Ratio (M‐H, Random, 95% CI) | 0.78 [0.66, 0.92] |
| 4.1 Changes to the organisation of nutritional care | 4 | 1237 | Risk Ratio (M‐H, Random, 95% CI) | 0.71 [0.52, 0.97] |
| 4.2 Changes to the feeding environment | 1 | 20 | Risk Ratio (M‐H, Random, 95% CI) | 3.00 [0.14, 65.90] |
| 4.3 Modification of meal profile or pattern | 2 | 150 | Risk Ratio (M‐H, Random, 95% CI) | 1.04 [0.15, 7.22] |
| 4.4 Additional supplementation of meals | 4 | 5073 | Risk Ratio (M‐H, Random, 95% CI) | 0.77 [0.58, 1.02] |
| 4.5 Congregate and home meal delivery systems | 1 | 203 | Risk Ratio (M‐H, Random, 95% CI) | 0.33 [0.09, 1.18] |